recent trends in securities class action litigation: 2013 ... · recent trends in securities class...
TRANSCRIPT

Recent Trends in Securities Class Action Litigation: 2013 Full-Year Review Large settlements get larger; small settlements get smaller
By Dr. Renzo Comolli and Svetlana Starykh
21 January 2014

2013 Highlights in Filings
• 10% increase in the number of federal securities class actions filed
• Filings in the 9th Circuit back to historical level, after the 2012 trough
• Filings in the 5th Circuit alleging violation of Rule 10b-5 roughly doubled
2013 Highlight in Dismissals and Settlements
• Number of settlements remained close to record low level
• 9 settlements above $100 million drove average settlement up, but smaller cases settled for less
www.nera.com 1
Recent Trends in Securities Class Action Litigation: 2013 Full-Year Review Large settlements get larger; small settlements get smaller
By Dr. Renzo Comolli and Svetlana Starykh1
21 January 2014
Introduction and Summary
Legal developments have dominated the news about federal securities class actions in 2013. Last
February, the Supreme Court decision in Amgen resolved certain questions about materiality but
focused the debate on Basic and the presumption of reliance, which are now back to the Supreme
Court after certiorari was granted for the second time in Halliburton.
Against this legal backdrop, 2013 saw a small increase in the number of complaints filed for
securities class actions in general and for class actions alleging violation of Rule 10b-5 in particular.
Filings in the 5th Circuit doubled, while filings in the 9th Circuit bounced back after having dipped
in 2012.
Settlement activity continued to proceed at a very slow pace after the 2012 record low. But the
2013 settlements include some large ones. Nine settlements passed the $100 million mark, driving
average settlement amounts to record highs never seen before. On the other hand, the median
settlement dropped substantially compared to 2012. In summary, 2013 was a year in which large
settlements got larger and small settlements got smaller.

2 www.nera.com
Trends in Filings2
Number of Cases FiledIn 2013, 234 securities class action were filed in federal court. That level represents a 10% increase
over 2012, and a slight increase compared to the average number of filings in the period 2008-
2012. See Figure 1.
Figure 1. Federal Filings January 1996 – December 2013
IPO Laddering Cases
Cases, Excluding IPO Laddering
132
201
275241 234
198
274237 252
187
132
194
245207
232 225 213234
310
0
50
100
150
200
250
300
350
400
450
500
550
1996 1997 1998 1999 2000 2001 2002 2003 2004 2005 2006 2007 2008 2009 2010 2011 2012 2013
Num
ber
of
Fed
eral
Fili
ng
s
Filing Year
508
277
2008-2012 Average: 224
www.nera.com 3
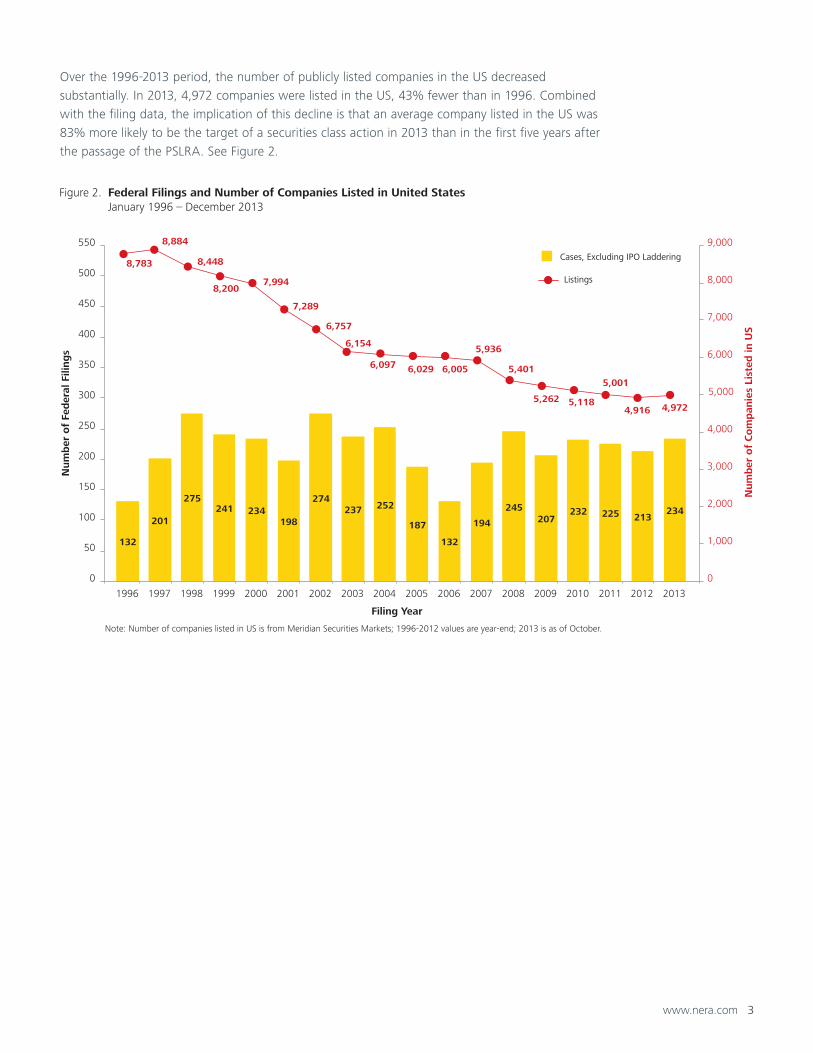
Over the 1996-2013 period, the number of publicly listed companies in the US decreased
substantially. In 2013, 4,972 companies were listed in the US, 43% fewer than in 1996. Combined
with the filing data, the implication of this decline is that an average company listed in the US was
83% more likely to be the target of a securities class action in 2013 than in the first five years after
the passage of the PSLRA. See Figure 2.
Figure 2. Federal Filings and Number of Companies Listed in United States January 1996 – December 2013
Cases, Excluding IPO Laddering
Listings
132
201
275241 234
198
274237 252
187
132
194
245207
232 225 213234
8,783
8,884
8,448
8,200 7,994
7,289
6,757
6,154
6,097 6,029 6,005
5,936
5,401
5,262 5,118
5,001
4,916 4,972
0
1,000
2,000
3,000
4,000
5,000
6,000
7,000
8,000
9,000
0
50
100
150
200
250
300
350
400
450
500
550
1996 1997 1998 1999 2000 2001 2002 2003 2004 2005 2006 2007 2008 2009 2010 2011 2012 2013
Num
ber
of
Co
mp
anie
s Li
sted
in U
S
Num
ber
of
Fed
eral
Fili
ng
s
Filing Year
Note: Number of companies listed in US is from Meridian Securities Markets; 1996-2012 values are year-end; 2013 is as of October.
4 www.nera.com
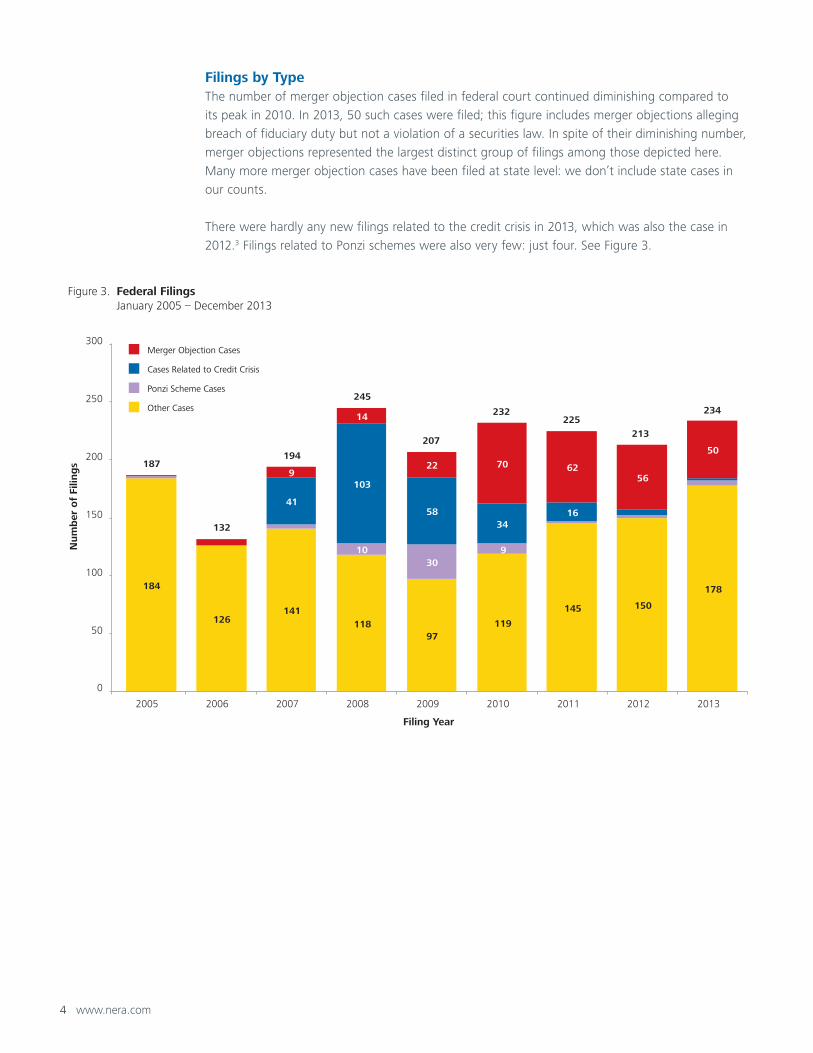
Filings by Type The number of merger objection cases filed in federal court continued diminishing compared to
its peak in 2010. In 2013, 50 such cases were filed; this figure includes merger objections alleging
breach of fiduciary duty but not a violation of a securities law. In spite of their diminishing number,
merger objections represented the largest distinct group of filings among those depicted here.
Many more merger objection cases have been filed at state level: we don’t include state cases in
our counts.
There were hardly any new filings related to the credit crisis in 2013, which was also the case in
2012.3 Filings related to Ponzi schemes were also very few: just four. See Figure 3.
Figure 3. Federal Filings January 2005 – December 2013
Merger Objection Cases
Cases Related to Credit Crisis
Ponzi Scheme Cases
Other Cases
184
126141
11897
119
145 150
178
1030
9
41
103
5834
16
9
14
22 70 6256
50187
132
194
245
207
232225
213
234
50
0
100
150
200
250
300
2005 2006 2007 2008 2009 2010 2011 2012 2013
Num
ber
of
Filin
gs
Filing Year
www.nera.com 5
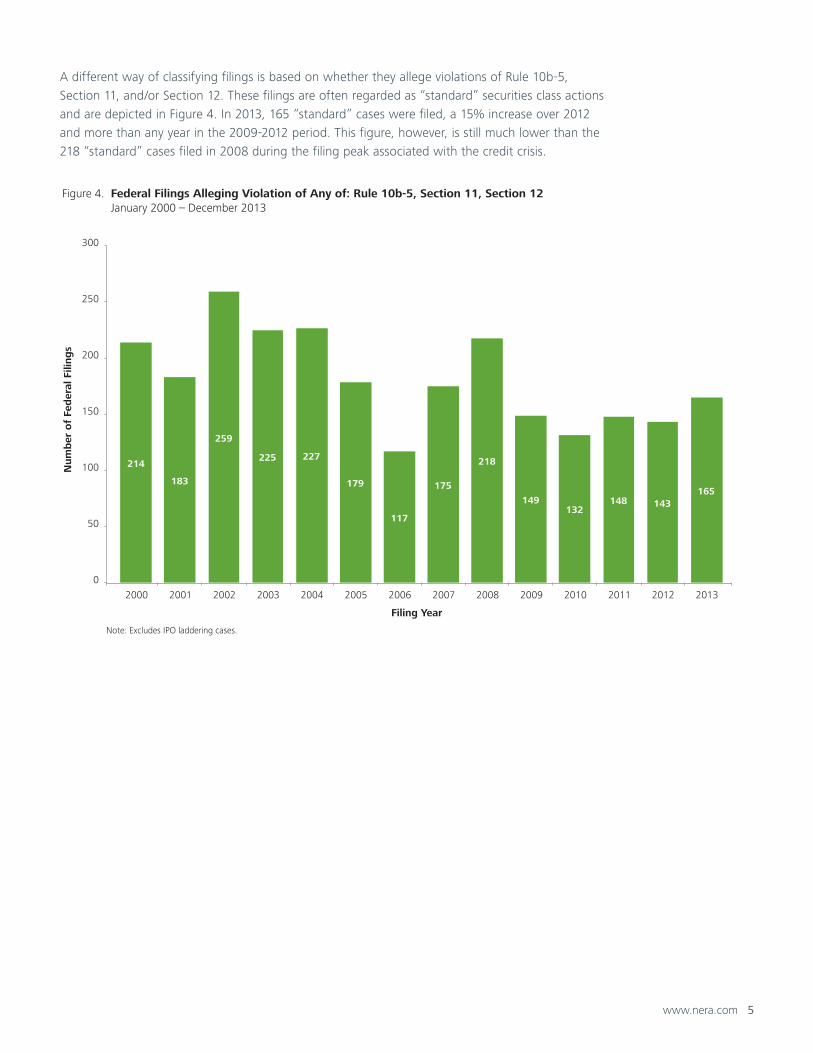
A different way of classifying filings is based on whether they allege violations of Rule 10b-5,
Section 11, and/or Section 12. These filings are often regarded as “standard” securities class actions
and are depicted in Figure 4. In 2013, 165 “standard” cases were filed, a 15% increase over 2012
and more than any year in the 2009-2012 period. This figure, however, is still much lower than the
218 “standard” cases filed in 2008 during the filing peak associated with the credit crisis.
Figure 4. Federal Filings Alleging Violation of Any of: Rule 10b-5, Section 11, Section 12 January 2000 – December 2013
214
183
259
225 227
179
117
175
218
149132
148 143165
0
50
100
150
200
250
300
2000 2001 2002 2003 2004 2005 2006 2007 2008 2009 2010 2011 2012 2013
Num
ber
of
Fed
eral
Fili
ng
s
Filing Year
Note: Excludes IPO laddering cases.
6 www.nera.com
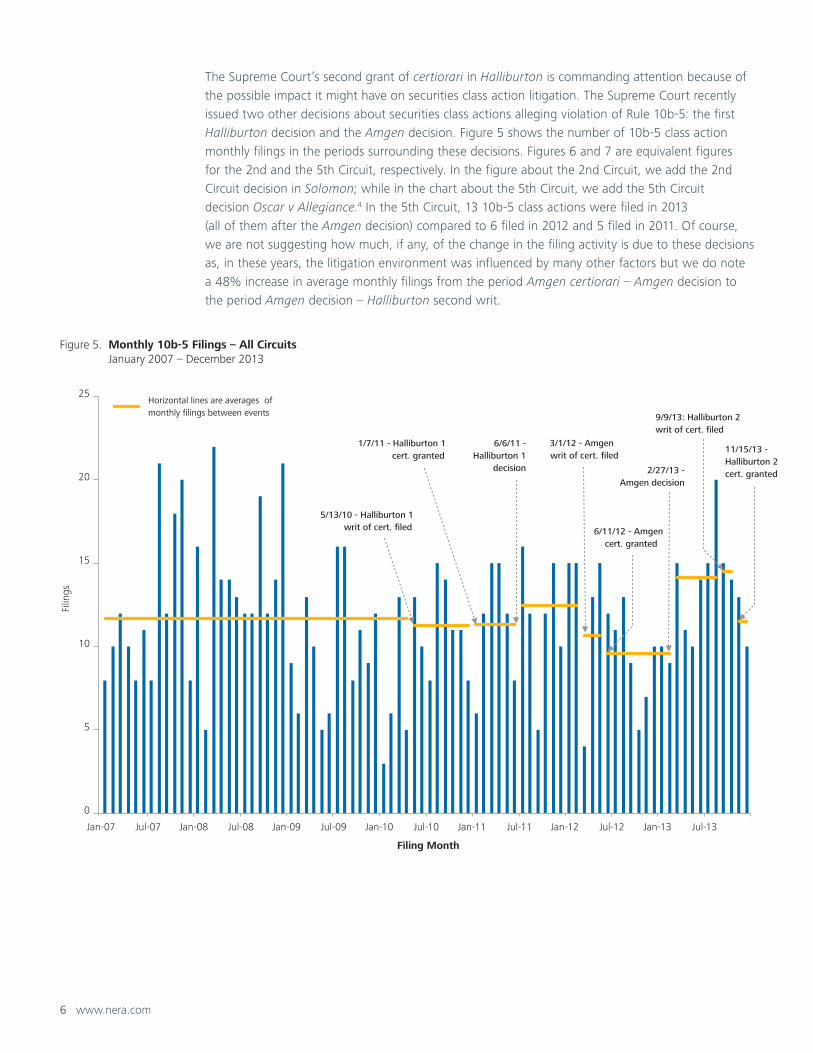
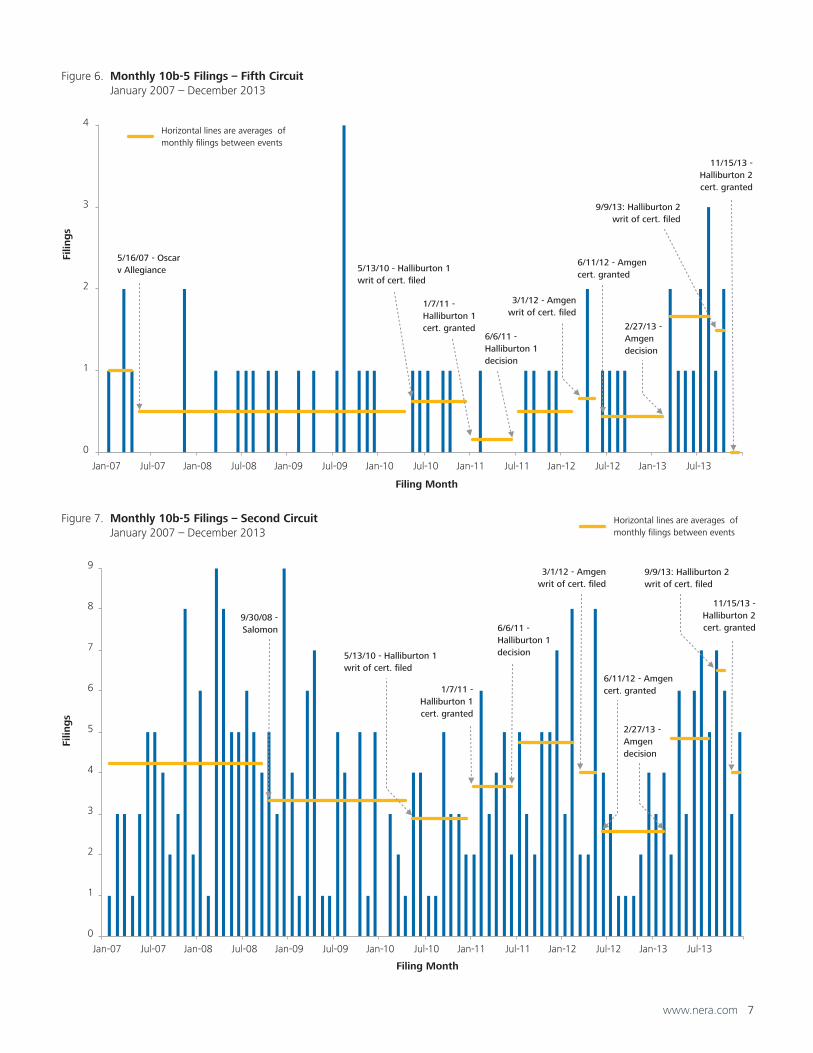
The Supreme Court’s second grant of certiorari in Halliburton is commanding attention because of
the possible impact it might have on securities class action litigation. The Supreme Court recently
issued two other decisions about securities class actions alleging violation of Rule 10b-5: the first
Halliburton decision and the Amgen decision. Figure 5 shows the number of 10b-5 class action
monthly filings in the periods surrounding these decisions. Figures 6 and 7 are equivalent figures
for the 2nd and the 5th Circuit, respectively. In the figure about the 2nd Circuit, we add the 2nd
Circuit decision in Solomon; while in the chart about the 5th Circuit, we add the 5th Circuit
decision Oscar v Allegiance.4 In the 5th Circuit, 13 10b-5 class actions were filed in 2013
(all of them after the Amgen decision) compared to 6 filed in 2012 and 5 filed in 2011. Of course,
we are not suggesting how much, if any, of the change in the filing activity is due to these decisions
as, in these years, the litigation environment was influenced by many other factors but we do note
a 48% increase in average monthly filings from the period Amgen certiorari – Amgen decision to
the period Amgen decision – Halliburton second writ.
Figure 5. Monthly 10b-5 Filings – All Circuits January 2007 – December 2013
0
5
10
15
20
25
Jan-07 Jul-07 Jan-08 Jul-08 Jan-09 Jul-09 Jan-10 Jul-10 Jan-11 Jul-11 Jan-12 Jul-12 Jan-13 Jul-13
Filin
gs
Filing Month
1/7/11 - Halliburton 1cert. granted
3/1/12 - Amgen writ of cert. filed
5/13/10 - Halliburton 1writ of cert. filed
6/6/11 -Halliburton 1
decision
6/11/12 - Amgen cert. granted
2/27/13 - Amgen decision
9/9/13: Halliburton 2 writ of cert. filed
11/15/13 - Halliburton 2 cert. granted
Horizontal lines are averages of monthly filings between events
www.nera.com 7
Figure 6. Monthly 10b-5 Filings – Fifth Circuit January 2007 – December 2013
0
1
2
3
4
Jan-07 Jul-07 Jan-08 Jul-08 Jan-09 Jul-09 Jan-10 Jul-10 Jan-11 Jul-11 Jan-12 Jul-12 Jan-13 Jul-13
Filin
gs
Filing Month
1/7/11 - Halliburton 1 cert. granted
3/1/12 - Amgenwrit of cert. filed
5/13/10 - Halliburton 1 writ of cert. filed
6/6/11 - Halliburton 1 decision
6/11/12 - Amgen cert. granted
2/27/13 - Amgen decision
9/9/13: Halliburton 2writ of cert. filed
11/15/13 -Halliburton 2cert. granted
Horizontal lines are averages of monthly filings between events
5/16/07 - Oscar v Allegiance
Figure 7. Monthly 10b-5 Filings – Second Circuit January 2007 – December 2013
0
1
2
3
4
5
6
7
8
9
Jan-07 Jul-07 Jan-08 Jul-08 Jan-09 Jul-09 Jan-10 Jul-10 Jan-11 Jul-11 Jan-12 Jul-12 Jan-13 Jul-13
Filin
gs
Filing Month
1/7/11 -Halliburton 1cert. granted
3/1/12 - Amgenwrit of cert. filed
5/13/10 - Halliburton 1 writ of cert. filed
6/6/11 - Halliburton 1 decision
6/11/12 - Amgen cert. granted
2/27/13 - Amgen decision
9/9/13: Halliburton 2 writ of cert. filed
11/15/13 -Halliburton 2cert. granted
Horizontal lines are averages of monthly filings between events
9/30/08 -Salomon
8 www.nera.com
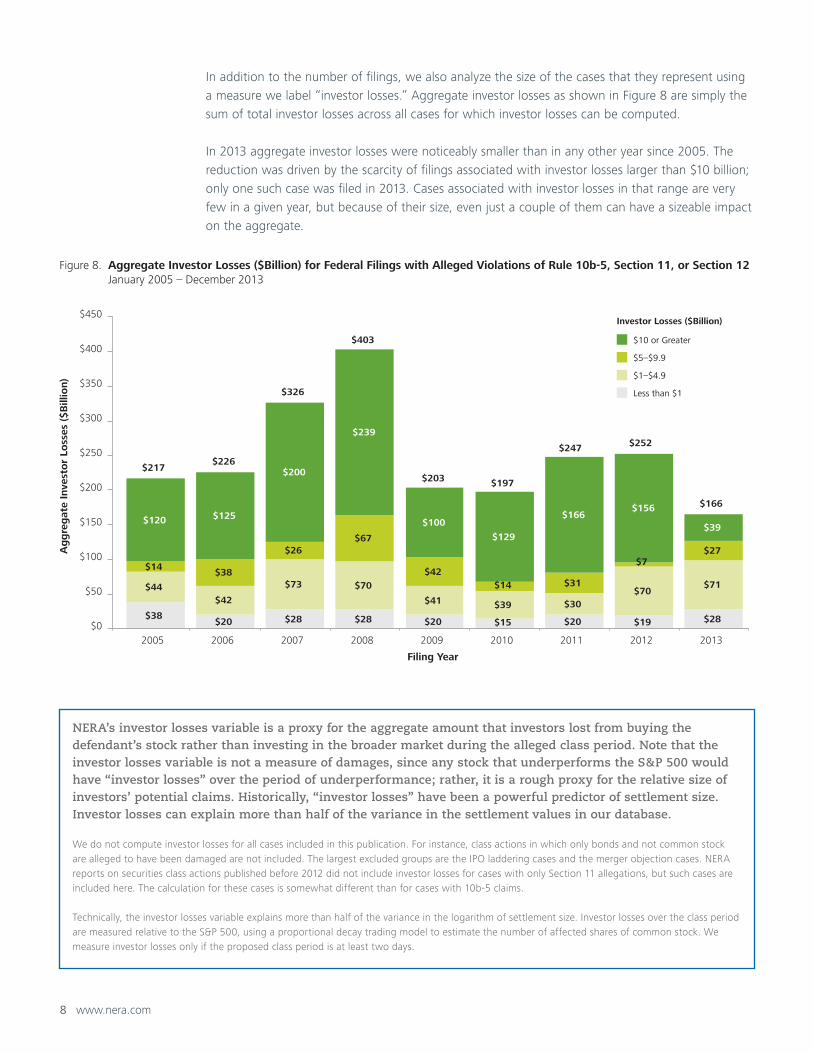
In addition to the number of filings, we also analyze the size of the cases that they represent using
a measure we label “investor losses.” Aggregate investor losses as shown in Figure 8 are simply the
sum of total investor losses across all cases for which investor losses can be computed.
In 2013 aggregate investor losses were noticeably smaller than in any other year since 2005. The
reduction was driven by the scarcity of filings associated with investor losses larger than $10 billion;
only one such case was filed in 2013. Cases associated with investor losses in that range are very
few in a given year, but because of their size, even just a couple of them can have a sizeable impact
on the aggregate.
NERA’s investor losses variable is a proxy for the aggregate amount that investors lost from buying the defendant’s stock rather than investing in the broader market during the alleged class period. Note that the investor losses variable is not a measure of damages, since any stock that underperforms the S&P 500 would have “investor losses” over the period of underperformance; rather, it is a rough proxy for the relative size of investors’ potential claims. Historically, “investor losses” have been a powerful predictor of settlement size. Investor losses can explain more than half of the variance in the settlement values in our database.
We do not compute investor losses for all cases included in this publication. For instance, class actions in which only bonds and not common stock are alleged to have been damaged are not included. The largest excluded groups are the IPO laddering cases and the merger objection cases. NERA reports on securities class actions published before 2012 did not include investor losses for cases with only Section 11 allegations, but such cases are included here. The calculation for these cases is somewhat different than for cases with 10b-5 claims.
Technically, the investor losses variable explains more than half of the variance in the logarithm of settlement size. Investor losses over the class period are measured relative to the S&P 500, using a proportional decay trading model to estimate the number of affected shares of common stock. We measure investor losses only if the proposed class period is at least two days.
Figure 8. Aggregate Investor Losses ($Billion) for Federal Filings with Alleged Violations of Rule 10b-5, Section 11, or Section 12 January 2005 – December 2013
Investor Losses ($Billion)
$10 or Greater
$5–$9.9
$1–$4.9
Less than $1
$38$20 $28 $28 $20 $15 $20 $19 $28
$44$42
$73 $70
$41 $39 $30$70
$71
$14$38
$26$67
$42$14 $31
$7$27
$120 $125
$200
$239
$100
$129
$166$156
$39
$0
$50
$100
$150
$200
$250
$300
$350
$400
$450
2005 2006 2007 2008 2009 2010 2011 2012 2013
Ag
gre
gat
e In
vest
or
Loss
es (
$B
illio
n)
Filing Year
$217$226
$326
$403
$203 $197
$247 $252
$166
www.nera.com 9
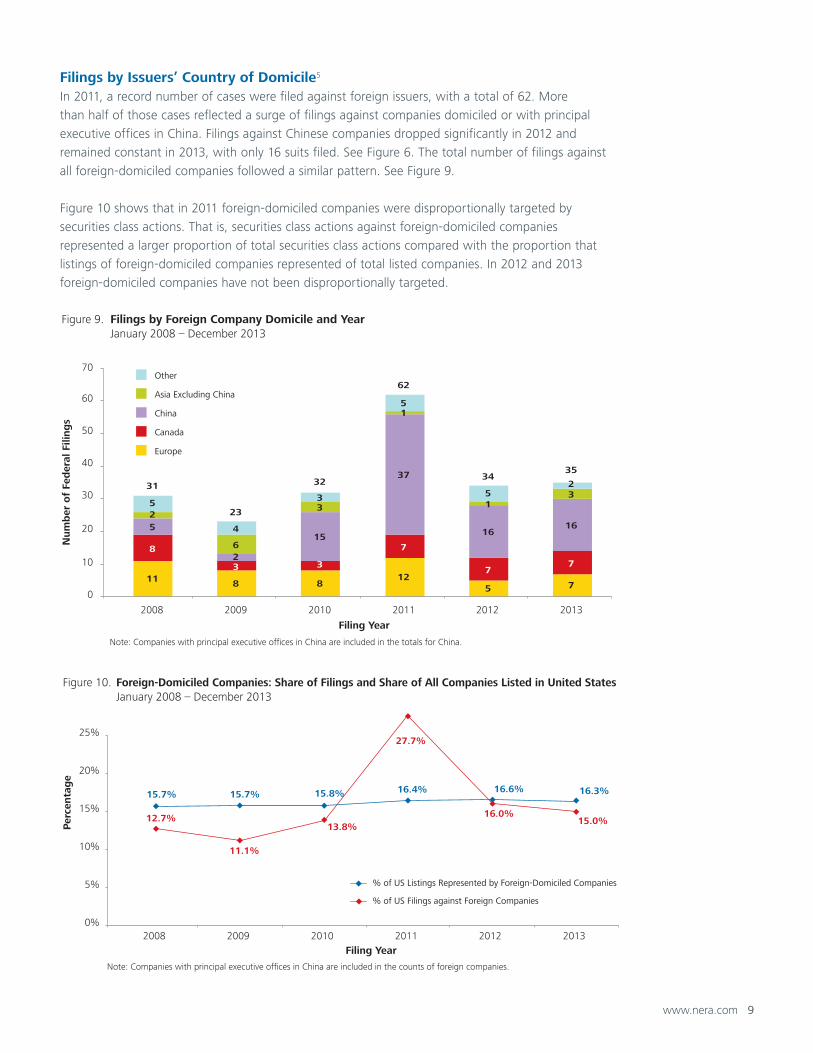
Filings by Issuers’ Country of Domicile5
In 2011, a record number of cases were filed against foreign issuers, with a total of 62. More
than half of those cases reflected a surge of filings against companies domiciled or with principal
executive offices in China. Filings against Chinese companies dropped significantly in 2012 and
remained constant in 2013, with only 16 suits filed. See Figure 6. The total number of filings against
all foreign-domiciled companies followed a similar pattern. See Figure 9.
Figure 10 shows that in 2011 foreign-domiciled companies were disproportionally targeted by
securities class actions. That is, securities class actions against foreign-domiciled companies
represented a larger proportion of total securities class actions compared with the proportion that
listings of foreign-domiciled companies represented of total listed companies. In 2012 and 2013
foreign-domiciled companies have not been disproportionally targeted.
Figure 9. Filings by Foreign Company Domicile and Year January 2008 – December 2013
Other
Asia Excluding China
China
Canada
Europe
11 8 8 12
5 7
8
3 3
7
7 7
5
2
15
37
16 16
2
6
3
1
1 3
5
4
3
5
5 2
0
10
20
30
40
50
60
70
2008 2009 2010 2011 2012 2013
Num
ber
of
Fed
eral
Fili
ng
s
Filing Year
31
23
32
62
Note: Companies with principal executive offices in China are included in the totals for China.
34 35
Figure 10. Foreign-Domiciled Companies: Share of Filings and Share of All Companies Listed in United States January 2008 – December 2013
Note: Companies with principal executive offices in China are included in the counts of foreign companies.
% of US Listings Represented by Foreign-Domiciled Companies
% of US Filings against Foreign Companies
15.7% 15.7% 15.8% 16.4% 16.6% 16.3%
12.7%
11.1%
13.8%
27.7%
16.0%15.0%
0%
5%
10%
15%
20%
25%
2008 2009 2010 2011 2012 2013
Per
centa
ge
Filing Year

10 www.nera.com
Filings by Circuit Historically, filings have been concentrated in two US circuits, and 2013 was no exception: the 2nd
and the 9th Circuits, which respectively include New York and California, together accounted for
53% of the 2013 filings. Filings in the 9th Circuit rebounded markedly from the low in 2012: 59
cases were filed there in 2013, a 64% increase from the previous year and close to the 2009-2011
average. The 2nd Circuit exhibited a comparatively smaller increase: 66 cases were filed there in
2013, an increase of 18% compared to the previous year. See Figure 11.
In the 5th Circuit, more than twice as many securities class actions were filed in 2013 as in 2012.
With 25 cases filed, the 5th Circuit, which includes Texas, still represented only 11% of the US cases.
However, the 2013 level was exceptional for the 5th Circuit: it was the highest level since 2000. This
increase is related to the increase in 10b-5 class action filings discussed in Figure 6.
Figure 11. Federal Filings by Circuit and Year January 2009 – December 2013
20132012201120102009
9
65
16
4
15
510
6
46
8
23
14
49
19
10 1013
2014
66
69
1 10
60
19 13 1512 8 8
60
9 10
12
56
2214
1212
13 9
36
14 1211
66
22
12
25
610
6
59
592 1
3
0
10
20
30
40
50
60
70
80
90
100
D.C. 1st 2nd 3rd 4th 5th 6th 7th 8th 9th 10th 11th
Num
ber
of
Fed
eral
Fili
ng
s
Circuit
www.nera.com 11
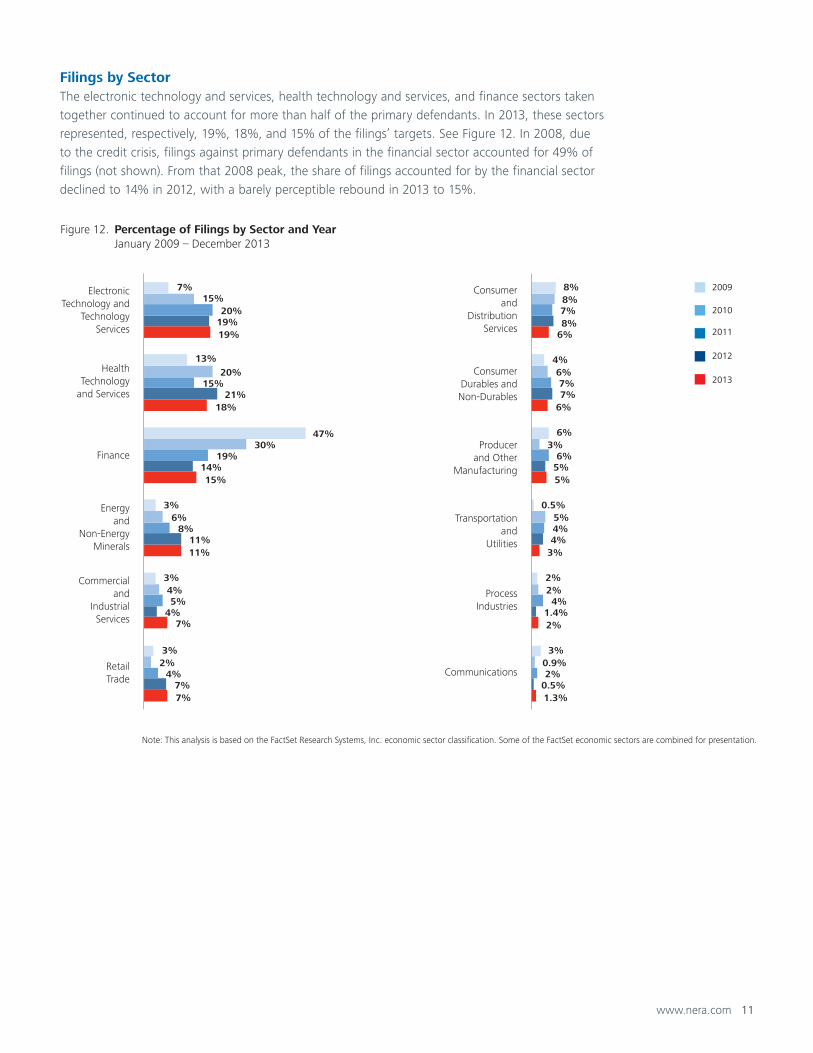
Filings by SectorThe electronic technology and services, health technology and services, and finance sectors taken
together continued to account for more than half of the primary defendants. In 2013, these sectors
represented, respectively, 19%, 18%, and 15% of the filings’ targets. See Figure 12. In 2008, due
to the credit crisis, filings against primary defendants in the financial sector accounted for 49% of
filings (not shown). From that 2008 peak, the share of filings accounted for by the financial sector
declined to 14% in 2012, with a barely perceptible rebound in 2013 to 15%.
Figure 12. Percentage of Filings by Sector and Year January 2009 – December 2013
2013
2012
2011
2010
2009
Communications
Finance
HealthTechnology
and Services
ElectronicTechnology and
TechnologyServices
Commercialand
IndustrialServices
Producer and Other
Manufacturing
RetailTrade
Energyand
Non-EnergyMinerals
Consumerand
DistributionServices
ProcessIndustries
Transportationand
Utilities
ConsumerDurables and Non-Durables
1.3%
2%
3%
5%
6%
6%
0.5%
1.4%
4%
5%
7%
8%
2%
4%
4%
6%
7%
7%
0.9%
2%
5%
3%
6%
8%
3%
2%
0.5%
6%
4%
8%
7%
7%
11%
15%
18%
19%
7%
4%
11%
14%
21%
19%
4%
5%
8%
19%
15%
20%
2%
4%
6%
30%
20%
15%
3%
3%
3%
47%
13%
7%
Note: This analysis is based on the FactSet Research Systems, Inc. economic sector classification. Some of the FactSet economic sectors are combined for presentation.

12 www.nera.com
Companies in the financial sector are often also targeted as codefendants.
Figure 13 shows that 9% of filings in 2013 involved a financial institution as a codefendant, but not
a primary defendant. The overall pattern of filings against financial institutions as a share of total
filings is similar whether financial codefendants are included in the calculation or not: the share
peaked with the credit crisis and has been declining since, with a barely perceptible rebound in
2013 to 24%.6
Figure 13. Federal Cases in which Financial Institutions Are Named Defendants January 2005 – December 2013
Financial Institution is a Codefendant Only
Financial Institutions are a Primary Defendant and a Codefendant
Financial Institution is a Primary Defendant Only
16%11%
24%
37% 34%25%
15% 12% 15%
3%4%
10%
12%13%
5%
4%2% 1%
9%11%
20%
18%16%
9%
13%
9% 9%
0%
10%
20%
30%
40%
50%
60%
70%
80%
90%
100%
2005 2006 2007 2008 2009 2010 2011 2012 2013
Per
centa
ge
of
Fed
eral
Fili
ng
s
Filing Year
28%
Note: Analysis presented in this chart uses codefendant data we code at the filing stage.
26%
54%
67%63%
39%
32%
23% 24%
www.nera.com 13
Accounting codefendants
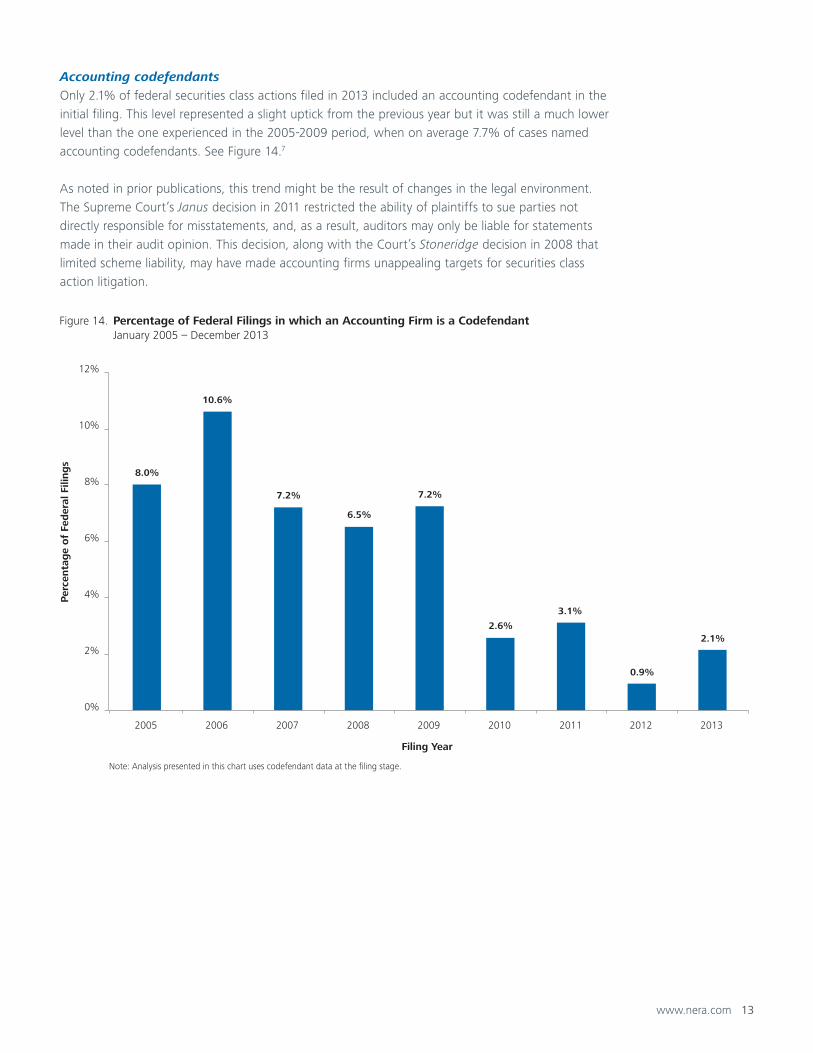
Only 2.1% of federal securities class actions filed in 2013 included an accounting codefendant in the
initial filing. This level represented a slight uptick from the previous year but it was still a much lower
level than the one experienced in the 2005-2009 period, when on average 7.7% of cases named
accounting codefendants. See Figure 14.7
As noted in prior publications, this trend might be the result of changes in the legal environment.
The Supreme Court’s Janus decision in 2011 restricted the ability of plaintiffs to sue parties not
directly responsible for misstatements, and, as a result, auditors may only be liable for statements
made in their audit opinion. This decision, along with the Court’s Stoneridge decision in 2008 that
limited scheme liability, may have made accounting firms unappealing targets for securities class
action litigation.
Figure 14. Percentage of Federal Filings in which an Accounting Firm is a Codefendant January 2005 – December 2013
8.0%
10.6%
7.2%
6.5%
7.2%
2.6%
3.1%
0.9%
2.1%
0%
2%
4%
6%
8%
10%
12%
2005 2006 2007 2008 2009 2010 2011 2012 2013
Per
centa
ge
of
Fed
eral
Fili
ng
s
Filing Year
Note: Analysis presented in this chart uses codefendant data at the filing stage.
14 www.nera.com
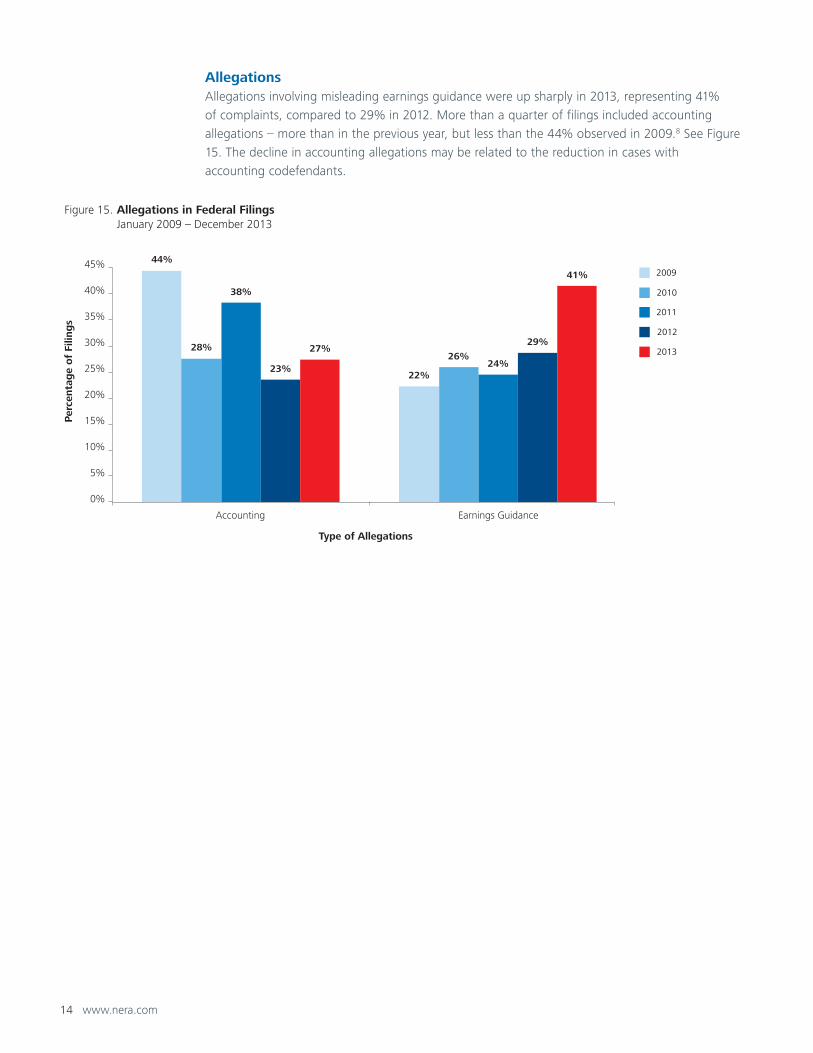
Allegations Allegations involving misleading earnings guidance were up sharply in 2013, representing 41%
of complaints, compared to 29% in 2012. More than a quarter of filings included accounting
allegations – more than in the previous year, but less than the 44% observed in 2009.8 See Figure
15. The decline in accounting allegations may be related to the reduction in cases with
accounting codefendants.
Figure 15. Allegations in Federal Filings January 2009 – December 2013
2013
2012
2011
2010
2009
44%
22%
28%26%
38%
24%23%
29%27%
41%
0%
5%
10%
15%
20%
25%
30%
35%
40%
45%
Accounting Earnings Guidance
Per
centa
ge
of
Filin
gs
Type of Allegations
www.nera.com 15
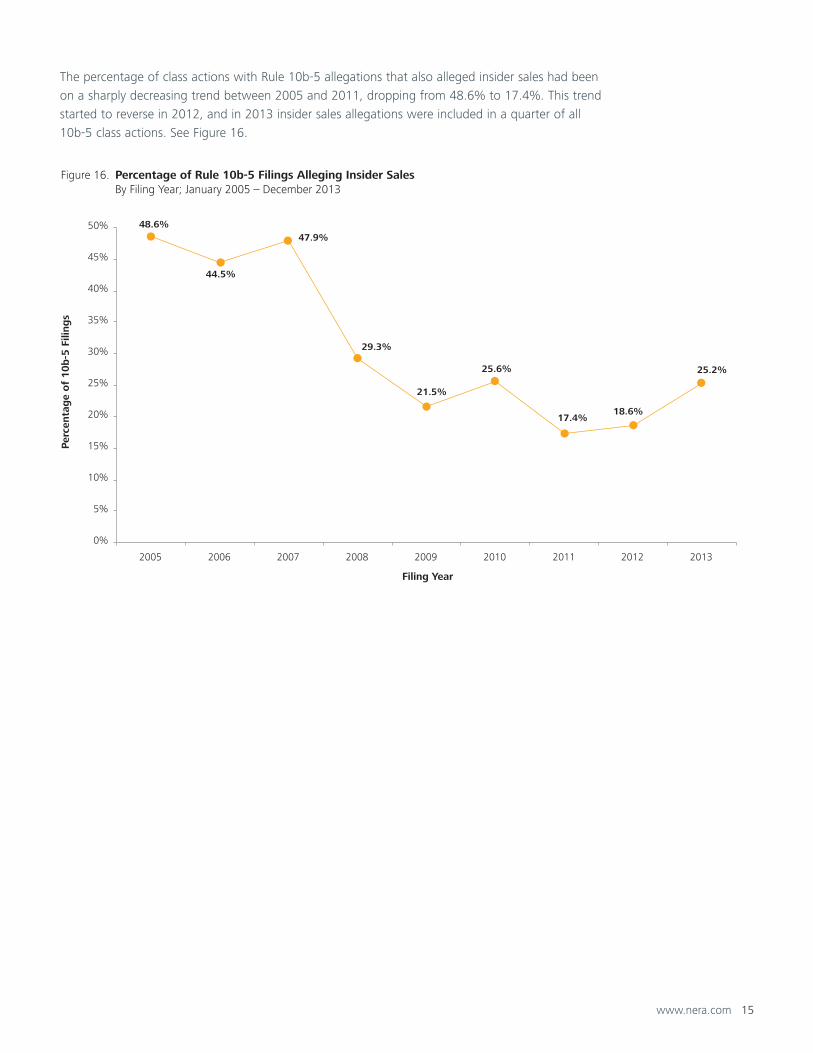
The percentage of class actions with Rule 10b-5 allegations that also alleged insider sales had been
on a sharply decreasing trend between 2005 and 2011, dropping from 48.6% to 17.4%. This trend
started to reverse in 2012, and in 2013 insider sales allegations were included in a quarter of all
10b-5 class actions. See Figure 16.
Figure 16. Percentage of Rule 10b-5 Filings Alleging Insider Sales By Filing Year; January 2005 – December 2013
48.6%
44.5%
47.9%
29.3%
21.5%
25.6%
17.4%18.6%
25.2%
0%
5%
10%
15%
20%
25%
30%
35%
40%
45%
50%
2005 2006 2007 2008 2009 2010 2011 2012 2013
Per
centa
ge
of
10b
-5 F
iling
s
Filing Year
16 www.nera.com
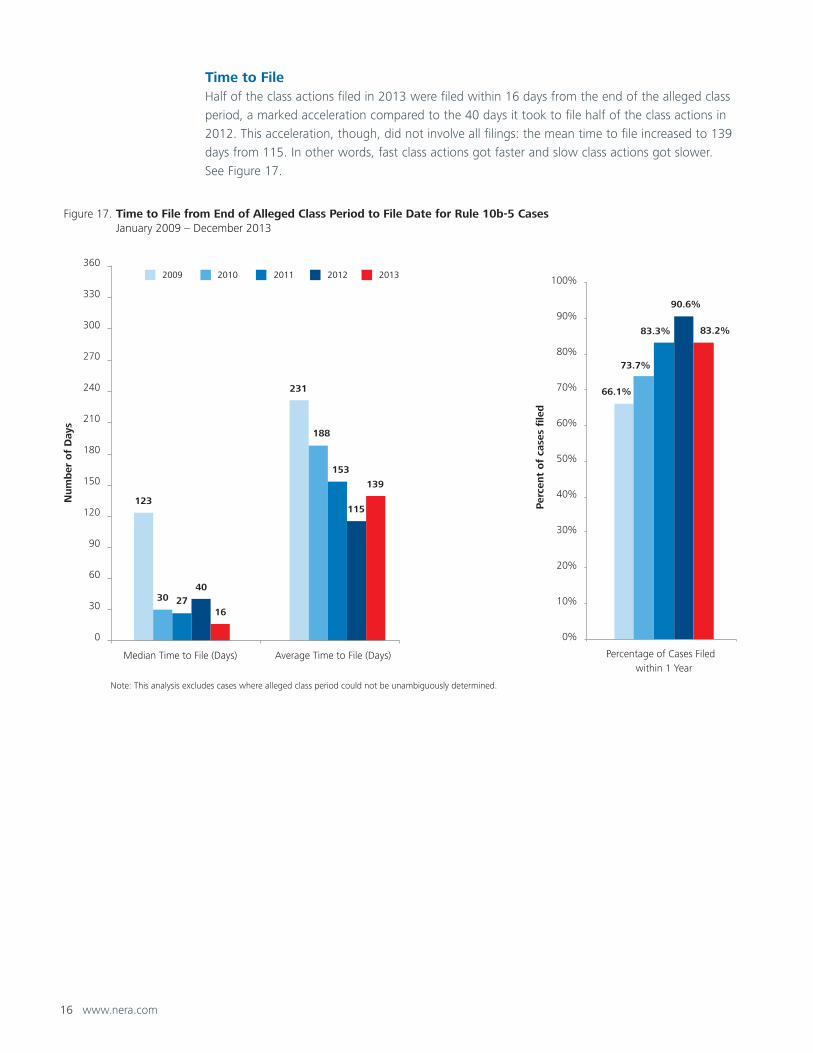
Time to FileHalf of the class actions filed in 2013 were filed within 16 days from the end of the alleged class
period, a marked acceleration compared to the 40 days it took to file half of the class actions in
2012. This acceleration, though, did not involve all filings: the mean time to file increased to 139
days from 115. In other words, fast class actions got faster and slow class actions got slower.
See Figure 17.
Figure 17. Time to File from End of Alleged Class Period to File Date for Rule 10b-5 Cases January 2009 – December 2013
2012 2013201120102009
123
231
30
188
27
153
40
115
16
139
0
30
60
90
120
150
180
210
240
270
300
330
360
Median Time to File (Days) Average Time to File (Days)
Num
ber
of
Day
s
Note: This analysis excludes cases where alleged class period could not be unambiguously determined.
66.1%
73.7%
83.3%
90.6%
83.2%
0%
10%
20%
30%
40%
50%
60%
70%
80%
90%
100%
Percentage of Cases Filed within 1 Year
Per
cent
of
case
s fi
led

www.nera.com 17
Analysis of Motions
Starting last year, NERA has added a section on motions to this publication series.9 Motion
outcomes are of interest to many because they affect the likelihood with which a case will settle
and the settlement amount. NERA research has confirmed that a statistically robust relationship
exists between motion outcomes and settlement outcomes. Yet, we caution the reader that these
relationships are complex (partly because of the strategic decisions litigants make about the litigation
stage in which to settle) and that, to estimate the impact of the motion outcome on the predicted
settlement of a specific case, one needs to go beyond the simple charts published in this paper and
use a statistical model such as the proprietary NERA model.
NERA collects and analyzes data on three types of motions: motion to dismiss, motion for class
certification, and motion for summary judgment. In this edition of this report, we show only the
information pertaining to the first two types.
Unless otherwise specified, the statistics in this section refer to cases filed and resolved in the
2000-2013 period.

18 www.nera.com
Motion to DismissA motion to dismiss was filed in 95% of cases. However, the court reached a decision on only
80% of the motions filed. In the remaining 20% of cases in which a motion to dismiss was filed
by defendants, the case resolved before a decision was taken, or plaintiffs voluntarily dismissed
the action, or the motion to dismiss itself was withdrawn by defendants. See Figure 18. (We have
made a methodological change since the last edition of this report: we have now stopped including
among the cases in which the decision was reached prior to case resolution those cases in which
plaintiffs voluntarily dismiss the action and cases in which defendants voluntarily withdraw the
motion to dismiss.)
Out of the motions to dismiss for which a court decision was reached, the following three
outcomes account for the vast majority of the decisions: granted (48%),10 granted in part and
denied in part (25%), and denied (21%). See Figure 18.
Note that for settled cases, we record the status of any motions at the time of settlement.
For example, if a case has a motion to dismiss granted but then denied on appeal, followed
immediately by settlement, we would record the motion as denied.11
Figure 18. Filing and Resolutions of Motions to Dismiss Cases Filed and Resolved January 2000 – December 2013
Denied, 21%
Partially Granted/ Partially Denied, 25%
Granted without Prejudice, 6%
Filed, 95%
Not filed, 5%
Court Decision Prior to Case Resolution, 80%
No Court Decision Prior toCase Resolution, 10%
MTD Withdrawn by Defendants, 2%
Plaintiffs Voluntarily Dismissed Action, 8%
MTD Filed Out of All Cases Filed and Resolved MTD Decided Out of MTD Filed Court Decision Out of MTD Decided
Granted, 48%
Note: Includes cases in which a violation of any of Rule 10b-5, Section 11, Section 12 is alleged and in which common stock is part of the class.
www.nera.com 19
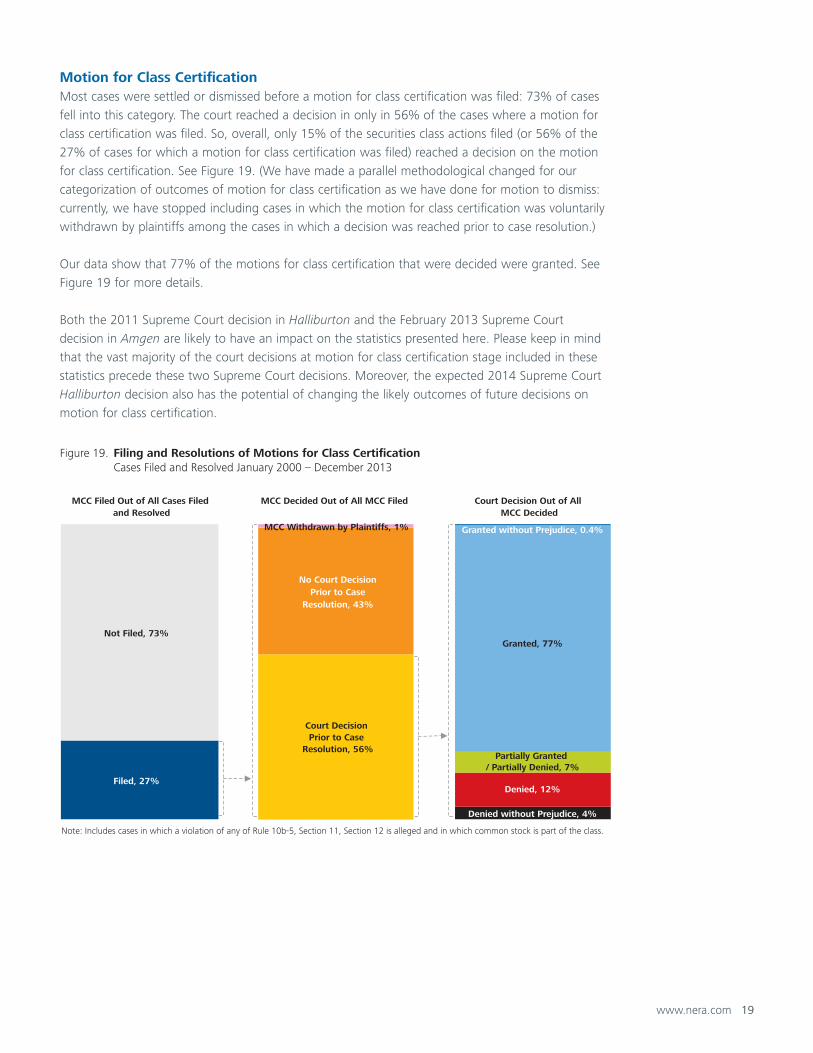
Motion for Class CertificationMost cases were settled or dismissed before a motion for class certification was filed: 73% of cases
fell into this category. The court reached a decision in only in 56% of the cases where a motion for
class certification was filed. So, overall, only 15% of the securities class actions filed (or 56% of the
27% of cases for which a motion for class certification was filed) reached a decision on the motion
for class certification. See Figure 19. (We have made a parallel methodological changed for our
categorization of outcomes of motion for class certification as we have done for motion to dismiss:
currently, we have stopped including cases in which the motion for class certification was voluntarily
withdrawn by plaintiffs among the cases in which a decision was reached prior to case resolution.)
Our data show that 77% of the motions for class certification that were decided were granted. See
Figure 19 for more details.
Both the 2011 Supreme Court decision in Halliburton and the February 2013 Supreme Court
decision in Amgen are likely to have an impact on the statistics presented here. Please keep in mind
that the vast majority of the court decisions at motion for class certification stage included in these
statistics precede these two Supreme Court decisions. Moreover, the expected 2014 Supreme Court
Halliburton decision also has the potential of changing the likely outcomes of future decisions on
motion for class certification.
Figure 19. Filing and Resolutions of Motions for Class Certification Cases Filed and Resolved January 2000 – December 2013
Denied without Prejudice, 4%
Denied, 12%
Partially Granted / Partially Denied, 7%
Granted, 77%
Granted without Prejudice, 0.4%
Filed, 27%
Not Filed, 73%
Court Decision Prior to Case
Resolution, 56%
No Court Decision Prior to Case
Resolution, 43%
MCC Withdrawn by Plaintiffs, 1%
MCC Filed Out of All Cases Filed and Resolved
MCC Decided Out of All MCC Filed Court Decision Out of All MCC Decided
Note: Includes cases in which a violation of any of Rule 10b-5, Section 11, Section 12 is alleged and in which common stock is part of the class.
20 www.nera.com
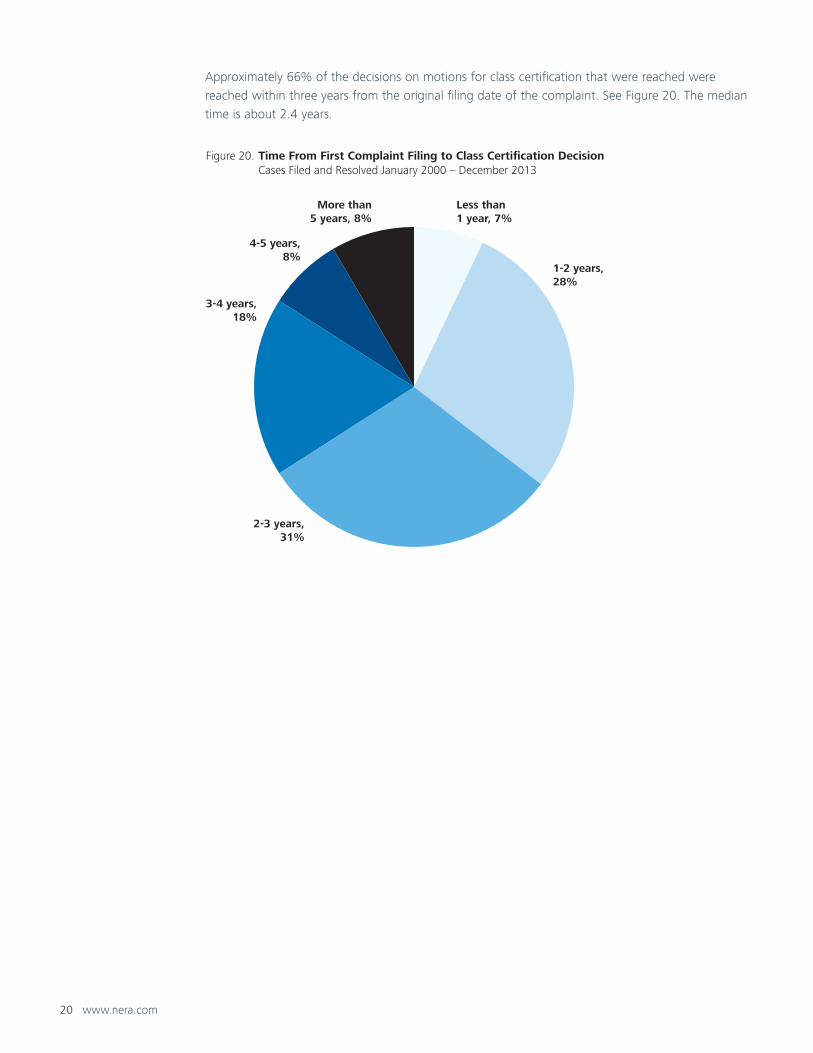
Approximately 66% of the decisions on motions for class certification that were reached were
reached within three years from the original filing date of the complaint. See Figure 20. The median
time is about 2.4 years.
Figure 20. Time From First Complaint Filing to Class Certification Decision Cases Filed and Resolved January 2000 – December 2013
Less than1 year, 7%
1-2 years,28%
2-3 years,31%
3-4 years,18%
4-5 years,8%
More than5 years, 8%

www.nera.com 21
Trends in Case Resolutions
Number of Cases Settled or DismissedOnly 100 securities class actions settled in 2013, a level very close to the record low of the previous
year. In 2012, 94 settlements were reached, the lowest level since at least 1996, after the passage
of the PSLRA.12 In contrast, the average number of settlements in the period 1996-2011 was 127
per year. See Figure 21.
The number of securities class actions dismissed in 2013 appears to be relatively low compared to
recent experience.13 At least 79 securities class actions were dismissed.14
Consequently, resolved cases, which combine settlements, dismissals and verdicts appear to be
relatively few compared to historical norm.
Last year, we wondered whether the pace of resolutions would pick up after the then-awaited
Supreme Court decision in Amgen. But just about six months after Amgen was decided, a second
writ of certiorari was filed in the Halliburton case, certiorari that was then granted in November
2013. So we now wonder whether the pace of resolution will pick up after the Supreme Court
reaches its second decision on Halliburton sometime in 2014. We do note, though, that in the
roughly six months between the Amgen decision and the filing of Halliburton’s second writ, 51
securities class actions alleging violation of Rule 10b-5 settled, which is 14% less than the 59 settled
during the average six-month period in the 2005-2012 period.15
Figure 21. Number of Resolved Cases: Dismissed or Settled January 1996 – December 2013
Dismissed
Settled
149134
112100
125 130 123 131113
144
115
150
123 119132 124
94 100
42
40
47 67
101 86 92 75
89
93
84
93
75
111
120118
87 79
0
25
50
75
100
125
150
175
200
225
250
275
1996 1997 1998 1999 2000 2001 2002 2003 2004 2005 2006 2007 2008 2009 2010 2011 2012 2013
Num
ber
of
Fed
eral
Cas
es
Resolution Year
191
174
159167
226216 215
206 202
237
199
243
198
230
252
242
181
Note: Analysis excludes IPO laddering cases. Dismissals may include dismissals without prejudice and dismissals under appeal.
179

22 www.nera.com
In the filings section of this paper, we showed 10b-5 monthly filings surrounding the first Supreme
Court decision in Halliburton and the Amgen decision. In this section, we show equivalent charts
for the monthly number of settlements of 10b-5 class actions. See Figure 22. Again, we also show
figures specific to the 5th and the 2nd Circuits. See Figures 23 and 24, respectively.16 Again we
caution that over the time period depicted here, there were factors additional to the Supreme Court
decisions affecting the level of settlement activity.
Figure 22. Monthly 10b-5 Settlements – All Circuits January 2007 – December 2013
0
5
10
15
20
25
30
35
Jan-07 Jul-07 Jan-08 Jul-08 Jan-09 Jul-09 Jan-10 Jul-10 Jan-11 Jul-11 Jan-12 Jul-12 Jan-13 Jul-13
Sett
lem
ents
Settlement Month
1/7/11 - Halliburton 1 cert. granted
3/1/12 - Amgen writ of cert. filed
5/13/10 - Halliburton 1writ of cert. filed
6/6/11 - Halliburton 1 decision
6/11/12 - Amgen cert. granted
2/27/13 - Amgen decision
9/9/13: Halliburton 2 writ of cert. filed
11/15/13 - Halliburton 2 cert. granted
Horizontal lines are averages of monthly settlements between events

www.nera.com 23
Figure 23. Monthly 10b-5 Settlements – Fifth Circuit January 2007 – December 2013
0
1
2
3
Jan-07 Jul-07 Jan-08 Jul-08 Jan-09 Jul-09 Jan-10 Jul-10 Jan-11 Jul-11 Jan-12 Jul-12 Jan-13 Jul-13
Sett
lem
ents
Settlement Month
1/7/11 - Halliburton 1 cert. granted
3/1/12 - Amgenwrit of cert. filed
5/13/10 - Halliburton 1writ of cert. filed
6/6/11 - Halliburton 1 decision
6/11/12 - Amgen cert. granted
2/27/13 - Amgen decision
9/9/13:Halliburton 2
writ of cert. filed
11/15/13 -Halliburton 2cert. granted
Horizontal lines are averages of monthly settlements between events
5/16/07 - Oscar v Allegiance
Figure 24. Monthly 10b-5 Settlements – Second Circuit January 2007 – December 2013
0
2
4
6
8
10
12
14
16
18
20
Jan-07 Jul-07 Jan-08 Jul-08 Jan-09 Jul-09 Jan-10 Jul-10 Jan-11 Jul-11 Jan-12 Jul-12 Jan-13 Jul-13
Sett
lem
ents
Settlement Month
1/7/11 - Halliburton 1 cert. granted
3/1/12 - Amgenwrit of cert. filed
5/13/10 - Halliburton 1writ of cert. filed
6/6/11 - Halliburton 1 decision
6/11/12 - Amgen cert. granted
2/27/13 - Amgen decision
9/9/13:Halliburton 2
writ of cert. filed
11/15/13 -Halliburton 2cert. granted
Horizontal lines are averages of monthly settlements between events
9/30/08 - Salomon

24 www.nera.com
Dismissal RatesDismissal rates have been on a rising trend since 2000, but two opposing factors—the large
fraction of cases awaiting resolution among those filed in recent years and the possibility that
recent dismissals will be successfully appealed or re-filed—make it difficult to draw a conclusion
with respect to recent years, barring further analysis.
Dismissal rates have increased from 32%-36% for cases filed in 2000-2002 to 43%-47% for cases
filed in 2004-2006. Remembering the caveat above, dismissal rates appear to have continued to
increase, given that 44%-51% of cases filed in 2007-2009 have been dismissed. For cases filed since
2010, it may be too early to tell.
Figure 25 shows the dismissal rate by filing cohort. It is calculated as the fraction of cases ultimately
dismissed out of all cases filed in a given year.17
Figure 25. Status of Cases as Percentage of Federal Filings by Filing Year January 2000 – December 2013
Per
centa
ge
of
Fed
eral
Cas
es
Dismissed SettledPending
64%68%
61%56% 53% 51% 54%
48%42%
28%
19%12%
3%
36%32%
36%41%
43% 47% 44%
44%
48%
51%
44%
36%
23%
6%
3% 3% 4% 2% 2%9% 11%
21%
38%
51%
74%
94%
0%
10%
20%
30%
40%
50%
60%
70%
80%
90%
100%
2000 2001 2002 2003 2004 2005 2006 2007 2008 2009 2010 2011 2012 2013
Note: Analysis excludes IPO laddering, merger objection cases and verdicts. Dismissals may include dismissals without prejudice and dismissals under appeal.
Filing Year
www.nera.com 25
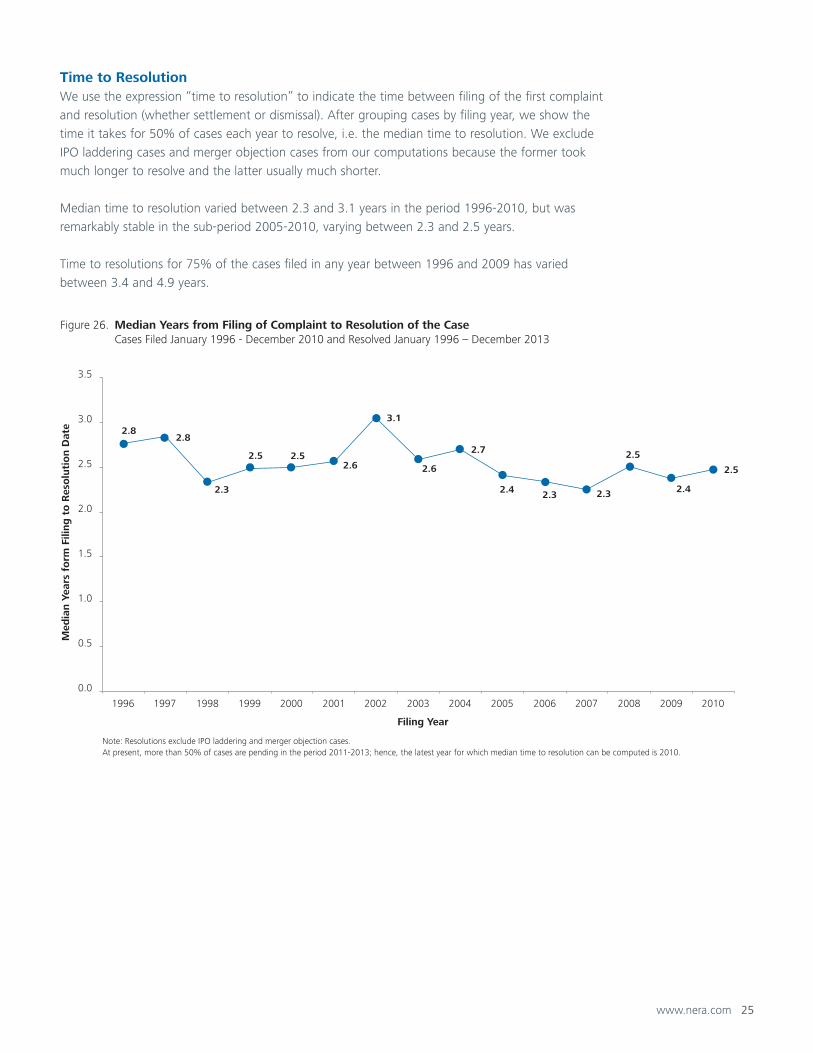
Time to ResolutionWe use the expression “time to resolution” to indicate the time between filing of the first complaint
and resolution (whether settlement or dismissal). After grouping cases by filing year, we show the
time it takes for 50% of cases each year to resolve, i.e. the median time to resolution. We exclude
IPO laddering cases and merger objection cases from our computations because the former took
much longer to resolve and the latter usually much shorter.
Median time to resolution varied between 2.3 and 3.1 years in the period 1996-2010, but was
remarkably stable in the sub-period 2005-2010, varying between 2.3 and 2.5 years.
Time to resolutions for 75% of the cases filed in any year between 1996 and 2009 has varied
between 3.4 and 4.9 years.
Figure 26. Median Years from Filing of Complaint to Resolution of the Case Cases Filed January 1996 - December 2010 and Resolved January 1996 – December 2013
2.82.8
2.3
2.5 2.52.6
3.1
2.6
2.7
2.4 2.3 2.3
2.5
2.4
2.5
0.0
0.5
1.0
1.5
2.0
2.5
3.0
3.5
1996 1997 1998 1999 2000 2001 2002 2003 2004 2005 2006 2007 2008 2009 2010
Med
ian Y
ears
fo
rm F
iling
to
Res
olu
tio
n D
ate
Filing Year
Note: Resolutions exclude IPO laddering and merger objection cases.At present, more than 50% of cases are pending in the period 2011-2013; hence, the latest year for which median time to resolution can be computed is 2010.

26 www.nera.com
Trends in Settlements
Settlement AmountsThe average settlement amount in 2013 broke prior records, reaching $55 million, an increase
of 53% over the previous year and 31% over the previous high in 2009. See Figure 27. This
average calculation excludes settlements above $1 billion, settlements in IPO laddering cases and
settlements in merger objection cases, since the inclusion of any of these may obscure trends in
more usual cases.
These record high average settlement amounts were driven by eight very large settlements
(although not so large as to be excluded by our $1 billion cut off). Yet, this year’s record average
settlement does not imply that cases have generally become more expensive to settle. Reality is
much more nuanced than that, as we will show when we discuss median settlement amount and
the distribution of settlement values below in Figures 29 and 30.
Figure 27. Average Settlement Value ($Million), Excluding Settlements over $1 Billion, IPO Laddering, and Merger Objection Cases January 1996 – December 2013
$8$10
$13$15
$12
$15
$24 $24
$20
$27$26
$30$32
$42$40
$31
$36
$55
0
10
20
30
40
50
60
1996 1997 1998 1999 2000 2001 2002 2003 2004 2005 2006 2007 2008 2009 2010 2011 2012 2013
Ave
rag
e Se
ttle
men
t V
alue
($M
illio
ns)
Settlement Year

www.nera.com 27
For completeness, Figure 28 shows average settlements if all cases are included. The 2013 average
settlement across all federal securities class actions was $68 million. This average is even higher than
the one discussed above because of the inclusion of the $2.4 billion mega settlement of Bank of
America Merrill Lynch. That settlement was announced in 2012, but we followed our protocol of
recording settlements as of the date of the approval hearing, which happened in 2013.
Figure 28. Average Settlement Value ($Million), All Cases January 1996 – December 2013
$8$10
$13$15
$43
$15
$23 $24$20
$71
$79
$51
$38
$12
$92
$23
$36
$68
0
10
20
30
40
50
60
70
80
90
100
110
1996 1997 1998 1999 2000 2001 2002 2003 2004 2005 2006 2007 2008 2009 2010 2011 2012 2013
Ave
rag
e Se
ttle
men
t V
alue
($M
illio
ns)
Settlement Year
Notes: Excludes merger objection settlements with no payment to class.
28 www.nera.com
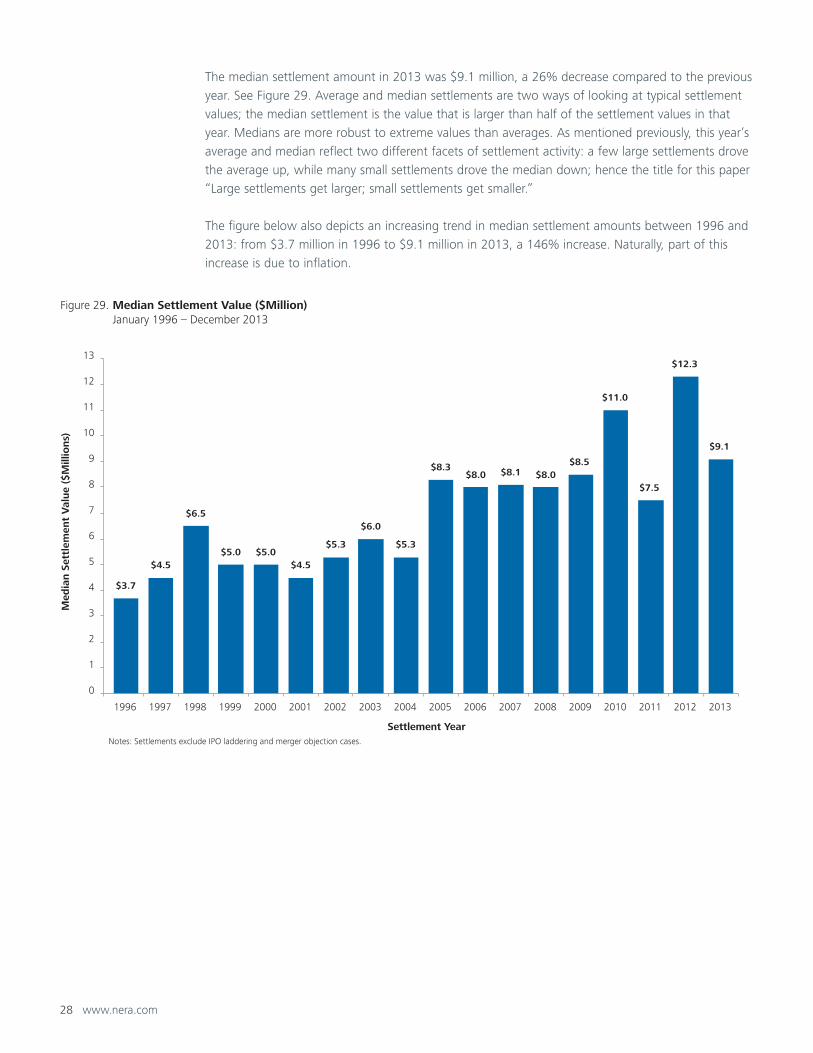
The median settlement amount in 2013 was $9.1 million, a 26% decrease compared to the previous
year. See Figure 29. Average and median settlements are two ways of looking at typical settlement
values; the median settlement is the value that is larger than half of the settlement values in that
year. Medians are more robust to extreme values than averages. As mentioned previously, this year’s
average and median reflect two different facets of settlement activity: a few large settlements drove
the average up, while many small settlements drove the median down; hence the title for this paper
“Large settlements get larger; small settlements get smaller.”
The figure below also depicts an increasing trend in median settlement amounts between 1996 and
2013: from $3.7 million in 1996 to $9.1 million in 2013, a 146% increase. Naturally, part of this
increase is due to inflation.
Figure 29. Median Settlement Value ($Million) January 1996 – December 2013
$3.7
$4.5
$6.5
$5.0 $5.0$4.5
$5.3
$6.0
$5.3
$8.3$8.0 $8.1 $8.0
$8.5
$11.0
$7.5
$12.3
$9.1
0
1
2
3
4
5
6
7
8
9
10
11
12
13
1996 1997 1998 1999 2000 2001 2002 2003 2004 2005 2006 2007 2008 2009 2010 2011 2012 2013
Med
ian S
ettl
emen
t V
alue
($M
illio
ns)
Settlement YearNotes: Settlements exclude IPO laddering and merger objection cases.

www.nera.com 29
The distribution of settlements depicted in Figure 30 below illustrates the different facets of the
2013 settlement activity alluded to above. Specifically, by grouping settlement amounts by size, we
see an increase in the fraction of settlements smaller than $10 million, which represents 51% of
settlements. We also see a slight increase in the fraction of settlements larger than $100 million,
which represents 12% of the settlements.
Note that Figure 30 excludes settlements of IPO laddering cases, which would change the 2009
distribution altogether, as well as settlements in merger objection cases.
Figure 30. Distribution of Settlement Values January 2009 – December 2013
20132012201120102009
53%
19%14%
4%
10%
41%
29%16%
6%8%
55%
13%17%
8%6%
47%
11%
24%
8%10%
51%
14% 16%
7%
12%
0%
10%
20%
30%
40%
50%
60%
70%
Less Than $10 $10-$19.9 $20-$49.9 $50-$99.9 $100 or Greater
Per
centa
ge
of
Sett
led
Cas
es
Size of Settlement Value ($MM)
Note: Settlements exclude IPO laddering and merger objection cases.
30 www.nera.com
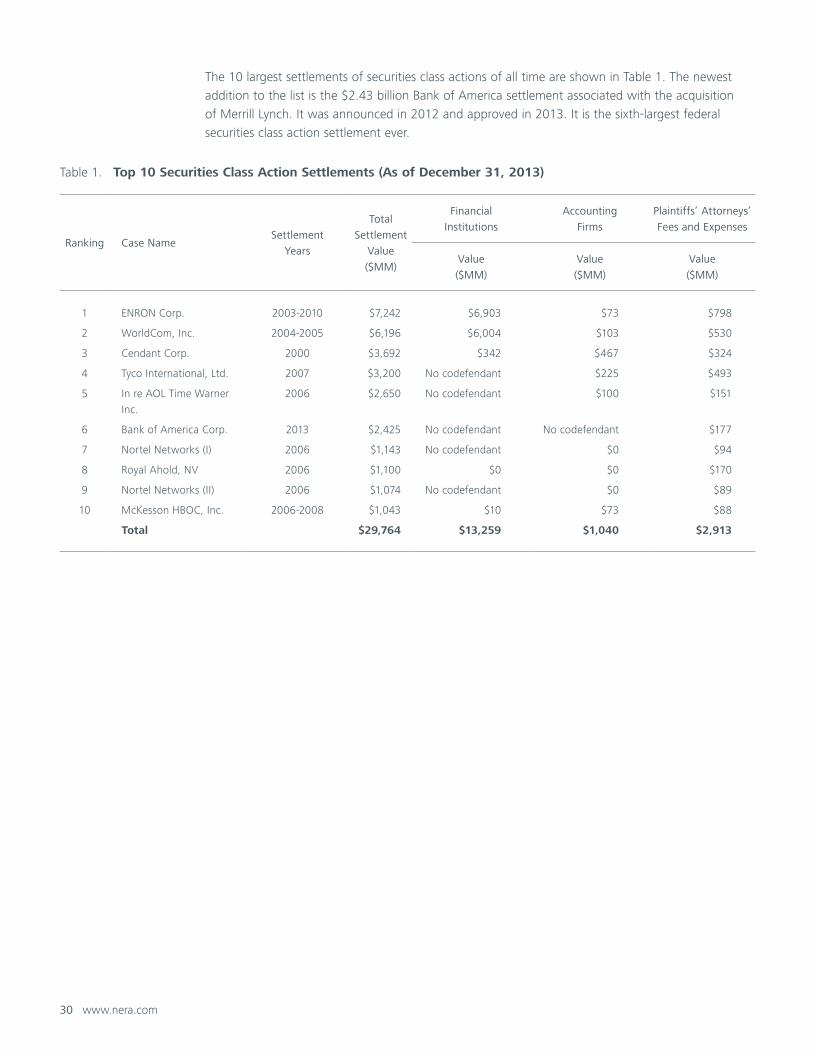
The 10 largest settlements of securities class actions of all time are shown in Table 1. The newest
addition to the list is the $2.43 billion Bank of America settlement associated with the acquisition
of Merrill Lynch. It was announced in 2012 and approved in 2013. It is the sixth-largest federal
securities class action settlement ever.
Table 1. Top 10 Securities Class Action Settlements (As of December 31, 2013)
Ranking Case NameSettlement
Years
Total
Settlement
Value
($MM)
Financial
Institutions
Accounting
Firms
Plaintiffs’ Attorneys’
Fees and Expenses
Value
($MM)
Value
($MM)
Value
($MM)
1 ENRON Corp. 2003-2010 $7,242 $6,903 $73 $798
2 WorldCom, Inc. 2004-2005 $6,196 $6,004 $103 $530
3 Cendant Corp. 2000 $3,692 $342 $467 $324
4 Tyco International, Ltd. 2007 $3,200 No codefendant $225 $493
5 In re AOL Time Warner
Inc.
2006 $2,650 No codefendant $100 $151
6 Bank of America Corp. 2013 $2,425 No codefendant No codefendant $177
7 Nortel Networks (I) 2006 $1,143 No codefendant $0 $94
8 Royal Ahold, NV 2006 $1,100 $0 $0 $170
9 Nortel Networks (II) 2006 $1,074 No codefendant $0 $89
10 McKesson HBOC, Inc. 2006-2008 $1,043 $10 $73 $88
Total $29,764 $13,259 $1,040 $2,913

www.nera.com 31
Aggregate SettlementsThe total dollar value of all settlements in 2013 exceeded $6.5 billion, almost twice as much as
the previous year. See Figure 31. More than $2.4 billion is represented by the BofA Merrill settlement
that, as noted, we record according to our usual protocol as of the date of judicial approval.
Even excluding the BofA Merrill settlement, the aggregate settlement amount for 2013 was
substantially higher than the previous year. It is worth noting again that the number of settlements
in 2013 remained essentially the same.
Figure 31 also illustrates that much of the large fluctuations in aggregate settlements over the years
has been driven by settlements over $1 billion, while relatively small settlements, those under
$10 million, account for a very small fraction of aggregate settlements despite often accounting
for about half of the number of settlements reached in a given year.
Figure 31. Aggregate Settlement Value by Settlement Size January 1996 – December 2013
$1,000 or Greater
$500-$999.9
$100-$499.9
$10-$99.9
Less Than $10
Settlement Value ($Million)
$0.4 $0.3 $0.2 $0.2 $0.3 $0.3 $0.2 $0.3 $0.3 $0.3 $0.3 $0.3 $0.3 $0.7 $0.2 $0.2 $0.1 $0.2$0.4 $0.7 $0.9
$0.4$0.9 $0.8 $1.0 $0.8 $1.0
$1.8$1.0
$1.7$1.2
$1.1$1.4 $1.2 $1.0 $0.9
$0.3 $0.1$0.2
$0.7$0.2
$0.7$1.4 $1.4 $0.9
$1.7
$1.4
$1.8
$1.3
$2.4
$1.3
$0.7 $1.2 $1.2
$0.5
$0.6
$0.8
$0.9
$1.4
$0.6
$1.8$3.7
$6.2
$6.0$3.2
$1.1
$7.2
$1.0
$2.4
$0
$1
$2
$3
$4
$5
$6
$7
$8
$9
$10
$11
$12
1996 1997 1998 1999 2000 2001 2002 2003 2004 2005 2006 2007 2008 2009 2010 2011 2012 2013
Ag
gre
gat
e Se
ttle
men
t V
alue
($B
illio
n)
Settlement Year
$1.1 $1.1$1.4 $1.3
$5.0
$1.8
$2.6$3.1
$2.1
$10.0
$8.7
$7.6
$4.5
$5.1
$11.6
$2.7
$3.3
$6.5
32 www.nera.com
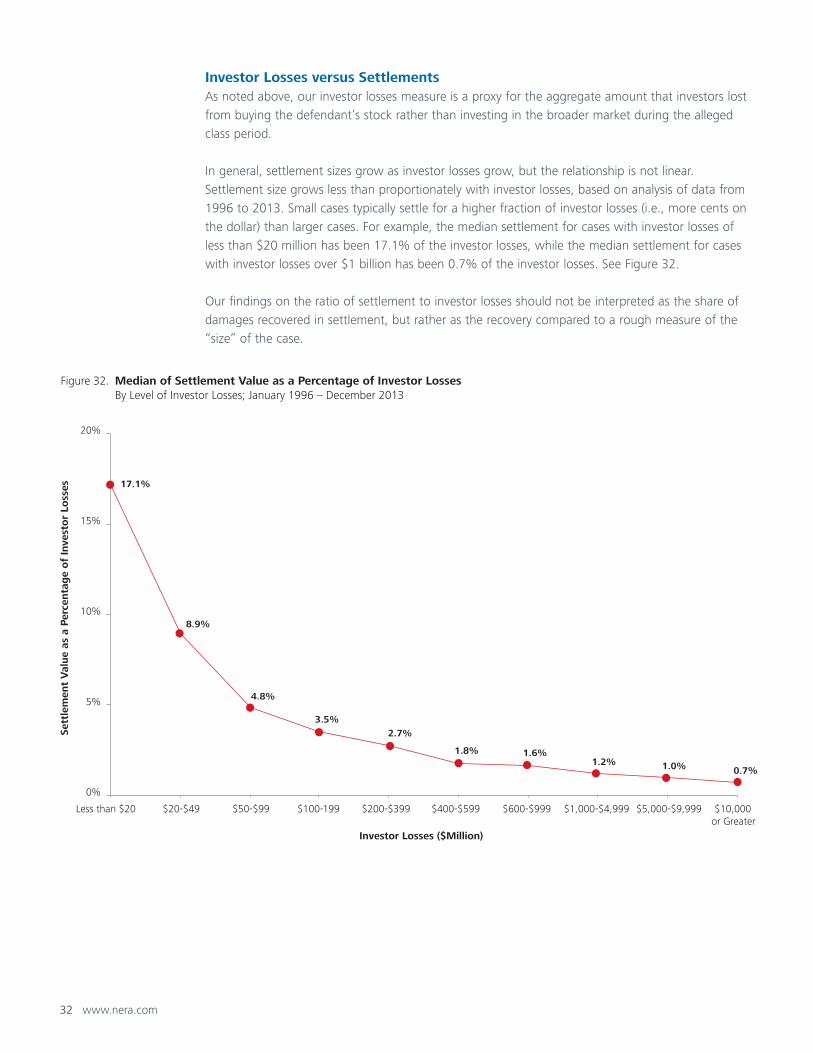
Investor Losses versus SettlementsAs noted above, our investor losses measure is a proxy for the aggregate amount that investors lost
from buying the defendant’s stock rather than investing in the broader market during the alleged
class period.
In general, settlement sizes grow as investor losses grow, but the relationship is not linear.
Settlement size grows less than proportionately with investor losses, based on analysis of data from
1996 to 2013. Small cases typically settle for a higher fraction of investor losses (i.e., more cents on
the dollar) than larger cases. For example, the median settlement for cases with investor losses of
less than $20 million has been 17.1% of the investor losses, while the median settlement for cases
with investor losses over $1 billion has been 0.7% of the investor losses. See Figure 32.
Our findings on the ratio of settlement to investor losses should not be interpreted as the share of
damages recovered in settlement, but rather as the recovery compared to a rough measure of the
“size” of the case.
Figure 32. Median of Settlement Value as a Percentage of Investor Losses By Level of Investor Losses; January 1996 – December 2013
17.1%
8.9%
4.8%
3.5%
2.7%
1.8% 1.6%1.2% 1.0% 0.7%
0%
5%
10%
15%
20%
Less than $20 $20-$49 $50-$99 $100-199 $200-$399 $400-$599 $600-$999 $1,000-$4,999 $5,000-$9,999 $10,000 or Greater
Sett
lem
ent
Val
ue
as a
Per
centa
ge
of
Inve
sto
r Lo
sses
Investor Losses ($Million)
www.nera.com 33
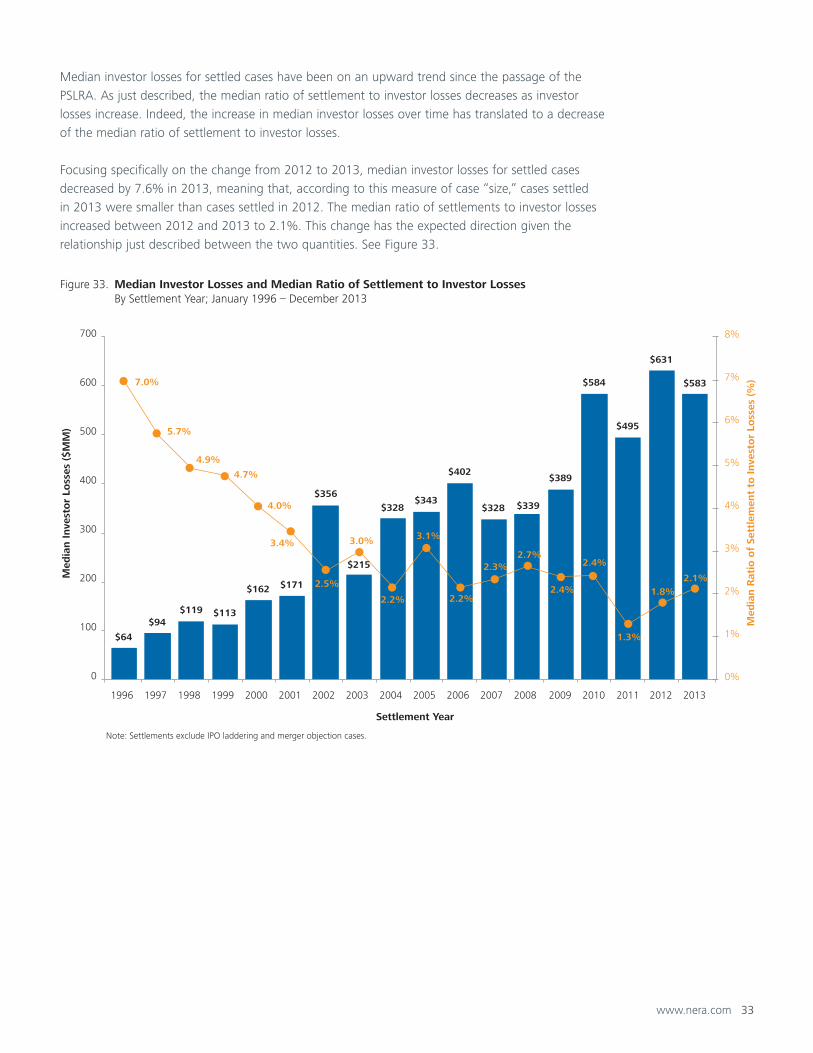
Median investor losses for settled cases have been on an upward trend since the passage of the
PSLRA. As just described, the median ratio of settlement to investor losses decreases as investor
losses increase. Indeed, the increase in median investor losses over time has translated to a decrease
of the median ratio of settlement to investor losses.
Focusing specifically on the change from 2012 to 2013, median investor losses for settled cases
decreased by 7.6% in 2013, meaning that, according to this measure of case “size,” cases settled
in 2013 were smaller than cases settled in 2012. The median ratio of settlements to investor losses
increased between 2012 and 2013 to 2.1%. This change has the expected direction given the
relationship just described between the two quantities. See Figure 33.
Figure 33. Median Investor Losses and Median Ratio of Settlement to Investor Losses By Settlement Year; January 1996 – December 2013
Note: Settlements exclude IPO laddering and merger objection cases.
$64
$94$119 $113
$162 $171
$356
$215
$328$343
$402
$328 $339
$389
$584
$495
$631
$5837.0%
5.7%
4.9%
4.7%
4.0%
3.4%
2.5%
3.0%
2.2%
3.1%
2.2%
2.3%2.7%
2.4%
2.4%
1.3%
1.8%2.1%
0%
1%
2%
3%
4%
5%
6%
7%
8%
0
100
200
300
400
500
600
700
1996 1997 1998 1999 2000 2001 2002 2003 2004 2005 2006 2007 2008 2009 2010 2011 2012 2013
Med
ian R
atio
of
Sett
lem
ent
to Inve
sto
r Lo
sses
(%
)
Med
ian Inve
sto
r Lo
sses
($
MM
)
Settlement Year

34 www.nera.com
Plaintiffs’ Attorneys’ Fees and ExpensesUsually, plaintiffs’ attorneys’ remuneration is awarded as a fraction of any settlement amount in
the forms of fees, plus expenses. Figure 34 depicts plaintiffs’ attorneys’ fees and expenses as a
proportion of settlement values.18 The data shown in this Figure exclude settlements without cash
payment to the class, almost all of which are merger objections.
In Figure 34, we illustrate two patterns: 1) Typically, fees grow with settlement size but less than
proportionally, i.e., the percentage of fees shrinks as the settlement size grows. 2) Broadly speaking,
fees have been decreasing over time.
First, to illustrate that percentage fees typically shrink as settlement size grows, we subdivided
settlements by settlement value and report median percentage fees and expenses for each
value group. Focusing on 2011-2013, we see that for settlements below $5 million, median fees
represented 30% of the settlement; these percentages fall with settlement size, reaching 9.6% in
fees for settlements above $1 billion.
To illustrate that, broadly speaking, fees have been decreasing over time, we report our findings
both for the period 1996-2013 and for the sub-period 2011-2013. The comparison shows that
percentage fees have decreased over time for settlements up to $500 million. For settlements
between $500 million and $1 billion, percentage fees have increased slightly, while for settlements
above $1 billion they have increased more markedly, although there are only two settlements in this
last category in the 2011-2013 period.
Figure 34. Median of Plaintiffs' Lawyers' Fees and Expenses, by Size of Settlement
Median Plaintiffs’ Attorneys’ Fees Median Plaintiffs’ Attorneys’ ExpensesNotes: Analysis excludes settlements with no cash payment to the class.
>=1,000
>=500 and <1,000
>=100 and <500
>=25 and <100
>=10 and <25
>=5 and <10
>5
8.1% 9.6% 1.1% 10.7%
17.3% 0.7% 18.0%
20.0% 1.6% 21.6%
25.0% 2.3% 27.3%
25.0% 2.4% 27.4%
30.0% 4.5% 34.5%
30.0% 4.1% 34.1%
0.5% 7.6%
17.7% 0.7% 17.0%
23.6% 1.4% 22.2%
28.9% 1.9% 27.0%
32.7% 2.7% 30.0%
33.8% 3.8% 30.0%
38.6% 5.3% 33.3%
1996 – 2013Percentage of Settlement Value
Settlement Value($Million)
2011 – 2013Percentage of Settlement Value
www.nera.com 35
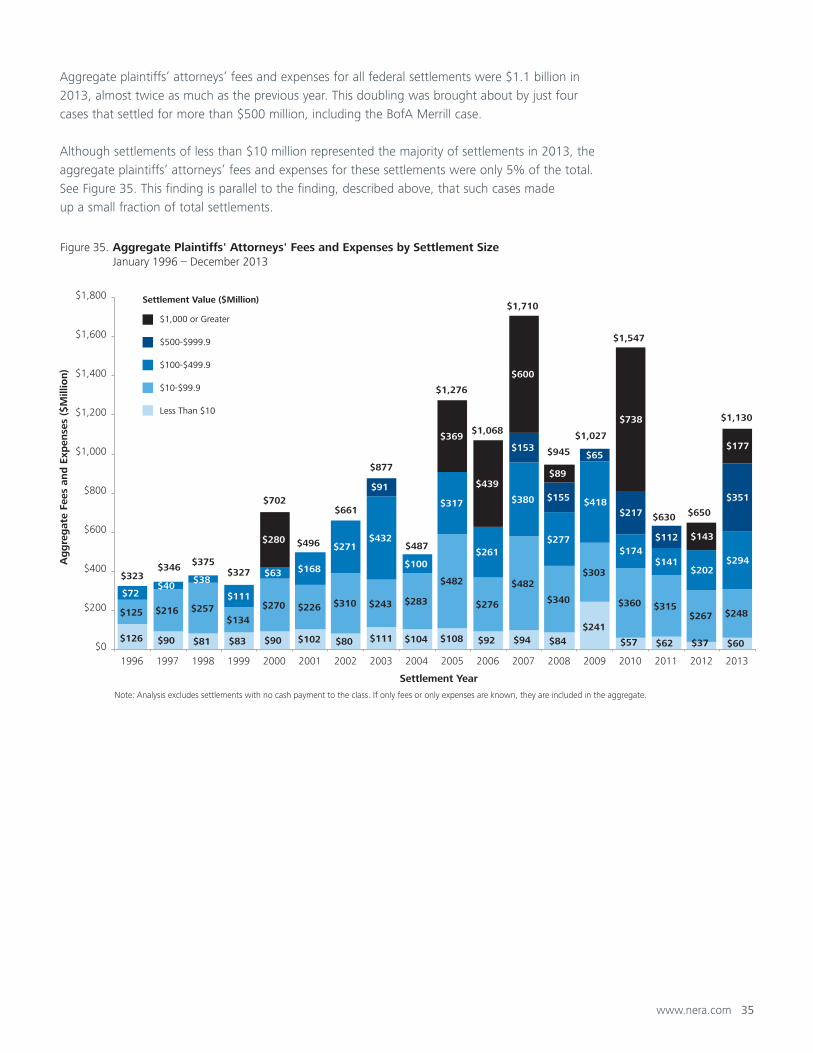
Aggregate plaintiffs’ attorneys’ fees and expenses for all federal settlements were $1.1 billion in
2013, almost twice as much as the previous year. This doubling was brought about by just four
cases that settled for more than $500 million, including the BofA Merrill case.
Although settlements of less than $10 million represented the majority of settlements in 2013, the
aggregate plaintiffs’ attorneys’ fees and expenses for these settlements were only 5% of the total.
See Figure 35. This finding is parallel to the finding, described above, that such cases made
up a small fraction of total settlements.
.Figure 35. Aggregate Plaintiffs' Attorneys' Fees and Expenses by Settlement Size January 1996 – December 2013
$1,000 or Greater
$500-$999.9
$100-$499.9
$10-$99.9
Less Than $10
Settlement Value ($Million)
$126 $90 $81 $83 $90 $102 $80 $111 $104 $108 $92 $94 $84
$241
$57 $62 $37 $60
$125 $216 $257$134
$270 $226 $310 $243 $283
$482
$276
$482
$340
$303
$360 $315$267 $248
$72$40
$38
$111
$63 $168
$271$432
$100
$317
$261
$380
$277
$418
$174$141
$202$294
$91
$153
$155
$65
$217
$112
$351
$280
$369
$439
$600
$89
$738
$143
$177
$0
$200
$400
$600
$800
$1,000
$1,200
$1,400
$1,600
$1,800
1996 1997 1998 1999 2000 2001 2002 2003 2004 2005 2006 2007 2008 2009 2010 2011 2012 2013
Ag
gre
gat
e Fe
es a
nd
Exp
ense
s ($
Mill
ion)
Settlement Year
$323
Note: Analysis excludes settlements with no cash payment to the class. If only fees or only expenses are known, they are included in the aggregate.
$346 $375$327
$702
$496
$661
$1,276
$1,068
$1,710
$945
$1,027
$1,547
$630 $650
$1,130
$877
$487
36 www.nera.com
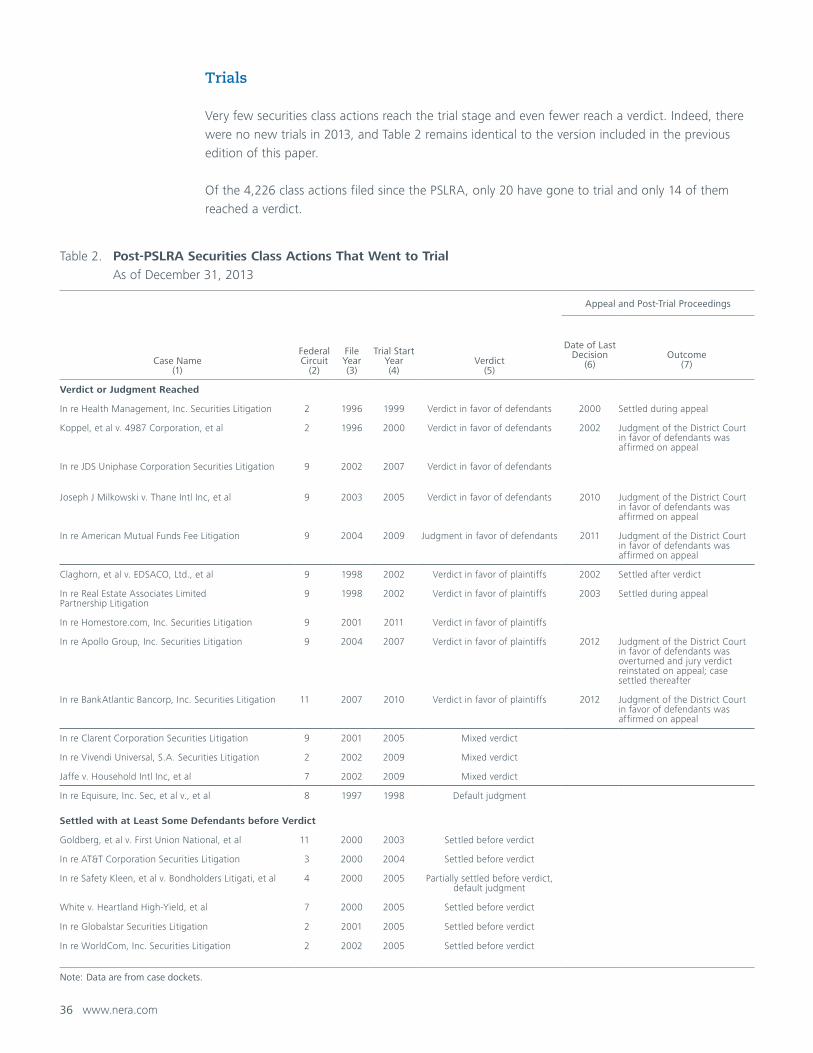
Trials
Very few securities class actions reach the trial stage and even fewer reach a verdict. Indeed, there
were no new trials in 2013, and Table 2 remains identical to the version included in the previous
edition of this paper.
Of the 4,226 class actions filed since the PSLRA, only 20 have gone to trial and only 14 of them
reached a verdict.
Table 2. Post-PSLRA Securities Class Actions That Went to Trial
As of December 31, 2013
Case Name(1)
Federal Circuit
(2)
FileYear(3)
Trial Start Year(4)
Verdict(5)
Appeal and Post-Trial Proceedings
Date of Last Decision
(6)Outcome
(7)
Verdict or Judgment Reached
In re Health Management, Inc. Securities Litigation 2 1996 1999 Verdict in favor of defendants 2000 Settled during appeal
Koppel, et al v. 4987 Corporation, et al 2 1996 2000 Verdict in favor of defendants 2002 Judgment of the District Court in favor of defendants was affirmed on appeal
In re JDS Uniphase Corporation Securities Litigation 9 2002 2007 Verdict in favor of defendants
Joseph J Milkowski v. Thane Intl Inc, et al 9 2003 2005 Verdict in favor of defendants 2010 Judgment of the District Court in favor of defendants was affirmed on appeal
In re American Mutual Funds Fee Litigation 9 2004 2009 Judgment in favor of defendants 2011 Judgment of the District Court in favor of defendants was affirmed on appeal
Claghorn, et al v. EDSACO, Ltd., et al 9 1998 2002 Verdict in favor of plaintiffs 2002 Settled after verdict
In re Real Estate Associates Limited Partnership Litigation
9 1998 2002 Verdict in favor of plaintiffs 2003 Settled during appeal
In re Homestore.com, Inc. Securities Litigation 9 2001 2011 Verdict in favor of plaintiffs
In re Apollo Group, Inc. Securities Litigation 9 2004 2007 Verdict in favor of plaintiffs 2012 Judgment of the District Court in favor of defendants was overturned and jury verdict reinstated on appeal; case settled thereafter
In re BankAtlantic Bancorp, Inc. Securities Litigation 11 2007 2010 Verdict in favor of plaintiffs 2012 Judgment of the District Court in favor of defendants was affirmed on appeal
In re Clarent Corporation Securities Litigation 9 2001 2005 Mixed verdict
In re Vivendi Universal, S.A. Securities Litigation 2 2002 2009 Mixed verdict
Jaffe v. Household Intl Inc, et al 7 2002 2009 Mixed verdict
In re Equisure, Inc. Sec, et al v., et al 8 1997 1998 Default judgment
Settled with at Least Some Defendants before Verdict
Goldberg, et al v. First Union National, et al 11 2000 2003 Settled before verdict
In re AT&T Corporation Securities Litigation 3 2000 2004 Settled before verdict
In re Safety Kleen, et al v. Bondholders Litigati, et al 4 2000 2005 Partially settled before verdict, default judgment
White v. Heartland High-Yield, et al 7 2000 2005 Settled before verdict
In re Globalstar Securities Litigation 2 2001 2005 Settled before verdict
In re WorldCom, Inc. Securities Litigation 2 2002 2005 Settled before verdict
Note: Data are from case dockets.
www.nera.com 37
Notes
1 This edition of NERA’s research on recent trends in
securities class action litigation expands on previous work
by our colleagues Lucy Allen, the late Frederick C. Dunbar,
Vinita M. Juneja, Sukaina Klein, Denise Neumann Martin,
Jordan Milev, John Montgomery, Robert Patton, Stephanie
Plancich, David I. Tabak, and others. We gratefully
acknowledge their contribution to previous editions as
well as the current one. The authors also thank David
Tabak for helpful comments on this version. In addition,
we thank current and past researchers in NERA’s Securities
and Finance Practice for their valuable assistance with
this paper. These individuals receive credit for improving
this paper; all errors and omissions are ours. Data for
this report are collected from multiple sources, including
RiskMetrics Group/Securities Class Action Services (SCAS),
complaints, case dockets, Dow Jones Factiva, Bloomberg
Finance L.P., FactSet Research Systems, Inc., SEC filings,
and the public press.
2 NERA tracks class actions filed in federal courts that
involve securities. Most of these cases allege violations
of federal securities laws; others allege violation of
common law, including breach of fiduciary duty as with
some merger objection cases; still others are filed in US
Federal court under foreign or state law. If multiple such
actions are filed against the same defendant, are related
to the same allegations, and are in the same circuit, we
treat them as a single filing. However, multiple actions
filed in different circuits are treated as separate filings.
If cases filed in different circuits are consolidated, we
revise our count to reflect that consolidation. Therefore,
our count for a particular year may change over time.
Different assumptions for consolidating filings would likely
lead to counts that are directionally similar but may, in
certain circumstances, lead observers to draw a different
conclusion about short-term trends in filings.
3 We have classified cases as credit crisis-related based on
the allegations in the complaint. The category includes
cases with allegations related to subprime mortgages,
mortgage-backed securities, and auction rate securities, as
well as some other cases alleged to involve the credit crisis.
Our categorization is intended to provide a useful picture
of trends in litigation but is not based on detailed analysis
of any particular case.
4 Note that Figures 5, 6, and 7 are not comparable to the
figure of filings by circuit, because these refer only to
10b-5 class actions, while the figure of filings by circuit
refers to all securities class actions.
5 For all countries other than China, we use the country of
domicile for the issuing company. Many of the defendant
Chinese companies, however, obtained their US listing
through a reverse merger and, consequently, report a US
domicile. For this reason, the Chinese counts also include
companies with their principal executive offices in China.
6 Note that in Figure 13 the percentages of federal cases in
which financial institutions are named as defendants are
computed on the basis of the first available complaint.
7 In Figure 14, we follow the protocol started in the edition
of Trends for 2012 and consider only the first available
complaints in analyzing accounting codefendants. Based
on past experience, accounting codefendants were added
relatively often to cases in subsequent complaints.
8 Most complaints include a wide variety of allegations.
Due to multiple types of allegations in complaints, the
percentages in Figure 15 could sum to more than 100%.
9 Cases for which investor losses are not calculated are
excluded from the statistics shown in this paper. The largest
excluded groups are IPO laddering cases and merger
objection cases.
10 These are cases in which the language of the docket or
decision referred to the motion being granted in its entirety
or simply “granted,” but not cases in which the motion was
explicitly granted without prejudice.
11 Moreover, it is possible that there are some cases that we
have categorized as resolved that are, or will in future, be
subject to appeal.
12 Unless otherwise noted, tentative settlements (those yet
to receive court approval) and partial settlements (those
covering some but not all non-dismissed defendants)
are not included in our settlement statistics. We define
“Settlement Year” as the year of the first court hearing
related to the fairness of the entire settlement or the last
partial settlement.
13 Here the word “dismissed” is used as shorthand for all
cases resolved without settlement: it includes cases where
a motion to dismiss was granted (and not appealed or
appealed unsuccessfully), voluntary dismissals, cases
terminated by a successful motion for summary judgment,
or an unsuccessful motion for class certification. The
majority of these cases are those where a motion to dismiss
was granted.
14 It is possible that not all our sources have updated the
dismissal status yet. Thus, more cases may have been
dismissed in 2013 than we include in our counts at present.
15 To compute the number of settlements between the
Amgen decision and the filing of Halliburton’s second writ
we have used the period March-August. For the average
number in the period 2005-2012 we have subdivided each
year in two periods January-June and July-December.
16 Note that Figures 22, 23, and 24 refer to 10b-5
settlements, while the other figures refer to securities class
actions (with the limitations explained in the footnotes of
each figure).
17 See footnote 13 for the definition of “dismissed.” The
dismissal rates shown here do not include resolutions for
IPO laddering cases, merger objection cases, or cases
with trial verdicts. When a dismissal is reversed, we
update our counts.
18 The settlement values that we report include plaintiffs’
attorneys’ fees and expenses in addition to the amounts
ultimately paid to the class.

About NERA
NERA Economic Consulting (www.nera.com) is a global firm of experts dedicated to
applying economic, finance, and quantitative principles to complex business and legal
challenges. For over half a century, NERA’s economists have been creating strategies, studies,
reports, expert testimony, and policy recommendations for government authorities and the
world’s leading law firms and corporations. We bring academic rigor, objectivity, and real
world industry experience to bear on issues arising from competition, regulation, public policy,
strategy, finance, and litigation.
NERA’s clients value our ability to apply and communicate state-of-the-art approaches clearly
and convincingly, our commitment to deliver unbiased findings, and our reputation for quality
and independence. Our clients rely on the integrity and skills of our unparalleled team of
economists and other experts backed by the resources and reliability of one of the world’s
largest economic consultancies. With its main office in New York City, NERA serves clients
from more than 25 offices across North America, Europe, and Asia Pacific.
Contacts For further information, please contact:
Dr. Renzo Comolli
Senior Consultant
+1 212 345 6025
Svetlana Starykh
Senior Consultant
+1 212 345 8931
The opinions expressed herein do not necessarily represent the views of NERA Economic Consulting
or any other NERA consultant.

Visit www.nera.com to learn
more about our practice areas
and global offices.
© Copyright 2014
National Economic Research
Associates, Inc.
All rights reserved.
Printed in the USA.