recent trends in car usage in advanced economies – slower ... · recent trends in car usage in...
TRANSCRIPT
Recent Trends in Car Usage in Advanced Economies – Slower Growth Ahead?Summary and Conclusions
09Discussion Paper 2013 • 09
Kurt Van Dender, Martin Clever International Transport Forum, Paris, France
Recent Trends in Car Usage in Advanced
Economies – Slower Growth Ahead?
Summary and Conclusions
ITF/OECD Roundtable on
Long-run Trends in Car Use Paris, 29-30 November 2012
Discussion Paper No. 2013-9
Kurt VAN DENDER
Martin CLEVER
International Transport Forum Paris
France
April 2013
THE INTERNATIONAL TRANSPORT FORUM
The International Transport Forum at the OECD is an intergovernmental organisation with
54 member countries. It acts as a strategic think-tank, with the objective of helping shape
the transport policy agenda on a global level and ensuring that it contributes to economic
growth, environmental protection, social inclusion and the preservation of human life and
well-being. The International Transport Forum organises an annual summit of Ministers
along with leading representatives from industry, civil society and academia.
The International Transport Forum was created under a Declaration issued by the Council
of Ministers of the ECMT (European Conference of Ministers of Transport) at its Ministerial
Session in May 2006 under the legal authority of the Protocol of the ECMT, signed in
Brussels on 17 October 1953, and legal instruments of the OECD.
The Members of the Forum are: Albania, Armenia, Australia, Austria, Azerbaijan, Belarus,
Belgium, Bosnia-Herzegovina, Bulgaria, Canada, Chile, China, Croatia, the Czech Republic,
Denmark, Estonia, Finland, France, FYROM, Georgia, Germany, Greece, Hungary, Iceland,
India, Ireland, Italy, Japan, Korea, Latvia, Liechtenstein, Lithuania, Luxembourg, Malta,
Mexico, Moldova, Montenegro, the Netherlands, New Zealand, Norway, Poland, Portugal,
Romania, Russia, Serbia, Slovakia, Slovenia, Spain, Sweden, Switzerland, Turkey, Ukraine,
the United Kingdom and the United States.
The International Transport Forum’s Research Centre gathers statistics and conducts
co-operative research programmes addressing all modes of transport. Its findings are
widely disseminated and support policymaking in Member countries as well as contributing
to the annual summit.
Discussion Papers
The International Transport Forum’s Discussion Paper Series makes economic research,
commissioned or carried out at its Research Centre, available to researchers and
practitioners. The aim is to contribute to the understanding of the transport sector and to
provide inputs to transport policy design. The Discussion Papers are not edited by the
International Transport Forum and they reflect the author's opinions alone.
The Discussion Papers can be downloaded from:
www.internationaltransportforum.org/jtrc/DiscussionPapers/jtrcpapers.html
The International Transport Forum’s website is at: www.internationaltransportforum.org
For further information on the Discussion Papers and other JTRC activities, please email:
This document and any map included herein are without prejudice to the status of or sovereignty over any territory, to the delimitation of international frontiers and boundaries and to the name of any territory, city or area.
RECENT TRENDS IN CAR USAGE IN ADVANCED ECONOMIES – SLOWER GROWTH AHEAD?
Summary and Conclusions — Discussion Paper 2013-9 — © OECD/ITF 2013 3
TABLE OF CONTENTS
1. INTRODUCTION ................................................................................................. 5
2. INDICATORS OF CHANGE IN AGGREGATE CAR USE VOLUMES ................................. 6
3. DIAGNOSIS ..................................................................................................... 11
3.1. Potential explanatory factors and ‘stylised facts’............................................ 11
3.2. Evidence and emerging explanations ........................................................... 13
4. LESSONS FOR POLICY AND PROJECTIONS ........................................................... 18
5. CONCLUSION ................................................................................................... 20
BIBLIOGRAPHY .................................................................................................... 21
Paris, April 2013

RECENT TRENDS IN CAR USAGE IN ADVANCED ECONOMIES – SLOWER GROWTH AHEAD?
Summary and Conclusions — Discussion Paper 2013-9 — © OECD/ITF 2013 5
1. INTRODUCTION
Over the past 10 to 15 years, the growth of passenger vehicle travel volumes has
decelerated in several high-income economies and, in some, growth has stopped or
turned negative. Drawing from work presented to and discussions at the ITF Roundtable
on long-run trends in travel demand, held in November 2012, this paper presents
evidence on known causes of this change in growth rates and discusses knowledge gaps,
hypothetical explanations and policy implications.
The economic recession and relatively high fuel prices explain part of the decline in the
growth of travel but not all of it. Slowing population growth, population ageing and
increasing urbanisation contribute to the change in passenger vehicle use in several
countries. There is evidence that car use growth has been reduced through policy
intervention, particularly in urban areas and sometimes at the national level. Research
also reveals remarkable changes in the intensity of car use within some socio-
demographic subgroups. Notably, car use per capita among young adults (men in
particular) has declined in several countries in recent years. It is as yet not entirely clear
why this decline occurs, with competing – or complementary – potential explanations
relating to attitudinal and lifestyle changes (e.g. starting a family at later age), to
unfavourable economic conditions for increasing numbers of young adults (e.g. rising
inequality and higher unemployment) and to increased availability of options other than
car use to participate in activities (e.g. more ubiquitous public transport, internet
shopping and socialising).
Understanding the determinants of aggregate volumes of passenger vehicle use, and
particularly of changes in the weight or the nature of such determinants, is of interest to
policy-makers and to industry. Designing mobility policies, including but not limited to
planning infrastructure development, requires forward-looking analysis of the demand for
mobility. If it turns out that the drivers of demand are changing, projection methods
need to be revised. The relevance of the issue is not limited to transport in a narrow
sense. If car use is likely to grow more slowly than in the past, this may affect decisions
on land-use and on environmental and climate change policy.
Mobility choices, including car ownership and use, appear to be changing but it is not
entirely clear why and explanations sometimes are place-specific. As a consequence,
confidence in projections of mobility and car use volumes is undermined and simple,
reduced form approaches based mainly on GDP and population further lose their appeal.
Rising uncertainty over mobility choices is exacerbated by rising uncertainty over the
future development of factors like household income. The rising uncertainty in forward
looking analysis needs to be acknowledged and if some policies are more robust to
uncertainty than others, such policies become relatively more appealing.
One emerging insight is that transport users are becoming more diverse, both in terms of
preferences for lifestyles and mobility and in terms of budgets. Some groups choose less
car-oriented lifestyles and the increased availability of other transport modes and online

RECENT TRENDS IN CAR USAGE IN ADVANCED ECONOMIES – SLOWER GROWTH AHEAD?
6 Summary and Conclusions — Discussion Paper 2013-9 — © OECD/ITF 2013
alternatives makes it easier for them to do this. However, in many (but not all1) cases
such choices require a relatively high level of affluence, for example because of relatively
high costs of living in urban centres and of choosing high speed rail and air travel as
substitutes for long-distance road travel. Other groups appear to adapt mobility patterns
out of necessity. Rising inequality and unfavourable economic conditions, including low
wages and high unemployment, restrain budgets for increasing numbers of households.
Rising costs of getting a driving license and of car insurance exacerbate these
constraints, perhaps most for young adults. The affordability of mobility is a rising
concern.
2. INDICATORS OF CHANGE IN AGGREGATE CAR USE VOLUMES
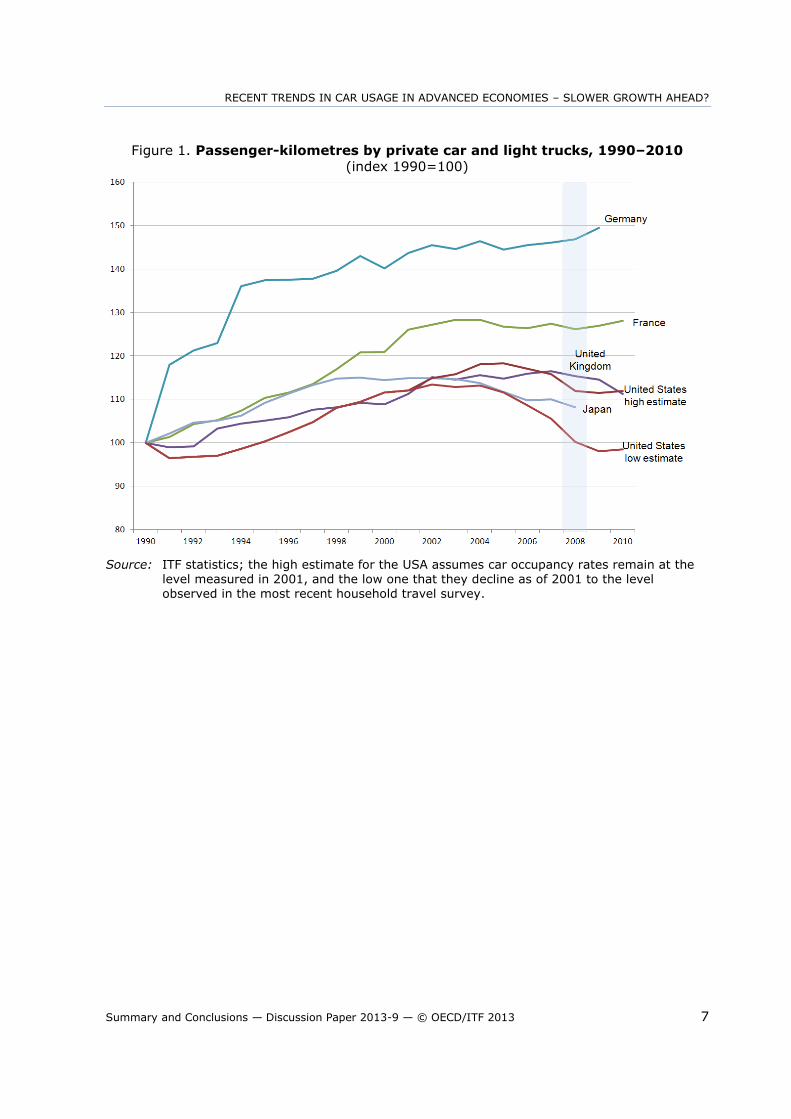
Figure 1 shows an index of passenger-kilometre volumes by car (and by light trucks
and/or vans where relevant) in five large high-income economies from 1990 through
2010. The slowdown in growth is clear in Germany. In France, car use is virtually
unchanged since 2003. In Japan, car use has been declining since 1999. In the United
Kingdom growth is negative since 2007 and it had slowed down considerably since 2003.
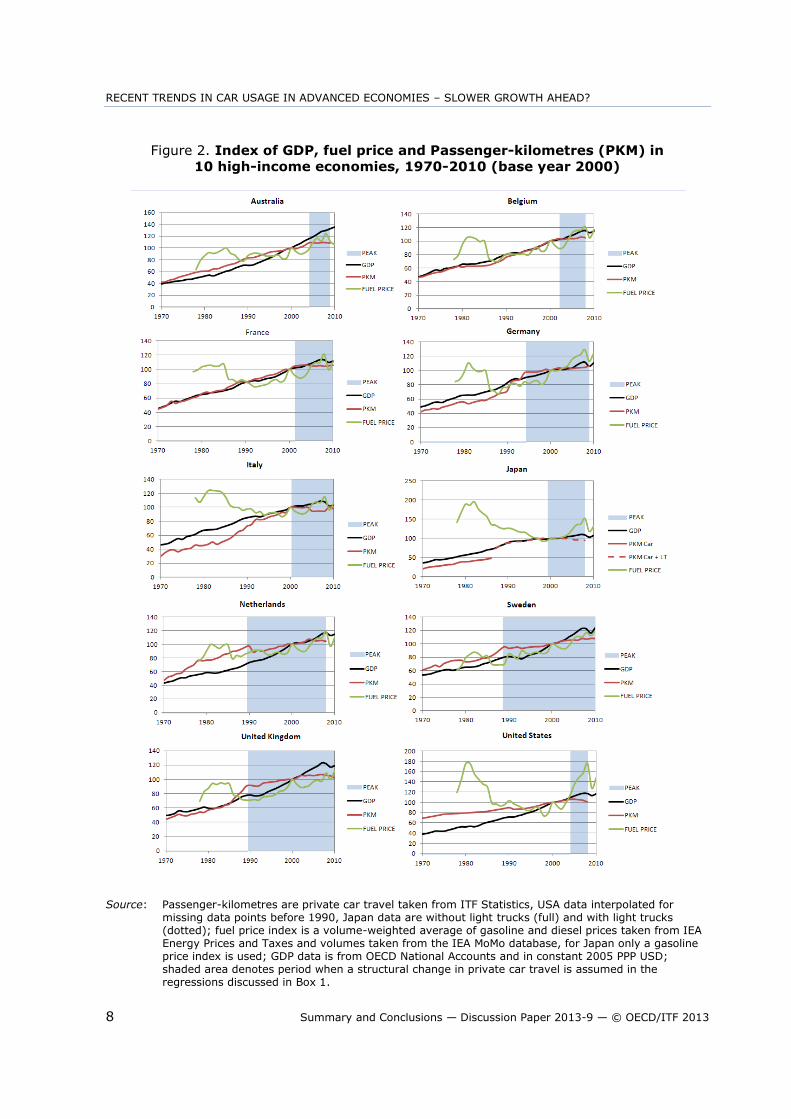
The USA displays a decline since around 2005 or even earlier.2 Figure 2 shows indexes
of car use, GDP and fuel prices for ten high income countries. Since the recession,
economic growth has strongly declined in most of the countries shown, and this most
definitely has negatively affected car use. However, the slowdown in car use volumes
started before the recession, so other factors are at play too. Higher fuel prices have
lead to reduced car use but do not account for the entire change in the growth pattern
either, as lower growth of car use preceded the strong rise in fuel prices in at least some
countries. Lower overall growth and fuel prices contribute to lower car use, but do not
explain it entirely. In the countries shown in Figure 2, the rule of thumb that car use
grows roughly as fast as GDP appears to be reasonable in the more distant past but it
seems to break down in the recent past, with the timing of the change differing between
countries. A quick econometric exercise, see Box 1, supports the interpretation of a
slightly weakening relation between GDP and driving, but not a strong decoupling. What
other factors than GDP and fuel prices are driving the change in car use growth? Section
3 sets out to answer this question. As will become clear, a diverse set of factors is
behind the aggregate slowdown in car use, and these factors are not well captured in a
simple GDP – fuel prices – car use logic. Key factors including population growth, ageing
and labour force participation are well understood, but other factors are less tangible and
less well described, but nevertheless potentially important.
1 For example, incomes in many U.S. city cores are relatively low, and more generally the sum of
commuting and housing costs in urban centres may not differ strongly from that in suburbs.
2 Two lines are shown for the USA, with the upper one assuming car occupancy rates remain at the level measured in 2001, and the lower one assuming they decline as of 2001 to the level observed in the most recent household travel survey. The true path likely is in between those two bounds.
RECENT TRENDS IN CAR USAGE IN ADVANCED ECONOMIES – SLOWER GROWTH AHEAD?
Summary and Conclusions — Discussion Paper 2013-9 — © OECD/ITF 2013 7
Figure 1. Passenger-kilometres by private car and light trucks, 1990–2010
(index 1990=100)
Source: ITF statistics; the high estimate for the USA assumes car occupancy rates remain at the level measured in 2001, and the low one that they decline as of 2001 to the level observed in the most recent household travel survey.
RECENT TRENDS IN CAR USAGE IN ADVANCED ECONOMIES – SLOWER GROWTH AHEAD?
8 Summary and Conclusions — Discussion Paper 2013-9 — © OECD/ITF 2013
Figure 2. Index of GDP, fuel price and Passenger-kilometres (PKM) in
10 high-income economies, 1970-2010 (base year 2000)
Source: Passenger-kilometres are private car travel taken from ITF Statistics, USA data interpolated for
missing data points before 1990, Japan data are without light trucks (full) and with light trucks (dotted); fuel price index is a volume-weighted average of gasoline and diesel prices taken from IEA Energy Prices and Taxes and volumes taken from the IEA MoMo database, for Japan only a gasoline price index is used; GDP data is from OECD National Accounts and in constant 2005 PPP USD; shaded area denotes period when a structural change in private car travel is assumed in the regressions discussed in Box 1.
RECENT TRENDS IN CAR USAGE IN ADVANCED ECONOMIES – SLOWER GROWTH AHEAD?
Summary and Conclusions — Discussion Paper 2013-9 — © OECD/ITF 2013 9
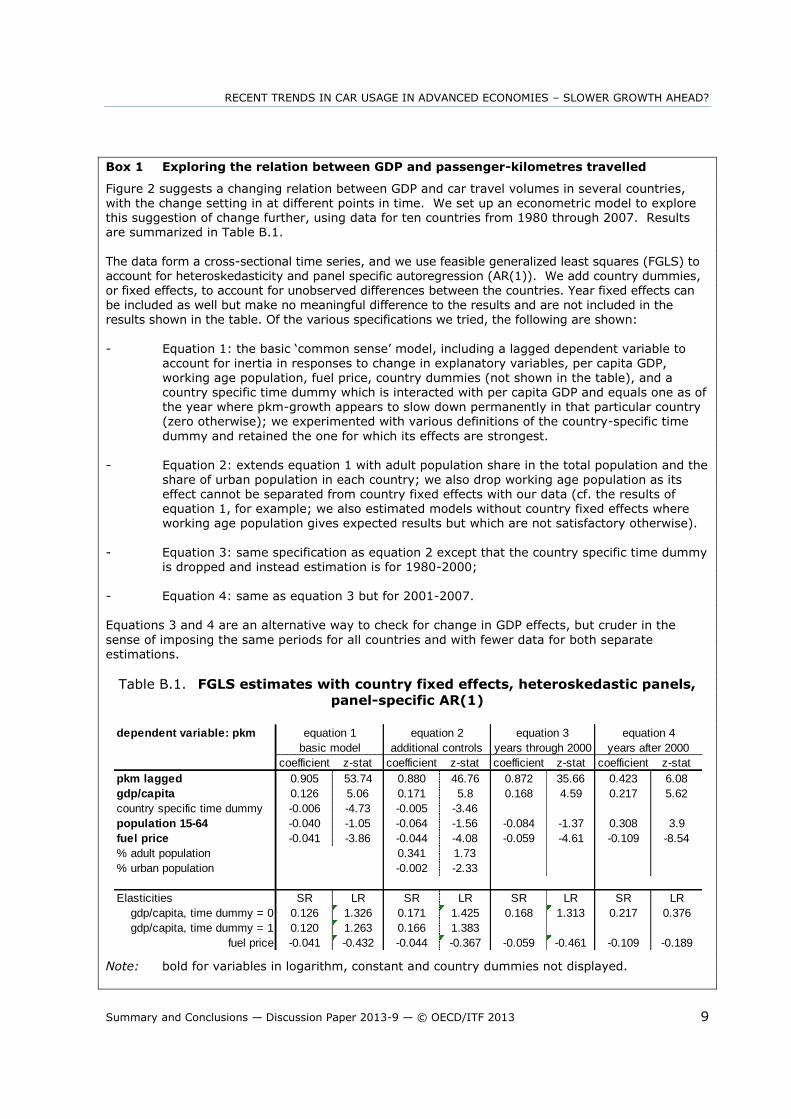
Box 1 Exploring the relation between GDP and passenger-kilometres travelled
Figure 2 suggests a changing relation between GDP and car travel volumes in several countries, with the change setting in at different points in time. We set up an econometric model to explore this suggestion of change further, using data for ten countries from 1980 through 2007. Results are summarized in Table B.1.
The data form a cross-sectional time series, and we use feasible generalized least squares (FGLS) to account for heteroskedasticity and panel specific autoregression (AR(1)). We add country dummies, or fixed effects, to account for unobserved differences between the countries. Year fixed effects can be included as well but make no meaningful difference to the results and are not included in the results shown in the table. Of the various specifications we tried, the following are shown:
- Equation 1: the basic ‘common sense’ model, including a lagged dependent variable to account for inertia in responses to change in explanatory variables, per capita GDP,
working age population, fuel price, country dummies (not shown in the table), and a country specific time dummy which is interacted with per capita GDP and equals one as of the year where pkm-growth appears to slow down permanently in that particular country (zero otherwise); we experimented with various definitions of the country-specific time
dummy and retained the one for which its effects are strongest. - Equation 2: extends equation 1 with adult population share in the total population and the
share of urban population in each country; we also drop working age population as its effect cannot be separated from country fixed effects with our data (cf. the results of equation 1, for example; we also estimated models without country fixed effects where working age population gives expected results but which are not satisfactory otherwise).
- Equation 3: same specification as equation 2 except that the country specific time dummy
is dropped and instead estimation is for 1980-2000; - Equation 4: same as equation 3 but for 2001-2007.
Equations 3 and 4 are an alternative way to check for change in GDP effects, but cruder in the
sense of imposing the same periods for all countries and with fewer data for both separate estimations.
Table B.1. FGLS estimates with country fixed effects, heteroskedastic panels,
panel-specific AR(1)
Note: bold for variables in logarithm, constant and country dummies not displayed.
dependent variable: pkm
coefficient z-stat coefficient z-stat coefficient z-stat coefficient z-stat
pkm lagged 0.905 53.74 0.880 46.76 0.872 35.66 0.423 6.08
gdp/capita 0.126 5.06 0.171 5.8 0.168 4.59 0.217 5.62
country specific time dummy -0.006 -4.73 -0.005 -3.46
population 15-64 -0.040 -1.05 -0.064 -1.56 -0.084 -1.37 0.308 3.9
fuel price -0.041 -3.86 -0.044 -4.08 -0.059 -4.61 -0.109 -8.54
% adult population 0.341 1.73
% urban population -0.002 -2.33
Elasticities SR LR SR LR SR LR SR LR
gdp/capita, time dummy = 0 0.126 1.326 0.171 1.425 0.168 1.313 0.217 0.376
gdp/capita, time dummy = 1 0.120 1.263 0.166 1.383
fuel price -0.041 -0.432 -0.044 -0.367 -0.059 -0.461 -0.109 -0.189
equation 1 equation 2 equation 3 equation 4
basic model additional controls years through 2000 years after 2000
RECENT TRENDS IN CAR USAGE IN ADVANCED ECONOMIES – SLOWER GROWTH AHEAD?
10 Summary and Conclusions — Discussion Paper 2013-9 — © OECD/ITF 2013
The regression results are as follows:
- Taking account of autoregression is relevant as expected (see pkm lagged coefficients).
Experiments with alternative estimation techniques show that the data allow distinguishing between auto-regression and autocorrelation, with the AR(1) coefficient around 0.11.
- The short-run elasticity and the lag are estimated with enough precision to obtain
significant elasticity estimates, in all equations. GDP elasticities of pkm are well above 1 in the long run, for equations 1 and 2 (see lower half of table). In equation three (‘early period’), the long run elasticity is 1.313, and in the recent period it is 0.376. This suggests a strong decline in the income elasticity of pkm, in line with what visual inspection of Figure 2 suggests for at least some countries. However, this result comes about through the strongly reduced lagged effect, as the short run elasticity estimate
actually has increased.
- Equations 1 and 2 identify a significant change in the elasticity as well, through the
country specific dummy. However, the change is economically small, as can be seen in the lower half of the table (e.g. in equation 2 the long run elasticity is 1.425 initially and 1.383 more recently).
- The long run fuel price elasticity is -0.432 in equation 1 and -0.367 and is precisely estimated in both cases. The orders of magnitude are in line with literature, though perhaps on the high side. Equation 4 shows a much lower elasticity. It is possible that the role of fuel prices is not well identified in these equations and that this helps explain the differing role of income in them (e.g. the strong decline in income effects is really a fuel price effect).
- The effect of the share of working age population and of urban dwellers is not precisely estimated in the second equation, but signs are as expected.
To conclude, if the results of equations 3 and 4 on the changing income effect were robust, the
models of equations 1 and 2 should reproduce them more strongly than they in fact do, because the country-specific dummies allow more flexibility in changing GDP effects than the models of
equations 3 and 4. Hence, we find evidence for a small decline in income elasticities, but not of the order of magnitude that a quick glance at Figure 2 would suggest. We do not interpret this as conclusive regarding the absence of such a strong change. Instead, it seems to us that an aggregate model focusing on GDP effects and fuel prices is too crude to capture the diversity and various dynamics underlying aggregate car travel demand and how it changes – a conclusion that is strongly supported by the discussion in Sections 3 and 4.
RECENT TRENDS IN CAR USAGE IN ADVANCED ECONOMIES – SLOWER GROWTH AHEAD?
Summary and Conclusions — Discussion Paper 2013-9 — © OECD/ITF 2013 11
3. DIAGNOSIS
3.1. Potential explanatory factors and ‘stylised facts’
The growth rate of passenger vehicle travel (vehicle-kilometers) has declined in several
rich countries, and has dropped to zero or turned negative in some. Aggregate
passenger vehicle travel is the sum of car use in a large number of ‘markets for
passenger vehicle travel’, where in principle a market can be defined for every situation
for which a sensible demand and cost relation is conceivable. For example, the market
for morning peak hour commuting by car in a given city can be distinguished from the
market for morning peak car use for other purposes, and from off-peak travel, and from
car use in other cities and non-urban areas, etc. Analysing changes in demand
(willingness to pay at given incomes) and costs (of access to a car, the costs of which are
joint between markets, fuel, and time) would establish why quantities demanded in these
markets change. Combined with information on the size of the markets, the change in
the aggregate outcome could then be reconstructed.
In practice, many studies implicitly apply the logic just outlined, but the resolution to
which the analysis can be refined is limited by data availability. Aggregate travel is
defined as the sum of travel by groups defined through a set of socio-demographic
characteristics (age, gender, income, employment and education, urban or not, etc.).
Data constraints impose the assumption that households or individuals in these groups
are rather similar, even though the various characteristics are frequently considered
separately rather than simultaneously, and even though recent work on travel choices
suggests that unobserved heterogeneity is considerable even in the most sophisticated
studies. Most analyses define individuals as the basic unit, and travel-per-capita as the
basic measure, and then consider changes in travel patterns within the group. Change in
the sizes of groups to which individuals belong depend on the evolution of demographic,
socio-demographic, and economic variables used to distinguish groups. These variables
are exogenous to the analysis, which of course does not mean that their future path is
necessarily known with a high degree of confidence.
The impact of socio-demographic characteristics on travel demand, and the change in
that impact, can be described with a set of ‘stylised facts’, which are generalizations and
simplifications of empirical observations that are not valid for all specific cases but that
are intended to capture average or modal regularities. It is important to distinguish
stylized facts from hypothetical explanations, and case-specific analysis and policy
development requires careful consideration of their applicability. Section 3.2 reviews
case-specific work in more detail. The following stylized facts are mostly useful as
starting points for detailed empirical analysis:
Age: driving first rises and then declines with age. When people retire they
significantly reduce their annual mileage, typically by about half, and annual
mileage tends to decline as they age further. As a result, there are likely to be
large reductions in vehicle travel as the Baby Boom generation ages. Although
they drive more than past cohorts did in retirement (because license-holding and
car-oriented attitudes are more common in these cohorts and because they are on
RECENT TRENDS IN CAR USAGE IN ADVANCED ECONOMIES – SLOWER GROWTH AHEAD?
12 Summary and Conclusions — Discussion Paper 2013-9 — © OECD/ITF 2013
average healthier at higher age than older cohorts), they still significantly reduce
their vehicle travel. Older adults now drive more than older adults in the past,
but this effect is likely to phase out in the future. Conversely, the increase of
driving at younger age is slower and smaller for younger cohorts, a phenomenon
that is only partly understood.
Gender: men on average drive more than women, but the difference is declining
as car use in some cases declines among men, and rises among women.
Furthermore, in some places the role models that partly determine mobility
patterns are converging.
Income: higher disposable incomes usually translate into more mobility and more
car use3, but the rate of increase declines at high incomes and apparently car use
sometimes is lower for the most affluent than for lower income groups. Zero or
negative growth at very high incomes can be the result of substitution towards
faster transport modes, lower-mobility location choices (e.g. expensive downtown
locations), of low or zero additional benefits from more mobility (saturation), or of
the opportunity costs of spending more time in transport becoming very high.4
Saturation of aggregate vehicle ownership and travel: during the Twentieth
Century, vehicle ownership and travel grew from virtually zero in 1900 to high
levels which may be close to saturation levels in most developed countries by
2000. These levels vary from one geographic area to another (neighborhood,
urban region, country, etc.) due to factors including the quality of transport
options, transport pricing and land use development patterns.
As affluence rises, proportionally more travel is for leisure purposes. Such travel
may be more car-oriented than commuting because of stronger spatial dispersion
of destinations and hence lower availability of public transport. Non-commuting
travel also is more price-elastic, so may change strongly as time and money costs
of using cars increase.
Employment and education: working tends to involve commuting and often car
use, whereas schooling is associated with lower car use. Rising female labor force
participation has translated into increased car use, but the rate of the increase in
participation declines so this effect may diminish in the future. Increased take-up
of opportunities for higher education has a negative effect on car use. This effect
too can weaken as take-up of higher education grows more slowly.
Access to cars: individuals can have access to one or several cars owned by the
household they belong to, or to a company car, or via car sharing systems, and
these accessibility conditions affect the intensity of use. Access to cars requires
holding a driving license, and license-holding becomes more difficult with more
stringent regulations and rising costs. Driving license holding is declining among
younger individuals in some countries, whereas it increases for older age groups.
3 Mobility and car use are ‘normal goods’, in economic parlance. Note that cross-sectional and time-
series income effects can differ, so that evidence on differing effects in a cross-section do not necessarily apply when analyzing income growth over time.
4 An extreme case would be that there is a maximum to time individuals are prepared to spend in transport. Evidence for such a maximum is weak on the disaggregated level (Mokhtarian and Chen, 2004), and the more general case of rising opportunity costs is sufficient to explain declining income effects.
RECENT TRENDS IN CAR USAGE IN ADVANCED ECONOMIES – SLOWER GROWTH AHEAD?
Summary and Conclusions — Discussion Paper 2013-9 — © OECD/ITF 2013 13
Access to company cars, and sometimes to cheap fuel, has risen in some
advanced economies, presumably as a response to the high fiscal burden on
labor. Since users are not directly confronted with marginal costs, this trend
translates into higher car use. More recently, fiscal distress leads to partial
dismantling of the favorable treatment of company cars and their use, with lower
usage as a consequence.
Location: car use is higher where density is lower and is particularly low in urban
cores, because there are more destinations per unit distance and because
alternatives to cars are more commonly provided.
Access to alternative transport modes: as other modes become more ubiquitous
and/or cheaper, car use declines. Urbanisation is associated with less car use
because with higher density more destinations are accessible per unit of
distance, which leads to shorter driving distances and makes other modes (public
transport, walking and cycling) relatively more appealing. Furthermore, public
transport availability often is higher in denser areas. Mobility policies in several
urban areas are becoming less accommodating to car use, with appreciable
reductions in road and parking space and increased support for alternative
transport modes.
Immigration: increasing shares of foreign born inhabitants lead to lower car
mobility (controlling for income and predominantly urban location choice),
perhaps partly because of habits, and because visiting friends and relatives in
faraway places is less easily done by car (and more by plane or train); the
changing geography of friendship and the associated mobility choices take place
to a lesser extent outside immigrant communities as well.
3.2. Evidence and emerging explanations
Several studies report on similarities (but not simultaneity) in aggregate trends in car
use in a number of high-income economies, see for example Millard-Ball and Schipper
(2011), ITF (2011), but systematic comparisons on a disaggregated level are scarce
(see, however, Newman and Kenworthy, 2011). However, disaggregation is
indispensable as aggregate outcomes are the result of change in opposite directions and
not of an overriding common factor. Kuhnimhoff et al. (2012) provide a systematic
comparison of six countries (France, Germany, Great Britain, Japan, Norway, USA) on
the basis of travel survey data from around 1995 and 2005.5 Their main findings are as
follows:
In itself, population ageing has a negative impact on car travel in all studied
countries, and most strongly so in Japan and Germany.
However, the negative effect of ageing is counteracted by the increase in car
ownership at higher age in all studied countries except for the USA. In France,
the UK and Japan, this compensating positive effect is larger than the negative
effect of pure ageing, meaning that travel per capita rises. In Germany the two
effects cancel out. The difference between the USA and the other countries
probably is related to earlier mass motorization, so that the rise in ownership at
5 Although not apparent from this review, establishing comparability between the national travel
surveys of the six countries is a major contribution of the study.
RECENT TRENDS IN CAR USAGE IN ADVANCED ECONOMIES – SLOWER GROWTH AHEAD?
14 Summary and Conclusions — Discussion Paper 2013-9 — © OECD/ITF 2013
higher age took place earlier there, with as a consequence a smaller upward effect
on driving now. Kuhnimhoff et al. (2012) hypothesize that this difference is key in
explaining the larger drop of car use in the USA compared to the other countries
studied. Dejoux et al. (2009) suggest that the USA pattern is general to North
America and differs from the European one.
Car ownership among young adults has declined in Norway, the UK, Germany,
and the USA. It increased, by contrast, in Japan. In the middle age groups, there
were declines in Germany and the USA and increases elsewhere.
Reduced car use among young adults is key to explaining the aggregate pattern in
Germany, the UK, and Norway, in the sense that without this change and all else
equal there would have been no decline or even an increase in car travel in those
countries. This conclusion does not apply to France, Japan.
The effect of mode choice differs between countries. In Germany and the UK,
modal shifts away from the car contribute strongly to reduced car use. In Japan
the effect is small, and in France and Norway there was a shift in the reverse
direction.
In short, these results emphasize the importance of compositional effects in explaining
aggregate car use, they reveal heterogeneity among countries, and show the need for
better understanding car use among young adults. We summarize findings from some
country-studies against this background.
Taking all modes together, distances traveled per person in Great Britain leveled off
around 1998 and declined in 2007. Trip distances rose while the number of trips fell.
Rail travel has increased strongly. For car use, the number of trips, their length, and
occupancy rates, were roughly constant from 1995 through 2007. A comparison of
British travel survey data of 1995, 2000-02 and 2005-07 (Le Vine and Jones, 2012)
reveals that the limited change in average car driving per capita over the period is the
result of a strong decline in men’s travel (reduced mileage among drivers, not fewer
drivers) and an increase in women’s license-holding and travel (although car use for men
remains about twice as high as for women).6 Travel declined most for the youngest men,
was stable for men aged 50 to 59, and rose most for the oldest. For women aged 20 to
29 travel was stable, and it increased most strongly for the oldest. There also is
evidence that persons born outside the UK travel less than those born in the UK,
although other characteristics (living in London, gender) explains part of that difference.
The decline of car driving over time is visible in all income brackets except the lowest,
and is stronger as income is higher. Nevertheless, higher incomes remain associated
with more driving. The largest decline in car travel is for shopping and visiting friends
and relatives, which some see suggestive of a change induced by choice (perhaps
facilitated by the rising availability of online alternatives to travel) but which also could
be the result of tighter budget constraints.
Remarkably, with the exception of men in their twenties, the decline in men’s travel is
largely explained by a drop in company car use, a phenomenon very likely caused by the
less favorable fiscal treatment of fuel use for company cars. The decline of company car
use can explain the entire leveling off of car driving since the 1990s. It is plausible that
the company car effect is concentrated among higher incomes, so that the stronger
decline in driving at higher incomes is at least partly the same company car effect. The
largest reductions in company car use are among professionals and employers or
managers. Car travel also fell in London.
6 Le Vine and Jones (2012) note that most road traffic growth since the 1990s comes from higher van
traffic, an observation for which the causes merit further exploration.
RECENT TRENDS IN CAR USAGE IN ADVANCED ECONOMIES – SLOWER GROWTH AHEAD?
Summary and Conclusions — Discussion Paper 2013-9 — © OECD/ITF 2013 15
Company car use and the London case apart, there has been no decline in travel among
those aged 30 and above. The decline of car travel of men aged 20 to 29 is large –
about 1,800m/year, and is mostly attributable to personal car use (the share of company
cars in this age bracket is small). Half of the decline is due to fewer people driving, and
half to reduced mileage by drivers. About one third of the decline is for trips to visit
friends and relatives. It is as yet unclear whether this decline reflects postponement of
car use to a later age or whether lower car use will persist in this cohort.
In the Netherlands, total car-kilometers by drivers leveled off starting in 2005, and car-
kilometers by passengers declined. Car ownership kept rising and so did license-holding
except for 25 – 29 year olds. Van der Waard et al. (2012) suggest this points to very
weak signs of saturation at best. Mobility among young adults fell, notably for 18 – 29
year olds (as of 1995) and more moderately for 30 – 39 year olds (as of 2005). This is
both because of group size and because of changes in group behavior. Across modes,
men aged 18 – 29 travelled 16% less in 2009 than in 1995 while women travelled 6%
more (but their travel as car passengers declined). These changes appear to be linked to
strong reurbanisation and to a rising share of students and declining share of workers in
this age bracket. In the Netherlands, public transport is very cheap for students, and
this group represents a third of public transport patronage. Change in this policy, which
is contemplated for 2015, might have a substantial affect on students’ travel choices.
The status of car ownership remains high among young adults but it is not known if it
nevertheless fell compared to earlier cohorts. There is no evidence of a shift in
preferences for cars towards smartphones or tablet computers. The Dutch do travel
more abroad, particularly by plane, but the share of international travel in total travel is
too small for this to explain the decline in national mobility.
For the USA, Davis et al. (2012) emphasize the role of young adult’s travel choices in
explaining the observation that per capita car travel started declining in 2004, and is now
6% below its highest historical level. Household travel survey data show that per capita
car travel in the age group 16 to 34 fell by 23% between 2001 and 2009, with the
number of trips per driver declining by 15% and the average trip distance by 6%. The
share of 14 to 34 year olds without a license increased from 21% to 26% over the same
period. Increased use of other modes (walking, cycling, and public transport) suggests
a degree of substitution, and this substitution is facilitated by increased urban living.
However, substitution by other modes is not very strong, so that the reduction in travel
by young adults is strong. Furthermore, travel at higher age is not growing very strongly
anymore in the USA (as travel-intensive habits permeated earlier in the USA than
elsewhere). In the aggregate, the result is particularly strong decline in car travel
growth compared to other countries.
Survey evidence supports the view that technology and social media are seen as
substitutes for physical travel, particularly among the young. Barriers to driving,
including high gas prices and tougher licensing laws, matter too. Lower incomes explain
part of the decline as well, but likely not enough to expect a turnaround in travel choices
if and when income growth picks up. In short, Davis et al. (2012) and Puentes (2012)
see sufficient evidence to hypothesize that there is an enduring trend to lower car use.
Puentes (2012) argues that the economic development model in the USA is transitioning
from a consumption-oriented approach to one that relies more on production and
exports. Growth is increasingly concentrated in metropolitan areas, and within these
areas real estate development and land-use patterns are changing, with less urban fringe
and car-oriented development. This contributes to slower growth in car use (but perhaps
stronger growth in freight traffic).
RECENT TRENDS IN CAR USAGE IN ADVANCED ECONOMIES – SLOWER GROWTH AHEAD?
16 Summary and Conclusions — Discussion Paper 2013-9 — © OECD/ITF 2013
For France, Madre et al. (2012) emphasize contrasting developments between large
urban areas and less dense regions. In large urban areas, fewer car trips were made per
head in 2008 than in 1994 and they were of shorter duration. The transition from a
double to a single commute per workday appears to explain a considerable part of that
change. Car ownership declined, and there was a slight decline in license-holding among
young adults (at least partly because of the abolition of compulsory military service).
These changes took place irrespective of income levels. Fuel prices increases around
2000 play a role in explaining the declining growth rate, although in greater Paris the
decline started well before 2000, and earlier at higher income levels. In lower density
regions, there are more cars and they are used for longer trips. The slowdown to zero of
car use growth is expected in these regions too, but car use will remain higher.
Currently, data do not allow distinguishing between a ‘delayed rise car use among
younger adults’ and ‘permanent reductions of car use among currently young cohorts’.
Distances travelled in Japan by air, rail, and car started a gradual decline in 2004, see
Hyodo (2012). Car-kilometers fell as of 1999, as a result of shorter trips and despite an
increase in the number of trips and of passengers. Low growth, translating particularly
into rising numbers of low income households, and high gas prices drive part of this
evolution. Other changes, including later age of marriage, smaller households, and of
course population ageing and a decline of the total population (since 2009) work in the
same direction. There are relatively fewer younger drivers in more recent years, and the
relative decline of younger female drivers is particularly pronounced. Travel in the Tokyo
conurbation is still on the rise, partly driven by a larger population.
To summarize, the decline in growth rates of passenger car use is the result of group size
effects and within group changes. The relative importance and sometimes the direction
of the effects differ between countries, and country-specific effects matter. There are
similarities between countries, but they are not strong enough to generate simultaneity.
Furthermore, strong disparities occur within countries, notably between the largest cities,
other cities, and rural regions. Population ageing and low or negative population growth
have negative effects on mobility growth, although growing car access and use among
older cohorts puts a brake on this effect up to now, except in the USA. Access to cars
and car use among young adults declines in several countries (among the six countries
analysed by Kuhnimhoff et al. 2012, France and Japan are the only countries where
young adults do not contribute to declining car use), and it is not clear to what extent
this is a transitory or a permanent change. Apart from the USA, where it was high to
begin with, there are no strong indications that the status of the car has waned. Gender
differences in car use and broader mobility patterns appear to be declining.
Urbanization has a negative effect on car use in several countries, and contrasts in
mobility patterns between large metropolitan areas and less dense cities and rural areas
appears to be sharpening. Increasing participation in higher education plausibly leads to
– at least – a delay in taking-up car-intensive mobility habits. Correspondingly, if this
increase phases out, the downward effect on car use declines. More generally, car-
intensive lifestyles appear to occur later in life more often, which would mean that lower
car use at younger age is partly a persistent effect to the extent that the lifestyle change
is persistent. Higher incomes lead to more car use, although at high incomes the effect
appears to be weaker and may even turn negative. However, the causes of this declining
income effect are unclear: rising opportunity costs of spending time in transport may
matter, there can be substitution to other (faster and more expensive) modes, but there
can also be confounding with high-density location choices and reduced appeal of
company cars.
RECENT TRENDS IN CAR USAGE IN ADVANCED ECONOMIES – SLOWER GROWTH AHEAD?
Summary and Conclusions — Discussion Paper 2013-9 — © OECD/ITF 2013 17
The available evidence provides insight into characteristics that are correlated with car
use, and on how the role of these characteristics changes over time and is place-specific.
But insight into cause and effect remains limited, because characteristics are often
considered in isolation whereas they ideally should be considered simultaneously (e.g.
income and location, company car access and income). Also, characteristics may be
related with underlying variables rather than being explanatory in themselves. For
example, reduced car use among young adults can be the consequence of changing
attitudes and/or of declining disposable income among subgroups of young adults. It is,
in other words, not entirely clear to what extent the change in travel is mostly the result
of choices or of constraints. Both likely play a role, and rising heterogeneity within the
young adult population may mean that for some subgroups constraints dominate and for
others choice is the main driving factor.
The impact of IT applications on car and other travel remains unclear. Several effects, in
different directions, are plausible: a shift away from cars as other modes allow online
activity more easily, lower travel demand following the emergence of IT-enabled
alternatives to traditional vehicle ownership (e.g. car-sharing), a reduction in travel
demand as some activities no longer necessarily require physical travel, increased
availability of cars for other purposes as telecommuting rises, rising average trip
distances as location farther away from physical travel destinations now is less costly,
etc. The net effect on travel is unclear in principle, and available evidence is
inconclusive. It was pointed out that much of the evidence appears outdated, and
updating it is of considerable interest, not least because newer IT-induced innovations
likely have qualitatively different effects from earlier ones. The earlier generation of
research focused on home-based personal computing, whereas the dominant recent
trend is for multi-instrumental portable mobile internet access, which changes usage
patterns and potentially interactions with mode-choice. Also, changing choice sets do not
necessarily lead to changing choices, but do create larger scope for change if behavioral
incentives (e.g. prices of car use) change and if preferences change (e.g., the distribution
of family relations and friendships has become more geographically dispersed, partly
because of immigration, and this affects what social connectivity models are chosen).
Another example concerns the impact of urban living on car use. To what extent is the
negative effect on car use the result of self-selection? If individuals or households that
prefer high-density and low car-use lifestyles are disproportionally present in urban
areas, then measured effects of urban living should not be expected to be equally large if
other individuals or households, with different preferences, move to urban areas (see, for
example, Golob and Brownstone, 2009, and Kim and Brownstone, 2010). Furthermore,
transport choices in urban areas are affected by policies. Increasing numbers of cities
are adopting less car-oriented transport policies, and this discourages car use. The point
here is not to evaluate the merits of such policies, but simply to acknowledge that car-
use choices are contingent on policies, not just on drivers’ characteristics and
preferences. Data limitations make it difficult and often impossible to evaluate the
relative importance of such competing or complementary explanations, and this in turn
means that projections on the basis of current observations of decline are subject to high
uncertainty – uncertainty that needs to be acknowledged.
RECENT TRENDS IN CAR USAGE IN ADVANCED ECONOMIES – SLOWER GROWTH AHEAD?
18 Summary and Conclusions — Discussion Paper 2013-9 — © OECD/ITF 2013
4. LESSONS FOR POLICY AND PROJECTIONS
Aggregate car use is the result of location and travel choices made by a diverse set of
(potential) car users. These choices depend on preferences, incomes, and prices of
various transport options and alternatives to travel. Preferences are subject to change,
and there are signs that car use is less of a priority in groups preferring urban lifestyles
and more reliant on online networks. Income growth is now less-self evident with rising
inequality and weaker growth prospects in many OECD economies. Prices are partly
determined in markets and partly depend on transport policies broadly defined, where
the latter now often are less favorable to car use than before. Together with ageing and
saturation of access to cars, these changes contribute to slower growth of car use. They
also reflect increasing heterogeneity among potential car users. Whereas car ownership
and use was a common aspiration for most, and an aspiration that was satisfied for
increasingly many, it has become a somewhat less universal goal, and perhaps one that
is more difficult to reach for some.
Aggregate car travel is a variable of some policy interest, as it is roughly indicative of a
country’s resource needs for car transport (including road and parking infrastructure,
energy, etc.), of environmental and climate change impacts, and of the sector’s tax
revenue generating capacity. Aggregate travel is particularly relevant for gauging
investment needs when transport and economic growth are high and networks are under
development, as it provides an indication of overall resource needs. In more mature
economies, decisions on where and how to invest in infrastructure or are driven less by
overall growth than by specific needs in the network. It is, for example, anything but
obvious that slower growth in aggregate car use changes the case for relieving current
bottlenecks.
The relevance of the analysis discussed above then is more in the message that
disaggregation is needed to understand change, and that local patterns can diverge from
the aggregate trend. The priority is not to establish with maximal confidence whether
aggregate travel will grow, stagnate, or decline, but to understand drivers of growth
better. The keywords here are rising heterogeneity and rising uncertainty. Rising
heterogeneity means that travel choices are less well predicted by basic socio-economic
characteristics. Since choices are harder to predict, projections are subject to rising
uncertainty. Deciding on policy is more difficult in a more uncertain environment. Policies
that are robust to uncertainty, i.e. that make sense in the widest possible set of possible
outcomes, gain in appeal, and identifying such policies is of key interest.
Goodwin (2012) argues that the broad class of ‘smart’ and less car-oriented mobility
policies fares better than standard policies that can be characterized as accommodating
towards car usage aspirations. At any rate, the need to select policies that consider
overall benefits (‘balanced mobility policies’) rather than focusing on direct user benefits
is strengthened by the rise in uncertainty. Appraisal, in the form of comprehensive cost-
benefit analysis of policy strategies rather than just projects, is instrumental to such an
policy approach. Of course, the case for such policies is not contingent on any particular
pattern of development of car use, but on the need to align individual travel aspirations
and choices with their social costs and benefits. This does not mean that the observed
RECENT TRENDS IN CAR USAGE IN ADVANCED ECONOMIES – SLOWER GROWTH AHEAD?
Summary and Conclusions — Discussion Paper 2013-9 — © OECD/ITF 2013 19
changes are irrelevant to the debate. First, to the extent that user preferences diverge
less from what is socially beneficial, as is the case according to some readings of the
observed change in aggregate car travel, implementing balanced mobility policies will
meet with less resistance. Second, there are several indications that, apart from a
possible change in preferences, behavioral change now is easier given the changing
nature of travel (a larger share of non-work trips, for which own- and cross-price
elasticities may be larger) and the increased availability of alternatives (more public
transport, more cheap air travel, more online activities, etc.).7 Such changes may
translate into more flexibility in travel choices, so that higher prices for car travel result
in larger declines of that travel. This suggests that pricing reforms (more efficient road,
parking, fuel and insurance pricing, and less favorable company car policies) can be more
effective at reducing vehicle travel and encouraging use of alternative modes, and road
tolls will generate less revenue than assumed in many travel models (see e.g. Williams-
Derry, 2011). It was noted that in an ageing population the demand for travel changes,
but also the weight of the elderly in decision-making rises, and this may lead to mobility
policies that align more with their needs and preferences.
Revenues needed for maintaining the integrity and quality of current road networks, let
alone of upgrading them, do not diminish in proportion to slower growth of network
usage. If transport infrastructure is to be funded from user charges, slower or zero
traffic growth will need to be accompanied by increasing charges (especially if user
charges are mainly fuel taxes and fuel economy improves, as is clear from the current
experience in the USA). If funding is from general revenue, transport tax revenues will
grow more slowly or stagnate, unless rates are raised and/or new taxes introduced. In
either case, the possibility of prolonged slow growth of car use volumes adds to the
already considerable set of arguments for reforming the funding basis for transport
infrastructure.
The discussion up to now has focused on high-income economies. In developing
economies, the rule of thumb that mobility and in particular car use will develop in line
with GDP as long as policies do not point strongly in the opposite direction, remains
broadly applicable. Furthermore, strong natural population growth and rural migration to
cities where motorization is often twice that of rural areas due to higher incomes, will
induce pressure towards higher motorization. Possibly, attitudinal changes related to
availability of online activities could curb growth at an earlier stage than in high income
economies, and faster urbanization leading to congestion can reduce growth in car use.
However, this curbing effect will not necessarily materialize in the absence of policies that
disincentivize car use. Balanced mobility policies conceivably could induce leveling off of
car use at lower per capita car use volumes than are observed in currently high income
economies (see also Litman, 2012b). Providing public transport is not enough for this –
car use itself needs to be regulated through appropriate prices, and land-use policy. And
even when car use is inconvenient because of high congestion and high purchase prices,
the preference for personal mobility may lead users to turn to two-wheelers
(motorcycles, in particular), as currently is the case in Asian and Latin-American cities.
We may observe a downward tendency of car use due to ageing but not before 20 or 25
years (Madre and Bussière, 2012).
7 Elasticities are not constant over time, although data limitations often lead to time-independent
estimates. Over the long run, some studies (e.g. Small and Van Dender, 2007) found a declining elasticity of mileage with respect to the fuel price. More recent evidence suggests a renewed increase (e.g. Litman, 2012a), a finding consistent with a framework in which elasticities rise with higher fuel prices and decline with higher income, but also with arguments discussed in this paper regarding changing habits and rising availability of alternatives.
RECENT TRENDS IN CAR USAGE IN ADVANCED ECONOMIES – SLOWER GROWTH AHEAD?
20 Summary and Conclusions — Discussion Paper 2013-9 — © OECD/ITF 2013
Linking back to Section 2, the disaggregate analysis shows that the change in aggregate
levels of car use is the result of various changes, in different directions. This suggests
that aggregate projections on the basis of GDP and fuel prices may be misleading, as
they do not capture these underlying changes. It could be argued that the aggregate
fuel price elasticities are the result of the changes observed and therefore are a
reasonable shortcut for forward looking analysis, but our reading of the evidence is not in
line with such an interpretation. It is difficult to see how the range of explanatory
variables considered could all be captured in a single fuel-price elasticity.
5. CONCLUSION
In past decades, the aggregate demand for passenger travel has developed roughly in
line with per capita GDP and population growth but there are strong signs that this close
connection is weakening in advanced economies. In particular, car travel volumes in
some countries stopped growing in the recent past or have declined despite continued
growth in GDP. This paper considered evidence that helps us understand why this is so.
We find a range of explanations that are understood, and some hypothetical explanations
that are plausible. A combination of factors explains the aggregate trend but some are
likely to be more persistent than others. Policy interventions also make a difference.
While some explanatory factors are fairly well understood (e.g. ageing and cohort
effects), others are more uncertain (e.g. the role of information and communication
technology). The relative importance of different factors also differs between countries
and between places within countries (e.g. urban and rural regions). Separating out the
various factors is important for making useful projections of travel demand and for
examining specific issues of transport policy (emissions mitigation, congestion
management, etc.). Is the phenomenon transitory or is it permanent? This holds for
economies where the demand for car travel has levelled off recently, but potentially also
for developing economies. The latter may experience some of the changes apparent in
high income markets at lower levels of incomes (e.g. because of more rapid urbanisation
and policy intervention), although for the coming decades rapid increases in motorization
are expected.
SUMMARY & CONCLUSIONS: RECENT TRENDS IN CAR USAGE IN ADVANCED ECONOMIES
Summary and Conclusions — Discussion Paper 2013-9 — © OECD/ITF 2013 21
BIBLIOGRAPHY
Brownstone D. and T.F. Golob, 2009, The impact of residential density on vehicle usage
and energy consumption, Journal of Urban Economics, 65, 91-98.
Davis B., T. Dutzik, and Ph. Baxandall, 2012, Transportation and the new generation:
why young people are driving less and what it means for transportation policy,
Frontier Group – US P.I.R.G. Education Fund.
Dejoux V., Y. Bussière, J.-L. Madre and J. Armoogum, 2010, Projection of the daily travel
of an ageing population: The Paris and Montreal case, 1975-2020 Transport
Reviews, 30, 4, 495-515.
Goodwin P., 2012, Peak travel, peak car and the future of mobility: evidence, unresolved
issues, and policy implications, and a research agenda, ITF Discussion paper 2012-
13.
ITF, 2011, Transport Outlook – Meeting the needs of 9 billion people, ITF, Paris.
Kim J. and D. Brownstone, 2010, The impact of residential density on vehicle usage and
fuel consumption, UCI working paper.
Kuhnimhoff T., D. Zumkeller, and B. Chlond, 2012, Who are the drivers of peak car? A
Decomposition of Recent Car Travel Trends for Six Industrialized Countries, mimeo.
Hyodo T., 2012, Japanese facts on car demand, presentation to the ITF roundtable on
long run trends in travel demand, Paris, November 2012.
Le Vine S. and P. Jones, 2012, On the move – Making sense of car and train travel trends
in Britain, RAC Foundation, London.
Litman T., 2012a, Changing vehicle travel price sensitivities – the rebounding rebound,
VTPI 2012.
Litman T., 2012b, Toward more comprehensive and multimodal transport evaluation,
VTPI, December 2012.
Madre J.-L. and Y. Bussiѐre, 2012, Are we heading towards a reversal of the trend of
ever-greater mobility?, ITF Discussion Paper 2012-16.
Millard-Ball A. and L. Schipper, 2011, Are We Reaching Peak Travel? Trends in Passenger
Transport in Eight Industrialized Countries, Transport Reviews, 31, 3, 357–378.
Mokhtarian P.L. and C. Chen, 2004, TTB or not TTB, that is the question: a review and
analysis of the empirical literature on travel time (and money) budgets,
Transportation Research A, 38, 9/10, 643 – 675.
SUMMARY & CONCLUSIONS: RECENT TRENDS IN CAR USAGE IN ADVANCED ECONOMIES
22 Summary and Conclusions — Discussion Paper 2013-9 — © OECD/ITF 2013
Newman P. and J. Kenworthy, 2011, “Peak car use”: understanding the demise of
automobile dependence, World Transport Policy and Practice, 17, 2, 31.
Puentes R., 2012, Have Americans hit peak travel? A discussion of the changes in US
driving habits, ITF Discussion paper 2012-14.
Small K. and K. Van Dender, 2007, Fuel efficiency and motor vehicle travel: the declining
rebound effect, The Energy Journal, 28, 1, 25-51.
Van der Waard J., B. Immers and P. Jorritsma, 2012, New drivers in mobility – what
moves the Dutch in 2012 and Beyond?, ITF Discussion paper 2012-15.
Williams-Derry C., 2011, Toll Avoidance And Transportation Funding: Official Estimates
Frequently Overestimate Traffic And Revenue For Toll Roads, Sightline Institute
(www.sightline.org); at www.sightline.org/research/sprawl/toll-avoidance-and-
transportation-funding.

International Transport Forum2 rue André Pascal 75775 Paris Cedex [email protected]