recent household trends in europe: a cross-country …
TRANSCRIPT

98
2018� 60�(2)
RECENT HOUSEHOLD TRENDS IN EUROPE: A CROSS-COUNTRY ANALYSISPavlína Habartová1)
AbstractOver the past few decades, significant changes in family and household structure have been observed. Despite common trends, recent household distribution has been found to vary among countries and reflects the demographic behaviour, the effect of economic and social conditions, the quality of healthcare, cultural differences, and the overall lifestyle of each society. The most significant impact on the transformation of the current household distribution of the most developed countries is attributed to population ageing and new forms of living arrangements. The paper sets out to analyse recent household trends in Europe on the basis of harmonised 2011 census data and focuses both on new forms of families such as consensual unions and young adults living with their parents and on traditional families. Finally, in the second part of the paper European countries are classed into six groups according to shared household trends.
Keywords: Households, families, trends, Europe, Czech Republic, population ageing, census Demografie, 2018, 60: 98–110
1. INTRODUCTION
In recent years, we have witnessed significant changes in the family and household structure across developed countries. Many studies have shown (e.g. Hantrais – Letablier, 1996; Burch – Matthews, 1987; Bradbury – Peterson – Liu, 2014, etc.) that the size of privatehouseholds has decreased significantly over the pastfew decades, while the number of households issteadily increasing. Despite this common trend,the current household structure varies betweencountries. It reflects the demographic behaviourand lifestyle of the population, cultural factors, andthe socioeconomic and health care situation andpolicies in the country. The most significant impact onhousehold transformation has been mostly attributed to population ageing, which, together with the lowbirth rate and new forms of living arrangements, hassignificantly shaped the household distribution in most developed countries in the world.
This article focuses on the cross-country differences in household trends and patterns in Europe. The anal- ysis covers all the basic types of households, both from the perspective of household distribution itself and from the perspective of family and the household status of individuals, and it focuses particularly on the categories of the households in which the biggest differences are observed between countries.
This paper builds on the results of Pavlína Ha-bartová’s PhD thesis (2016) focusing on households in the census in the light of the methodological aspects of the data.
2. METHODOLOGY AND DATA SOURCES
This analysis draws on the 2011 Census database containing comparable census data for EU member states and EFTA countries, which is accessed through
1) Czech Statistical Office, contact: [email protected].
ČLÁNKY
99
the online application Census Hub. The Census Hub is a new tool developed by Eurostat that allows users to access data and customise tabulations. In order to achieve the greatest data comparability possible, the analysis in this paper was carried out only on EU and EFTA countries. The data available through the Census Hub application methodologically follow both European regulations2) and international recommendations, which more specifically use the term ‘private household’. According to international recommendations, a one-person household (‘a per- son who lives alone in a separate housing unit or who occupies, as a lodger, a separate room (or rooms) of a housing unit but does not join with any of the other occupants of the housing unit to form part of a multi-person household as defined below’ (UN, 2006)), or a multiperson household (‘a group of two or more persons who combine to occupy the whole or part of a housing unit and to provide themselves with food and possibly other essentials for living. Members of the group may pool their incomes to a greater or lesser extent’ (UN, 2006)). This concept is known as the housekeeping concept. However, in countries that carry out the register-based census, the household concept is simplified to the house-hold-dwelling concept, which considers all persons living in a housing unit to be members of the same household, so that there is one household per occu-pied housing unit. These methodological distinctions may, however, play a significant role in assessing in-ternational household trends.
Another important international term is ‘family nucleus’. A family nucleus is defined ‘in the narrow sense as two or more persons who live in the same household and who are related as husband and wife, as cohabiting partners, as a marital (registered) same--sex couple, or as a parent and a child. Thus the family comprises a couple without children or a couple with one or more children, or a lone parent with one or more children.’ (UN, 2006: 109)
This definition is close to the definition of fami-ly household used in the 2011 Census in the Czech Republic, but the international definition is even narrower and excludes other people living in a private household as non-family members. While the Inter-
national Recommendations consider skip generation households a family nucleus, Commission Regulation (EC) No. 1201/2009 has finally included the skip ge-neration household among non-family households, the way Czech methodology does.
According to international recommendations households are determined on the basis of ‘place of usual residence’. National statistical institutes, however, ge-nerally interpret this rule differently and sometimes simplify it to the registered place of residence (see also OECD, 2014) because it better firsts their data collection methodology. Similarly, household type derivation are often affected by the data collection methodology and the data sources, so great caution still needs to be applied when conducting international comparisons.
In the analysis two approaches were used. The first approach analyses the distribution of private house-holds or family nuclei, the second one works with household status, which has the same informative value and, moreover, can be combined with other personal characteristics. The disadvantage, however, are the more frequent methodological deviations and data errors generated during data processing (see more in Habartová, 2016).
The second part of the analysis focuses on household composition across Europe, where, more specifically, cluster analysis was used. Because of the significant correlation between most of the variables, factor anal- ysis was applied in the first step. In total, 14 variables entered the factor analysis (see Table 1), and this num-ber was reduced using principal component analysis to 3 main factors. The choice of variables, especially tho-se with the most significant variance across countries, was based on previous descriptive analysis of house- hold-type distribution. These deviations, however, should not be generated by errors in data inputs nor remote observations. Sampling errors should also be excluded, since the analysis deals with census data only.
Subsequently, all three main factors were used to produce country-specific factor scores, and then, based on the similarity of the factor scores, country typology was calculated by using cluster analysis, with unweighted factor scores as input values and mean Euclidean distance and the Ward’s method as the main methods.
2) Commission Regulation (EC) No. 1201/2009 and UN (2006).
Pavlína Habartová Recent Household Trends in Europe: A Cross-Country Analysis

100
2018� 60�(2)
3. RESULTS
3.1. HOUSEHOLD COMPOSITION AND AVERAGE SIZE OF PRIVATE HOUSEHOLDS
According to the latest census data, the average Eu-ropean private household had 2.41 members in 2011. As Figure 1 shows, household size varies across Euro-pe – ranging from 2.07 members in Finland to 2.88 household members in Slovakia.
In recent decades household and family patterns have changed significantly. On one hand, one can notice lower number of children living in families as well as a reduction of family numbers in general, as a result of the low fertility rate and the postponement of childbearing in Europe. On the other hand, there has been a significant increase in the proportion of one-person households and families without children among people at an older age as a result of population ageing.
As Figure 2a and Figure 2b show, household size is affected more by the share of one-person households than by family nucleus size. While a positive but weak
correlation can be observed in the relationship in the first figure, there is a strong negative correlation in the sec- ond one. A significant negative correlation is logically evident in the northern and western European coun- tries, where household structure is strongly influen-ced by the high share of one-person households. More specifically, one-person households make up more than a third of private households in these countries, and in Finland, Estonia and Norway, as much as 40% of all private households (see Figure 1).
The number of one-person households does not exceed the number of family households in any of the selected countries, except those in southern Europe, where the number of one-person households already exceeds the number of households made up of mar- ried or registered couples. Married couple families (registered partnerships included) are the household type with the highest variance across Europe. While in northern European countries, including the Baltic States, married couple families constitute only a third of all households, in southern and eastern Europe this is still a traditional and the most common type of household (see Figure 3).
Figure 1 The average size of private households and the share of one-person households in Europe, 2011
Source: Census Hub, author’s calculations.
1.0
1.2
1.4
1.6
1.8
2.0
2.2
2.4
2.6
2.8
3.0
0
5
10
15
20
25
30
35
40
45
Slov
akia
Pola
ndCr
oatia
Cypr
usM
alta
Rom
ania
Icel
and
Port
ugal
Spai
nG
reec
eIre
land
Slov
enia
Bulg
aria
Luxe
mbo
urg
Italy
Lith
uani
aLa
tvia
Hun
gary
Uni
ted
King
dom
Cz
ech
Repu
blic
Liec
hten
stei
nBe
lgiu
mFr
ance
Aus
tria
Swed
enN
orw
ayN
ethe
rland
sSw
itzer
land
Den
mar
kEs
toni
aG
erm
any
Finl
and
Size
of p
rivat
e ho
useh
old
Shar
e of
one
-per
son
hous
ehol
ds (
%)
Share of one -person households
Average size of private households
ČLÁNKY

101
Pavlína Habartová Recent Household Trends in Europe: A Cross-Country Analysis
Along with one-person households the number of consensual unions is also increasing, especially in northern Europe and in France, where they make up more than one-fifth of all households. By contrast, in countries such as Greece, Poland, Croatia, and Slo-vakia, less than 5% of households are composed of consensual unions.
As Figure 3 shows, the Czech Republic has average shares of one-person households and consensual un- ions, a slightly below average proportion of consen-sual union families, and almost ranks highest when it
comes to the share of lone-parent families. The largest proportion of lone-parent families was reported by the Baltic States (22–29% of households), followed by Central European countries. Conversely, in the Scan-dinavian countries, only 12% of family households are lone-parent families.
Across Europe, the smallest percentage of house- holds is still households consisting of 2 or more families and multi-person non-family households. Both types of households on average make up less than 3% of all households (6% in total). In addition
Figure 3 Distribution of private households by type of household, Europe, 2011
Source: Census Hub, author’s calculations.
Figure 2a, b The average size of private household and the relationship of household size to the proportion of one-person households and the size of the family nucleus in European countries, 2011
Source: Census Hub, author’s calculations.
SK
PLHR
CYMT
RO
IS
PTES
EL
IE
SI
BG
LU
IT
LT
LV
HUUKCZ
LI
BEFRATSE
NO
NLCH
DK
EEDE
FI
y = 0,365x + 2,0213R² = 0,3995
2,6
2,7
2,8
2,9
3,0
3,1
3,2
3,3
1,8 2,0 2,2 2,4 2,6 2,8 3,0 3,2
Ave
rage
siz
e of
fam
ily n
ucle
us
Average size of private household
BE
BG
CZ
DK
DE
EE
IEEL
ES
FR
HR
IT
CY
LV
LTLU
HU
MT
NL AT
PL
PT
RO
SI
SK
FI
SE
UKIS
LI
NO
CH
y =-24,09x + 89,558R² = 0,8061
15
20
25
30
35
40
45
2,0 2,2 2,4 2,6 2,8 3,0
Shar
e of
one
-per
son
hous
ehol
ds (%
)
Average size of private household
0%
10%
20%
30%
40%
50%
60%
70%
80%
90%
100%
Latv
ia
Esto
nia
Slov
akia
Swed
en
Slov
enia
Nor
way
Hun
gary
Fran
ce
Den
mar
k
Uni
ted
King
dom
Icel
and
Finl
and
Lith
uani
a
Aus
tria
Cze
ch R
epub
lic
Bulg
aria
Pola
nd
Irel
and
Spai
n
Net
herla
nds
Rom
ania
Luxe
mbo
urg
Belg
ium
Port
ugal
Cro
atia
Ger
man
y
Ital
y
Switz
erla
nd
Lich
tein
stei
n
Mal
ta
Gre
ece
Cyp
rus
2 and more families
Consensual union families
Lone parent families
Married couple families

102
2018� 60�(2)
to demographic behaviour, it is mainly methodology (including data collection method, data processing method, and methodical concepts) that has affected the observed number of such households. However, despite the methodological deviations, the num-bers confirm the findings of the study from Iacovou and Skew (2010), which, among other things, found the largest intensity of multi-generation households to be in the countries of eastern and south-eastern Europe and in Slovakia, Slovenia, and Poland (Iaco-vou – Skew, 2010 3)).
3.2. HOUSEHOLD STATUSFigure 4 shows similar household formation patterns across European countries. In 2011, on average almost 40% of people were living as a partner in a married, registered, or other legally recognised union of two people, almost 30% were living as a child or a son / daughter in the family household, and 13% were li-ving in a one-person household. While in northern European countries more than a tenth of people were living in consensual unions, in the southeast and eas-tern European (including Poland) countries the figure was only less than 4%.
3.2.1. PERSONS LIVING ALONESingle persons living alone are concentrated mostly in the oldest age groups in all countries. Because of male over-mortality, the majority of these households are widowed women living alone. The proportion of wo-men aged 70+ living alone varies considerably across European countries, from 28% in Spain and other southern European countries to 65% in Denmark and other northern European countries.
While the significant variations in the proportion of women living alone grow with increasing age (often due to different economic conditions and traditional family patterns), the proportion of men living alone varies most, on the contrary, in the lower age groups, where the largest shares of men living alone are ob-served. As Figure 5a illustrates, in Norway, on one hand, more than a third of men aged 25–29 were living alone in 2011, while in Croatia, on the other hand, only 6% of men aged 25–29 were living alone.
The 2011 Census data in all the selected countries shows a different age profile for men and women. In most countries, men are more likely than women to live alone up to the age of 55, when women start to pre-vail. These female one-person households are most
3) Based on EU-SILC data.
Figure 4 Population by household status, Europe, 2011
Notes: The category ‘others’ includes other people living with the family nucleus or persons in multi-generational and multi-member non-family house-holds; the countries are ranked in descending order according to the proportion of people living in consensual unions.Source: Census Hub, author’s calculations.
ČLÁNKY
0%
10%
20%
30%
40%
50%
60%
70%
80%
90%
100%
Gre
ece
Pola
nd
Mal
ta
Croa
tia
Cypr
us
Rom
ania
Luxe
mbo
urg
Italy
Czec
h Re
publ
ic
Latv
ia
Lich
tens
tein
Slov
enia
Irela
nd
Belg
ium
Port
ugal
Ger
man
y
Spai
n
Latv
ia
Aus
tria
Bulg
aria
Hun
gary
Icel
and
Uni
ted
King
dom
Switz
erla
nd
Net
herla
nds
Den
mar
k
Fran
ce
Nor
way
Finl
and
Esto
nia
Swed
en
Not living in a private household Others*)Persons living alone ChildLone parents Partners in a consensual unionPartners in married or registered couple

103
Pavlína Habartová Recent Household Trends in Europe: A Cross-Country Analysis
Notes: The category ‘others’ includes other people living with the family nucleus or persons in multi-generational and multi-member non-family house-holds; the countries are ranked in descending order according to the proportion of people living in consensual unions.Source: HFD, 2013a; CZSO, 2013, 2014a; author’s calculations.
often created by the death of a partner. The share of these households decreases in the oldest age groups because of the higher intensity at which people enter another household as a person living in the family nucleus of private household or as a person living in an instituti-on. Similarly, the higher percentage of men living alone at a younger age is often explained by later entering a one-couple family household as a partner.
3.2.2. PARTNERSIn all European countries, the age profile of persons living as a couple in a family household has the shape of an inverted U (see Figures 6a, b). While in most countries women are most likely to be a partner in
a couple at the age of 30–44, among men this percentage peaks later, at the age of 60–74. For both men and wo-men, however, there is clearly a sharp increase in the young age groups and a decline in elderly ages. Since women are more likely than men to survive their part-ner, the proportion of women living with a partner decreases sooner in the higher age at the expense of women living alone. By contrast, men aged 70–79 are more likely to be living in a couple if they are living in a household (75%) than women are (44%).
Differences have been found between European countries both in the age profile and in the intensity of people living in a couple. While the age profile is strong- ly dependent on family attitudes and fertility timing
Figure 5a, b Persons living alone (in %) by age and sex, selected countries, 2011
Source: Census Hub, author’s calculations.
Source: Census Hub, author’s calculations.
0
10
20
30
40
50
60
70
15 25 35 45 55 65 75 85 95Age
MALES
Czech Republic GermanyFrance ItalyPoland RomaniaNorway
0
10
20
30
40
50
60
70
15 25 35 45 55 65 75 85 95Age
FEMALES
Czech RepublicGermanyFranceItalyPolandRomaniaNorway
0
10
20
30
40
50
60
70
80
90
100
15 25 35 45 55 65 75 85 95Age
MALES 0
10
20
30
40
50
60
70
80
90
100
15 25 35 45 55 65 75 85 95Age
FEMALES
Czech RepublicGermany
FranceItaly
PolandRomania
NorwayLatvia
0
10
20
30
40
50
60
70
80
90
100
15 25 35 45 55 65 75 85 95Age
MALES 0
10
20
30
40
50
60
70
80
90
100
15 25 35 45 55 65 75 85 95Age
FEMALES
Czech RepublicGermany
FranceItaly
PolandRomania
NorwayLatvia
Figure 6a, b Persons living as a partner in a one-couple family household (in %) by sex and age, selected countries, 2011
104
2018� 60�(2)
(this is most visible in the case of Romania, see Figure 6b) and on mortality rates in the older age groups, the intensity of people living in a couple is also affected by the incompleteness of by an incomplete identifica-tion of household types during data processing. This means in particular insufficient input data or, in the case of traditional censuses, for example by data collection.
3.2.3. COHABITING PARTNERS For some decades, consensual unions (cohabitations) have been a household type with one of the most significant rates of variance among European coun- tries. Already in the 1990s, cohabitations were much more common in northern European countries than in southern Europe (Kiernan, 1999). These findings were also confirmed by the last census data in 2011, but cohabitations are becoming a more common form of partnership in some central and eastern European countries. In all European countries, in 2011 1–14% of people were living as a cohabiting partner in a one--family household. The lowest proportions were found in most countries of southern, eastern, and central Europe (with the exception of Hungary and Bulga-ria), and traditionally the highest proportions were observed in the countries of northern and western Eu-rope and in the Baltic states, with Estonia ranking top.
Even more significant variance can be measured when only family households are considered (3–31%). Cohabitation is a common alternative to marriage in northern European countries, France, the Netherlands, and the UK, where more than 20% of people living as a partner are unmarried. Some studies have called the increasing trend of cohabitation ‘a deinstitutiona-lisation of marriage’ (e.g., Cherlin, 2004). However, it should be noted that although some countries do not use the legal term consensual union, they can still work with cohabitations, and such couples can have a simi-lar status as married ones (e.g. in the Czech Republic, see Mojžíšová, 2006). Nevertheless, some countries, such as Norway or Sweden, in order to harmonise the distinction between a consensual union and mar- riage have even anchored cohabitation in their legal system (Perelli-Harris – Gassen, 2012). Therefore, the differences cannot be explained only by differences in demographic behaviour, economic situation, or tra-ditional family patterns, but are also due to a country’s
family policies and legislation, which often influence the need to legitimise family formation.
Despite the similarities in the age profile of people living in cohabitation across European countries, signi-ficant differences in the peak position and the intensity between countries have been found. On average, people aged 25–34 are most likely to choose cohabitation as a living arrangement (women at a younger age than men), except in Italy, Slovenia, and Slovakia, where it is postponed to the age 30–39 (and to even older in Slovakia). While in Scandinavia, Estonia, the Nether-lands, France, and the United Kingdom more than a quarter of men and a third of women live in cohabi-tation, the percentage in Greece and Poland is only 5%.
In general, the highest proportion of cohabiting partners is in all countries found in the youngest age groups, and the percentage declines very rapidly with increasing age to the half of them at the age of 25. The popularity of premarital cohabitations is also do-cumented in Figures 7a, b. While at age 20–24 almost 90% of women in couples in 2011 were cohabiting, among women ten years older about two-thirds were living in a marriage.
In some countries, however, despite the global rise of cohabitation at a younger age, the number of married couples still exceeds the number of cohabitations. For instance, in Greece, Croatia, Poland, Slovenia, and Slo-vakia, in all five-year age groups the number of married couples is higher than the number of cohabitations. In contrast, in some northern and western European countries, the number of persons living in cohabitations aged 25–29 exceeded the number of same-aged persons in married couples by more than three times in 2011.
Although the Czech Republic is located mid-way between northern and southern Europe in terms of the intensity of cohabitation, the popularity of pre-marital cohabitations has increased significantly since 2001. In addition, taking into account the possible underestimation of the number of people living in one-couple families in the 2011 census data (more in Habartová 2016), it is more likely that the struc- ture of one-couple families is moving in the direction of northern and western European countries. However, the age pattern shows a more significant declining trend around the age of 30, which is more like the age profile of Germany than that of Norway or France.
ČLÁNKY

105
Pavlína Habartová Recent Household Trends in Europe: A Cross-Country Analysis
3.2.4. LONE PARTNERSLone-parent households are typical for the female population. In 2011, around 8% of women lived as a lone parent, compared with 2% of men. Consistent with overall European trends, the Czech Republic had almost the highest percentage of women (and men) living alone with their child/ren around the age of 40 (see Figures 8a, b). Only Hungary, Iceland, and, above all, the Baltic States reached even higher va-lues. As Figure 8a shows, the peak for lone fathers in the middle-age groups is less pronounced. Likewise, the differences between countries are less significant.
The only common trend is the higher share of lone fathers in northern European countries, which are known for their higher level of gender equality.
Alongside middle-aged lone parents, older sin-gle-parents represent another important group of lone-parent households. In some countries, such as Greece, Spain, and Croatia, this type of lone-parent family even predominates. Such households are more likely to be formed as a result of the death of a partner than separation, and the next most common reason is a parent moving to the household of an adult daughter/son. Due to male over-mortality, this type of family
Figure 7a, b Number of cohabiting partners compared to the number of persons living in a married couple by age and sex, selected countries, 2011
Source: Census Hub, author’s calculations.
0
1
2
3
4
5
6
7
8
20 30 40 50 60 70 80
Ind
ex
Age
MALES
0
1
2
3
4
5
6
7
8
20 30 40 50 60 70 80
Ind
ex
Age
FEMALES Czech RepublicGermanyFranceItalyPolandRomaniaNorway
Czech RepublicGermanyFranceItalyPolandRomaniaNorway
Figure 8a, b Share of persons living as lone parents by age and sex in selected countries (in %), 2011
Source: Census Hub, author’s calculations.
Czech RepublicGermany
FranceItaly
PolandRomania
NorwayEstonia
0
5
10
15
20
25
30
15 25 35 45 55 65 75 85Age
MALES
0
5
10
15
20
25
30
15 25 35 45 55 65 75 85Age
FEMALES
Czech RepublicGermany
FranceItaly
PolandRomania
NorwayEstonia
0
5
10
15
20
25
30
15 25 35 45 55 65 75 85Age
MALES
0
5
10
15
20
25
30
15 25 35 45 55 65 75 85Age
FEMALES

106
2018� 60�(2)
status is more common among older women than men and geographically among countries/regions with a stronger family or religious tradition, or where the eco- nomic situation makes the possibility of living in an institution much harder. Supported by the higher rates of middle-aged lone-parent families, the proportion of persons living as a single parent could rise to 20% of the elderly (Poland, the Baltic States).
3.2.5. YOUNG ADULTS LIVING WITH THEIR PARENTS
The new phenomenon of emerging adulthood has been attracting special interest from psychologists, so-ciologists, and demographers since the end of the last century, mainly because of the new trends in family behaviour among the contemporary young generation (see Boyd – Norris, 1999; Arnett, 2007; White, 1994, etc.). This is not just a European issue, but a trend observed across all developed countries in connec-tion with postponement of the age of childbearing and marriage.
In Europe, according to the census data, men leave home around the age 25 and women at the age of 23. As Figure 9 shows, in all the countries studied, with- out exception, later parental home leaving is cha- racteristic for men. However, a significant difference
has been found among the countries studied. While in northern European only 10% of men aged 30 were living with their parents in 2011, in southern Europe (including Slovenia and Slovakia) more than 40% of men of the same age were still living in their parents' households. The Czech Republic is again located in the middle between the two poles, and, unlike Hun-gary, Slovakia, and Poland, is closer to western Eu-ropean countries.
Focusing on the key age group of 25–29 years, i.e. the age at which young adults often leave the parental home, on average more than a third of men live with their parents in European countries. In the countries with the lowest proportion of men aged 25–29 living with their parents, young adults prefer to live in coha-bitation (Denmark, Finland, Sweden) or alone (Nor-way). In contrast, in the countries with the highest proportion of men aged 25–29 living with parents, young adults create their own household with a part-ner after leaving the parental home. An exception is Slovenia, where men more often leave the parental home without being with a partner. For women aged 25–29 years, similar trends can be observed, but with a significantly lower proportion of them living with parents and a higher proportion sharing a household with a husband.
Figure 9 Young adults aged 20–34 living with their parents by sex, Europe, 2011
Source: Census Hub, author’s calculations.
0
10
20
30
40
50
60
70
Den
mar
k
Finl
and
Swed
en
Fran
ce
Nor
way
Net
herla
nds
Uni
ted
King
dom
Ger
man
y
Esto
nia
Irela
nd
Switz
erla
nd
Icel
and
Belg
ium
Luxm
bour
g
Aus
tria
Czec
h Re
publ
ic
Bulg
aria
Cypr
us
Rom
ania
Lith
uani
a
Hun
gary
Port
ugal
Gre
ece
Latv
ia
Spai
n
Pola
nd
Slov
enia
Mal
ta
Croa
tia
Italy
Slov
akiaProp
ortio
n of
you
ng a
dults
age
d 20
–34
livig
with
thei
r par
ents
to a
ll pe
rson
s at
the
sam
e ag
e (%
)
Males Females
ČLÁNKY

107
Pavlína Habartová Recent Household Trends in Europe: A Cross-Country Analysis
3.3. CLUSTER ANALYSISIn order to perform a real cross-national analysis, more sophisticated methods were used. Firstly, factor analysis was selected and the principal component me-thod and varimax rotation were applied. Based on the eigenvalue criteria and the scree plot, 3 main factors were identified. All 3 factors explained 80% of the total variability in the data, in which 14 variables were used. As Table 1 shows, the most significant factor explains 50% of total variability. Since variables such as share of cohabitations and elderly persons living alone, and young adults living with the parents, together with the
share of lone mothers have high loadings on the first factor (see Table 1), the first factor was named ‘type of living arrangement’.
The second factor, which explains 17% of the total variability, has a strong association with the share of lone parents at younger and middle age. Therefore, the second factor was called ‘lone parents’. And finally, the remaining variables, average size of family and share of married couples with children, have high factor loadings on the third factor and seem to be connect- ed with the size of the family, so the third factor was called ‘size of the family’.
Table 1 Rotated factor loadings
Source: Census Hub, author’s calculations.
Variable
FactorThe total
variability explained by
the factors (%)
1 2 3
Type of living arrangement
Lone parents
Size of the family
Number of men aged 25–29 in a cohabiting couple compared to number of men in a married couple 0.950 0.132 –0.056 92.4
Share of women aged 25–29 in a cohabiting couple 0.944 0.081 –0.179 93.4
Share of men aged 20–24 in a cohabiting couple compared to number of men in a married couple 0.888 0.236 –0.071 84.9
Share of men aged 20–34 living with their parents –0.869 0.053 0.242 81.7
Share of cohabiting couples without children 0.840 –0.043 –0.236 76.4
Share of women aged 85–89 living as lone mothers –0.793 0.269 0.058 70.5
Share of men aged 80–84 living alone 0.739 0.228 –0.270 67.1
Share of women aged 85–89 living alone 0.733 –0.095 –0.458 75.7
Share of men aged 25–29 living alone 0.709 –0.099 –0.389 66.4
Share of cohabiting couples with at least one child younger than 25 years old 0.687 0.359 –0.119 61.5
Share of lone parent families with at least one child younger than 25 years old 0.047 0.964 0.042 93.4
Share of women aged 35–39 living as lone mothers –0.021 0.941 –0.242 94.5
Average size of family –0.137 –0.087 0.905 84.5
Share of married couples with at least one child younger than 25 years old –0.506 –0.375 0.662 83.5
Total variability explained (%) 50.1 16.7 13.7 80.4

108
2018� 60�(2)
Table 2 Factor scores for clusters of countries
Source: Census Hub, author’s calculations.
Cluster Countries Indicator
Factor
1 2 3
Type of living arrangement
Lone parents
Size of the family
1 Belgium, Hungary, Austria, United KingdomMean 0.29 0.39 –0.26
Standard deviation 0.28 0.50 0.32
2 Bulgaria, Germany, Switzerland, Greece, RomaniaMean –0.36 –1.03 –0.87
Standard deviation 0.85 0.32 0.47
3 Czech Republic, Estonia, Latvia, Lithuania, Slovenia
Mean –0.55 1.54 –0.82
Standard deviation 0.67 0.85 0.30
4 Denmark, Finland, France, the Netherlands, Norway, Sweden
Mean 144 –0.37 –0.24
Standard deviation 0.27 0.41 0.60
5 Ireland, IcelandMean 0.98 1.11 2.39
Standard deviation 0.31 0.37 0.60
6 Spain, Croatia, Italy, Cyprus, Luxembourg, Malta, Poland, Portugal, Slovakia
Mean –0.80 –0.46 0.68
Standard deviation 0.49 0.52 0.61
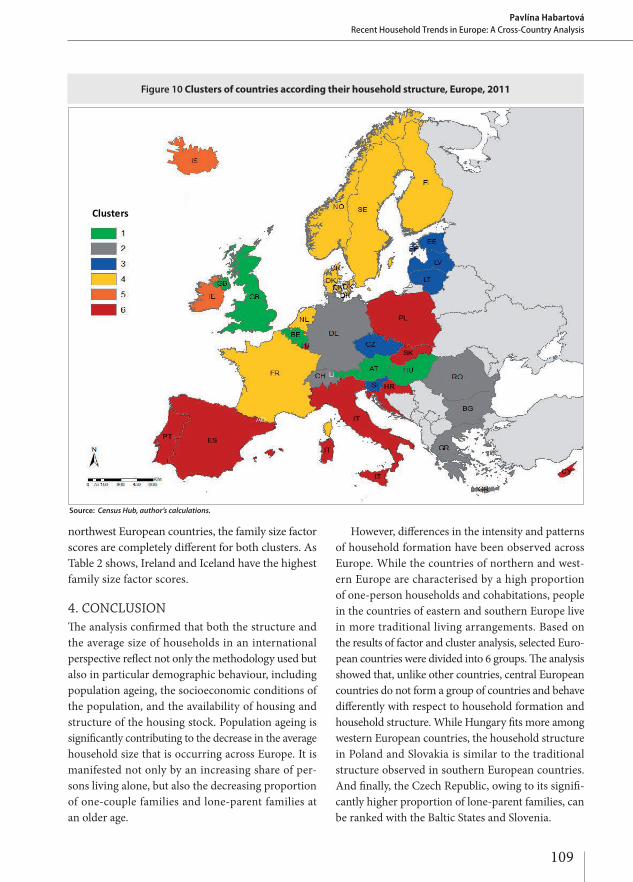
A cluster analysis was calculated on the basis of these three factors in order to divide the selected European countries into 6 groups at distance 5 (see Figure 10).
Based on the results of the cluster analysis and other studies (e.g. Iacovou – Skew, 2010), northern Europe has occupied a unique place over the long term. In our case, northern countries can be grouped with some countries of western Europe (France, the Netherlands) into the same cluster, which is cha-racterised by a high intensity of new form of living arrangements (see Table 2). Typical characteristics of household structure in this cluster are a high pro-portion of young people living in cohabitation (with or without children), a significant number of per-sons living alone in every age group (especially men), a small share of multigenerational households, and a significant share of young adults living with parents. The families tend to be small, and the share of lone-parent families is also small.
Another specific cluster is the group consisted of majority countries of southern and south-eastern Eu-rope and some countries of eastern Europe (Slovakia and Poland). This group of countries is characteris-ed by traditional types of living arrangements, fewer young lone-parent families, and larger families in ge-
neral (owing to the above-average share of married couples with children). These countries also have a high proportion of young adults living with their parents and a high proportion of multigenerational households.
As the first part of the analysis has already shown, the countries of Central Europe do not form a group of countries together and have different family and household patterns. While Poland and Slovakia rank among the more traditional countries of southern Eu-rope, the Czech Republic resembles the Baltic States, in particular with respect to its higher share of young lone-parent families. The cluster made up of the Baltic States, Slovenia, and the Czech Republic is characte-rised by the highest proportion of middle-aged lone--parent families and the associated smaller family size. On the other hand, Hungary can be assigned rather to the cluster of remaining countries of western Europe (Belgium, Austria, and United Kingdom).
Another group of countries consists, surprising- ly, of Germany, Switzerland, Bulgaria, Romania, and Greece. This cluster is characterised by a low lone-parent factor score and smaller family size. Iceland and Ireland are in quite a specific position. Although the household structure in this cluster is very similar to the structure observed among
ČLÁNKY
109
Pavlína Habartová Recent Household Trends in Europe: A Cross-Country Analysis
northwest European countries, the family size factor scores are completely different for both clusters. As Table 2 shows, Ireland and Iceland have the highest family size factor scores.
4. CONCLUSION The analysis confirmed that both the structure and the average size of households in an international perspective reflect not only the methodology used but also in particular demographic behaviour, including population ageing, the socioeconomic conditions of the population, and the availability of housing and structure of the housing stock. Population ageing is significantly contributing to the decrease in the average household size that is occurring across Europe. It is manifested not only by an increasing share of per-sons living alone, but also the decreasing proportion of one-couple families and lone-parent families at an older age.
However, differences in the intensity and patterns of household formation have been observed across Europe. While the countries of northern and west- ern Europe are characterised by a high proportion of one-person households and cohabitations, people in the countries of eastern and southern Europe live in more traditional living arrangements. Based on the results of factor and cluster analysis, selected Euro-pean countries were divided into 6 groups. The analysis showed that, unlike other countries, central European countries do not form a group of countries and behave differently with respect to household formation and household structure. While Hungary fits more among western European countries, the household structure in Poland and Slovakia is similar to the traditional structure observed in southern European countries. And finally, the Czech Republic, owing to its signifi-cantly higher proportion of lone-parent families, can be ranked with the Baltic States and Slovenia.
Clusters
Figure 10 Clusters of countries according their household structure, Europe, 2011
Source: Census Hub, author’s calculations.

110
2018� 60�(2)
Literature y Arnett, J. J. 2007. Emerging Adulthood: What is it, and what is it good for? Child development perpectives, Vol. 1, Issue 2, pp. 68–73. y Boyd, M. – Norris, D. 1999. The crowded nest: Young adults at home. Canadian social trends, spring 1999. Available at:
<http://homes.chass.utoronto.ca/~boydmon/research_papers/Young_adults_living_with_Parents/nest1999_Boyd_Norris.pdf>. y Bradbury, M. – Peterson, M. N. – Liu, J. 2014. Long¬term dynamics of household size and their environmental implications.
Population and environment, Vol. 36, Issue 1, pp. 73–84. Available at: <http://csis.msu.edu/sites/csis.msu.edu/files/Longterm%20housing.pdf>.
y Burch, T. – K. Matthews, B. J. 1987. Household formation in developed societies. Population and Development Review, Vol. 13, No. 3, pp. 495–511.
y Commission Regulation (EC) No 1201/2009 of 30 November 2009 implementing Regulation (EC) No 763/2008 of the European Parliament and of the Council on population and housing censuses as regards the technical specifications of the topics and of their breakdowns. Avalable at: <http://eur-lex.europa.eu/legal-content/EN/TXT/?uri=CELEX%3A32009R1201>.
y Eurostat. 2014. The Census Hub: easy and flexible access to European census data. Eurostat. Available at: <http://ec.europa.eu/eurostat/documents/4031688/6285607/KS-02-14-480-EN-N.pdf/05b4ca91-1f72-4dbb-ae2c-d3a07f56d795>.
y Habartová, P. 2016. Rodiny a domácnosti ve sčítání lidu se zaměřením na metodologické aspekty dat. Doctoral thesis. Faculty of Science, Charles University in Prague. Available at: <https://is.cuni.cz/webapps/zzp/detail/84559/>.
y Hantrais, L. – Letablier, M. T. 1996. Families and family policies in Europe. Routledge, 232 p. ISBN: 978-0582247673. y Cherlin, A. J. 2004. The deinstitutionalization of American marriage. Journal of Marriage and Family, 66, p. 848–861.
Available at: <http://soc.jhu.edu/wp-content/uploads/sites/28/2012/02/Cherlin_JMFmarriagepaper.pdf>. y Iacovou, M. – Skew, A. 2010. Household structure in the EU. ISER Working Paper Series, No. 2010-10.
Available at: <https://www.econstor.eu/dspace/bitstream/10419/65910/1/632257644.pdf>. y Kiernan, K. 1999. Cohabitation in Western Europe. Population Trends, 96, pp. 25–32. Available here:
<http://www.ons.gov.uk/ons/rel/population-trends-rd/population-trends/no--96--summer-1999/cohabitiation-in-western-europe.pdf y Mojžíšová, B. 2006. Nesezdané soužití v českém právním řádu. Master thesis. Faculty of Law, Masaryk University. Available at:
<https://is.muni.cz/th/60947/pravf_m/DP_do_Isu.pdf>. y OECD. 2014. SF1.1: Family size and household composition (online). 6 p. (cit. 1.3.2016). Available at:
<http://www.oecd.org/els/family/SF_1_1_Family_size_and_composition.pdf>. y Perelli-Harris, B. – Gassen, N. S. 2012. How similar are Cohabitation and Marriage? Legal Approaches to Cohabitation across
Western Europe. Population and development review, 38(3), pp. 435–467. Available at: <http://onlinelibrary.wiley.com/doi/10.1111/j.1728-4457.2012.00511.x/epdf>.
y UN. 2006. Conference of European Statisticians: Recommendations for the 2010 Censuses of Population and Housing. EUROST-AT, UNECE. 213 p. Available at: <http://www.unece.org/fileadmin/DAM/stats/publications/CES_2010_Census_Recommendations_English.pdf>.
y White, L. 1994. Coresidence and Leaving Home: Young adults and their parents. Annual review of sociology, Vol. 20, pp. 81–102.
Data sources y Census Hub. Eurostat. 2011 Population and housing census data in the EU. Available at:
<https://ec.europa.eu/CensusHub2/query.do?step=selectHyperCube&qhc=false>.
PAVLÍNA HABARTOVÁcompleted her doctoral studies in demography at the Faculty of Science of Charles University in 2016. She works at the Czech Statistical Office in the Population Statistics Department, where since 2014 she has been a head of the census methodology, analysis and dissemination unit.