recent evolution of the u.s. national lightning detection ... documents/scientific...
TRANSCRIPT

Recent Evolution of the U.S. National Lightning
Detection Network
Amitabh Nag1, Martin J. Murphy
1, Kenneth L. Cummins
2, Alburt E. Pifer
1, and John A. Cramer
1
1Vaisala Inc., Louisville, Colorado, USA
2Department of Atmospheric Sciences University of Arizona, Tucson, Arizona, USA
Abstract— Updates were made in 2013 to the U.S. National
Lightning Detection Network (NLDN) that has led to
performance improvements. Vaisala’s LS7002 sensors have been
deployed, replacing the older generation LS7001 and IMPACT
sensors. The LS7002 takes advantage of the LS7001’s digital
sensor technology and provides improved embedded software
with enhanced features. This improves the sensitivity of the
sensor to low amplitude lightning-generated signals and leads to
enhanced detection of cloud and cloud-to-ground lightning.
Additionally, the central processor algorithms in the NLDN are
being updated to include new techniques for classifying lightning
using multiple waveform parameters, a “burst processing”
algorithm for geolocation of multiple pulses in lightning pulse
trains, and improved handling of electromagnetic wave
propagation resulting in smaller arrival-time errors. The median
location accuracy (given by the length of the semi-major axis of
the 50% error ellipse) the NLDN is expected to be about 200 m in
the interior of the network. These performance characteristics
continue to be validated by triggered lightning, tower strikes,
network inter-comparison, and camera studies. We examine
lightning discharges reported by the NLDN in early September
to late November, 2013 within the interior of the contiguous
United States. The large majority (87%) of flashes reported by
the NLDN were ICs. Of the CG flashes reported by the NLDN
during this period 81% were negative and 19% were positive.
The average multiplicity (number of strokes were flash) for
negative CG flashes was 2.7 and for positive CG flashes was 1.4.
The negative and positive first stroke median peak current was -
15 kA and 19 kA, respectively.
Keywords—U.S. NLDN; performance characteritics; cloud
lightning; cloud-to-ground lightning; detection efficiency; location
accuracy; peak current
I. INTRODUCTION
The U.S. National Lightning Detection Network (NLDN) has been providing real-time, continental-scale lightning data since 1989. Upgrades to the network were made in 1995 (Cummins et al., 1998), 2003-2004 (Cummins and Murphy, 2009) and in 2010-2012 (Nag et al., 2013). The most recent network-wide upgrade was completed in August 2013. Prior to this upgrade, the NLDN consisted of 114 LS7001 and IMPACT-ESP (Improved Accuracy through Combined Technology - Enhanced Sensitivity and Performance) sensors, which provided both time of arrival and azimuth information. Currently, all sensors in the NLDN have been upgraded to
Vaisala's LS7002 technology. In addition, a new geolocation algorithm is being tested and is expected to be implemented in the NLDN central processor in March-April, 2014. In this paper, we discuss the results expected from the current network-wide upgrade on the performance characteristics of the U.S. NLDN. We also examine the peak current distributions of cloud and cloud-to-ground lightning reported by the network.
II. NLDN PERFORMANCE CHARACTERISTICS AND
VALIDATION
The performance of a lightning detection network is primarily measured by its detection efficiency, location accuracy, peak current estimation accuracy, and type/polarity estimation accuracy for different kinds of lightning discharges. Figure 1 shows the current model estimated cloud-to-ground (CG) lightning flash detection efficiency for the North American Lightning Detection Network, or NALDN, which consists of the Canadian Lightning Detection Network (CLDN) and the U.S. NLDN. The flash detection efficiency is expected to be about 95% for the entire United States. Additionally, after the 2013 upgrade, the NLDN is expected to have about 40-50% detection efficiency for cloud flashes. Figure 2 shows the current model estimated median location accuracy for the NALDN. The location accuracy is expected to be approximately 150 to 250 m over the majority of the United States, falling to the 250-500 m range toward the edges of the network.
These performance characteristics have been validated over the years using a variety of techniques such as tower studies, video camera studies, and triggered lightning studies (e.g., Jerauld et al., 2004, Biagi et al., 2005, Nag et al., 2011). Mallick et al. (2014, ILDC) examined the performance characteristics of the NLDN for the 2004–2013 period using rocket-triggered lightning data acquired at Camp Blanding, Florida. Table I summarizes the NLDN flash and stroke detection efficiencies for 2013 in Florida. The flash and stroke detection efficiencies were 100% and 76%, respectively. The median absolute location error was 173 m, and the median absolute value of current estimation error was 15%. In 2013, 2.1% (one out of 47) of the triggered lightning return strokes (similar to subsequent strokes in natural lightning) was misclassified by the NLDN.

TABLE I. SUMMARY OF PERFORMANCE CHARACTERISTICS OF THE
NLDN IN 2013 EVALUATED USING ROCKET-TRIGGERED LIGHTNING (MALLICK
ET AL., 2014).
Characteristic Flashes/Return
Strokes
CG Flash detection efficiency 100%
Stroke detection efficiency 76%
Median location accuracy 173 m
Misclassified return strokes 2.1%
Peak current estimation error 15%
Fig. 1. Map showing the model estimated cloud-to-ground flash detection
efficiency of the North American Lightning Detection Network.
Fig. 2. Map showing the model estimated median location accuracy of the
North American Lightning Detection Network.
III. NLDN TECHNOLOGY EVOLUTION AND ITS RESULTS
The performance characteristics of a lightning detection network depends upon the characteristics of its sensors and the techniques used in the network’s central processor to geolocate lightning. The 2013 upgrade consisted of deploying the latest sensor technology in the NLDN. Additional improvements have been made to the algorithms used in the central processor of the NLDN.
A. Changes that Affect Detection Efficiency
The LS7002 employs the latest digital sensor technology along with improved embedded software with enhanced features. Digital processing improves the sensitivity of the sensor to low amplitude lightning-generated signals by a factor of about 3 as compared to the analog IMPACT-ESP sensor. The LS7002 also transmits additional waveform parameters for each measured lightning event to the central processor. Digital filtering of local noise sources allows better signal-to-noise ratio along with flexibility in site selection. Note that the LS7002, like the IMPACT-ESP and LS7001, measures both timing and angle (direction) information associated with lightning events. This allows the use of a combination of Magnetic Direction Finding and Time of Arrival techniques to geolocate lightning discharges with as few as two sensors. The combined enhancements in sensor sensitivity and embedded sensor software allow detection of low amplitude lightning events (primarily cloud pulses) and are expected to result in a cloud flash detection efficiency of around 40-50% in the U.S. NLDN.
Additionally, a new lightning location algorithm (referred to herein as “burst processing”) in the central processor will allow the geolocation of multiple pulses in lightning pulse bursts or trains (e.g., Rakov et al., 1996, Nag and Rakov, 2009). It is expected that multiple cloud pulses will be geolocated for each cloud flash in a large fraction of cloud flashes. This will further enhance the cloud lightning detection efficiency of the network by about 6% on average (Murphy and Nag, 2014, ILDC). Finally, a new lightning classification algorithm that uses multiple waveform parameters to classify cloud and cloud-to-ground lightning with an accuracy of 80-90% has been implemented. Currently, the NLDN central processor uses waveform parameters to classify between cloud and cloud-to-ground lightning. Additionally, it classifies all positive lightning events having peak currents less than 15 kA as cloud lightning. The new classification algorithm removes this hard limit for peak current for positive events and classifies lightning events solely on the basis of their waveform characteristics. These improvements to the central processor are currently under test and are expected to be deployed in March-April, 2014.
B. Changes that Affect Location Accuracy
The LS7002 sensors use waveform onset corrections, which accurately determine the arrival time of electromagnetic waveforms from lightning events at a sensor. This reduces the timing error and improves the accuracy with which lightning events can be geolocated (Honma et al., 2013). The waveform onset corrections have led to an improvement in the median location accuracy (given by the length of the semi-major axis of the 50% error ellipse) of the NLDN from about 300 m to about 200 m in the interior of the network. The location accuracy of the NLDN is evaluated using lightning strikes to towers by Cramer and Cummins (2014, ILDC). The location accuracy is expected to improve further when additional factors such as propagation across uneven terrain, varying ground conductivity, and improved handling of electromagnetic wave propagation (resulting in smaller arrival-time errors) are taken into account in the new NLDN central processor (to be implemented in March-April, 2014).
IV. EVALUATION OF ENHANCED CLOUD LIGHTNING
DETECTION
The ratio of the number of cloud lightning pulses to the number of cloud-to-ground lightning return strokes detected by a network can serve as a measure of change in the network’s cloud lightning detection efficiency from one time-period to another if regional, seasonal, and storm-to-storm variations in IC-to-CG ratio are minimized. This is done by calculating the IC-to-CG ratio over the same geographical region for all time periods, taking all time periods from the same season in different years, and taking time periods long enough to contain an adequate number of thunderstorm days. Further, it is important that the network’s detection efficiency for CG strokes remains relatively unchanged for the time periods under consideration.
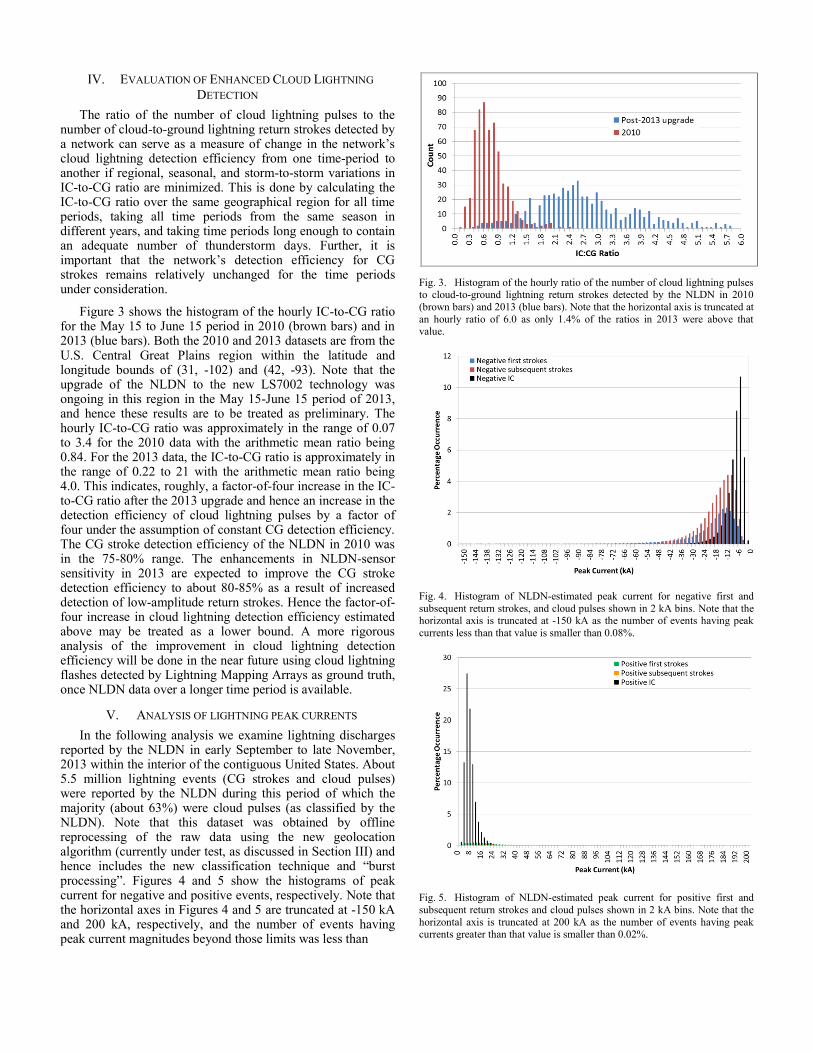
Figure 3 shows the histogram of the hourly IC-to-CG ratio for the May 15 to June 15 period in 2010 (brown bars) and in 2013 (blue bars). Both the 2010 and 2013 datasets are from the U.S. Central Great Plains region within the latitude and longitude bounds of (31, -102) and (42, -93). Note that the upgrade of the NLDN to the new LS7002 technology was ongoing in this region in the May 15-June 15 period of 2013, and hence these results are to be treated as preliminary. The hourly IC-to-CG ratio was approximately in the range of 0.07 to 3.4 for the 2010 data with the arithmetic mean ratio being 0.84. For the 2013 data, the IC-to-CG ratio is approximately in the range of 0.22 to 21 with the arithmetic mean ratio being 4.0. This indicates, roughly, a factor-of-four increase in the IC-to-CG ratio after the 2013 upgrade and hence an increase in the detection efficiency of cloud lightning pulses by a factor of four under the assumption of constant CG detection efficiency. The CG stroke detection efficiency of the NLDN in 2010 was in the 75-80% range. The enhancements in NLDN-sensor sensitivity in 2013 are expected to improve the CG stroke detection efficiency to about 80-85% as a result of increased detection of low-amplitude return strokes. Hence the factor-of-four increase in cloud lightning detection efficiency estimated above may be treated as a lower bound. A more rigorous analysis of the improvement in cloud lightning detection efficiency will be done in the near future using cloud lightning flashes detected by Lightning Mapping Arrays as ground truth, once NLDN data over a longer time period is available.
V. ANALYSIS OF LIGHTNING PEAK CURRENTS
In the following analysis we examine lightning discharges reported by the NLDN in early September to late November, 2013 within the interior of the contiguous United States. About 5.5 million lightning events (CG strokes and cloud pulses) were reported by the NLDN during this period of which the majority (about 63%) were cloud pulses (as classified by the NLDN). Note that this dataset was obtained by offline reprocessing of the raw data using the new geolocation algorithm (currently under test, as discussed in Section III) and hence includes the new classification technique and “burst processing”. Figures 4 and 5 show the histograms of peak current for negative and positive events, respectively. Note that the horizontal axes in Figures 4 and 5 are truncated at -150 kA and 200 kA, respectively, and the number of events having peak current magnitudes beyond those limits was less than
Fig. 3. Histogram of the hourly ratio of the number of cloud lightning pulses to cloud-to-ground lightning return strokes detected by the NLDN in 2010
(brown bars) and 2013 (blue bars). Note that the horizontal axis is truncated at
an hourly ratio of 6.0 as only 1.4% of the ratios in 2013 were above that value.
Fig. 4. Histogram of NLDN-estimated peak current for negative first and
subsequent return strokes, and cloud pulses shown in 2 kA bins. Note that the horizontal axis is truncated at -150 kA as the number of events having peak
currents less than that value is smaller than 0.08%.
Fig. 5. Histogram of NLDN-estimated peak current for positive first and
subsequent return strokes and cloud pulses shown in 2 kA bins. Note that the
horizontal axis is truncated at 200 kA as the number of events having peak currents greater than that value is smaller than 0.02%.
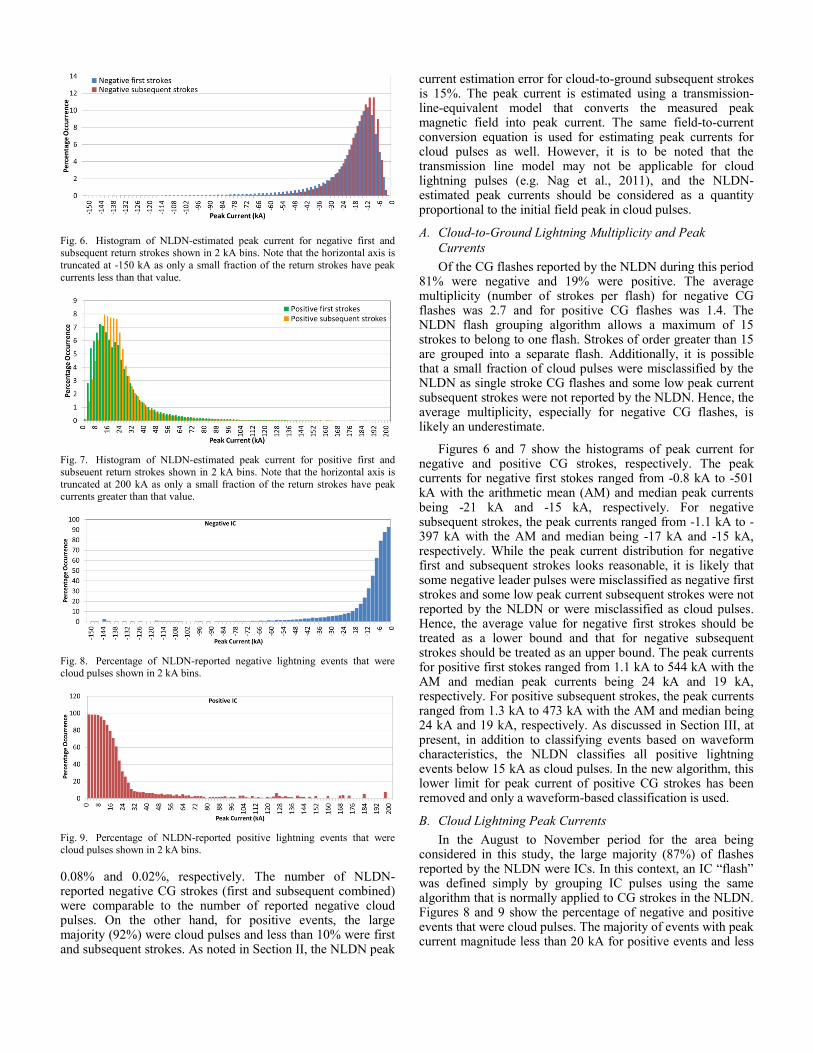
Fig. 6. Histogram of NLDN-estimated peak current for negative first and subsequent return strokes shown in 2 kA bins. Note that the horizontal axis is
truncated at -150 kA as only a small fraction of the return strokes have peak
currents less than that value.
Fig. 7. Histogram of NLDN-estimated peak current for positive first and subseuent return strokes shown in 2 kA bins. Note that the horizontal axis is
truncated at 200 kA as only a small fraction of the return strokes have peak currents greater than that value.
Fig. 8. Percentage of NLDN-reported negative lightning events that were cloud pulses shown in 2 kA bins.
Fig. 9. Percentage of NLDN-reported positive lightning events that were cloud pulses shown in 2 kA bins.
0.08% and 0.02%, respectively. The number of NLDN-reported negative CG strokes (first and subsequent combined) were comparable to the number of reported negative cloud pulses. On the other hand, for positive events, the large majority (92%) were cloud pulses and less than 10% were first and subsequent strokes. As noted in Section II, the NLDN peak
current estimation error for cloud-to-ground subsequent strokes is 15%. The peak current is estimated using a transmission-line-equivalent model that converts the measured peak magnetic field into peak current. The same field-to-current conversion equation is used for estimating peak currents for cloud pulses as well. However, it is to be noted that the transmission line model may not be applicable for cloud lightning pulses (e.g. Nag et al., 2011), and the NLDN-estimated peak currents should be considered as a quantity proportional to the initial field peak in cloud pulses.
A. Cloud-to-Ground Lightning Multiplicity and Peak
Currents
Of the CG flashes reported by the NLDN during this period 81% were negative and 19% were positive. The average multiplicity (number of strokes per flash) for negative CG flashes was 2.7 and for positive CG flashes was 1.4. The NLDN flash grouping algorithm allows a maximum of 15 strokes to belong to one flash. Strokes of order greater than 15 are grouped into a separate flash. Additionally, it is possible that a small fraction of cloud pulses were misclassified by the NLDN as single stroke CG flashes and some low peak current subsequent strokes were not reported by the NLDN. Hence, the average multiplicity, especially for negative CG flashes, is likely an underestimate.
Figures 6 and 7 show the histograms of peak current for negative and positive CG strokes, respectively. The peak currents for negative first stokes ranged from -0.8 kA to -501 kA with the arithmetic mean (AM) and median peak currents being -21 kA and -15 kA, respectively. For negative subsequent strokes, the peak currents ranged from -1.1 kA to -397 kA with the AM and median being -17 kA and -15 kA, respectively. While the peak current distribution for negative first and subsequent strokes looks reasonable, it is likely that some negative leader pulses were misclassified as negative first strokes and some low peak current subsequent strokes were not reported by the NLDN or were misclassified as cloud pulses. Hence, the average value for negative first strokes should be treated as a lower bound and that for negative subsequent strokes should be treated as an upper bound. The peak currents for positive first stokes ranged from 1.1 kA to 544 kA with the AM and median peak currents being 24 kA and 19 kA, respectively. For positive subsequent strokes, the peak currents ranged from 1.3 kA to 473 kA with the AM and median being 24 kA and 19 kA, respectively. As discussed in Section III, at present, in addition to classifying events based on waveform characteristics, the NLDN classifies all positive lightning events below 15 kA as cloud pulses. In the new algorithm, this lower limit for peak current of positive CG strokes has been removed and only a waveform-based classification is used.
B. Cloud Lightning Peak Currents
In the August to November period for the area being considered in this study, the large majority (87%) of flashes reported by the NLDN were ICs. In this context, an IC “flash” was defined simply by grouping IC pulses using the same algorithm that is normally applied to CG strokes in the NLDN. Figures 8 and 9 show the percentage of negative and positive events that were cloud pulses. The majority of events with peak current magnitude less than 20 kA for positive events and less
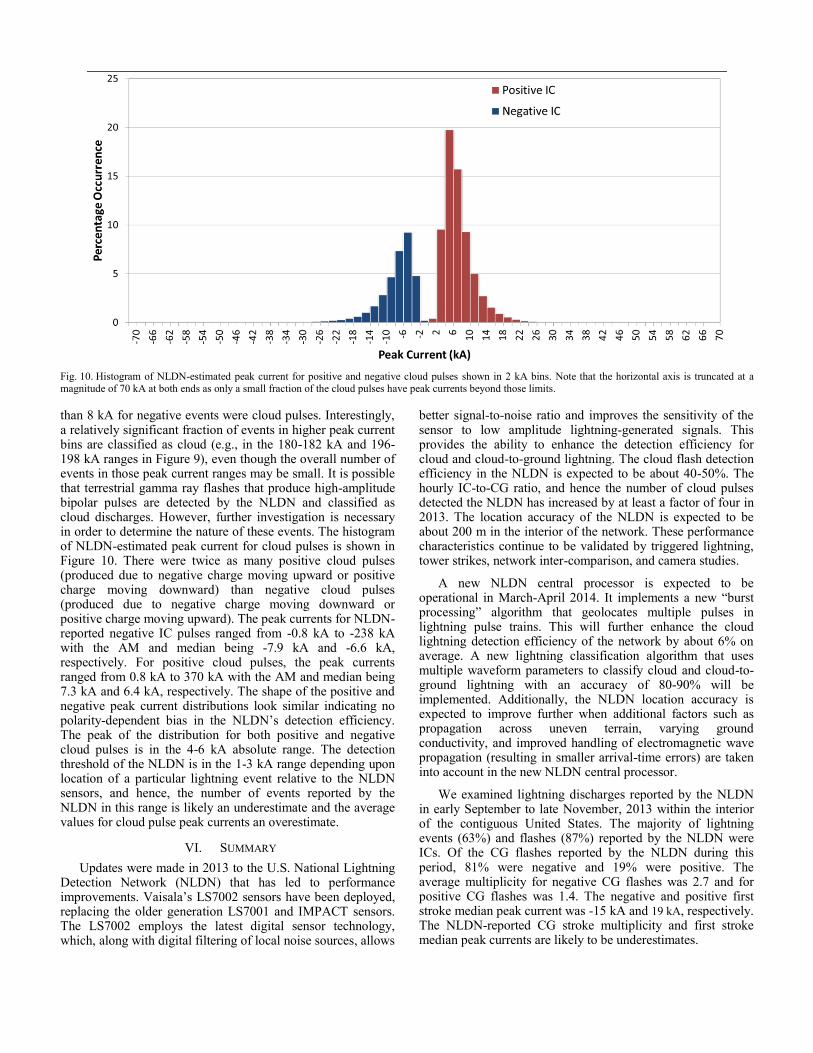
Fig. 10. Histogram of NLDN-estimated peak current for positive and negative cloud pulses shown in 2 kA bins. Note that the horizontal axis is truncated at a magnitude of 70 kA at both ends as only a small fraction of the cloud pulses have peak currents beyond those limits.
than 8 kA for negative events were cloud pulses. Interestingly, a relatively significant fraction of events in higher peak current bins are classified as cloud (e.g., in the 180-182 kA and 196-198 kA ranges in Figure 9), even though the overall number of events in those peak current ranges may be small. It is possible that terrestrial gamma ray flashes that produce high-amplitude bipolar pulses are detected by the NLDN and classified as cloud discharges. However, further investigation is necessary in order to determine the nature of these events. The histogram of NLDN-estimated peak current for cloud pulses is shown in Figure 10. There were twice as many positive cloud pulses (produced due to negative charge moving upward or positive charge moving downward) than negative cloud pulses (produced due to negative charge moving downward or positive charge moving upward). The peak currents for NLDN-reported negative IC pulses ranged from -0.8 kA to -238 kA with the AM and median being -7.9 kA and -6.6 kA, respectively. For positive cloud pulses, the peak currents ranged from 0.8 kA to 370 kA with the AM and median being 7.3 kA and 6.4 kA, respectively. The shape of the positive and negative peak current distributions look similar indicating no polarity-dependent bias in the NLDN’s detection efficiency. The peak of the distribution for both positive and negative cloud pulses is in the 4-6 kA absolute range. The detection threshold of the NLDN is in the 1-3 kA range depending upon location of a particular lightning event relative to the NLDN sensors, and hence, the number of events reported by the NLDN in this range is likely an underestimate and the average values for cloud pulse peak currents an overestimate.
VI. SUMMARY
Updates were made in 2013 to the U.S. National Lightning Detection Network (NLDN) that has led to performance improvements. Vaisala’s LS7002 sensors have been deployed, replacing the older generation LS7001 and IMPACT sensors. The LS7002 employs the latest digital sensor technology, which, along with digital filtering of local noise sources, allows
better signal-to-noise ratio and improves the sensitivity of the sensor to low amplitude lightning-generated signals. This provides the ability to enhance the detection efficiency for cloud and cloud-to-ground lightning. The cloud flash detection efficiency in the NLDN is expected to be about 40-50%. The hourly IC-to-CG ratio, and hence the number of cloud pulses detected the NLDN has increased by at least a factor of four in 2013. The location accuracy of the NLDN is expected to be about 200 m in the interior of the network. These performance characteristics continue to be validated by triggered lightning, tower strikes, network inter-comparison, and camera studies.
A new NLDN central processor is expected to be operational in March-April 2014. It implements a new “burst processing” algorithm that geolocates multiple pulses in lightning pulse trains. This will further enhance the cloud lightning detection efficiency of the network by about 6% on average. A new lightning classification algorithm that uses multiple waveform parameters to classify cloud and cloud-to-ground lightning with an accuracy of 80-90% will be implemented. Additionally, the NLDN location accuracy is expected to improve further when additional factors such as propagation across uneven terrain, varying ground conductivity, and improved handling of electromagnetic wave propagation (resulting in smaller arrival-time errors) are taken into account in the new NLDN central processor.
We examined lightning discharges reported by the NLDN in early September to late November, 2013 within the interior of the contiguous United States. The majority of lightning events (63%) and flashes (87%) reported by the NLDN were ICs. Of the CG flashes reported by the NLDN during this period, 81% were negative and 19% were positive. The average multiplicity for negative CG flashes was 2.7 and for positive CG flashes was 1.4. The negative and positive first stroke median peak current was -15 kA and 19 kA, respectively. The NLDN-reported CG stroke multiplicity and first stroke median peak currents are likely to be underestimates.
REFERENCES
Biagi, C. J., K. L. Cummins, K. E. Kehoe, and E. P. Krider (2007), National Lightning Detection Network (NLDN) performance in southern Arizona, Texas, and Oklahoma in 2003– 2004, J. Geophys. Res., 112, D05208, doi:10.1029/2006JD007341.
Cramer, J. C. and K. L. Cummins (2014), Evaluating location accuracy of lightning location networks using tall towers, 23rd International Lightning Detection Conference & 5th International Lightning Meteorology Conference, 18-21 March, Tucson, Arizona.
Cummins, K. L. and M. J. Murphy (2009), An overview of lightning locating systems: History, techniques, and data uses, with an in‐depth look at the U.S. NLDN, IEEE Trans. Electromagn. Compat., 51(3), 499–518, doi:10.1109/TEMC.2009.2023450.
Cummins, K. L., M. J. Murphy, E. A. Bardo, W. L. Hiscox, R. B. Pyle, and A. E. Pifer (1998), A combined TOA/MDF technology upgrade of the U.S. National Lightning Detection Network, J. Geophys. Res., 103(D8), 9035–9044, doi:10.1029/98JD00153.
Honma, N., K. L. Cummins, M. J. Murphy, A. E. Pifer, and T. S. Rogers (2013), Improved lightning locations in the Tohoku Region of Japan using propagation and waveform onset corrections, IEEJ Trans. on Power and Energy, Vol. 133, No. 2, pp 195-202, doi: 10.1541/ieejpes.133.195.
Jerauld, J., V. A. Rakov, M. A. Uman, K. J. Rambo, D. M. Jordan, K. L. Cummins, and J. A. Cramer (2005), An evaluation of the performance characteristics of the U.S. National Lightning Detection Network in Florida using rocket-triggered lightning, J. Geophys. Res., 110, D19106, doi:10.1029/2005JD005924.
Mallick, S., V.A. Rakov, T. Ngin, W.R. Gamerota, J.T. Pilkey, J.D. Hill, M.A. Uman, D.M. Jordan, J.A. Cramer, A. Nag (2014), An update on the performance characteristics of the NLDN, 23rd International
Lightning Detection Conference & 5th International Lightning Meteorology Conference, 18-21 March, Tucson, Arizona.
Murphy, M. J. and A. Nag (2014), Enhanced cloud lightning performance of the U.S. National Lightning Detection Network following the 2013 upgrade, 23rd International Lightning Detection Conference & 5th International Lightning Meteorology Conference, 18-21 March, Tucson, Arizona.
Nag, A., S. Mallick, V.A. Rakov, J. Howard, C.J. Biagi, D. Hill, M.A. Uman, D.M. Jordan, K.J. Rambo, J. Jerauld, B.A. DeCarlo, K.L. Cummins, and J.A. Cramer (2011), Evaluation of U.S. National Lightning Detection Network performance characteristics using rocket‐triggered lightning data acquired in 2004–2009, Journal of Geophysical Research, 116, D02123, doi:10.1029/2010JD014929.
Nag, A., M. J. Murphy, A. E. Pifer, and J. A. Cramer (2013), Characteristic Improvements of the U.S. National Lightning Detection Network, Abstract 4.5, 6th Conference on the Meteorological Applications of Lightning Data, 93rd American Meteorological Society Annual Meeting, Performance, Austin, Texas, January 05 - 10.
Nag A., and V.A. Rakov (2009), Electric field pulse trains occurring prior to the first stroke in cloud-to-ground lightning, IEEE Transactions on EMC, 51, No. 1.
Nag, A., V.A. Rakov, and J.A. Cramer (2011), Remote measurements of currents in cloud lightning discharges, IEEE Transactions on EMC, 53, No. 2.
Rakov, V. A., M. A. Uman, G. R. Hoffman, M.W. Masters, and, M. Brook (1996), Bursts of pulses in lightning electromagnetic radiation: Observations and implications for lightning test standards, IEEE Trans. Electromagn. Compat., vol. 38, no. 2, pp. 156–164.