recent drought and precipitation tendencies in … drought and precipitation tendencies in ethiopia...
TRANSCRIPT

Recent Drought and Precipitation Tendencies in EthiopiaEllen Viste, Diriba Korecha, Asgeir Sorteberg
Last version of manuscript as submitted to Theoretical and Applied Climatology, 2012. The final publication
is available at www.springerlink.com/content/r84166851504x2h2/.


1
Recent Drought and Precipitation Tendencies in Ethiopia
Ellen Viste 1, Diriba Korecha 1,2, Asgeir Sorteberg 1,3
1 Geophysical Institute, University of Bergen, Bergen, Norway 2 National Meteorological Agency of Ethiopia, Addis Ababa, Ethiopia 3 Bjerknes Centre for Climate Research, University of Bergen, Bergen, Norway
Abstract
In 2011, drought in the Horn of Africa again made news headlines. This study aims to quantify the mete-orological component of this and other drought episodes in Ethiopia since 1971. A monthly precipitation data set for 14 homogeneous rainfall zones was constructed based on 174 gauge observations. As a measure of drought, the Standardized Precipitation Index was calculated on seasonal, annual and biannual timescales for each zone. The results point to 2009 as a year of exceptionally widespread drought. All zones experienced some degree of drought at the annual scale, although in most zones, previous droughts were more extreme. On the national level, 2009 was the second driest year in the period, surpassed only by the historic drought year 1984. Linear regression analysis indicates a general decline in precipitation in southern Ethiopia, during both February–May and June–September. In the central and northern highlands, the trend analysis did not provide evidence of similar tendencies. However, spring droughts have appeared more frequently in all parts of Ethiopia during the last 10–15 years than during the previous decades.
1 Introduction
As reported by news media and aid organiza-tions, the recent drought in the Horn of Africa has had devastating consequences. The year lead-ing to June 2011 has been claimed to be the driest in 60 years in some regions of Somalia, northern Kenya and southern Ethiopia (USAID/FEWS 2011). Considering Ethiopia, how does the recent meteorological situation compare with previous droughts? In a gauge-based precipitation data set for 14 Ethiopian rainfall zones during 1971–2011, 2009 was the second driest year nationally, sur-passed only by the catastrophic 1984 drought. In southern Ethiopia, the data indicate that there has been a general decline in precipitation during this period.
Ethiopia is frequently portrayed as a drought-stricken country, both in the media and the
scientific literature (McCann 1990). A brief Internet search for drought in Ethiopia during 1999–2011, produced hits at news media and aid organizations for every year, except 2001 (e.g., Bhalla 2000; CERF 2006; Addis 2009; Nebehay 2011). As many of these reports are spot interviews in local communities, two factors may distort the meteorological information provided: The climatic diversity of Ethiopia, and the difference between meteorological, hydrological, agricultural, and socio-economic drought.
In the news media, the words famine and drought are used almost interchangeably (McCann 1990), not taking into account that famines are as much social as natural disasters (Sen 1981; Torry 1986; Webb, Braun et al. 1992; Broad and Agrawala 2000; Conway and Schipper 2011). Webb et al. (1992),

2
referring to Harrison (1988), noted that although 21 countries in Sub-Saharan Africa experienced a severe drought in 1984/1985, only a handful of these countries suffered famine. Drought-related famine is the result of several factors, where the lack of precipitation is only the first (Webb, Braun et al. 1992). This means that famine, in itself, can-not be taken as evidence of drought, while it is also not possible to assess the role of societal conditions without knowledge of the extremeness of the pre-cipitation deficits.
The fact that the mean annual precipitation in parts of the Ethiopian highlands exceeds 2000 mm (Griffiths 1972), may make the impression of Ethiopia as a dry country seem paradoxical. In the other end of the scale, arid/semi-arid regions in the lowland receive a meager 300 mm. From the conditions on the ground, it may be difficult to distinguish between a dry climatology and drought in the sense of abnormally little precipita-tion. The strong seasonality of precipitation adds to the confusion. A dry summer season has more severe effects in the north than in the south, where not much rain can be expected to fall at that time of the year (Griffiths 1972; Korecha and Barnston 2007). In this study, the term drought is reserved for precipitation deficits that are outside of the normal range. It does not take into account that some regions may have generally dry or frequently varying conditions.
The incomplete link between precipitation and water availability also blurs the picture. In addi-tion to hydrological factors such as evapora-tion and run-off, social constructions affect the amount of available water per capita (Mishra and Singh 2010). Due to the high population density, there are regions in the Rift Valley and the cen-tral Ethiopian highlands that must be considered extremely water-limited, despite annual precipita-tion of more than 1000 mm (Funk, Senay et al. 2005).
Such increasing water demands may be interpreted as a reduction in precipitation. Farmers in northern Ethiopia claim to have shifted to more drought-resistant crops due to declining rainfall during the last couple of generations (Meze-Hausken 2004). However, there is little evidence for precipitation trends in this region, neither in seasonal precipita-tion amounts, nor in the frequency and intensity of extreme events (Meze-Hausken 2004; Seleshi and Zanke 2004; Seleshi and Camberlin 2006; Bewket and Conway 2007). On the other hand, precipitation declines in southern and eastern Ethiopia have been documented, most strongly for the spring season (Seleshi and Zanke 2004; Seleshi and Camberlin 2006; Funk, Dettinger et al. 2008; Williams and Funk 2011).
Using gauge observations through May 2011, we present updated trend analyses for two sepa-rate regions: Southern Ethiopia, which relies most strongly on the spring (February–May) rains, and Central and Northern Ethiopia, where the summer (June–September) is the main rainy sea-son. In addition, the aim of this study has been to quantify the meteorological severity and rank of historic drought episodes. The Standardized Precipitation Index (McKee, Doesken et al. 1993) is used as a drought measure in each of 14 Ethiopian rainfall zones. Drought-related fam-ines in Ethiopia have been documented from 253 B.C. till the 1990s (Degefu 1987; Webb, Braun et al. 1992; Webb and Braun 1994), and supple-mented by precipitation studies for the last dec-ades (Seleshi and Zanke 2004; Segele and Lamb 2005; Korecha and Barnston 2007; Williams and Funk 2011), as well as local and regional drought studies (Bewket and Conway 2007; Edossa, Babel et al. 2010; Gebrehiwot, van der Veen et al. 2011). But a regional and nation-wide comparison of the precipitation during different drought episodes is still missing. We will discuss the following years: 1972–1975, 1984, 1987, 1990–1992, 1999–2000, 2002–2003, and 2008–2011, with empha-sis on the most recent event.
2 Data and methods
The 14 homogeneous rainfall zones described in Korecha and Sorteberg (submitted to the
International Journal of Climatology, 2012) were used to represent different parts of Ethiopia.

3
Monthly precipitation for each zone was calculated for 1972–2011, and the Standardized Precipitation Index (McKee, Doesken et al. 1993) used to identify droughts during this period. The SPI is a statistical measure indicating how unusual an event is, making it possible to determine how often droughts of a certain strength are likely
to occur. SPIs may also be com-pared directly between different locations. However, the practical implication of an SPI-defined drought, the deviation from the normal amount of precipita-tion, will vary from one place to another. In order to address this question, the percentage of the normal amount of precipitation was also calculated for periods of
SPI-defined drought.
All drought measures were calcu-lated based on accumulated pre-cipitation at several timescales. Long-time drought was consid-ered at timescales of 12 and 24 months, and the 4-month indi-ces for May and September used to describe the spring and sum-mer seasons, respectively.
2.1 Precipitation data
2.1.1 Gauge-based zone precipitation
Korecha and Sorteberg (2012) identified 14 homogeneous rainfall zones covering all of Ethiopia, and details of the dif-ferent zones may be found there. In Figure 1, these zones are plot-ted in a vegetation map. Ethiopia is located in the inner part of the Horn of Africa, within 3–15 °N, 33–48 °E, with Eritrea to the north, Djibouti to the east, Sudan to the west, Kenya to the south, and Somalia to the south and east. The Ethiopian plateau, constituting most of the green
area in the vegetation map, is divided by the Rift Valley, run-ning southwest–northeast, from zone I through parts of zones X-A, IX, VIII, VII and XII-B.
For each zone, a time series of monthly precipitation for January 1970 – May 2011 was made, based on monthly data for 238 gauge stations obtained from the National Meteorological Agency of Ethiopia (NMA). First, the monthly climatology of each station was calculated, and averaged over the stations in the zone to produce the zone climatology. Similarly, station
anomalies were calculated for each month in the record, using the fraction of the climatologi-cal values at each station, and these values averaged to produce a time series of zone anomalies. The anomaly series was then multiplied by the zone’s clima-tology to obtain a time series of monthly precipitation in the zone.
When calculating the climatol-ogy of the zones, only stations having data for at least 50 % of each calendar month during the reference period 1971–2000 were used. For stations to be used in the subsequent anomaly calculations, the corresponding requirement was set to 70 %. As a result, 174 stations were used in the climatology, and 132 stations in the time series. Due to the spread of observations, shown in Figure 1, the number of stations differs from zone to zone and month to month, ranging from 1 in the Southwestern Lowlands (zone V) to a maximum of 40 in the Central Highlands (zone IX).
In five cases of single months with missing data in one of the zones, the anomaly fraction from
Figure 1 Precipitation zones and stationsEthiopian climate zones and stations (white used for climatology, red for time series). Background satellite photo: NASA/www.maplibrary.org.
I
II
III
IV
V
VI
VII VIII
IXX−A
X−B
XIXII−A
XII−B
I
II
III
IV
V
VI
VII VIII
IXX−A
X−B
XIXII−A
XII−B
I: NE Rift ValleyII: NE HighlandsIII: N HighlandsIV: NW HighlandsV: SW LowlandsVI: SW Rain ForestVII: S Rift ValleyVIII: Central Rift ValleyIX: Central HighlandsX-A: E HighlandsX-B: E HighlandsXI: S HighlandsXII-A: SE LowlandsXII-B: S Lowlands

4
that neighbor zone with the most similar seasonal cycle, was used to estimate monthly precipitation for this zone. The main purpose of this filling was to avoid long-lasting gaps in the accumulated 12- and 24-month precipitation used in the SPI cal-culations. Apart from this, missing data were not adjusted.
Precipitation trends for 1971–2010 were cal-culated for two regions: One consisting of the zones where the northern hemisphere summer, June–September, is the main rainy season, and one of zones where spring, February–May, is the main rainy season. For each of these regions, and nationally, the monthly precipitation in each zone was weighted by the area of the zone and averaged to produce the regional mean precipitation. For each region, and for the country as a whole, trend analysis was performed for the summer and spring seasons used to define the regions, as well as for the fall season, October–December.
Trend lines were estimated by linear regression, using the least squares method, and the slope of
the regression line tested at the 0.05 level of statis-tical significance. Bootstrapping was also used to calculate a mean slope value and the 95 % con-fidence interval. Two non-parametric tests were applied to test the significance of the slope: the Spearman’s rho test and the Mann-Kendall test. As the power of these tests in detecting trends is simi-lar (Yue, Pilon et al. 2002), and no practical differ-ences between them appeared in our results, only the outcome of Spearman’s rho test will be shown.
2.1.2 GPCP
Data from the Global Precipitation Climatology Project (GPCP) (Adler, Huffman et al. 2003; Huffman, Adler et al. 2009) was used for com-parison with the zone data in selected years. This is a merged data product that incorporates pre-cipitation estimates from satellite microwave and infrared data, and surface rain gauge observations. Version 2.2 of the monthly data, with a resolution of 2.5 degrees latitude and longitude, was used.
2.2 ERA-Interim reanalysis data
ERA-Interim reanalysis data were used to describe anomalies in the moisture flux field in the spring and summer of 2009. ERA-Interim is produced by the European Centre for Medium-Range Weather Forecasts (ECMWF) at a resolution of about 0.75 degrees latitude and longitude, with 60 vertical levels and a 4-D variational assimilation
system (Simmons, Uppala et al. 2006; Uppala, Dee et al. 2008; Berrisford, Dee et al. 2009). The ERA-Interim vertically integrated moisture flux was calculated by the Climate Analysis Section at the National Center for Atmospheric Research (NCAR), using methods described in Trenberth et al. (2002).
2.3 Classifying drought using the Standardized Precipitation Index (SPI)
The Standardized Precipitation Index (SPI, as described by McKee et al. (1993)) was used to define drought periods. Requiring only precipi-tation as input, the SPI covers a variety of time-scales and allows comparison of drought severity both between periods in time and between dif-ferent locations. Drying soil is the result of sev-eral factors, where precipitation is only the first. More complicated drought indices, like the Palmer Drought Severity Index (PDSI) (Palmer 1965)
may be favored in regions where the variability in evapotranspiration is high. On the other hand, the introduction of evapotranspiration rates intro-duces another element of uncertainty into the cal-culations (Lloyd-Hughes and Saunders 2002). It is important to acknowledge that drought condi-tions may be modified by evapotranspiration, but as the variability of precipitation is often greater than the variability of evapotranspiration (Ntale and Gan 2003), drought indicators based purely

5
on precipitation give a good overall view of the sit-uation. In regions like Ethiopia, where the access to data is limited, there are good reasons for choos-ing a precipitation-based drought measure.
McKee et al. (1993) defined the following four drought categories: Mild drought (SPI between 0 and -0.99, occurring 24 % of the time), moder-ate drought (SPI between -1.00 and -1.49, occur-ring 9.2 % of the time), severe drought (-1.50 to -1.99, occurring 4.4 % of the time), and extreme drought (SPI -2.00 or less, occurring 2.3 % of the time). A drought event may then be defined as a period during which the SPI is continuously nega-tive and reaches a value of -1 or less at one or more time steps. Drought begins when the SPI first falls below zero and ends with the first positive value (McKee, Doesken et al. 1993).
The SPI may be calculated at any timescale, depending on which effect of drought one wishes to detect. Edwards and McKee (1997) suggested using 3-months accumulated precipitation in the SPI for a short-term or seasonal drought index, a 12-month SPI for an intermediate-term drought index, and 48 months for a long-term index. In this study SPIs were calculated for intermediate to long-term periods of 12, 24 and 48 months. To assess seasonal drought, the 4-month accumula-tion was calculated for May and September, as this is the most commonly used of the definitions of the spring and summer seasons in Ethiopia.
2.3.1 Defining and calculating the SPI
A simple way to describe precipitation anomalies, is to use a standard Z-score,
e – p = m dqdt
H(x) = q + (1 – q)G(x)
E – P ≈ A
∑(e – p)ii=1
N
mqin = ∑mi qborder,ii=1
n
∆(mq) = ∑mi [ qend,i – qborder,i ]i=1
n
Z = x – xs
–
g (x) = x α–1e –x/β
β α Г(α)
Г(α) = ∫ e –
t t α
–1dt0
∞
G(x) = ∫ g (x)dx0
x
∆(mq)b,target = 100 x ∑mi [(qb,border )i – (qb,end )i ]i=1
nb
∑mj [(qborder )j – (qend )j ]j=1
ntotal
= 100 x ∆(mq)b
∆(mq)total
where x is the observed precipitation value, and and x– and s the mean and standard deviation, respectively, over a defined period. Z is the number of standard deviations from the mean, assuming that the observations are normally distributed.
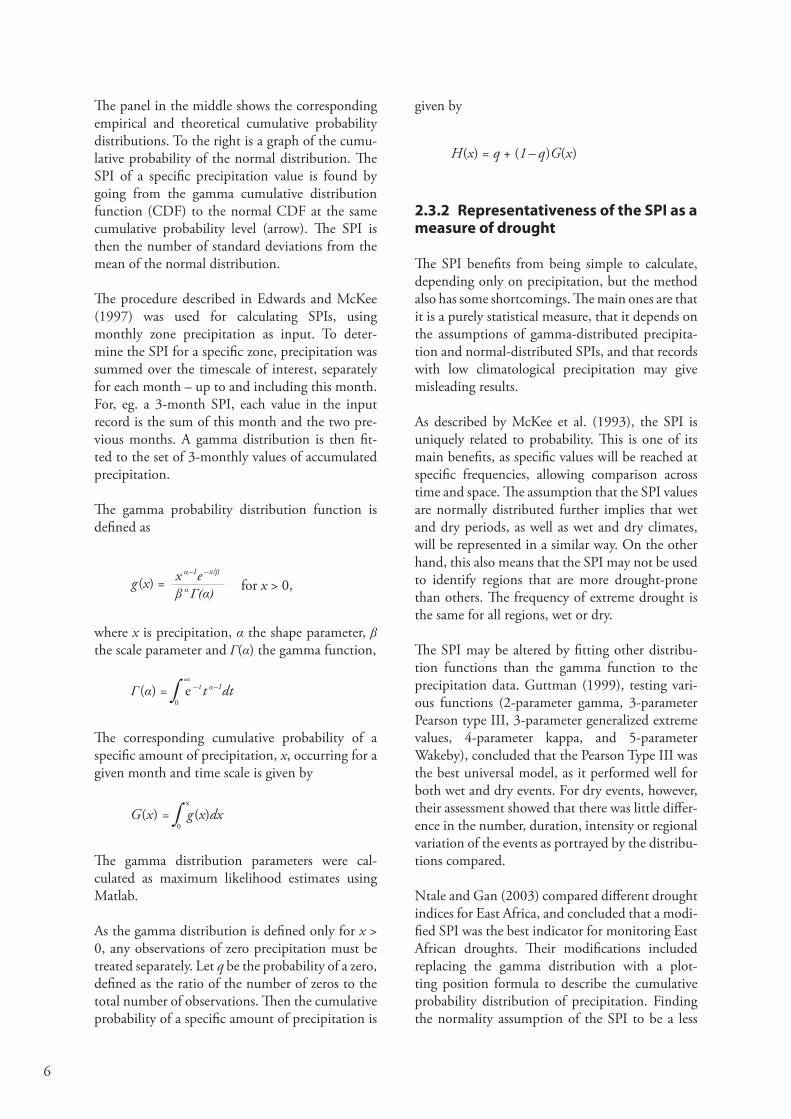
Precipitation is normally not normally distributed, and McKee et al. (1993) proposed a simple solu-tion to this problem by applying a gamma trans-formation to the distribution. First, the gamma distribution is fitted to the observed precipitation. The SPI values are then assumed to be normally distributed and are found by comparing two cumulative distribution functions: That of the gamma distributed precipitation and the normally distributed SPI values. The SPI of a specific obser-vation of precipitation is the standard deviation of the normal curve at the same cumulative probabil-ity level as the precipitation.
This principle is illustrated in Figure 2. The left panel shows a histogram made from example observations of precipitation, as well as the gamma probability function fitted to the distribution.
Viste, EllenFigure 2
-4 0-2 2 4
n
Precip min – max Precip min – max -1
1
00
1
std0
Figure 2 Calculating the Standardized Precipitation Index (SPI)a) is a bar histogram of a sample distribution of monthly precipitation, with the number of occurrences in each of 9 equally spaced precipitation classes. The red curve is the gamma probability distribution function (PDF) fitted to these data. b) shows the empirical cumulative probability distribution of the same data (markers), with the corresponding cumulative distribution function (CDF) of the fitted gamma function (red curve). c) shows the CDF of the standard normal distribution. As indicated by the arrows in b) and c), the SPI of a specific precipitation value may be found graphically by locating the gamma CDF value corresponding to this precipitation, and go to the same level of the normal CDF (horizontal arrow). The SPI is then the standard deviation of the normal distribution at this level, found at the horizontal axis. This is equivalent to fitting a gamma function to the data, and then assume that the SPI describing them is normally distributed.
a) b) c)
6
The panel in the middle shows the corresponding empirical and theoretical cumulative probability distributions. To the right is a graph of the cumu-lative probability of the normal distribution. The SPI of a specific precipitation value is found by going from the gamma cumulative distribution function (CDF) to the normal CDF at the same cumulative probability level (arrow). The SPI is then the number of standard deviations from the mean of the normal distribution.
The procedure described in Edwards and McKee (1997) was used for calculating SPIs, using monthly zone precipitation as input. To deter-mine the SPI for a specific zone, precipitation was summed over the timescale of interest, separately for each month – up to and including this month. For, eg. a 3-month SPI, each value in the input record is the sum of this month and the two pre-vious months. A gamma distribution is then fit-ted to the set of 3-monthly values of accumulated precipitation.
The gamma probability distribution function is defined ase – p = m dq
dt
H(x) = q + (1 – q)G(x)
E – P ≈ A
∑(e – p)ii=1
N
mqin = ∑mi qborder,ii=1
n
∆(mq) = ∑mi [ qend,i – qborder,i ]i=1
n
Z = x – xs
–
g (x) = x α–1e –x/β
β α Г(α)
Г(α) = ∫ e –
t t α
–1dt0
∞
G(x) = ∫ g (x)dx0
x
∆(mq)b,target = 100 x ∑mi [(qb,border )i – (qb,end )i ]i=1
nb
∑mj [(qborder )j – (qend )j ]j=1
ntotal
= 100 x ∆(mq)b
∆(mq)total
for x > 0,
where x is precipitation, α the shape parameter, β the scale parameter and Γ(α) the gamma function,
e – p = m dqdt
H(x) = q + (1 – q)G(x)
E – P ≈ A
∑(e – p)ii=1
N
mqin = ∑mi qborder,ii=1
n
∆(mq) = ∑mi [ qend,i – qborder,i ]i=1
n
Z = x – xs
–
g (x) = x α–1e –x/β
β α Г(α)
Г(α) = ∫ e –
t t α
–1dt0
∞
G(x) = ∫ g (x)dx0
x
∆(mq)b,target = 100 x ∑mi [(qb,border )i – (qb,end )i ]i=1
nb
∑mj [(qborder )j – (qend )j ]j=1
ntotal
= 100 x ∆(mq)b
∆(mq)total
The corresponding cumulative probability of a specific amount of precipitation, x, occurring for a given month and time scale is given by
e – p = m dqdt
H(x) = q + (1 – q)G(x)
E – P ≈ A
∑(e – p)ii=1
N
mqin = ∑mi qborder,ii=1
n
∆(mq) = ∑mi [ qend,i – qborder,i ]i=1
n
Z = x – xs
–
g (x) = x α–1e –x/β
β α Г(α)
Г(α) = ∫ e –
t t α
–1dt0
∞
G(x) = ∫ g (x)dx0
x
∆(mq)b,target = 100 x ∑mi [(qb,border )i – (qb,end )i ]i=1
nb
∑mj [(qborder )j – (qend )j ]j=1
ntotal
= 100 x ∆(mq)b
∆(mq)total
The gamma distribution parameters were cal-culated as maximum likelihood estimates using Matlab.
As the gamma distribution is defined only for x > 0, any observations of zero precipitation must be treated separately. Let q be the probability of a zero, defined as the ratio of the number of zeros to the total number of observations. Then the cumulative probability of a specific amount of precipitation is
given by
e – p = m dqdt
H(x) = q + (1 – q)G(x)
E – P ≈ A
∑(e – p)ii=1
N
mqin = ∑mi qborder,ii=1
n
∆(mq) = ∑mi [ qend,i – qborder,i ]i=1
n
Z = x – xs
–
g (x) = x α–1e –x/β
β α Г(α)
Г(α) = ∫ e –
t t α
–1dt0
∞
G(x) = ∫ g (x)dx0
x
∆(mq)b,target = 100 x ∑mi [(qb,border )i – (qb,end )i ]i=1
nb
∑mj [(qborder )j – (qend )j ]j=1
ntotal
= 100 x ∆(mq)b
∆(mq)total
2.3.2 Representativeness of the SPI as a measure of drought
The SPI benefits from being simple to calculate, depending only on precipitation, but the method also has some shortcomings. The main ones are that it is a purely statistical measure, that it depends on the assumptions of gamma-distributed precipita-tion and normal-distributed SPIs, and that records with low climatological precipitation may give misleading results.
As described by McKee et al. (1993), the SPI is uniquely related to probability. This is one of its main benefits, as specific values will be reached at specific frequencies, allowing comparison across time and space. The assumption that the SPI values are normally distributed further implies that wet and dry periods, as well as wet and dry climates, will be represented in a similar way. On the other hand, this also means that the SPI may not be used to identify regions that are more drought-prone than others. The frequency of extreme drought is the same for all regions, wet or dry.
The SPI may be altered by fitting other distribu-tion functions than the gamma function to the precipitation data. Guttman (1999), testing vari-ous functions (2-parameter gamma, 3-parameter Pearson type III, 3-parameter generalized extreme values, 4-parameter kappa, and 5-parameter Wakeby), concluded that the Pearson Type III was the best universal model, as it performed well for both wet and dry events. For dry events, however, their assessment showed that there was little differ-ence in the number, duration, intensity or regional variation of the events as portrayed by the distribu-tions compared.
Ntale and Gan (2003) compared different drought indices for East Africa, and concluded that a modi-fied SPI was the best indicator for monitoring East African droughts. Their modifications included replacing the gamma distribution with a plot-ting position formula to describe the cumulative probability distribution of precipitation. Finding the normality assumption of the SPI to be a less

7
good approximation on timescales of six months or shorter, they used the Pearson type III distri-bution to describe the SPIs. The downside of this procedure is that it generates a drought classifica-tion in which the SPI range of each category varies with the timescale of the drought.
In dry regions, and regions where precipitation is predominantly seasonal, the statistical nature of the SPI may produce results that are easily mis-interpreted, or have limited value, especially on shorter timescales. In the highlands of Ethiopia, the northern hemisphere summer is the main rainy season, whereas the northern hemisphere winter is mainly dry (Griffiths 1972; Korecha and Barnston 2007). In a running 3-month SPI, small absolute deviations in winter precipitation will generate more extreme SPI fluctuations than larger absolute deviations in summer precipitation. The implica-tions of a lack of rain during summer are clearly much more severe. On the other hand, even though the SPI is theoretically unbounded, the existence of zeros in the precipitation records introduces a lower bound (Wu, Svoboda et al. 2007).
According to Guttman (1999), the number of
data points also limits the range of the SPI, and SPIs with timescales longer than 24 months may be unreliable. McKee et al. (1993) recommended using record containing at least 30 years of data when calculating the SPI. Comparing scales of ~30 and ~100 years, Wu et al. (2005), concluded that different lengths of records could give dif-ferent results, especially for long timescales, and especially when evaluating the severity of severe droughts.
Despite the limitations of the gamma-based SPI, there are good reasons for using it as a drought indicator, one of them being that it is easily cal-culated and easily interpreted. An analysis of the physical meaning of the parameters (α and β) in the gamma distribution in African climates was presented by Husak et al. (2007). Regions were described on a monthly basis as either scale-domi-nated, with variable rain and more extreme events; or shape-dominated, with consistent rain and fewer extreme events. Overall and for all months, they found the gamma distribution to be suitable for roughly 98 % of the cells in a 0.1 degree grid over Africa.
3 Regional variations and the seasonal precipitation cycle
In Ethiopia, the elevation ranges from 130 meters below sea level in the dry Denakil depression in the Northeastern Lowlands (zone I, Figure 1), to 4550 meters above sea level on Ras Dashen in the Northern Highlands (zone III). The climatologi-cal variation is correspondingly large, both in total precipitation amounts and in the seasonality of the precipitation. As shown in Figure 1, the veg-etation goes from arid/semi-arid in the lowlands in the Southeastern Lowlands (zone XII-A) and Northeastern Rift Valley (zone 1), to lush green in the highlands and part of the Rift Valley cutting through them, from the southwest to the north-east. The vegetation map reflects the distribution of precipitation. As shown in Figure 3, the annual precipitation ranges from less than 300 mm in the Northeastern and Southeastern Lowlands (zone I and XII-A) to more than 1700 mm in the Southwestern Rainforest (zone VI).
The seasonal precipitation cycle varies mainly from the southeast to the northwest, as seen by com-paring the seasonal share of the annual precipita-tion, in the lower panel in Figure 3. The northern hemisphere spring season, February–May, plays a role in most of the country, with shares of the annual precipitation ranging from 12 % in the Northwestern Highlands (zone IV) to 62 % in the Southeastern Lowlands (zone XII-A). In the three southernmost zones, spring is the wettest season. The spring rains are important not just for the spring crops, accounting for 5–15 % of the national food crop, but also for improving pasture for livestock, and for the planting of long-season crops that are harvested in September–December (Degefu 1987; McCann 1990; Funk, Asfaw et al. 2003). The inter-annual variability of the spring rains is higher than the summer rains, and on resource-poor farms, the spring crop may be what determines whether the annual productivity

8
reaches the critical margin (McCann 1990).
June–September is the main rainy season in the rest of the country, contributing to more than 70 % of the annual precipitation in the north and northwest (figure 3). About 85–95 % of the Ethiopian food crop is produced in this season (Degefu 1987). In the Northern Highlands (zone III) a substantial part of the annual precipitation falls in July–August (figure 3). This is the time when the tropical rain belt associated with the Intertropical Convergence Zone (ITCZ) is at its northernmost position, above Northern Ethiopia and Eritrea (Degefu 1987; Leroux 2001).
The only region where June–September cannot be considered a rainy season, is in the Southern and Southeastern Lowlands (zones XII-A and XII-B). In addition to spring, October–November is important in the south and southeast, providing 20–26 % of the annual precipitation. The actual
amount of precipitation falling in October–November is as high, or higher, in parts of the highlands as in the dry lowlands. Still, in the high-lands, both the spring and the summer precipita-tion exceed that of October–November (figure 3). Together with December–January, this is mainly a harvest season (Degefu 1987).
During December–January, no part of the country receives more than 6 % of the annual precipita-tion, in several zones as little as 1 % (figure 3). The rain that occasionally falls during these months is important for grazing cattle, and the absence such rainfall in 1983–1984 marked the begin-ning of catastrophic 1984 drought (Degefu 1987). However, as these months are generally dry, they constitute a barrier between the growth seasons. Thus it is practically meaningful to consider the 12-month accumulated precipitation at the end of the year as a collective drought measure for the year.
4 Comparison of drought episodes
Drought has occurred at different times in dif-ferent parts of Ethiopia. This is partly a result of the variation in the seasonal precipitation cycle; as discussed in Section 3, the impact of missing rain during spring or summer is not the same in all zones. Webb et al. (1992) identifies the southern, southeastern and northeastern parts of Ethiopia as
most often affected by drought and famine. This is equivalent to zones I, II, VII, XII-A and XII-B, and parts of VII, X-A, X-B, and III. Three factors are mentioned as differing in these regions, compared to the rest of the country: Population pressure, agro-ecological resource base, and climate (Webb, Braun et al. 1992). In the first part of this section
Figure 3 The seasonal precipitation cycle in Ethiopian rainfall zones1971–2000 monthly mean precipitation [mm] (first row; left colorbar), annual [mm] (first row; middle colorbar); and monthly (second row) and seasonal (third row) share of annual precipitation [%] (right colorbar, and white numbers in the seasonal maps).
Viste, EllenFigure 3
mm
%
%
Jan mean [mm]
Jan
Jan % of annualI: 1%II: 3%III: 0%IV: 1%V: 0%VI: 1%VII: 3%VIII: 3%IX: 1%X−A: 3%X−B: 1%XI: 2%XII−A: 0%XII−B: 2%
Jul mean [mm]Jul
Jul % of annualI: 17%II: 22%III: 30%IV: 25%V: 21%VI: 17%VII: 9%VIII: 12%IX: 22%X−A: 16%X−B: 12%XI: 11%XII−A: 0%XII−B: 3%
Feb mean [mm]
Feb
Feb % of annualI: 5%II: 5%III: 2%IV: 0%V: 0%VI: 2%VII: 5%VIII: 4%IX: 3%X−A: 5%X−B: 4%XI: 4%XII−A: 1%XII−B: 4%
Aug mean [mm]
Aug
Jul % of annualI: 17%II: 22%III: 30%IV: 25%V: 21%VI: 17%VII: 9%VIII: 12%IX: 22%X−A: 16%X−B: 12%XI: 11%XII−A: 0%XII−B: 3%
Mar mean [mm]
Mar
Mar % of annualI: 14%II: 7%III: 3%IV: 1%V: 1%VI: 4%VII: 8%VIII: 7%IX: 5%X−A: 8%X−B: 7%XI: 7%XII−A: 4%XII−B: 8%
Sep mean [mm]
Sep
Sep % of annualI: 9%II: 11%III: 6%IV: 14%V: 14%VI: 15%VII: 9%VIII: 11%IX: 12%X−A: 12%X−B: 14%XI: 11%XII−A: 6%XII−B: 7%
Apr mean [mm]
Apr
Apr % of annualI: 10%II: 7%III: 7%IV: 2%V: 4%VI: 6%VII: 15%VIII: 13%IX: 6%X−A: 11%X−B: 12%XI: 14%XII−A: 28%XII−B: 21%
Oct mean [mm]
Oct
Oct % of annualI: 10%II: 5%III: 2%IV: 7%V: 8%VI: 7%VII: 12%VIII: 10%IX: 5%X−A: 6%X−B: 7%XI: 12%XII−A: 18%XII−B: 17%
May mean [mm]
May
May % of annualI: 7%II: 8%III: 8%IV: 8%V: 13%VI: 13%VII: 13%VIII: 13%IX: 9%X−A: 9%X−B: 16%XI: 13%XII−A: 29%XII−B: 20%
Nov mean [mm]
Nov
Nov % of annualI: 2%II: 2%III: 2%IV: 2%V: 2%VI: 2%VII: 8%VIII: 4%IX: 1%X−A: 2%X−B: 1%XI: 4%XII−A: 7%XII−B: 8%
Jun mean [mm]
Jun
Jun % of annualI: 2%II: 4%III: 7%IV: 14%V: 14%VI: 15%VII: 8%VIII: 10%IX: 12%X−A: 6%X−B: 9%XI: 7%XII−A: 3%XII−B: 4%
Dec mean [mm]
Dec
Dec % of annualI: 1%II: 2%III: 0%IV: 1%V: 1%VI: 1%VII: 3%VIII: 1%IX: 1%X−A: 1%X−B: 1%XI: 1%XII−A: 1%XII−B: 2%
%
Colorbar for percentage plots [%]
0
20
40
60
80
Feb–May
Feb−May % of annualI: 36%II: 27%III: 19%IV: 12%V: 18%VI: 25%VII: 41%VIII: 37%IX: 23%X−A: 34%X−B: 40%XI: 39%XII−A: 62%XII−B: 53%
34
3619
1227
232525
41 37 3940
6253
Jun–Sep
Jun−Sep % of annualI: 51%II: 62%III: 76%IV: 77%V: 72%VI: 63%VII: 33%VIII: 45%IX: 68%X−A: 55%X−B: 51%XI: 42%XII−A: 11%XII−B: 18%
55
5176
7762
686372
33 45 4251
1118
Oct−Nov % of annualI: 11%II: 7%III: 4%IV: 9%V: 10%VI: 10%VII: 20%VIII: 13%IX: 7%X−A: 8%X−B: 8%XI: 16%XII−A: 25%XII−B: 26%
8
114
97
71010
20 13 168
2526
Oct–Nov
Dec−Jan % of annualI: 2%II: 5%III: 1%IV: 1%V: 1%VI: 2%VII: 6%VIII: 4%IX: 2%X−A: 4%X−B: 2%XI: 3%XII−A: 1%XII−B: 4%
4
21
15
22
6 4 32
14
1
Dec–Jan
Annual
mm/yr
Colorbar for seasonal plots [mm]
0
600
1200
1800
mm/mn
Colorbar for monthly plots [mm]
0
100
200
300
400

9
the Standardized Precipitation Index (SPI) is used to assess the severity of drought episodes during 1972–2011. Then the most severe year during the last decade, 2009, is discussed in more detail.
When discussing drought, precipitation anoma-lies during seasons with low mean precipitation in each zone will not be taken into account. This does not mean that less than normal precipitation at
this time of the year is without consequences, eg., for specific crop types, but that precipitation defi-ciencies during the dominant rainy seasons have a much larger impact. The timing of the onset and cessation, as well as the frequency and duration of dry spells during the season also have an impact on the effect of Ethiopian droughts (Segele and Lamb 2005). This question has not been addressed, as only monthly precipitation data were available.
4.1 Severity of drought episodes since 1971
Mild drought occurred in parts of the Rift Valley and the Northeastern Highlands at the end of 1971. But 1971 was not particularly dry, and data for this year have not been included in Figure 4, showing the 12-months SPI in December in each of the zones during 1972–2010. The rank of the SPI is the same as the rank of the annual precipita-tion. As the maps indicate, well-known drought episodes are associated with different degrees of severity on the SPI classification scale described in section 2.3. Some years, like 1984, 2002 and 2009, were dry in most of Ethiopia, whereas other episodes, like the drought in the south in 1999–2000, affected more limited regions. Similar to the annual values in Figure 4, Figure 5 and Figure 6 show 4-months SPI values in May and September, representing spring and summer, respectively.
SPI values are statistical expressions of the severity of a drought, relative to how unusual each drought level is. It is not possible to infer anything about the amount of missing water from SPI values. As a measure of the precipitation deficiency, Figure 7 shows the percentage of the annual precipita-tion corresponding to the annual SPI-droughts in Figure 4. The relative reduction of precipitation in unusually dry years is higher in dry zones like the Northeastern Rift Valley (I) and the Southern (XII-B) and Southeastern (XII-A) Lowlands than in precipitation-rich zones like the Central Highlands (IX) and the Southwestern Rain Forest (VI). For example, the year 1984 was the driest in the record in both the Northeastern Rift Valley (I) and the Northeastern Highlands (II); the Northeastern Highlands being most extreme on the SPI scale (Figure 4). Still, the relative reduc-tion in precipitation (Figure 7) was larger in the Northeastern Rift Valley, which received only 18
% of the annual mean precipitation this year, com-pared to 59 % in the Northeastern Highlands.
The following sections describe selected drought periods, with reference to Figures 4–7. SPI maps for every month at timescales of 3, 4, 6, 9, 12 and 24 months have also been examined, but are not shown. When discussing seasonal drought, the 4-month timescale for May (spring) and September (summer) is used, unless otherwise specified.
4.1.1 1972–1975
The 1972–1975 drought may mainly be con-sidered a combination of distinct episodes, and most of Ethiopia experienced moderate, severe or extreme drought at some stage. The most extreme single season, was the spring of 1973, which was severely or extremely dry in a band crossing the country from the southwest to the northeast. In 6 of the 14 zones, this was one of the three driest spring seasons during 1972–2011 (Figure 5). The following summer was not particularly dry, but 1973 still ended up among the 1–5 driest years in 4 zones – in the Eastern Highlands (XII-A) the dri-est, with 63 % of the annual mean precipitation (Figure 7). In half of the zones, this was the second drought year in a row. In 1974 and 1975, seasonal drought occurred in some zones, but the wet sum-mer of 1975 led to above-normal precipitation in most of the country, except in the southeast.
4.1.2 1980–1982
During the early 1980s, drought occurred in differ-ent parts of the country at different times. In 1980,

10
1975 1980 1985 1990 1995 2000 2005 2010
<0 <−1 <−2 <−3 <−41 234 56 78 91011 1213 141512 345 67 89
12 3 45 67 89 10111213141 23 45 67 8910 11 121314 15 161718
1 2345 6 712 3 4 8765 11019 12
2134 56 7 89 10 312111 51411617 181 23 45678 9 1011 1213141 234 56 789 10 11 12 13
1 2 34 5 67 8910 11 12 1312 3 4 5678 910312111 1415
123 456 78 910111 2 3 45 6 87 910 1112
12 3465 7110198 121314
IIIIIIIVVVIVIIVIIIIXX−AX−BXIXII−AXII−B
72Year 73 74 75 76 77 78 79 80 81 82 83 84 85 86 87 88 89 90 91 92 93 94 95 96 97 98 99 00 01 02 03 04 05 06 07 08 09 10
Viste, EllenFigure 4
1975 1980 1985 1990 1995 2000 2005 2010
<0 <−1 <−2 <−3 <−41 23 456 879 1011
32145 6789 1011 12213 54 768 91011 12 1314
1 2 34 5 678 910 111213 1412 345 67 89
12 3 465 78 910 11 1213 1415 161 2 345 9876101112 1314
1 23 45 6 78 91011 12 13 142134 5 67 89 1011 12 1314 15
1 2 34 5678 2111019 1314123 45 67 89 1041312111
12 34 5 6 78 91011 12 13141 23 4 56 7 8910 113121 1415
12 34 56 78 9 211101131415 1617
72Year 73 74 75 76 77 78 79 80 81 82 83 84 85 86 87 88 89 90 91 92 93 94 95 96 97 98 99 00 01 02 03 04 05 06 07 08 09 10 11
IIIIIIIVVVIVIIVIIIIXX−AX−BXIXII−AXII−B
Viste, EllenFigure 5
1975 1980 1985 1990 1995 2000 2005 20100
<0 <−1 <−2 <−3 <−41 23 54 67 8910 111213 141 234 5 6 78 9 1011 12 131 23 4 56 78 91011 12
1 23 45678 910 11 12131415 1621 43 56 78 9
213 45 76 89 10 11 12154326 78 9 1011 312114
1 234 5 6 7 801911 1213141512 34 56 70198 1112 1314151 23 45 687 01911 121314 157161
1 23 546 7 89 10 1112 1312 34 5678 9 1011 12131415
123 45 67 89 10 413121111 2 345 76 8 01911 121314 15
72Year 73 74 75 76 77 78 79 80 81 82 83 84 85 86 87 88 89 90 91 92 93 94 95 96 97 98 99 00 01 02 03 04 05 06 07 08 09 10
IIIIIIIVVVIVIIVIIIIXX−AX−BXIXII−AXII−B
Viste, EllenFigure 6
Figure 4 Annual SPI and rank (upper)Figure 5 Spring SPI and rank (middle)Figure 6 Summer SPI and rank (lower)SPI during drought periods, as timeseries and maps for Ethiopian precipitation zones. Annual values are 12-months SPI for December, spring 4-months SPI for May and summer 4-months SPI for September. The color shows the severity of drought according to the SPI scale at the upper right. The white numbers show the rank of this year/season among the driest for each zone. The lower maps summarize the situation for the country. Well-known drought years have been marked with orange under the annual maps. Dots at the horizontal axes mark years where at least one zone is at its driest. Annual SPI values are based on running 12-months accumulations, and spring and summer on 4-months. Gray, horizontal bars indicate missing values. The small maps to the left show the location of each zone.
Summer
Spring
Annual

11
the Southeastern Lowlands (zone XII-A) experi-enced severe drought at all the timescales consid-ered, with extreme drought at timescales of 6–24 months. As shown in Figure 4, this was the driest year in this zone. The summer of 1982 was severely dry in the Northern (III), Northwestern (IV), Northeastern (II) and Central (IX) Highlands, making this the driest year in the Northwestern Highlands (IV) (Figure 6 ).
4.1.3 1984
Webb et al. (1992) noted that when severe drought hit Ethiopia in 1984, the famine was already under way, as a result of dry episodes during the previ-ous years. Although 1983 was close to normal in most of Ethiopia, a dry dry-season in the winter of 1983–1984 caused problems for livestock and led to pastoralist movements as early as January 1984 (Degefu 1987). Segele and Lamb (2005) also extensively demonstrated the severity of the 1984 drought over Ethiopia, particularly during the summer season.
As shown in Figures 4–6, the drought in 1984 was severe in the northeastern half of the country, while all zones were affected at the seasonal level. In half of the zones, 1984 was among the three driest years, being the driest in the Northeastern Rift Valley (zone I), the Northeastern Highlands (II), the Central Highlands (IX), and the Central
Rift Valley (VIII). The Northeastern Rift Valley (I) received only 18 % of its mean annual precipita-tion (Figure 7), by far the highest relative devia-tion in any zone during 1972–2010. The severity of the 1984 drought was strengthened as all the three rainy seasons were dry in those parts of the country where they are effective. April and August were the most extreme months, and a dry October contributed to the mild–moderate drought in the south.
Degefu (1987) gives an account of the develop-ment of the 1984 drought in Ethiopia, including a description of the atmospheric circulation dur-ing spring and summer. In the spring season, the interaction between tropical lows and middle lati-tude low pressure systems was hindered by pres-sure anomalies over the Sahara and the Arabian Peninsula. In general, wave activity was reduced (Degefu 1987). The ERA-Interim wind field at 700 and 850 hPa suggests that the transport of air and moisture from the equatorial Indian Ocean toward Ethiopia in April was reduced, and the vertical velocity at 500 hPa indicates reduced con-vection / increased subsidence over the Horn of Africa (not shown). The tropical cyclone Kamisy, which developed over the Southern Indian Ocean in April 1984, has been blamed for disturbing the normally northwestward flow of moisture (Shanko and Camberlin 1998).
During the summer season, many of the
Annual
1975 1980 1985 1990 1995 2000 2005 20100
0 50 100 %
18 294851 525980 808889
5555 57 586378 8282 8282
54 667075768083 85 8888
47277676 7881 8182 838384 848687 89
63 63 7480 815965 65 66 69
657173 747740 50 53 5767
5664 656873
72Year 73 74 75 76 77 78 79 80 81 82 83 84 85 86 87 88 89 90 91 92 93 94 95 96 97 98 99 00 01 02 03 04 05 06 07 08 09 10
IIIIIIIVVVIVIIVIIIIXX−AX−BXIXII−AXII−B
Viste, EllenFigure 7
Figure 7 Percentage of mean annual precipitationPercentage of annual mean precipitation during SPI-defined, 12-month-scale drought periods, as timeseries and maps for Ethiopian precipitation zones. The values for the 5 driest years for each zone are displayed. The lower maps summarize the situation for the country. Dots at the horizontal axes mark years where one or more zones is at its driest.

12
characteristic atmospheric circulation anomalies during dry Ethiopian summers (Segele, Lamb et al. 2009) may be seen in the reanalysis fields. Eg, in August the low-level East African jet was weaker than normal, causing less transport of moisture from the Indian Ocean. Easterly anomalies in the 700 and 850 hPa winds to the west of Ethiopia sig-nifies reduced transport from Central Africa, and southerly anomalies above northern Ethiopian and the southern Red Sea indicates less transport from the north. Convection was reduced, not only in Ethiopia, but in a band reaching across the Sahel and into the Atlantic Ocean. GPCP anomaly maps for July and August (not shown) show that the rainbelt above Africa was reduced or deflected southward.
4.1.4 1987
In 1987, the wettest spring season during 1972–2011 was followed by the all-over driest summer season (Figure 6). This episode can be character-ized as a summer drought in the highlands, reach-ing extreme levels on the 4-months scale. This was primarily caused by missing rain in July. Followed by a dry fall, and then a dry spring in 1988, the drought reached extreme levels also on the 12-month scale in May 1988. A wet summer then ended the drought on all scales below 12 months. According to Webb et al. (1992), the spring crops were destroyed by locust invasions, and this may have exacerbated the effect of the consecutive sum-mer drought.
4.1.5 1990–1992
During 1990–1992 all zones experienced moder-ate, extreme or severe drought on the seasonal or annual level. 1990 and 1991 were dry years in all of Ethiopia, with the exception of a small posi-tive deviation in the Northeastern Rift Valley (I) in 1990. A severely dry spring in 1992 followed, causing extreme drought on the 12-month scale in the Southern (XII-B) and Southeastern (XII-A) Lowlands, as well as in the Northeastern Rift Valley (I) and the Northwestern Highlands (IV). In the Southern Lowlands (XII-B), the spring of 1992 was the worst during 1972–2011, and in the Southeastern Lowlands (XII-A) the second worst (Figure 5). These zones get 50–60 % of the annual precipitation in spring (Figure 3). As a result, the
Southeastern Lowlands (XII-A) received only 50 % of the mean annual precipitation in 1992 (Figure 7).
4.1.6 1999–2000
The years 1998, 1999 and 2000 were all dry in the south, mainly due to dry spring seasons. In January–February 1999, the three southwestern zones (VII, VIII and XII-B) already experienced mild to moderate drought on the 12-month timescale. Though 1992 was comparable at some time scales, the worst drought in the Southern Lowlands (XII-B) occurred in 1999–2000. The year 1999 was the driest year during 1972–2010 in this zone, and severe drought occurred at all time-scales at some stage. Similarly, the combination of 1999 and 2000 made this the driest period on the 24-month timescale.
The spring season in 1999 was dry in all of Ethiopia in both years, and as shown in Figure 5, seasonal drought occurred in most of the coun-try. In the Northern (III), Northeastern (II) and Central Highlands (IX) the 1999 spring was the driest during the record. Summer and fall were wet in the highlands, leading to normal or above-normal annual precipitation in the northern half of the country. The spatial anomaly pattern for 2000 is strikingly similar to that of 1999, with a dry spring followed by a wet summer in the north, this time with a wet fall season everywhere, except in the southwest.
4.1.7 2002–2003
Due to a dry spring followed by a dry summer, 2002 became one of the driest years during 1972–2011. In the Southwestern Rain Forest (VI) this was the driest year, and in the Central Rift Valley (VII), the Central Highlands (IX), and the Southern Highlands (XI) the second driest (Figure 4). After a dry spring in 2003, a wet summer brought some relief, but 2003 was also drier than normal. In the Southwestern Rain forest (VI) the drought was extreme at all timescales from 3 to 24 months, and at some timescales also in adjacent zones and in the Southern Highlands (XI). At the 12-month scale, moderate to severe drought persisted in most of the highlands and the Central Rift Valley from June–July 2002 through July 2003.

13
4.1.8 2008–2011
Figure 5 displays a visual cluster of dry spring sea-sons during the last decade. This is in accordance with Williams and Funk (2011), linking decreasing precipitation in East Africa in March–June with an eastward displacement of the circulation above the Indian Ocean. The drought from 2008 until the present has been characterized by the repeti-tion of dry spring seasons. Dry springs affect all of Ethiopia, causing the largest relative precipitation deficits in the south, where this is the main rainy season (Figure 3). Except for a wet intermezzo in 2006, and three years with just above-normal val-ues in one of the zones, the Southern (XII-B) and Southeastern (XII-A) lowlands have been drier than normal in every year from 1998 through 2010 (Figure 4). During this period, only 1998, 2005 and 2006 did not experience some degree of drought in at least one of these zones (Figure 4). This set the stage for the recent drought.
Among the recent years, 2009 stands out as the driest, being among the three driest years during 1972–2010 in 5 of the 14 zones. In the Southern Highlands (XI), this was the driest year in the record, and in the Northeastern Rift Valley (I) and the Southern Rift Valley (VII) the second driest year. As shown in Figure 5, the spring season was dry in both 2008 and 2009, with the exception of the westernmost part. In most of the country, at least one of these springs was among the three driest during 1972–2011. Then came the summer of 2009, the driest or second driest in 5 of the 14
zones.
As shown in Figure 4, 2009 was the only year dur-ing 1972–2011 when drought occurred on the annual scale in all of Ethiopia, in most zones rang-ing from moderate to severe. In most zones, more extreme levels of drought were reached during other years, but the drought was never as wide-spread, neither on annual, nor on seasonal levels (Figures 5–6).
The year 2010 was also dry in the south, ending with mild to moderate drought on the 12-month timescale in December (Figure 4). For the rest of Ethiopia, the picture is mixed. The drought in the south continued with a dry spring in 2011 (Figure 5), and at the end of the record in May 2011 the drought in the Southern and Southeastern Lowlands (XII-B and XII-A) was still severe on timescales of 12 and 24 months. In the Eastern Highlands (X-B), the 2011 spring was the driest during 1972–2011.
Though confirming the existence of extreme to severe drought in southern Ethiopia in 2010–2011, the zone-aggregated precipitation data do not confirm the extremeness previously reported (USAID/FEWS 2011); the driest year in 60 years. The driest 12-month periods in the Southern and Southeastern Lowlands (zones XII-A and XII-B) occurred in 1992 and 2000, respectively. This does not exclude the possibility of local conditions in 2011 being even worse than at the zone level.
Viste, EllenFigure 8
−4
−3.5
−3
−2.5
−2
−1.5
−1
−0.5
0
2 2 2 3 2 47 6 2 2 7 2 2
5 6 1 1 2 1 1 71 1 1 1 1 2 91 1 2 1 1 91 2 4 3 9 61 2 2 5 10 7
2009
5 5 5 8
6 4 55 3 2 25 8 9 9
8
2002
1 1 1 4 3 1 1 13 1 3 2 1 4 2 12 4 4 6 1 72 5 5 109 1 2 10 2 6 38 3 3 8 5
3 1 1 4 3 1 7 2
1984
a) b) c)
Figure 8 Continental SPI distribution in 1984, 2002 and 200912-month SPI index of GPCP V2.2 in December 1984 (a), 2002 (b) and 2009 (c). The small, inset maps show the rank among the driest years during1979–2010, for a region surrounding Ethiopia.
a) b) c)

14
4.2 A closer look at 2009
In Section 4.1, 2009 was found to be the driest among the recent years, while 1984 must be said to be the driest year during 1972–2010. The droughts in Ethiopia in the 1970s and 1980s were part of a drought belt ranging from the West African Sahel to the Horn of Africa, a typical African drought pattern (Nicholson 1986; Flohn 1987; Mattsson and Rapp 1991). However, there is no one-to-one correspondence between precipitation anomalies in the Sahel and the Horn of Africa (Flohn 1987), and 2009 does not appear to be a typical example of this kind of situation. In this section we will briefly discuss some of the large-scale features asso-ciated with the 2009 drought.
4.2.1 Continental-scale drought: 2009 compared with 1984 and 2002
Figure 8 shows the large-scale drought patterns in the three driest years in Ethiopia: 1984, 2002 and 2009. SPI values based on the GPCP data set demonstrate quite distinct patterns for these three years. Whereas the 1984 drought covered a latitudinal belt across Africa, including the Sahel and northern Ethiopia, the 2009 drought struck Ethiopia and the regions to the southwest:
northwestern Kenya, Uganda, South Sudan, and parts of the Central African Republic and the Democratic Republic of the Congo. The year 2002 was dry in Ethiopia and West Africa, but without the consecutive trans-African belt characterizing 1984.
Even though both the spring and the summer sea-son were dry in both 1984 and 2009 (Section 4.1), the large-scale patterns in Figure 8 reflect the fact that in 1984 the summer was the most extreme season, whereas the spring was particularly dry in 2009. The 1984 drought follows the northern hemisphere summer rain belt, whereas the core of the 2009 drought is located farther south, covering the Horn of Africa and the northern part of East Africa. In these regions the February–May season is at least as important.
As the rank map in the lower left corner shows, 2009 was the driest or second driest year in most of Ethiopia in the GPCP data; more severe than both 1984 and 2002. The discrepancy between the gauge-based zone data described in this study and the satellite-based, gauge-adjusted GPCP data set may have several causes. The GPCP data benefit from having satellite-based data in regions
Viste, EllenFigure 9 a–d
Moisture flux divergence anomaly in 04−04 2009
0° 30° 60°
−30°
−15°
0°
15°
30°
−2
−1.5
−1
−0.5
0
0.5
1
1.5
Moisture flux divergence in months 04−04
0° 30° 60°
−30°
−15°
0°
15°
30°
−2.0
−1.5
−1.0
−0.5
0.0
0.5
1.0
1.5
x 10−4
Vertically integrated q flux anomaly in 04−04 2009
0° 30° 60°
−30°
−15°
0°
15°
30°
10
0
kg/ms kg/m2s
20
30
40
50
60
70
80
90
100
Vertically integrated moisture flux in months 04−04
0° 30° 60°
−30°
−15°
0°
15°
30°
50
0
100
150
200
250
300
350
400
Vertically integrated q flux anomaly in 04−04 2009
0° 30° 60°
−30°
−15°
0°
15°
30°
10
20
30
40
50
60
70
80
90
Moisture flux divergence anomaly in 04−04 2009
−15°
0°
15°
30°
−1
−0.5
0
0.5
1
1.5
x 10−4
April 2009
Vertically integrated moisture flux in months 04−04
0° 30° 60°
−30°
−15°
0°
15°
30°
50
100
150
200
250
300
350
Moisture flux divergence in months 04−04
0° 30° 60°
−30°
−15°
0°
15°
30°
−2
−1.5
−1
−0.5
0
0.5
1
1.5
x 10−4
April
Vertically integrated moisture flux in months 07−08
0° 30° 60°
−30°
−15°
0°
15°
30°
50
100
150
200
250
300
350
Moisture flux divergence in months 07−08
0° 30° 60°
−30°
−15°
0°
15°
30°
−2
−1.5
−1
−0.5
0
0.5
1
1.5
x 10−4
Jul–Aug
Vertically integrated q flux anomaly in 07−08 2009
0° 30° 60°
−30°
−15°
0°
15°
30°
10
20
30
40
50
60
70
80
90
Moisture flux divergence anomaly in 07−08 2009
−15°
0°
15°
30°
−1
−0.5
0
0.5
1
1.5
x 10−4
Jul–Aug 2009
2.0
x 10 −42.0
a) b)
c) d)
Figure 9 Moisture flux anomalies in 2009ERA-Interim vertically integrated moisture flux and moisture flux divergence (small, inset maps): 1981–2010 means in April (a) and July–August (b), and deviations from this mean in April 2009 (c) and July–August 2009 (d). The white, background arrows in c) and d) represent the mean flux shown in a) and b), respectively.
a)
c) d)
b)

15
where observations are generally scarce, like the Southwestern and Southeastern Lowlands (zones V and XII-B; Figure 1). On the other hand, the number of Ethiopian gauges with freely available data is very limited, implying that anomalies at these stations may be given too much weight in other parts of Ethiopia. As there are large local variations in rainfall in Ethiopia, the quality of the GPCP and similar data sets is lower than it would have been if more ground observations had been included (Dinku, Ceccato et al. 2007).
4.2.2 Atmospheric moisture transport in 2009
Atmospheric circulation anomalies indicate that deflections of the transport of moisture to Ethiopia contributed to the drought in 2009 (Figure 9). During the northern hemisphere winter, the low-level flow along the coast of East Africa is northeasterly. In spring, a southerly flow begins, developing into the Somali, or East African low-level Jet in summer (Findlater 1969; Findlater 1969; Findlater 1977; Riddle and Cook 2008). In April, this jet is still under development, with a southeasterly flow reaching the coast of Kenya and Tanzania, while the flow in the northern Indian Ocean is still mainly northeasterly, enter-ing the coast of the Horn of Africa from the east. As shown in Figure 9a, the convergence zone that covers most of Ethiopia in April, occurs as this easterly flow meets the southeasterly flow bringing moisture from the Southern and Equatorial Indian Ocean.
Figure 9c shows how southwesterly anomalies deflected moisture away from the coast of East Africa in April 2009. This is a result of similar anomalies in the low-level wind field, seen at 700 and 850 hPa (not shown). The anomalies hinder both the flow from the southeast and the east, resulting in a divergence anomaly covering most of Ethiopia. The convergence anomaly to the south-west of Ethiopia is due to the northeasterly anom-aly in this region, the result of a strengthening of the 700 hPa wind field (not shown).
During the northern hemisphere summer, air masses from the Indian Ocean, Central Africa and the Red Sea region flow toward Ethiopia (Mohamed, Hurk et al. 2005; Korecha and Barnston 2007; Levin et al. 2009; Segele, Lamb et
al. 2009; Viste and Sorteberg 2011). As shown in Figure 9b, this causes strong moisture convergence above the Ethiopian highlands. Reduced precipita-tion may occur either if less moisture enters the highlands, or due to reduced convergence and ascent. Figure 9d shows reduced convergence above large parts of Ethiopia in July–August 2009, as well as in a zone to the southwest, reaching from Ethiopia across the continent to the Gulf of Guinea. There is a large belt of easterly anomalies in the moisture flux in this region, as well as in the transport into the continent from the Indian Ocean through the Turkana Channel in southern Ethiopia and northern Kenya. More moisture than normal entered both Ethiopia and the rest of the continent in this region, but the easterly anomaly farther west was stronger, leading to divergence. The inflow of moisture from the Red Sea to Ethiopia was also reduced.
The moisture transport anomalies in April and July–August 2009, were in line with previously documented conditions that reduce precipitation Ethiopia. The transport in April was similar to the transport in the driest spring seasons discussed by Williams and Funk (2011), whereas easterly anom-alies in the July–August transport above Central Africa are known to cause reductions in the inflow of moisture to the Ethiopian highlands (Segele, Lamb et al. 2009; Williams, Funk et al. 2011; Viste and Sorteberg 2011; Viste and Sorteberg 2012). The question remains whether these – or other rel-evant atmospheric anomalies – were connected, or whether the dry spring in 2009 being followed by a dry summer, was just an unfortunate, random combination. We did not find indications of any consistent statistical relationship between precipi-tation or drought conditions in the spring and the summer season. Over all, dry spring seasons were as often followed by wet summers as by dry sum-mers. However, Williams et al. (2011) found that precipitation variability in the Greater Horn of Africa during summer, has been increasingly influ-enced by circulation anomalies caused by a warm-ing of the Southern Tropical Indian Ocean. Based on similarities in spatial patterns of precipitation trends during spring and summer, they suggested that there may be a common mechanism behind suppressed precipitation in both seasons. If this is the case, and the associated circulation anomalies continue to occur, the probability of two-season droughts may increase.

16
5 Trends in seasonal precipitation
Precipitation trends in Ethiopia have been the subject of several studies, with sometimes con-trasting conclusions (Conway 2000; Funk, Asfaw et al. 2003; Seleshi and Zanke 2004; Bewket and Conway 2007; Shang, Yan et al. 2011). In the data set used in this study, trend analysis indicates that rainfall in southern Ethiopia has decreased from 1971 till the present, both annually and in the northern hemisphere spring and summer seasons. No clear trends could be detected in central and northern Ethiopia.
The 14 rainfall zones were categorized into two regions, depending on whether February–May or June–September contributes most to the annual precipitation. As shown in Figure 3, the “spring region” thus consists of the three southernmost zones (VII, XII-A and XII-B), whereas the rest of Ethiopia make up the “summer region”. The regional precipitation, shown in Figure 10, was calculated as area-weighted averages of the zones in each region. As described in Section 2.1.1, trends were calculated using linear regression and the significance tested with bootstrapping and the non-parametric Spearman’s rho test. Trend lines have been included in Figure 10 in those cases where the null hypothesis of no trend could not be rejected at the 0.05 significance level. In the remaining cases, the p values of the various tests were too high. Statistical test results are given in Table 1. In general, there was good correspond-ence between the results of the different statistical tests applied.
In the spring region, the February–May precipita-tion has declined with 2.6 mm/year during 1971–2010. Comparing the expected values in 1971 and 2010, this amounts to a reduction of 30 %. This is in line with Williams and Funk (2011), who found a general decrease in the March–June precipitation in East Africa during 1979–2009 compared to 1950–1979. In addition to the decline in the main rainy season in the spring region, Figure 10 also shows a reduction of almost equal magnitude (2.2 mm/year) in the drier June–September season, amounting to a reduction of more than 50 %. The total annual reduction in the spring region is 32 % (5.4 mm/year). Previously, a decline in precipi-tation has been documented for individual gauge
stations in southern, southwestern and southeast-ern Ethiopia during 1965–2002, but mainly dur-ing June–September from 1982 (Seleshi and Zanke 2004). Investigating extreme rainfall events in the same data, Seleshi and Camberlin (2006) reported decreasing trends in extreme rainfall intensity dur-ing both February–May and June–September at the same stations.
The results of most previous studies do not show any clear signs of changing rainfall patterns in central and northern Ethiopia (Seleshi and Zanke 2004; Seleshi and Camberlin 2006; Bewket and Conway 2007; Cheung, Senay et al. 2008). The results of this study are similar: The hypothesis of
Viste, EllenFigure 10
0
400
800
1200
0
400
800
1200
0
400
800
1200
19801990
2000
0 mm
400
800
1200
19801990
20001980
19902000
Oct–D
ec
Spring region Summer region
Jun–SepFeb–M
ayA
nnual
Ethiopia
-3.6 mm/yr
-5.4 mm/yr
-1.6 mm/yr -2.6 mm/yr
-2.2 mm/yr
-2.1 mm/yr *
-14%
-16%
-32%
-30%-20%
-53%
Figure 10 Precipitation trendsAnnual and seasonal regional precipitation 1971–2010; nationally, and for regions where the spring/summer contributes most to the annual precipitation. Linear regression trend lines and slope values are shown when statistically significant (p<0.05), and also passing Spearmann’s rho test and the bootstrap test. Exception: the national Jun–Sep trend (marked with *) passed all criteria, except Spearmann’s rho test. The percentage in the upper right corner marks the change in the expected value over the period, comparing the trend line values in the first and last year.

17
no trend in this region could not be rejected at the 0.05 significance level, neither annually, nor in any of the seasons. However, Figure 5 demonstrates a visual clustering of dry seasons during the last 10–15 years in this part of the country, as well as in the south. The frequency of spring droughts was higher in this period than in the previous decades.
The decline in precipitation in the southern part of the country is large enough to produce trends on the national level, despite the lack of trends in central and northern Ethiopia. The annual change during 1971–2010 was –3.6 mm/year, a reduc-tion of 14 % over the period. This was a result of a reduction of 1.6 mm/year in February–May and 2.1 mm/year in June–September. No trends could be seen in any of the regions in October–December.
Contrasting the lack of trends in other studies, Conway (2000) found that the rainfall over the Upper Blue Nile Basin in the Ethiopian high-lands had decreased markedly from the mid-1960s to the late 1980s. As pointed out by Bewket and
Conway (2007), the use of different time periods in the analyses is most likely the main reason for discrepancies between trend studies in the central and northern highlands. The dry 1980s were fol-lowed by recovering rainfall in 1990s. Thus, it is more likely that a negative trend will be detected in a time series ending in the late 1980s or early 1990s, than in the late 1990s. Over the more than hundred years from 1898 to 2002, Conway and Bewket (2004) found no trend in precipitation in Addis Ababa, though also noted that the lack of spatial correlation means that this record may not be used to infer anything about other parts of the Ethiopian highlands.
The main result of changing the period in our analysis from 1971–2010 to 1981–2010 (not shown), was that significant trends occurred only in February–May, and then in both the spring and summer regions, as well as nationally. The reduc-tion in the spring region was as high as 4.3 mm/year (37 %), in the summer region 2.6 mm/year (24 %), and nationally 3.2 mm/year (29 %).
6 Conclusions
Analysis of gauge-based precipitation data for 14 Ethiopian climatic zones during 1971–2011
Linear regression trend and 95 % CI [mm/year]
Bootstrap mean trend and 95 % CI [mm/year]
Linear regression p
Spearman p
National, annual -3.6 [-6.4 -0.7] -3.6 [-6.5 -0.9] 0.016 0.006National, MAM -1.6 [-3.1 -0.1] -1.6 [-3.1 -0.3] 0.037 0.044National, JJAS -2.1 [-4.0 -0.3] -2.1 [-4.1 -0.3] 0.023 0.057National, OND 0.1 [-1.8 2.0] 0.1 [-1.8 1.7] 0.921 0.877Spring region, annual -5.4 [-9.7 -1.1] -5.5 [-10.4 -1.6] 0.014 0.002Spring region, MAM -2.6 [-4.6 -0.6] -2.5 [-4.6 -0.7] 0.013 0.014Spring region, JJAS -2.2 [-3.5 -0.9] -2.2 [-3.5 0.9] 0.002 0.001Spring region, OND -0.7 [-3.6 2.1] -0.7 [-3.4 1.8] 0.606 0.545Summer region, annual -2.1 [-4.7 0.5] -2.0 [-4.9 0.6] 0.110 0.133Summer region, MAM -1.2 [-2.7 0.3] -1.2 [-2.7 0.1] 0.121 0.121Summer region, JJAS -1.3 [-3.5 0.9] -1.3 [-3.4 0.9] 0.239 0.333Summer region, OND 0.3 [-1.4 2.0] 0.3 [-1.3 1.7] 0.726 0.665
Table 1 Precipitation trend statisticsEthiopian precipitation trends 1971–2010 [mm/year] on the national level and in regions dominated by spring- and summer precipitation, annually and in March–May (MAM), June–September (JJAS), and October–December (OND). Data: Linear trend slope and 95 % confidence interval (in brackets) determined by regression (1st data column) and bootstrap (2nd column); with p values from the regression (3rd column) and Spearman’s rho test (4th column).

18
justifies the international concern about the recent dryness. Some of the last years have been among the driest in this period, and in Southern Ethiopia precipitation has declined, both in the spring (February–May) and the summer season (June–September). Dry spring seasons have char-acterized the period since 1999, affecting most of Ethiopia. The largest relative precipitation defi-cits have appeared in the south, where this is the main rainy season. The rest of the country has also experienced extremely dry springs during the last decade, but no general, long-lasting trend can be assumed based on this data set.
The spring seasons of 2008 and 2009 were extremely dry in about half of the zones, and in 2009 the dry spring was followed by a dry summer. As a result, 2009 was one of the few years with drought condi-tions in all of Ethiopia, both on seasonal and annual scales. On the national level, 2009 was the second driest year in the record, after 1984, and drier than 2002. In the Southern Highlands, 2009 was the driest year in the record, whereas in the rest of the country, previous droughts were more extreme. In the Northeastern Rift Valley, the annual amount of precipitation was as low as 29 % of the mean this year, compared to 18 % in 1984. Fluctuations of this size were not experienced in any other zones, receiving at least 50 % of the annual mean precipi-tation in the driest year. In the Central Highlands, the annual precipitation was never less than 84 % of the mean.
In the three southernmost zones, where the spring season is the most important rainy season, linear regression showed a decline in precipitation both in the spring (2.6 mm/year), the summer (2.2 mm/year) and annually (5.4 mm/year). This is in accordance with previous studies (Seleshi and Zanke 2004; Seleshi and Camberlin 2006; Funk, Dettinger et al. 2008; Williams and Funk 2011).
In the rest of the country, those zones where the summer rains are most important, the lin-ear regression analysis do not give us reason for suggesting a corresponding decrease, neither on the seasonal nor on the annual scale. This is in accordance with studies using records that ended in 2002/2003. However, signs of the decline in spring precipitation during 1979–2009 found by Williams and Funk (2011), are present, as there has been a cluster of dry spring seasons during the last 10–15 years. Not only were the spring seasons
of 2008–2011 among the driest during this period, but with the exception of 2001, almost nation-wide spring droughts also occurred every year dur-ing 1999–2004.
The spatial drought pattern from year to year var-ies, to a large extent reflecting the variation in the seasonal precipitation cycle between the zones. Ethiopian precipitation exhibits great spatial vari-ation, both in the average year, and when it comes to inter-annual variability. This affects the drought patterns. In a few years, mainly 1984 and 2009, drought conditions prevailed in all of Ethiopia, on both seasonal and annual time scales. In most historic drought years, the problem was of a more local or regional character, affecting only some parts of the country, and not necessarily in the same season. Due to this variation, there were no years without at least mild annual drought in at least one zone. Together with the severe effect of even small precipitation deficits on the mainly rain-fed agriculture (World Bank 2005), this adds to the picture of Ethiopia as especially drought-prone.
If the tendency of dry springs persists into the future, the risk of serious drought years may increase in all of Ethiopia. In the south, because the spring is the main rainy season. In Northern and Central Ethiopia, where the summer is the main rainy season, the outcome is less obvious. But unless physical mechanisms act against it, an increase in spring droughts increases the probabil-ity of the occasional dry summer having been pre-ceded by a dry spring. As a result, droughts may more frequently last throughout the agricultural growth season, as in the two driest years during 1971–2010: 1984 and 2009.
Acknowledgements
This work has been carried out with support from the University of Bergen. It has also received support from the Bjerknes Centre for Climate Research and the Ethiopian Malaria Prediction System (EMaPS) project funded by the Norwegian Programme for Development, Research and Education (NUFU). We thank the National Meteorological Agency of Ethiopia for providing the precipitation data, and Tagel Gebrehiwot for valuable information.

19
References
Addis, K. (2009). Drought and famine: Ethiopia’s cycle continues. Time.Adler, R. F., G. J. Huffman, et al. (2003). The Version-2 Global Precipitation Climatology Project (GPCP) Monthly
Precipitation Analysis (1979-Present). Journal of Hydrometeorology 4(6): 1147–1167.Berrisford, P., D. Dee, et al. (2009). The ERA-Interim archive. ERA Report Series. Reading, ECMWF. 1: 1–20.Bewket, W. and D. Conway (2007). A note on the temporal and spatial variability of rainfall in the drought-prone
Amhara region of Ethiopia. International Journal of Climatology 27(11): 1467–1477.Bhalla, N. (2000) Children die in Ethiopian drought. BBC.Broad, K. and S. Agrawala (2000). Climate: The Ethiopia Food Crisis - Uses and Limits of Climate Forecasts. Science
289(5485): 1693–1694.CERF (2006). CERF in Ethiopia 2006. Available on http://ochaonline.un.org/Default.aspx?tabid=1755.Cheung, W. H., G. B. Senay, et al. (2008). Trends and spatial distribution of annual and seasonal rainfall in Ethiopia.
International Journal of Climatology 28(13): 1723–1734.Conway, D. (2000). The Climate and Hydrology of the Upper Blue Nile River. The Geographical Journal 166(1):
49–62.Conway, D. and C. M. W. Bewket (2004). Over one century of rainfall and temperature observations in Addis
Ababa, Ethiopia. International Journal of Climatology 24(1): 77–91.Conway, D. and E. L. F. Schipper (2011). Adaptation to climate change in Africa: Challenges and opportunities
identified from Ethiopia. Global Environmental Change 21(1): 227–237.Degefu, W. (1987). Some aspects of meteorological drought in Ethiopia. In Drought and hunger in Africa. Denying
famine a future. M. H. Glantz. Cambridge, Press Syndicate of the University of Cambridge.Dinku, T., P. Ceccato, et al. (2007). Validation of satellite rainfall products over East Africa’s complex topography.
International Journal of Remote Sensing 28(7): 1503–1526.Edossa, D., M. Babel, et al. (2010). Drought Analysis in the Awash River Basin, Ethiopia. Water Resources
Management 24(7): 1441–1460.Edwards, D. C. and T. B. McKee (1997). Characteristics of 20th century drought in the United States at multiple
time scales. Fort Collins, Colorado, Colorado State University, Dept. of Atmospheric Science.Findlater, J. (1969). Interhemispheric transport of air in the lower troposphere over the western Indian Ocean.
Quarterly Journal of the Royal Meteorological Society 95(404): 400–403.Findlater, J. (1969). A major low-level air current near the Indian Ocean during the northern summer. Quarterly
Journal of the Royal Meteorological Society 95(404): 362–380.Findlater, J. (1977). Observational aspects of the low-level cross-equatorial jet stream of the western Indian Ocean.
Pure and Applied Geophysics 115(5): 1251–1262.Flohn, H. (1987). Rainfall teleconnections in northern and northeastern Africa. Theoretical and Applied Climatology
38(4): 191–197.Funk, C., A. Asfaw, et al. (2003). Estimating Meher crop production using rainfall in the ‘long cycle’ region of
Ethiopia. FEWS-NET Special Report, USGS/FEWS/USAID: 1–4.Funk, C., M. D. Dettinger, et al. (2008). Warming of the Indian Ocean threatens eastern and southern African food
security but could be mitigated by agricultural development. PNAS 105: 11081–11087.Funk, C., G. Senay, et al. (2005). Recent Drought Tendencies in Ethiopia and Equatorial-Subtropical Eastern Africa.
FEWS NET. 1: 1–13.Gebrehiwot, T., A. van der Veen, et al. (2011). Spatial and temporal assessment of drought in the Northern
highlands of Ethiopia. International Journal of Applied Earth Observation and Geoinformation 13(3): 309–321.
Griffiths, J. F., Ed. (1972). Ethiopian Highlands. In World survey of climatology. Amsterdam, Elsevier Publishing Company.
Guttman, N. B. (1999). Accepting the Standardized Precipitation Index: A calculation algorithm. JAWRA Journal of the American Water Resources Association 35(2): 311–322.
Harrison, G. A., Ed. (1988). Famine. Biosocial Society Series. New York, Oxford University Press.Huffman, G. J., R. F. Adler, et al. (2009). Improving the global precipitation record: GPCP Version 2.1. Geophysical
Research Letters 36(L17808).Husak, G. J., J. Michaelsen, et al. (2007). Use of the gamma distribution to represent monthly rainfall in Africa for
drought monitoring applications. International Journal of Climatology 27(7): 935–944.Korecha, D. and A. G. Barnston (2007). Predictability of June-September Rainfall in Ethiopia. Monthly Weather
Review 135(2): 628–650.

20
Korecha, D. and A. Sorteberg (2012). Classification of Ethiopian Rainfall into Homogeneous Regions. Submitted to International Journal of Climatology.
Leroux, M. (2001). The meteorology and climate of tropical Africa. Chichester, Springer-Praxis.Levin, N.E. and E.J. Zipser, et al. (2009). Isotopic composition of waters from Ethiopia and Kenya: Insights
into moisture sources for eastern Africa. Journal of Geophysical Research 114 (D23306). doi: 10.1029/2009jd012166.
Lloyd-Hughes, B. and M. A. Saunders (2002). A drought climatology for Europe. International Journal of Climatology 22(13): 1571–1592.
Mattsson, J. O. and A. Rapp (1991). The Recent Droughts in Western Ethiopia and Sudan in a Climatic Context. Ambio 20(5): 172–175.
McCann, J. C. (1990). A Great Agrarian Cycle? Productivity in Highland Ethiopia, 1900 to 1987. The Journal of Interdisciplinary History 20(3): 389–416.
McKee, T. B., N. J. Doesken, et al. (1993). The relationship of drought frequency and duration to time scales. Eighth Conference on Applied Climatology. Anaheim, California: 179–184.
Meze-Hausken, E. (2004). Contrasting climate variability and meteorological drought with perceived drought and climate change in northern Ethiopia. Climate Research 27: 13–31.
Mishra, A. K. and V. P. Singh (2010). A review of drought concepts. Journal of Hydrology 391(1–2): 202–216.Mohamed, Y. A., B. J. J. M. v. d. Hurk, et al. (2005). Hydroclimatology of the Nile: results from a regional climate
model. Hydrology and Earth System Sciences 9: 263–278.Nebehay, S. (2011) Worst drought in 60 years hitting Horn of Africa: U.N. Reuters.Nicholson, S. E. (1986). The Spatial Coherence of African Rainfall Anomalies: Interhemispheric Teleconnections.
Journal of Climate and Applied Meteorology 25(10): 1365–1381.Ntale, H. K. and T. Y. Gan (2003). Drought indices and their application to East Africa. International Journal of
Climatology 23(11): 1335–1357.Palmer, W. C. (1965). Meteorological drought. Washington, D.C.Riddle, E. E. and K. H. Cook (2008). Abrupt rainfall transitions over the Greater Horn of Africa: Observations and
regional model simulations. Journal of Geophysical Research 113(D15109): 14.Segele, Z. T. and P. J. Lamb (2005). Characterization and variability of Kiremt rainy season over Ethiopia.
Meteorology and Atmospheric Physics 89(1): 153–180.Segele, Z. T., P. J. Lamb, et al. (2009). Large-scale atmospheric circulation and global sea surface temperature
associations with Horn of Africa June-September rainfall. International Journal of Climatology 29(8): 1075–1100.
Seleshi, Y. and P. Camberlin (2006). Recent changes in dry spell and extreme rainfall events in Ethiopia. Theoretical and Applied Climatology 83: 181–191.
Seleshi, Y. and U. Zanke (2004). Recent changes in rainfall and rainy days in Ethiopia. International Journal of Climatology 24(8): 973–983.
Sen, A. (1981). Poverty and famines: An essay on entitlement and deprivation. Oxford University Press, Oxford.Shang, H., J. Yan, et al. (2011). Trend analysis of extreme precipitation in the Northwestern Highlands of Ethiopia
with a case study of Debre Markos. Hydrology and Earth System Sciences 15(6): 1937–1944.Shanko, D. and P. Camberlin (1998). The effects of the Southwest Indian Ocean tropical cyclones on Ethiopian
drought. International Journal of Climatology 18(12): 1373–1388.Simmons, A. J., S. M. Uppala, et al. (2006). ERA-Interim: New ECMWF reanalysis products from 1989 onwards.
ECMWF Newsletter (110): 25–35.Torry, W. (1986). Economic development, drought, and famines: some limitations of dependency explanations.
GeoJournal 12(1): 5–18.Trenberth, K. E., D. P. Stepaniak, et al. (2002). Accuracy of Atmospheric Energy Budgets from Analyses. Journal of
Climate 15(23): 3343–3360.Uppala, S. M., D. Dee, et al. (2008). Towards a climate data assimilation system: status update of ERA-Interim.
ECMWF Newsletter. Reading, ECMWF: 12–18.USAID/FEWS (2011). East Africa: Past year one of the driest on record in the eastern Horn. USAID/FEWS.Viste, E. and A. Sorteberg (2011). Moisture transport into the Ethiopian highlands. International Journal of
Climatology. Published online, DOI 10.1002/joc.3409. Viste, E. and A. Sorteberg (2012). The effect of moisture transport variability on Ethiopian summer precipitation.
International Journal of Climatology. Published online, DOI 10.1002/joc.3566.Webb, P. and J. v. Braun (1994). Famine and food security in Ethiopia. John Wiley & Sons, on behalf of the
International Food Policy Research Institute.

21
Webb, P., J. v. Braun, et al. (1992). Famine in Ethiopia: Policy implications of coping failure at national and household levels. Research Reports. G. Desai. Washington, D.C., International Food Policy Research Institute. 92 pp.
Williams, A. and C. Funk (2011). A westward extension of the warm pool leads to a westward extension of the Walker circulation, drying eastern Africa. Climate Dynamics 37(11–12): 2417–2435.
Williams A., C. Funk C, et al. (2011). Recent summer precipitation trends in the Greater Horn of Africa and the emerging role of Indian Ocean sea surface temperature. Climate Dynamics, doi: 10.1007/s00382-011-1222-y.
World Bank (2005). Well-Being and Poverty in Ethiopia. The Role of Agriculture and Agency. Poverty Reduction and Economic Management 2 (AFTP2), World Bank: 306 pp.
Wu, H., M. J. Hayes, et al. (2005). The effect of the length of record on the standardized precipitation index calculation. International Journal of Climatology 25(4): 505–520.
Wu, H., M. D. Svoboda, et al. (2007). Appropriate application of the standardized precipitation index in arid locations and dry seasons. International Journal of Climatology 27(1): 65–79.
Yue, S., P. Pilon, et al. (2002). Power of the Mann–Kendall and Spearman’s rho tests for detecting monotonic trends in hydrological series. Journal of Hydrology 259(1–4): 254–271.