recent declines in labor's share in us income: a ... · recent declines in labor's share...
TRANSCRIPT

NBER WORKING PAPER SERIES
RECENT DECLINES IN LABOR'S SHARE IN US INCOME:A PRELIMINARY NEOCLASSICAL ACCOUNT
Robert Z. Lawrence
Working Paper 21296http://www.nber.org/papers/w21296
NATIONAL BUREAU OF ECONOMIC RESEARCH1050 Massachusetts Avenue
Cambridge, MA 02138June 2015
This paper received funding from the Peterson Institute for International Economics and the MasterCardCenter for Inclusive Growth The views expressed herein are those of the author and do not necessarilyreflect the views of the National Bureau of Economic Research.
NBER working papers are circulated for discussion and comment purposes. They have not been peer-reviewed or been subject to the review by the NBER Board of Directors that accompanies officialNBER publications.
© 2015 by Robert Z. Lawrence. All rights reserved. Short sections of text, not to exceed two paragraphs,may be quoted without explicit permission provided that full credit, including © notice, is given tothe source.

Recent Declines in Labor's Share in US Income: A Preliminary Neoclassical AccountRobert Z. LawrenceNBER Working Paper No. 21296June 2015JEL No. D3,D33
ABSTRACT
As shown in the 1930s by Hicks and Robinson the elasticity of substitution (�σ) is a key parameterthat captures whether capital and labor are gross complements or substitutes. Establishing themagnitude of �σ is vital, not only for explaining changes in the distribution of income between factorsbut also for undertaking policy measures to influence it. Several papers have explained the recentdecline in labor’s share in income by claiming that σ� is greater than one and that there has been capitaldeepening. This paper presents evidence that refutes these claims. It shows that despite a rise inmeasured capital-labor ratios, labor-augmenting technical change in the US has been sufficientlyrapid that effective capital-labor ratios have actually fallen in the sectors and industries that accountfor the largest portion of the declining labor share in income since 1980. In combination withestimates that corroborate the consensus in the literature that �σ is less than 1, these declines in theeffective capital ratio can account for much of the recent fall in labor’s share in US income at boththe aggregate and industry level. Paradoxically, these results also suggest that increased capitalformation would raise labor’s share in income.
Robert Z. LawrenceJFK School of Government79 JFK StreetCambridge, MA 02138and [email protected]

5
5
Recent Declines in Labor’s Share in US Income: A Neoclassical
Account
Introduction
Over the past decade, in addition to its poor employment performance, the US
economy has been plagued by sluggish wage growth and rising income inequality.
Whereas the debate over inequality in the 1980s and 1990s was focused on the growing
disparity between the earnings of skilled and unskilled workers and the earnings of the
super-rich (Lawrence 2008) growing income inequality between capital and labor
income has now been added to these concerns. Remarkably, the growth in real GDP per
worker over the decade of the 2000s which averaged 1.7 percent annually was actually
more rapid than in the 1970s, 1980s or 1990s, yet in the 2000s workers saw almost no
increase in their take home pay. Consistent with this gap between labor productivity and
wage growth was a pronounced decline in the share of US national income earned by
workers.
This is an unusual development. For much of the past century, the long run
shares of national income earned by capital and labor in the US have been fairly stable.1
As Figure 1 shows, since the late 1960s, the share of labor compensation (a measure
that includes wages and benefits) in national income cycled between 64 and 67 percent.
1 See for example Cobb & Douglas (1928), Keynes (1939), Kaldor (1961), Dew-Becker and Gordon (2005), Mankiw (2007), Lawrence (2008). Actually the “stability” of shares is quite sensitive to how they are measured. It makes a difference whether labor compensation is measured relative to net or gross capital income and relative to the entire economy or just the corporate sector. For an early skeptical view of what exactly we mean by a constant share see Solow (1958). For a recent discussion see Kraemer (2010). For a skeptical view that labor’s share has recently fallen to all-time lows emphasizing the difference between net and gross income see Bridgman (2014).

6
6
However, since 2008 that share has fallen considerably below this cyclical variation.2
The counterpart to the declining labor share has been a rise in the share of capital that
has been especially concentrated in corporate profits, and since claims on profits are far
less equally distributed than wages, this has contributed to increased income inequality.
[FIGURE 1]
There are several plausible reasons for this development (globalization,
automation, weak-bargaining power of labor, political capture, increasing mark-ups) but
the natural starting point for explaining factor income shares is the neoclassical theory
of the functional distribution of income enumerated by John Hicks and Joan Robinson
in the 1930s.3 This theory highlights the role played in allocating income between
capital (K) and labor (L) by the ease with which they can be substituted. When there are
constant returns to scale and competitive conditions and a production function where
output Y = F(K,L) the magnitude of these responses can be summarized with a single
parameter – the elasticity of substitution – commonly depicted by σ – and defined
(negatively) as - d log (K/L) / d log (FK/ FL). If factors are paid their marginal products,
R the rental rate = FK and W the wage rate = FL. This implies that ratio of factor income
shares is
=
*
. The components of this ratio will generally change in opposite
directions. Thus for labor’s share to fall, RK must rise by more than WL. When σ = 1,
the components will change proportionally and the factor income ratio (RK/WL) will
2 With the exception of the UK, the European experience has been different. There was a rise in the labor share in the 1970s, but thereafter the labor share declined in many European countries and Ireland (Bertoli and Farina 2007, 12). See also: (O. Blanchard 1997, O. Blanchard 2006). 3 See Hicks (1963) and Robinson (1932). For a comprehensive review of the evidence and theories of labor’s share see Schneider (2011).

7
7
remain constant.4 When σ is > 1 the factors are gross substitutes. A given percentage
rise in K/L will give rise to a smaller percentage fall in R/W and labor’s share will fall;
conversely if σ is < 1 the factors are gross complements. A given percentage rise in K/L
will be more than offset by a fall in R/W and labor’s share will rise.5 As shown by
Ellsby et. al (2013) the relationship between changes in labor share in income (Ls) and
the capital-labor ratio will be captured by the equation:
d ln Ls = - (1 - Ls)
d ln K/L (1)
In this framework, σ can also be used to relate changes in factor shares to
changes in the capital-output ratio (K/Y).6 Where Ks is the share of capital for
example, the relationship between Ks and changes in K/Y is:
d log Ks = (1 - ) d (log (K/Y) (2)
In this specification, an increase in the capital-output ratio will be associated
with a rising share of capital in income if σ is > 1; a declining share of capital if σ < 1;
and no change in Ks when σ = 1.
Determining σ and changes in the quantities of capital and labor used as inputs,
however, is not sufficient to explain changes in income distribution when there is
technological change. Hicks characterized technical change according to its relative
impact on the marginal products of the two factors. He called such change “capital
4 Note when speaking of σ here it is defined here so that it is positive. 5 Considering extreme cases when K/L increases reveals the intuition behind this result. If σ = ∞, and capital and labor are perfect substitutes, their relative prices do not change and if the supply of capital increases, and w/r remains fixed, capital’s share must rise. Conversely, if it is impossible to substitute capital for labor, and σ = 0, starting from a position in which the capital labor ratio was equal to the required proportion in which these factors had to be used and thus w and r were both positive, any increase in capital would be redundant and thus capital’s marginal product would decline to zero. The result would be that all income would accrue to labor. 6 The elasticity of Fk with respect to the capital-output ratio K/Y is given by
. This implies that the ratio
of capital’s share in income Ks = Fk K/Y. Thus d log Ks = (1 - ) d (log (K/Y). See Rognlie (2014) and
Bentolia & Saint-Paul (2003) for derivations.

8
8
saving” if it raised the marginal product of labor by more than it raised the marginal
product of capital. Following Uzawa(1961), however, I will use the more common
appellation “labor-augmenting.” For a given wage-rental rate such a change would lead
firms to use more labor and less capital ratio to produce a given quantity of output. On
the other hand, “labor-saving” technical change (or what is normally called capital-
augmenting) raises the marginal product of capital by more than the marginal product of
labor and leads to the use of higher-capital-labor ratios at any given wage-rental ratio.
These changes can be captured in a production function by the degree to which each
factor is augmented.7 Assume λl and λk are measures of labor and capital augmenting
change respectively, if dλl is > dλk, there is net labor augmenting technical change (or
capital-saving change) and if dλl is < dλk, there is net capital augmenting change (or
labor-saving change)).
Once technical change is taken into account, what matters for income
distribution is the change in the effective capital-labor ratio k = (λkK/λlL). If dλl and dλk
are equal, there is so-called “Hicks neutral” technological change and both factors are
augmented to an equal degree. With non-neutral change, however, complete
explanation of changes in factor income shares requires not only determining σ and
changes in the physical measures of K and L but also how λl and λk have evolved over
time. With technical change equation (1) becomes
d ln Ls = - (1 – Ls)
d ln(λk K/ λl L) (3)
7 If technical change raises the marginal product of capital by more than the marginal product of labor Hicks (op. cit chapter VI, page 121-122) defines it as “labor saving” but I refer to it here as “capital augmenting”. Similarly, technical changes that raise the marginal product of labor by more than the marginal product of capital are called “capital saving” by Hicks, but I refer to such changes as “labor augmenting”.
9
9
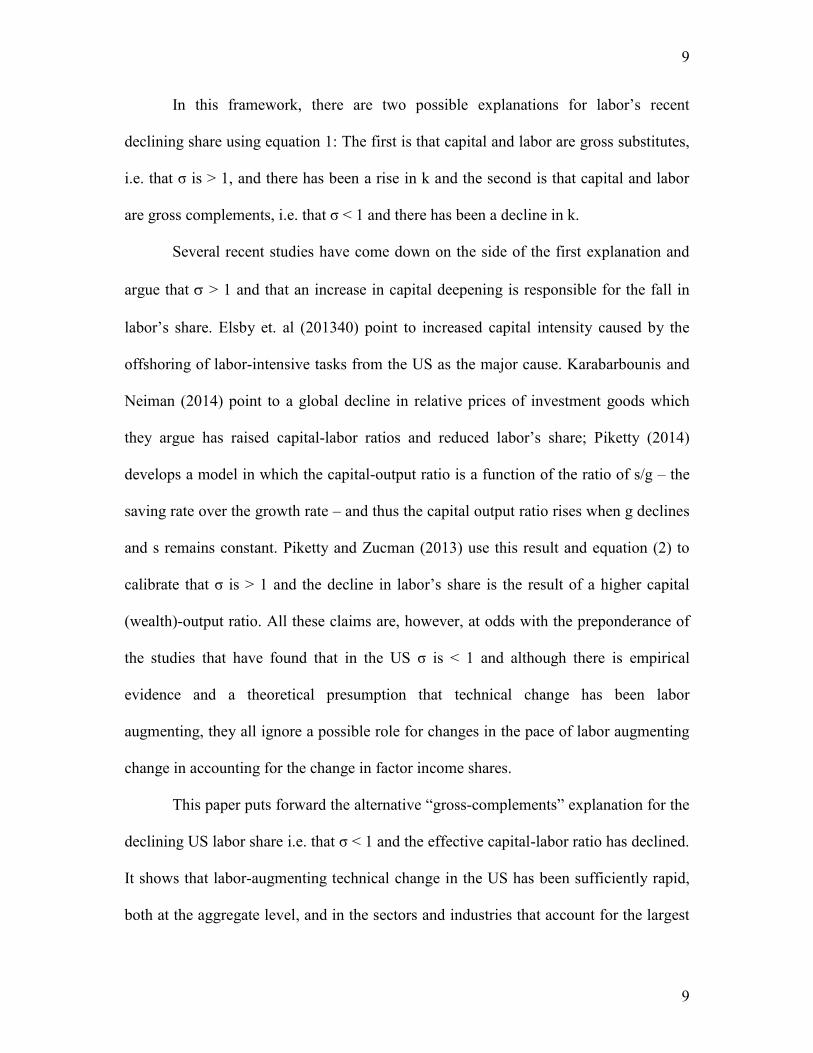
In this framework, there are two possible explanations for labor’s recent
declining share using equation 1: The first is that capital and labor are gross substitutes,
i.e. that σ is > 1, and there has been a rise in k and the second is that capital and labor
are gross complements, i.e. that σ < 1 and there has been a decline in k.
Several recent studies have come down on the side of the first explanation and
argue that > 1 and that an increase in capital deepening is responsible for the fall in
labor’s share. Elsby et. al (201340) point to increased capital intensity caused by the
offshoring of labor-intensive tasks from the US as the major cause. Karabarbounis and
Neiman (2014) point to a global decline in relative prices of investment goods which
they argue has raised capital-labor ratios and reduced labor’s share; Piketty (2014)
develops a model in which the capital-output ratio is a function of the ratio of s/g – the
saving rate over the growth rate – and thus the capital output ratio rises when g declines
and s remains constant. Piketty and Zucman (2013) use this result and equation (2) to
calibrate that σ is > 1 and the decline in labor’s share is the result of a higher capital
(wealth)-output ratio. All these claims are, however, at odds with the preponderance of
the studies that have found that in the US σ is < 1 and although there is empirical
evidence and a theoretical presumption that technical change has been labor
augmenting, they all ignore a possible role for changes in the pace of labor augmenting
change in accounting for the change in factor income shares.
This paper puts forward the alternative “gross-complements” explanation for the
declining US labor share i.e. that σ < 1 and the effective capital-labor ratio has declined.
It shows that labor-augmenting technical change in the US has been sufficiently rapid,
both at the aggregate level, and in the sectors and industries that account for the largest

10
10
portion of the declining labor share, that despite a rise in the measured capital-labor
ratios, the effective capital-labor ratios have fallen. In combination with estimates that σ
< 1, these changes in k can account for the declines in labor’s share in GDP since 1980.
This is the case for declines in labor share at the aggregate level, for declines within key
sectors such as manufacturing, mining, and information technology, and for declines
within the manufacturing industries that have had the largest impact on the declining
labor share overall.
The results are compatible with the extensive empirical evidence surveyed by
Chirinko (2008) that σ < 1 and with the critiques of Piketty advanced by Rognlie
(2014), Summers (2014), and Acemoglu and Robinson (2014). The results are also
consistent with the evidence that on balance US technical change has been labor
augmenting(Antras 2004, Wei 2014, Young 2010). In addition, they accord with the
fundamental insights of growth theory that when σ < 1, labor augmenting technical
change is required to maintain a balanced growth path (i.e. a path where capital and
output grow at the same rate) in the face of rising capital-labor ratios (Uzawa 1961,
Jones and Scrimgeour 2004). They are also supported by work of Acemoglu (2003,
2002) who explains how endogenous technical change is likely to revert to pure labor
augmenting change.
This paper uses industry and aggregate data to estimate a CES production
function assuming that technical change has an exponential functional form, but its
conclusions are in line with those of Oberfield and Ravel (2014) who use manufacturing
plant data and a different identification strategy based on variations in factor prices
across local areas. Despite their different methodology, they also find that σ in US

11
11
manufacturing is less than one and that most of the recent decline in the share of labor
in US manufacturing can be accounted for by “changes in the pace of the bias of
technical change”.8
Outline
Section I, discusses measurement and data issues and explores the timing,
magnitude and sector sources of various measures of recent declines in the US labor
share. Shift-share analysis is used to measure the degree to which the overall decline
can be attributed to share changes within industries and changes in industrial
composition. The sectors that have made the most important contributions to the
aggregate change over various periods are identified. Since 2000, these include the
manufacturing, mining and information technology sectors and industries within
manufacturing such as petroleum refining and coal products, chemicals and computers
and electronics. Section II critiques the studies that claim capital and labor are gross
substitutes, point to capital deepening to accounting for the decline in labor’s share and
fail to evaluate the pace of labor-augmenting technical change. These accounts are
contrasted with evidence that < 1, on balance technical change has been labor
augmenting, and recent growth in investment, especially in US manufacturing has been
unusually weak with the result that the capital-output ratio has fallen. Section III
applies the approach developed by Antras (2004) to simultaneously estimate σ and the
magnitude of factor-augmenting technical change. These estimates are used to derive
8 Oberfield and Raval (2014) op. cit. are agnostic as to the precise source of this bias – they mention automation, offshoring and the decline of unions as possibilities; however, this paper places technical change at the heart of the explanation.

12
12
measures of changes in the effective capital-labor ratio (k) which are combined with the
estimates of σ to demonstrate that, especially in manufacturing, recent changes in
labor’s share in the aggregate as well as in key sectors and industries can be explained
with a reasonable degree of accuracy. Section IV discusses the implications of the
findings for policy measures that affect capital formation, in particular the importance
of stimulating capital formation to increase labor’s share, points to alternative
methodological approaches and provides suggestions for further research.
Section I: Measures and the Sectoral Sources of the Decline in Labor’s
Income Share
The most useful measure of factor shares for discussions of overall US income
inequality is the share of labor compensation in National Factor Income. (NFI). This
measure includes (a) the compensation of employees; (b) the net income earned by
capital in various forms (i.e. proprietor’s income, rental income, corporate profits and
net interest) after depreciation and inventory valuation adjustments have been taken into
account and (c) net international factor payments. The more comprehensive measure of
national income (NI) includes taxes on domestic production and imports, but since taxes
could be used for a variety of purposes that could benefit either capital or labor it is
appropriate to subtract them from national income when exploring the shares that are
relevant for inequality. In practice, though, since these taxes have been a fairly constant
share (around 8 percent) of national income between 1980 and 2014, their inclusion in
the aggregate measure of national income is not of great consequence when tracking
recent changes in factor shares.

13
13
Net domestic income in turn subtracts the receipts by US nationals from
foreigners and adds the payments made by US nationals to foreigners and thus measures
the incomes of factors that are located in the United States. It is more appropriate as a
dependent variable when causation is being ascribed to developments that occur in the
US. For empirical analysis of factor shares, however, equivalent measures on the
production side are generally used and domestic product is thus explained by inputs in
the domestic economy. In this case, Gross Domestic Product (GDP), the most
commonly used aggregate output measure of value added produced within the United
States includes labor compensation, gross operating surplus, and taxes on production
and imports. As with net domestic factor incomes, taxes on production and imports and
depreciation should both be subtracted for tracking the relative income shares in the
domestic economy that are relevant for inequality (Bridgman 2014).
As is apparent from Figure 2, which reports labor’s share in various income
measures since 1929, there is a strong cyclical component to the movement in labor’s
share. The wage-share typically rises with the tightening of the labor market at the end
of expansions, remains high at the start of recessions, but then falls during the initial
phases of recovery. Because of this volatility, it is not easy to distinguish the trend from
cycles. Indeed, it is possible to examine the data and to discern a declining trend in
labor share in US GDP after 1969, after 1980, or after 1990 – consider the peaks in
Figure 2, – or actually to see no trend at all after 1969 until after 2008 – with the share
cycling around 65 percent of income. Writing in 2005 for example, Dew-Becker and
Gordon (200571) noted “labor’s share was actually higher in 2005:Q1 than eight years
earlier. Over a longer period going back to 1954, labor’s income share has been

14
14
virtually constant.” And others, writing even later, such as Lawrence (2008), still
emphasized the long run constancy of US income shares9 dating back to the 1980s.
[FIGURE 2]
As shown in Figure 2, various measures of labor’s share give somewhat
different pictures, but all indicate that labor’s share rose between the 1930s and 1970
and that since 2008 labor’s share has been unusually low. The measure most consistent
with the proposition that the share has been constant over the long run is the share of
compensation in GDP (red lower line). As shown in Figure 3, depreciation has
constituted a growing share of GDP over the long run, and since NDP and national
income take depreciation into account, the share of labor compensation in these
measures actually had a stronger upward trend through the late 1960s than the share in
GDP. After 2008, however, because of slow capital formation, depreciation has actually
grown more slowly than GDP. In addition, net foreign factor payments have increased
so that labor’s share in national income is somewhat lower than in net domestic product.
In 2008, the 55 percent share in national income was similar to what it was in the 1950s
and even the 1940s. However, from the standpoint of concerns about income equality,
labor’s share in net factor incomes (the highest purple line) is the most relevant measure
and it shows labor’s share in 2014 at levels last seen in the late 1940s.
9 As noted in several studies (Harrison 2005, O. Blanchard 1997), since the 1970s, the international, and especially the European experience has been much more varied, with some countries, like the US and UK having maintained fairly constant shares until recently, while others in continental Europe have experienced periods of both rising and falling shares.

15
15
[FIGURE 3]
Impact. Since 2000, labor’s share has fallen by 5.1 percentage points of net
national factor income. Had labor compensation per hour simply kept pace with the rise
in net national factor income per hour since 2000, for example, in 2014 worker
compensation would have been 7.2 percent higher than it actually was. Moreover, over
the past decade, take-home pay has grown more slowly than labor compensation
because of the additional costs of providing benefits such as more expensive
healthcare.10 Had take-home wages and salaries kept pace with the growth in net factor
income between 2000 and 2014, in 2014 wages would have been 9 percent higher.
These aggregate labor compensation and wage measures include the earnings of “super-
rich” Americans at the very top of the wage distribution. Since the most well paid wage
earners have increased their share of labor compensation this has implied even greater
pressures on the earnings of workers in the middle and lower ends of the wage
distribution.
Business Sector
The conclusion that the behavior of labor’s share in the 00’s has been different
also emerges from business sector data. As shown in Figure 4, the rise in real product
compensation matched the rise in gross output per worker between 1969 and 2000 and
it matched the rise in net output per worker after 1969 until as late as 2008. There was a
10 According to Burtless (2007), the real average compensation of a full-time worker increased by 5.6 per cent between 2000 and 2005, but of this increase 10 per cent went on increased social insurance contributions, 24 per cent on increased employer pension contributions, and 35 per cent on health insurance, leaving less than a third for increased cash wages (Burtless 2007, Figure 3).

16
16
larger and growing gap between the rise in both gross and net output per worker and the
real compensation (i.e. wages deflated by the consumer price index). This gap is
sometimes pointed to as indicating that labor is not getting what it deserves, but this gap
primarily reflected differences between the mix of goods and services that workers
consume and the mix that they produce (Lawrence 2008). Generally, the prices of the
goods and services workers produce have risen more slowly than the prices of those that
they consume. On the one hand, there has been relatively rapid growth in productivity
in equipment which workers do not buy, while on the other hand, the consumer price
index includes housing services that are not something workers (outside of the
construction sector) produce.11 Had workers chosen to consume the same mix of goods
and services they produced, their real (product) wages would have kept pace with
(gross) labor productivity growth between 1965 and 2000 and net labor productivity
growth between 1965 and 2008.
However, as Figure 4 indicates, since 2000, the growth in real product
compensation has fallen behind the growth in real output per worker and this shortfall
does mean that a declining share of gross business sector income has accrued to labor.
Moreover, since 2008, the rise in real product compensation has also fallen behind the
rise in net value-added per worker, implying a growing share in business income for
claimants on capital. Nonetheless, it should be noted that around 2000 the share of labor
compensation was unusually high, in part because of the activity associated with the
dot-com boom. In addition, excluding this period gives rise to somewhat smaller
shortfalls between the growth of net value-added per worker and the real product wage.
11 For a more complete discussion of the role played by housing see Rognlie (2015).

17
17
[FIGURE 4]
Tracking the shares of labor and capital in national income misses an additional
source of growing inequality. Income earned by owners of capital takes several forms
(corporate profits, net interest income, proprietors and rental income) and recently
corporate profits have constituted a growing share of capital income. The 5.1 percentage
point increase in the share of corporate profits in national income after 2000 is actually
greater than the decline in labor’s share in income primarily because of a fall in the
share of another component of capital income – net interest. Given that corporate profits
accounted for 8.8 percent of national income in 2000, the rise of 5.1 percentage points
in the share of corporate profits between 2000 and 2014 represented an increase of 58
percent in the corporate profit share in national income between 2000 and 2014 and a
47 percent increase over the average 9.4 percent of net corporate value added accounted
for by corporate profits between 1980 and 2000. Most of this increase reflects an
increase in the share of corporate profits in domestic income, but national income also
includes the foreign earnings of US multinationals, and about a quarter of all corporate
profits were earned abroad in both 2000 and 2014.12
[FIGURE 5]
In sum, labor’s share in income has fallen by a variety of measures especially
since 2000. The most inclusive measures, those for national income point to declines on
12 In 2014, for example, foreign profits accounted for 25 percent of all US corporate profits, about the same as in 2000. By contrast, net foreign profits constituted 14 percent of profits between 1990 and 1999. Moreover, foreign profits contributed 38 percent of corporate profits in the recession year of 2008.

18
18
the order of 7 percent, with the declines in the gross measures larger than those that take
depreciation into account. 13However, these national measures reflect compensation in
the government sector as well as measures that impute labor compensation to
proprietors. In the corporate sector, the declines in share have been even larger – on the
order of 11 percent since 2000. At the same time, the share of corporate profits in
national income has increased by 57 percent.
Data selection
When determining the causes of the declining labor share in income it is helpful
to identify the industries that have made the greatest contribution. However, examining
changes in income shares in the industries that make up GDP presents challenges
because of revisions in the methods used to classify industries and to estimate income.
Several industrial classifications have been used (e.g. SIC in early periods and NAICS
for recent periods) and, in addition, the Bureau of Economic Analysis (BEA) has
recently revised its methodology for estimating value-added by industry by changing its
treatment of inputs such as R&D. Previously, spending on R&D, entertainment, literary
and artistic originals were all treated as inputs, which were subtracted from value-
added. In recent revisions, however, these items are now included as part of value-
added and investment in fixed assets. These changes have the effect of raising the
estimates for value-added in R&D-intensive industries – most of which are to be found
13

19
19
in manufacturing. Since the changes are more important for estimates of gross operating
surplus than for labor compensation, the new measures also reduce the share of value-
added represented by aggregate labor compensation. This means that combining the
unrevised data prior to 1997 and the revised data thereafter has the effect of showing a
stronger declining trend in the share of labor in general and in the manufacturing sector
and R&D-intensive industries in particular.
Unfortunately, the revised data are only available after 1997, whereas data using
the previous methodology, which assumes R&D and several other components of firm
spending are input costs, are available for the years 1987 through 2011. While I will use
the most recent revised data for studying recent changes in order to identify the
industries that have played the largest role in the recent declines in labor share, for
longer run analysis, I therefore use different sources.
The data developed by Jorgenson, Ho and Samuels (2012) are especially useful
because they have developed consistent time series of gross factor incomes using the
North American Industrial Classification System, (NAICS). I will therefore rely on their
measures for analyzing the long run period 1947 to 2010 for the economy as a whole as
well as for the long run behavior of labor shares in major sectors such as manufacturing,
mining, and telecommunications, posts and telegraphs. In addition, to undertake the
analysis at a more disaggregated level than is available in their data, I will use the
(unrevised) data that are available on an NAICS basis from 1987 and 2011 from the
BEA and the BLS. I will also use the data developed by the National Bureau of
Economic Research in its manufacturing data-base in an exercise at the 6-digit NAICS
industry level.

20
20
Industry contributions
The long-run stability of the aggregate labor share in US GDP is actually quite
surprising given the volatility of labor shares in income within several industries and the
changing of contributions of industries to overall value-added in the economy.14
Therefore, in explaining the behavior of the overall labor share in value-added, it is
helpful to distinguish between the impact of changes in sector shares in output and
changes in labor shares that occurred within particular sectors. This can be done by
decomposing the overall change in labor share (Sl) in gross value-added into changes in
sectors output shares (“between industry changes”) denoted by Wi and changes within-
industry labor shares denoted by Sli using the following formula:
+ Wi Sli
Change in Labor Share = Between Industry Weight Changes + Within Industry
Labor Share Changes
[TABLE 1]
As reported in Table 1, while the overall share of labor compensation in GDP
fell by about 4 percentage points between 2000 and 2012, the decline was the result of a
large number of sectors making negative contributions and just a small number,
especially Educational Services and Health Care and Government, making positive
contributions. Nonetheless, over this period, the negative impacts were highly
concentrated in a few sectors. Specifically, the “between” and “within” sector
14 For a theoretical exploration of the relationship between aggregate and sector shares see: (Acemoglu and Guerrieri 2008).

21
21
decomposition shows that they account for just 22 percent of GDP experienced declines
whose impact was equal to 82 percent of the overall decline. (3.28 of the 3.92
percentage point decline) or, since several sectors made positive contributions, 66
percent of all the absolute changes. While manufacturing contributed only 15 percent of
overall value-added in GDP in 2000, the output weighted declining labor share in
manufacturing was equal to 44.4 percent (1.74 percentage points) of the overall
economy-wide drop in labor’s share in income; the weighted impact of information
services (which had an unusually high share in 2000 because of the dot-com boom with
lots of start-ups who were not earning profits) and contributed 4.6 percent of GDP was
equal to 21.2 percent of the overall decline and the impact of mining (just 1.1 percent of
GDP) was 17.59 percent. It is also noteworthy that almost all of these changes – 3.97 of
the 4.0 percentage points – were reflective of changes within these sectors as opposed to
changes in the industry shares in value-added (i.e. the between sector changes).
While these sectors have strongly influenced the aggregate since 2000, in
understanding their behavior it is useful to inquire when the declines in labor share
within these sectors actually began. For this purpose, the long run data of Jorgenson et
al. (2012) are useful. As shown in Figure 3, the changes in manufacturing that were
evident after 2000 were actually a continuation of a trend that began in the mid1980s.
Prior to that, labor’s share in manufacturing remained fairly constant for a long period:
The share of labor in income in manufacturing in 1988 was about the same as it was in
1954. Long run factor income shares in mining, by contrast, have been quite volatile
over the long run. They remained in the vicinity of forty percent until 2000, but then
experienced a large decline. The information technology sector, captured in the

22
22
Jorgenson et al. data as Posts and Telecommunications, experienced a large decline
between 1947 and 1960, remained around 60 percent through 1980, and then had a
declining trend that was interrupted by the rise associated with the dot.com boom
around 2000.
This suggests that the behavior of manufacturing and information technology as
far back as the 1980s warrant attention, whereas the behavior of mining should focus
mainly on the period after 2000. To explore the impact of these medium term changes,
however, it is necessary to use the unrevised official NAICS data, which are only
available after 1987. As reported in Table 2, in these data the aggregate decline in
labor’s share between 1987 and 2011 is relatively small – 2.7 percentage points.
However, this stability is the result of offsetting changes in individual sectors. In
particular, there are very large declines in the labor-income shares in manufacturing
from 68 to 52 percent and in mining from 40 to 28 percent. There are substantial but
smaller declines in retail and wholesale trade, transportation and information, but also
increases in labor’s share in industries, such as agriculture, utilities, professional and
business services and education and healthcare.
[FIGURE 6]
The shift-share analysis reported in Table 2 again breaks down the overall
change between changes due to alterations in the relative sizes of the sectors (between
sector changes) and those due to changes within sectors. It suggests again that
overwhelmingly the changes reflect shifts within rather than between sectors. In 1987,
the labor share in income in manufacturing was fairly high and while its shrinkage from

23
23
17.4 to 11.5 percent of GDP contributed 0.6 percentage points to the fall in the
aggregate share, the contribution of the share changes within manufacturing were far
more important – they were equal to 1.8 percentage points. Further, the 2.4 percentage
point impact stemming from manufacturing was equal to 87.9 percent of the overall fall
of 2.7 points.
[TABLE 2]
Manufacturing
The decline in the labor share in manufacturing is especially interesting due to
three reasons. First, it began earlier than the aggregate labor-share. Second, it made the
largest contribution to the aggregate decline after 1987. Third, it is a sector that is
heavily involved in international trade. In 1987, judged by the share of labor earnings in
value-added, manufacturing was a relatively labor intensive sector. It accounted for
over a quarter of all of the labor compensation in private industry but just 16 percent of
both the gross and net operating surplus earned in private industry. By 2011,
manufacturing’s share of labor compensation in private industry had declined to about
14 percent, about the same as its share in gross operating surplus. In 1987, judged by
income shares, the typical manufacturing business was thus more than fifty percent
more labor intensive than the rest of private industry. However, by 2011, labor intensity
in manufacturing was about the same as the rest of economy.
As a sector experiencing increasing pressures from international competition, as
well as a large decline in employment, one might have expected that there would be

24
24
relatively weak wage growth in manufacturing. However, the drop in labor’s share in
manufacturing income did not result from a large decline in the relative compensation
of manufacturing workers. In fact, the rise in average compensation in manufacturing
roughly kept pace with compensation growth in the rest of the economy. Between 2000
and 2012 for example, the increases in average compensation per full time employee in
manufacturing and in private industry averaged 64 and 61 percent respectively.15
One possibility is that this wage performance reflected a shift in the employment
mix towards more skilled and thus higher paid workers. Indeed this mix change does
explain why manufacturing compensation actually increased somewhat more rapidly
than in the rest of private sector. However, the employment cost (ECI) index tracks the
cost of employing workers with a given set of attributes (e.g. skill, education,
experience etc.) and thus gives a better measure of manufacturing wage growth for
workers with given skill levels. This measure shows that between 1987 and 2014, the
ECI for manufacturing increased only 2 percent less than the ECI for all civilian
workers (and between 2000 and 2012 manufacturing wages grew 1.5 percent more
slowly). Thus weak relative wage growth is not much of the explanation for labor’s
declining share in manufacturing as compared to the rest of the economy. In addition, as
shown in Figure 7a, manufacturing’s constant share in both the gross and net operating
surplus earned in private industry over this period occurred despite a decline in the
overall share of the fixed assets devoted to manufacturing. Thus the declining share of
labor compensation in manufacturing reflected the combination of a massive drop in
manufacturing employment and an increase in overall profitability rather than a decline
15 Source: BEA.GOV. A similar result that labor’s bargaining power has not been affected is obtained by Brock & Dobbelaere (2006). Kamal, Lovely & Mitra(2014) find that globalization increased labor share in China. Ahsan & Mitra(2014) find a similar effect for labor intensive industries in India.

25
25
in the relative pay of manufacturing worker or an increase in the rate of investment. It is
also noteworthy that in real terms, manufacturing share in output has remained roughly
constant since 1947.
[FIGURE 7A]
[FIGURE 7B]
As can be seen in Figure 7b, rates of return to capital, as indicated by the ratio of
the net operating surplus to the value of fixed assets, have remained fairly constant in
private industry. However, the returns in manufacturing have increased substantially
since 1998, reaching 20 percent in 2012.
A third shift-share analysis for the manufacturing sector allows us to determine
which three digit NAICS industries have been the largest contributors to the declining
labor share in manufacturing value-added. While 14 of the 18 industries in
manufacturing experienced some decline in labor share, the changes with large impacts
were concentrated in three industries – petroleum and coal products, chemical products,
and computers and electronics. Together, these industries which accounted for just 22.6
percent of value-added in manufacturing in 1987, had impacts that amounted to 68
percent of the overall decline in labor share between 1987 and 2011. Changes in
industrial composition – between industry changes in weights – accounted for just over
a fifth of the decline, while 77.6 percent of the overall decline reflected the impact of
within-industry changes. The drops in labor’s share in petroleum refining (43.2 to 12.2

26
26
percent), chemical products (49.6 to 35.2 percent), and computer and electronic
products (81.7 to 57.7) were particularly dramatic.
[TABLE 3]
A similar result emerges when data for 473 6-digit industries are used in a shift
share analysis. The computation in Table 4 indicates that 84 percent of the 13.9
percentage point change between 1980 and 2000 can be ascribed to changes within the
6-digit industries. Although the decline is smaller between 2000 and 2009 because of
cyclical effects, a similar conclusion – that within-industry changes dominate – emerges
from the decomposition of the decline between 2000 and 2009. What is clear, therefore,
is that the declining labor share both within the manufacturing sector and the economy
as a whole was not primarily due to the reallocation of resources towards less labor
intensive industries. Instead, the bulk of the changes came from changes in shares that
have taken place within industries: 295 of 473 industries, accounting for 76 percent of
value-added in 2009 experienced within-industry declines in labor share.
[TABLE 4]
In sum, labor’s share in income has fallen, especially since 2000, to a degree
that appears to be outside the historical norm of cyclical fluctuations. However, even
the fairly constant labor share prior to 2000 was the outcome of offsetting developments
across sectors, and in particular, a rise in labor shares in several service sectors that

27
27
offset declines in the information and manufacturing sectors that began in the 1980s and
in the mining sector after 2000. Within manufacturing, the changes were pervasive, but
a few industries, especially petroleum refining, chemicals, and computers and
electronics have played a key role in the decline. In the case of petroleum and chemicals
this is both because their output shares have increased as well as labor’s share having
declined. However, most of the changes in labor share have reflected changes in factor
shares within industries.
The explanation to be offered later in this paper fits these facts. A fall in the
effective capital-labor ratio will raise the marginal product of capital and thus the rental-
wage ratio. If the elasticity of substitution is less than one, this decline will raise the rate
of return and the share of capital. At the same time, with sufficiently inelastic demand
for labor, with rapid labor-augmenting technical change, the labor share and the wage
rate could actually fall despite the rise in the marginal product of labor.
Section II: Existing Studies
Several recent studies (Karabarbounis and Nieman 2014, Elsby, Hobjin and
Sahin 2013, Piketty 2014, Piketty and Zucman 2013) offer explanations for recent
declines in the share of labor that rest on claims that σ exceeds unity and there has been
increased capital deepening.
Recent Studies

28
28
Karabarbounis and Neiman (2014) maintain that the declining labor income
share, both in the United States and globally, can be explained by the acceleration in
technological progress in the equipment industry and the associated decline in the
relative price of capital goods that took place in the early 1980s. They find that,
internationally, lower relative prices for investment goods are associated with lower
labor shares in income and they use calibration methods based on this international
cross-section relationship to estimate that σ of 1.42 best fits the data. While
emphasizing more rapid technical change in the production of equipment, Karbarbounis
and Neiman (2014) assume that there is factor-neutral productivity at the aggregate and
firm level. As they acknowledge “The choice of a CES technology with elasticity
greater than one rather than a Cobb-Douglas technology (with an elasticity equal to one)
is essential (italics added) for producing declines in the labor share in response to
declines in the cost of capital relative to the wage because firms increase their capital-
labor ratios more than they would with Cobb-Douglas production” (14). In other words,
given their assumption of Hicks neutral technical change, the only way they can explain
labor’s declining share in their framework on the basis of a decline in the cost of
investment goods is to calibrate a σ > 1. They have thus by assumption ruled out the
explanation to be presented here, i.e. that σ <1, and ignored the possibility that despite
the decline in the relative price of capital and associated rise in the capital-labor ratio,
more rapid labor augmenting technical change resulted in a decline in the effective
capital-labor ratio.
In Capital in the 21st Century, Thomas Piketty’s model makes the capital-
income ratio (K/Y) a function of the saving rate s and the growth rate g. His key

29
29
equation is K/Y = s/g. He then argues that with s unchanged, a decline in g will increase
K/Y. If this rise in K/Y is to reduce labor’s income share as can be seen from equation
(2) above, σ must be > 1. Piketty supports his claim that σ > 1 by citing Piketty and
Zucman (2013), which presents evidence that in seven countries, the net income share
of capital and the wealth-income ratio both rose between 1970 and 2010. This
association leads them to calibrate that the elasticity of substitution lies somewhere
between 1.3 and 1.6 (Piketty and Zucman 2013, 35). However, Rognlie (2014) points
out that the measure of capital (wealth) that Piketty and Zucman use is the current
market value and thus includes capital gains, whereas the equation that relates the
capital share to the capital-output ratio using σ i.e. equation 2, should be specified in
real terms. Rognlie shows that removing capital gains from the capital measure to
obtain a more appropriate measure of capital radically reduces the capital to income
ratio and he demonstrates that using book rather than market value – a more appropriate
indicator of the impact of capital accumulation generated by saving – suggests that on
average the countries in the sample used by Piketty and Zucman actually show a decline
in the ratio of capital to income. If a falling capital-output ratio has led to a rising capital
share in income, this would actually imply that σ is less than rather than greater than
one, and thus undermine the prediction that increases in the capital-output ratio will
cause capital’s share in income to rise. The estimates provided by Piketty and Zucman
thus appear to rest on faulty data and back-of-the-envelope calculations rather than
rigorous econometric analysis. They are also contradicted by the large number of
studies that find that σ < 1.

30
30
Elsby et al. (2013) offer no evidence of their own on the magnitude of σ, but the
arguments in their paper reflect the assumption that σ is > 1. For example, they observe
that in the 00s the decline in labor’s share in the US has been associated with a
slowdown in the growth of the capital-labor ratio, and they argue that since slower
growth in the capital-labor ratio should slow rather than accelerate the decline in labor’s
share (assuming σ > 1), the neoclassical framework is incapable of explaining the
slowdown. Having rejected the framework, they then present evidence that attributes
much of the decline in labor’s share in income to off-shoring by US firms, and speculate
that the offshoring of more labor intensive tasks has raised the capital-labor ratio within
the US industries. In addition, they suggest that that with offshoring, σ could rise.16
However, if σ is actually < 1, in the face of rapid labor-augmenting technical change, a
decline in the effective capital-labor ratio could explain labor’s declining share (the
neoclassical explanation) and it is also possible that the off-shoring might have actually
reduced the elasticity of substitution of the production that remains in the United States
by making it more intensive in skilled labor (which is more complementary with
capital).
The previous section concluded that US manufacturing has played a key role in
contributing to the declining labor share in the US. It is noteworthy that the behavior of
investment in manufacturing provides little support for the investment boom on which
the explanations put forward by these authors rests. First, if lower prices for investment
goods especially equipment are at the heart of the explanation, one might expect to see
that the net capital stock in manufacturing had increased relatively rapidly in recent
16 See ibid. page 40 in which they observe that “if capital is more than unit elastic with respect to labor, Hicks’ (1932) result will imply that the U.S. labor share will fall”.

31
31
years. However, as shown in Figure 8, the average annual growth rate of the net capital
stock in fixed assets in manufacturing has actually decelerated, and the share of
manufacturing investment being devoted to equipment in particular has declined.
Between 1950 and 1980, and 1980 and 2013, the annual growth rate in the net capital
stock in fixed assets in manufacturing declined from 4.3 to 1.9 percent respectively and
the annual growth rate in the net capital stock in equipment declined from 4.1 percent to
1.7 percent respectively. Moreover since 2000, the overall net stock of fixed assets and
the net stock of equipment have averaged just 1.0 and 0.6 percent annual growth
respectively.
[FIGURE 8]
Similarly, given the declining share of labor income, applying the argument
used by Piketty (i.e. that σ > 1) we would have expected the capital-output ratio in
manufacturing to have risen. Yet as shown in Figure 9, between 1980 and 2012 the ratio
of the net fixed stock of assets in manufacturing to real manufacturing output actually
declined by 33 percent! This decline is also inconsistent with the argument that as a
result of offshoring, the labor intensive tasks have been shipped abroad and
manufacturing value-added in the United States has become more capital intensive in
the sense of a higher capital to output ratio.
[FIGURE 9]

32
32
The only evidence that capital-deepening has taken place in the US in recent
decades, is the increase in the ratio of the net fixed capital stock to full time equivalent
employment that is evident after 1990, especially in manufacturing.
[FIGURE 10]
However, the increases in capital-labor ratios have been achieved not by
additional investment, but rather through substantial layoffs of manufacturing workers.
Indeed, as shown in Figure 11, US non-residential investment as a share of GDP has
been weak since 2000, especially in equipment in general and information technology
equipment in particular.
[FIGURE 11]
Evidence on σ
Moreover, while they have gained prominence recently, these claims that capital
and labor are highly substitutable are in the distinct minority. With a few exceptions,
there have been many studies that have used a variety of estimation and calibration
techniques that have overwhelmingly concluded that in both the short and long run, σ is
< 1. The original study which pioneered the CES function, that of Arrow et al. (1961),
estimated σ as 0.57. Later studies by David and van de Klundert (1965) and Kalt (1978)
estimated elasticities equal to 0.32 and 0.76, respectively. Hamermesh (1993) surveyed

33
33
a range of early estimates and found that the results were generally between 0.3 and 0.7.
One noteworthy early exception was Berndt (1976) who found support for an elasticity
equal to unity. However, Antras (2004) showed that if Berndt’s equation was specified
to allow for factor augmenting change, it indicated that “aggregate elasticity is likely to
be considerably less than one and may even be lower than 0.5.” Klump et al. (2007) use
a variety of methods and obtained estimates of the elasticity of substitution between 0.5
and 0.64. Moreover, Chirinko (2008) summarizes a large number of studies finding that
“while the estimates range widely, the weight of the evidence suggests a value of
(sigma) in the range of 0.40–0.60.”17 Young(2010) uses several estimation techniques
and concludes that aggregate US σ is “less than unity and perhaps less than 0.5” and he
finds that the elasticity is less than unity for the large majority of the 35 individual
industries he estimates separately. Wei (2014) uses an international sample of 40
countries and 34 industries. He finds that industry elasticities fall within a range from
0.4 to 0.9 and that country-level elasticities are “typically around 0.62.” Mallick (2012)
estimates σ for 90 countries and finds that the mean value is 0.34.18
It is plausible that over the long run, the possibilities of substitution are greater.
Indeed, while Fragiadakis et al (2012) find that typically short run elasticities of
substitution are less than unity, they also find that using a lagged dependent variable
implies long run elasticities greater than unity. However, Chirinko and Mallick (2014)
use time series methods to explicitly measure the long run elasticity and conclude that
over the long run it is still less than one, and Juselius (2008) uses a model that assumes
17 Ronglie (2014) points out that 31 out of 36 of the studies cited by Chirinko have elasticities less than one. 18 The mean values for the East Asia and Sub-Saharan African countries are 0.737 and 0.275, respectively. For the OECD countries the mean is 0.340.

34
34
labor and product market imperfections and, using time series analysis on Finnish data,
also concludes that the long run elasticity is less than one.
Most of these studies use aggregate time series and stipulate particular
functional forms about the aggregate production function and the bias of technological
change. However, Oberfeld and Raval (2014) adopt an approach that allows
identification through exogenous variation in factor prices and recover the aggregate
elasticity of substitution from plant level elasticities and estimates of the elasticity of
demand. They distinguish changes within and across plants and, after aggregating plant
data, find an aggregate elasticity of substitution for US manufacturing of 0.7 that has
remained fairly constant over time.
Theory
The traditional workhorse of growth theory is the Cobb-Douglas production
function whose elasticity of substitution is unity. If we accept that σ < 1, there are
profound implications for growth theory. With Cobb-Douglas it also follows that the
direction of technical change is irrelevant for income distribution. In the CES world,
however, when σ < 1, a steady state with constant factor income shares and a constant
capital-output ratio is only possible if technical progress is purely labor augmenting,
see Uzawa (1961) and Jones and Scrimgeour (2004). In a model in which the bias in
technological change is endogenous, Acemoglu (2002, 2003) has provided an
explanation why in the long run, technical change will be purely labor augmenting.
If we accept that σ < 1, it must also be the case that for the most part technical
change in the US has been labor-augmenting. In the US, the capital-labor ratio in

35
35
manufacturing and the economy as a whole has risen steadily, yet for long periods, prior
to 1980 for manufacturing, and prior to 2000 for the economy, factor income shares
remained fairly constant. This implies that the effective capital-labor ratio must have
been constant, with labor augmenting technical change offsetting the rising capital-labor
ratio.
Augmenting Change
This reasoning is supported by several empirical studies that have explicitly
tried to estimate the direction of US technical change. Here, the pioneering work was
undertaken by Antras (2004) who assumed that factor augmentation grew by a fixed
percentage annually – an exponential specification. He found that on balance US
technical change has been labor augmenting and that the annual growth in labor
augmenting change has exceeded that of capital-augmenting change by about three
percent. Klump et al. (2007) explore the functional form of labor and capital
augmenting technical change and confirm that labor augmenting technical change is
best captured by an exponential functional specification. However, they find that the
best fit for capital augmenting change is a functional form that is hyperbolic and tends
to disappear over time – a finding that supports the Acemoglu theory that in the long
run, all technical change will be labor augmenting. 19Wei (2014) adopts the Antras
specification and finds “At the country level, 35 of the 40 countries exhibit net labor-
19 In Acemoglu’s theory, with σ < 1, capital augmenting technical change reduces capital share and thus dampens the incentives for both capital accumulation and capital-augmenting technical change.

36
36
augmenting technical progress. However, at the industrial level, this is not always
true.”20
In sum, the evidence in support of the capital-deepening explanations based
claims or assumptions that σ > 1 is weak and inconsistent with recent data for US
manufacturing. On the other hand, the literature provides considerable support for the
two components of the explanation I will advance. First, it shows that in both the short
and the long run, σ is less than one; and second, it has developed strong theoretical
reasons, supported by empirical evidence that on balance technological change has been
labor augmenting. The following section shows that regressions which provide
estimates of σ < 1, and labor augmenting technical change can explain the decline in
labor’s share in US income.
Section III: Combining the Components: The Decline in Labor’s Share
This empirical analysis follows Antras (2004) who was the first to estimate the
elasticity of substitution in a specification that expressly allowed for factor augmenting
technical change. Specifically, the production function is assumed to have a constant
elasticity of substitution and, in addition, factor augmenting technical change such
that the capital and labor augmentation grow at constant rates of λk and λl respectively.
Thus the production function for output Y and time t is
20 Bentolia and Saint-Paul (2003) use a more complex model and reach more nuanced conclusions. “We find for the euro area for the period 1970–2005 an aggregate elasticity of substitution below unity (about 0.7) and a pattern of factor-augmenting technical growth rates where labor-augmenting technical progress growth dominates in the long run while capital-augmenting technical progress plays a significant role in the interim period. We also importantly find evidence for a structural break in this pattern of biased technical progress at the end of the 1990s with an upward shift in capital augmenting technical progress and a downward shift in labor augmenting progress.

37
37
Yt = [
(3)
The first order profit conditions require that the marginal product of each of the
factors be equal to their prices i.e.
Log (Yt / Kt) = + log (Rt / ) + (1 - λk.t + (a)
Log (Yt / Lt) = + log (Wt / ) + (1 - λl.t + (b)
Subtracting equation (a) from equation (b) we obtain
Log (Kt / Lt) = + log (Wt / Rt) + (1 - (λl – λk).t + (c)
We can also express the equations by reversing the dependent and independent
variables.
Log (Rt / ) = + (1 / log (Yt /Kt) – [(1 - / λk.t + (d)
Log (Wt/ ) = + (1 / log (Yt /Lt) – [(1 - / λl. t + (e)
Again subtracting equation (d) from equation (e) we obtain
Log (Wt/ Rt) = + (1 / log (Kt/Lt) – [(1 - / (λl – λk).t + (f)
For our purposes these specifications are useful because running these
regressions not only give us estimates of σ the estimate of σ can then be used to solve
for the growth rate of capital and labor augmenting technical change in equations (a)
and (b) respectively, and for the difference between labor and capital augmenting
change in equation (c). Similarly estimates and σ and factor augmenting change can be
obtained from equations (d), (e) and (f). Changes in the effective capital-labor over
time t dlogk = (λK.t + dlogK) / (λl.t + d logL) can then be calculated and used to predict
changes in labor’s share (Ls) using equation (1) which re-specified in terms of the
effective capital-labor ratio is:

38
38
. d ln Ls = - (1 – Ls)
d ln k (4)
Data
Dale Jorgenson and his associates (2012) have developed measures of labor and
capital inputs, services and prices. Their labor input measure combines data on work
hours from the BLS and labor matrices of 192 demographic characteristics (gender,
class of worker, age, education from the work of (Jorgenson, Ho and Samuels 2012).
Expressed as an index, it is thus a measure of the quantity of labor services. Given
income of labor, the price of labor, (the wage rate) is then derived. Similarly, the
capital-services measure used in the production function estimates reflects weighting of
90 different types of assets divided into five major categories: intellectual property,
equipment, structures, inventories, and land.21 Given capital income (i.e. the net
operating surplus, and the index of capital services) the price of capital (rate of profit) is
then derived. Wherever possible, I use these data to estimate labor’s share at the
aggregate and industry level. However, for more disaggregated industry analysis I will
use the data developed by the Bureau of Labor Statistics to explain total factor
productivity at the industry level. These also provide estimates of output and capital and
labor inputs and prices.
Antras (2004) uses an earlier version of the Jorgenson data. He obtains estimates
of ranging between 0.641 and 0.892 and his estimates of net labor augmenting
technical change (λl – λk) obtained from equations (c) and (f) are 3.08 and 3.15 percent
21 Intellectual property accounts are now a fifth category of major asset types that include the 90 individual assets. Intellectual property products are composed of three broad classes of assets: software (originally in a category called fixed business equipment and software), research and development, and artistic originals.

39
39
respectively. In the Jorgenson data, the ratio of capital to labor service inputs increases
at an annual average rate of 2.46 log points between 1948 and 1998. Thus Antras’
estimates provide a preview of the results to be reported below in that they imply that
on average over his period of estimation the effective capital-labor ratio was a declining
i.e. the annual growth rate of net labor-augmenting productivity change was about half
a percent higher than the growth rate of the capital-labor ratio. The average of Antras’
estimates of are 0.78. Over the 50 years, given the initial labor share of 58 percent in
1948, using equation (4) leads to a prediction of a small decline of -.031 log points in
labor’s share between 1948 and 1998. Labor share in income in the Jorgenson data was
actually 62 percent in 1998. While not perfect, the estimates using this methodology
thus do reasonably well in predicting the relative stability of labor’s share in income
over the five decade period.
[TABLE 5]
Table 5 uses the results of estimates of equations (c) and (f) for various periods.
Each of these equations provides estimates of and after manipulation the annual
difference between labor and capital augmenting technical change is extracted. 22 The
results are quite mixed and prior to 1980, the estimates of are not statistically
significant. However, the σ estimates are significant for the period 1980 through 2010.
In the K/L regression –specification (c) -- between 1980 and 2010, a statistically
significant (p =.05) estimate of σ = 0.187 combined with net labor augmenting change
22 The Prais-Winston method is used to correct for auto-correlation.

40
40
of 2.4 implies a negative effective capital labor ratio and predicts a decline in labor
share of 8.8 log points, which is close to the 8.4 log point decline that actually took
place. In the W/R regression, specification (f) for the same period is higher but less
than one and less significant (p=.10). Moreover, with a decline in the effective capital
labor of -.0287, the result predicts a decline in labor share of 4.5 log points -- about half
of the actual 8.4 log point fall. Thus, averaging the two equations suggests σ = .54, an
annual decline in k – the effective capital-labor ratio of 2 log points and a decline in
labor share of 6.7 log points compared with the actual decline of 8.4 log points between
1980 and 2010.
Neither of the estimates of σ for the shorter period 1999 through 2010 are
significant although taken together the equations do a reasonable job in predicting
declines of -.127 and -.059 as compared with the actual decline of -.09. Indeed, the
average of the two predictions with an estimate of σ = 0.494 and an annual change in k -
.0229 leads to a prediction of -.086, which is almost precisely correct.
[TABLE 6]
The results explaining labor’s share in manufacturing in Table 6 are much
stronger than those for the aggregate economy. Most of the coefficients in both
specifications are significant and in all periods they indicate that σ < 1. In addition, the
results from the equations can be used to track the changes in the labor share over time.
Over the period 1947 through 1980, the averaged results closely predict the slight
increase (2.5 log points) in the labor share that actually took place. The equations then

41
41
capture the dramatic change that took place after 1980. Both specifications indicate
accelerations in net labor augmenting technical change and lower σ’s after 1980. This
combination of strong net labor augmenting technical change and σ < 1 leads to
predictions of large declines in labor’s share in income. On average the equations do
well in explaining the decline especially over the past decade. Between 1980 and 2010
the actual decline of 37.1 log points exceeded the average predicted decline of 31.8 log
points by 5.3 log points and between 1999 and 2010 the actual decline of 23.1 log
points differs from the predicted decline by just 1.9 log points. In sum, it appears that
this specification can explain the aggregate behavior of labor’s share in US
manufacturing since 1980.
[TABLE 7]
Using data that have been developed by the BLS for estimating productivity
growth, that are similar but not the same as those from Jorgenson et. al, I have
undertaken a similar exercise for individual US industries between 1987 and 2011 at the
three digit NAICS level. I report both equations (c) and (f). Again, all regressions have
been run using the Prais-Winston method for dealing with autocorrelation.
The shift share analysis indicated that three manufacturing industries had
changes which together account for two thirds of the declining labor share within
manufacturing. In all three industries, as reported in the Table 7, the estimated
elasticities of substitution are very low and in all three, technical change is net labor
augmenting and in excess of the increases in the actual capital-labor ratios. As a result,

42
42
very large declines in the labor shares in log points are predicted. The W/R
specifications are more accurate and on average their predictions of declines of 53 log
points are fairly close to the 43 percent actually experienced.
[TABLE 8]
In Table 8, the results of the K/L and W/R regressions for all 18 three-digit
manufacturing industries are reported. As can be seen, while as shown by the shift-share
analysis, the impacts were concentrated in the three industries discussed above, the
declines in labor’s share were quite pervasive across manufacturing. They occurred in
14 of the 18 industries and averaged 17.9 log points. In the K/L specification, only ten
of the estimates of σ are statistically significant (seven though at the P =.01 level). In no
case in the k/l regressions does σ come close to unity. Indeed, the significant estimates
are extremely low, ranging from 0.0331 for transportation and 0.0499 for petroleum to
0.286 for fabricated metals. The W/R regressions are generally stronger with thirteen
significant estimates. There are four estimates of σ greater than one, but none are
significant, and the significant estimates have σ ranging between 0.09 for transportation
to 0.755 for plastics. Strikingly, in all of the 18 industries when K/L is the dependent
variable and in 15 of the 18 when W/R is the dependent variable, there is net labor
augmenting technical change. Moreover, the magnitude of this change is greater than
the increase in the capital-labor ratio in 14 cases with the K/L specification and 16 of
the 18 cases with the W/R specification implying that in the vast majority of
manufacturing industries the effective capital-labor ratio was declining. The model does

43
43
well qualitatively, although in some cases there are fairly large prediction errors that
reflect the use of σ coefficients that are not significant (e.g. food, textiles, paper and
especially plastics). On average, because of these errors, the k/l model over-predicts an
average decline in labor share of 41.4 log points versus the actual average decline of
17.9 log points. However, the W/R regressions have much smaller forecast errors and
on average predict a decline of 17.5 percent, which is remarkably close to the actual
average decline of 17.8 percent. All told, therefore, it appears that in addition to the
industries that had the largest impact on labor’s share in manufacturing, there were
more pervasive combinations of low substitution elasticities and declining effective
capital-labor ratios that help explain why manufacturing experienced such large
declines in labor’s income share.
Finally, the information and mining sectors have played an important role in the
declines in labor’s share in income since 2000. Estimates using the Jorgenson data for
mining, and posts and telecommunications (which include the information technology)
sectors are reported below.
[TABLE 9]
For the period 1980 through 2010, while they are both able to account for almost
the entire large decline in labor share of 32.6 log points in post and telecommunications,
the estimates of σ from the two regressions are quite different. The prediction of the k/l
regression is based on a low σ and a decline in the effective capital-labor ratio while the
prediction using the W/R regression combines an estimate of σ = 1.2 with an estimate of

44
44
net capital augmenting technical change that is not, however, statistically significant.
All told therefore, these are quite mixed results and lend some support both to the
capital-deepening and the declining effective capital-labor explanations. Remarkably,
however, despite the relatively small sample, both the equations explaining labor’s
share in the income in post and telecommunications do very well in explaining the large
decline in labor’s share after 1999. For this period, the regressions provide very similar,
statistically significant estimates of σ of 0.8 and 0.9 from the K/L and W/R regressions
respectively, and they both estimate very substantial increases in labor augmenting
technical change. These in turn imply declining effective capital-labor ratios and result
in predictions of the decline in labor’s share of 26.4 log points with errors of just over 1
log point.
[TABLE 10]
The equations explaining mining and quarrying also provide an account of the
declining labor share after 1980 and especially after 2000 that can be couched in terms
of a low σ and a declining effective capital-labor ratio. The W/R regressions have
higher levels of significance and smaller errors in prediction, especially in the recent
period. What is interesting is that between 1947 through 1979, the W/R regressions
explain the declining labor share on the basis of σ > 1, and capital deepening due to net
capital augmenting technical change. These regressions also predict the declining labor
share of 11.7 log points with only a small error. However, more recently especially after
2000, again as in the case of posts and telecommunications, both the k/l and W/R

45
45
regressions estimate σ to be low (.207 and .436 for the K/L and W/R regressions) and
find a decline in the effective capital ratio to which a fall in actual capital-labor ratio
contributes. The predictions of the W/R equation is very accurate (a decline of 18.2 log
points versus an actual decline of 20.6), while the K/L regression also predicts a decline
but with an error of 8.7 log points. All told, the earlier behavior of these sectors
provides additional evidence that since 2000 the combination of a σ < 1 and declining
effective capital-labor ratios explain the declines in labor’s share in income.
In summary, for the period 1980 through 2010 there is overwhelming evidence
that despite the measured increase in the capital-labor ratio, the effective capital-labor
ratio has declined. This is the case for the total economy, for the manufacturing sector
as a whole, for the three industries that together accounted for more than two thirds of
the decline in labor share within manufacturing, for the majority of the three digit
industries within manufacturing, as well as for the mining sector. It has also been the
case for the posts and telecommunications sector since 2000.
Concluding Comments
The share of labor compensation in US national income has fallen to levels not
seen since the 1950s. The decline has been especially concentrated within industries in
manufacturing, mining, and information technology. In these sectors the explanation
does not lie with relatively weak wage growth because globalization has reduced labor’s
bargaining power. Indeed, the rise in worker compensation in manufacturing has been
similar to the rise elsewhere. Instead, it is rates of return in manufacturing that have
increased. There is however considerable evidence that relatively rapid labor-

46
46
augmenting technical change in combination with < 1 has played the key role. This
finding may seem paradoxical given the attention that has been focused on innovations
in computers and automation, which might at first glance seem to be capital
augmenting. However, in the Hicks framework, innovations are classified by their
relative impact on the marginal products of capital and labor. It is quite possible that
improvements in equipment and software could increase the marginal product of labor
by more than they increase the marginal product of capital and thus induce a decline in
the effective capital-labor ratio that is used to produce a given quantity of output.
It is also paradoxical to think that enhancing labor’s productivity could reduce
labor’s share in income, and reduce wage/ rental ratios. However, this should not be
surprising once it is recognized that technical change, which doubles each worker’s
productivity, is equivalent in supplying “effective labor” to doubling the number of
workers in labor force. Just as, in the face of an inelastic demand, an increase in the
supply of a product could reduce its price by enough to reduce total revenue, so too,
could an increase in the effective labor-capital ratio reduce labor’s share in income, and
even wages per worker, when labor and capital are not easily substituted.
In the Hicks terminology, labor augmenting technical change, which at the
margin encourages the use of labor rather than capital, is termed “capital-saving”; thus
another implication of labor-augmenting technical change is that less capital is required
to produce a given amount of output. This implies that if output is constrained by
inadequate demand for example, investment would be weaker. The conventional
wisdom is that there have been huge breakthroughs in information technology that

47
47
might have been expected to lead to unusually strong investment. Yet, as we have seen,
investment has been weak. This could be part of the explanation.
The issue of whether capital and labor are gross complements or substitutes is
crucial for determining the impact of measures that seek to affect the functional
distribution of income. As noted, the leading proponent of these factors as substitutes,
Thomas Piketty (2014), argues that to address a development that he regards as
inequitable, capital formation should be slowed by higher taxes on capital and wealth.
However, this study suggests such measures could be counterproductive and actually
reduce labor’s share in income by further lowering the effective capital-labor ratio.
Instead, the evidence here corroborates many others in concluding that in the United
States the elasticity of substitution between capital and labor is less than one. It has also
found that in the face of this low elasticity, the cause of labor’s falling share recently is
the weakness of investment in the face of faster labor-augmenting technical change,
rather than more capital deepening in the sense of rising capital-output ratios. This
suggests that measures that boost investment and capital formation would lead to higher
wages, raise labor’s share in income, and reduce income inequality.
A tax system that could achieve such a goal might be a progressive consumption
tax. This would boost investment by removing the taxes on capital while at the same
time allow income to be redistributed by imposing higher taxes on those with higher
levels of consumption. Such a system would also allow the United States to become
more a more competitive location for international investment.
While the conclusions of this paper are salient for debates about the causes of
some forms of income inequality these results are sufficiently important that they

48
48
should be the subject of further research. This paper has applied Occam’s razor to
explain changes in the functional distribution of income and finds considerable
evidence to support an explanation that points to the combination of σ’s < 1 and
declining effective capital-labor ratios. The simplest neoclassical explanation of the
functional distribution of income thus appears to explain the facts. However, to produce
these results many simplifying assumptions have been made. These include treating
factors as homogenous, assuming competitive conditions (i.e. no variations in markups),
constant returns to scale, constant elasticities of substitution between labor and capital,
no adjustment costs and frictions, and factor-augmenting technical change that is
characterized by constant exponential parameters. In addition, the estimates are derived
using fairly primitive econometric methods, relying on ordinary least squares
regressions and corrections for autocorrelation using the PRAIS method, rather than
employing time series and/or systems estimation methods.
Many of these assumptions and methodological choices deserve further scrutiny.
The measures of capital and labor developed by Jorgenson et. al. (2012) used in most of
the regressions have been derived by aggregating inputs with fundamentally different
characteristics. The measure of labor services, for example, reflects a weighting of 192
work-hour categories that are distinguished by gender, class of worker, age and
education. The measure of capital-services reflects a weighting of 90 different types of
assets divided into major categories that include equipment, structures, inventories, land
and intellectual property, which in turn aggregates software, research and development
and artistic originals.

49
49
However, there is considerable evidence that the substitution possibilities
between different types of capital and labor are not the same. For example, capital is
often viewed as complementary to skilled labor but substitutable with unskilled
labor(Griliches 1969, Krusell, et al. 2000). In addition, different types of capital such as
equipment and structures are also viewed as having different substitution possibilities
both with each other and with other factors. These differences imply that the
composition of capital and labor (i.e. relative supplies of different types of labor and
capital) could affect their aggregate substitution possibilities. For example, as Elsby et
al. (2013) show, if capital and skilled labor are less substitutable than capital and
unskilled labor, an increase in the share of skilled workers in the labor force could result
in a decline in the overall σ between capital and labor.23
In addition, with models with more than two factors, the predictions about the
impact of technical change on the functional distribution of income could be affected by
the degree to which technical change augments particular types of capital and labor.
Given the large number of studies that have concluded that skill-biased technical change
has been a powerful source of the rising skill premium in the United States, there are
good reasons that further disaggregation of the nature of technical change could be
important.
In empirical work that seeks to capture these effects, the results will be affected
by the manner in which the production function is modelled and the degree of
substitution possibilities between different types of labor and capital that are assumed or
calibrated. It is customary to try to capture this greater realism by building models that
use nested production functions. For example, Krussel et al. (2000) undertake an
23 See Elsby et al. (201331-33) for a discussion of the impact of changes in skill-mix on σ.
50
50
exercise with four factors of production (structures, equipment, skilled and unskilled
labor). At the highest stage of aggregation they specify a Cobb-Douglas production
function that has one type of capital – structures – and a composite CES, which in turn
combines two underlying CES production functions. One of these is comprised of
skilled labor and equipment that are assumed to be complements, and this function is in
turn nested in another function in which both skilled labor and equipment are assumed
to be substitutes for unskilled labor. Arpai et al. (2009) similarly explain changes in
European factors using such nested production functions. In their model, since capital
and skilled labor are complements, capital augmenting technical progress has the effect
of raising the skill premium. However, since unskilled labor is highly substitutable with
the composite of capital and skilled labor, skilled capital-augmenting progress also
leads to a decline in the overall labor share. As Atkinson (2009) discusses24 and these
examples indicate, dealing with more than two factors adds considerable complexity to
the analysis and entails making additional assumptions in order to ensure tractability
and apply calibration methods. Moreover, as he discusses and as shown by Blackorby
and Russell (1989) we cannot in general talk about two factors being complementary
without specifying the direction of price change envisaged.
Factor diversity is not the only source of additional realism that might be
relevant. Other sources of change that have been omitted could be important
determinants of the functional distribution of income. As incorporated in their
explanations of changes in labor share in Europe, for example, research by Bentolia and
Saint-Paul (2003) and Arpai et al. (2009) explicitly considers the potential role of
changes in markups, the role of intermediate input prices, adjustment costs and changes
24 Ibid p. 11-12.

51
51
in the price and wage determining processes. Rognlie (2015) also finds an important
role for mark-up changes. Combining the view that capital’s share is higher because of
higher mark-ups with the finding here presents a puzzle, since it might have been
expected that increased globalization would reduce rather than raise mark-ups.
However, this is an issue that needs further exploration.
In addition, a considerable literature has been devoted to developing
econometric methodologies for estimating the elasticity of substitution that may be
more suitable than those applied here. Antras (2004) and several other papers that apply
his methodology, use Generalized Instrumental Variables to correct for the endogeneity
of his regresssors as well as time series methods to correct for non-stationarity and the
possibility of spurious correlations. Klump et al. (2007) use normalized production
functions as recommended by Klump and De La Grandville (2000). They also allow for
more complex functional forms for factor augmenting technical change that can
accommodate exponential, logarithmic, and hyperbolic growth as special cases. Their
estimation is undertaken using a three equation supply side system, which includes both
the estimation of the production function and factor income equations and contains
cross-equation parameter restrictions. León-Ledesma et al. (2010) demonstrate using
Monte-Carlo methods that this combination of normalization and jointly modeling the
production function and first order conditions produces superior estimates. Additional
research using these techniques should be undertaken to explore whether the
conclusions obtained here are robust. Nonetheless, despite all these potential
complications, as a first approximation, contrary to the views of many, the canonical

52
52
neoclassical model of the functional distribution of income appears to work remarkably
well.

53
53
Bibliography
Acemoglu, Daron. "Directed Technical Change." Review of Economic Studies 69, no. 4 (2002): 781-809.
Acemoglu, Daron. "Labor- And Capital-Augmenting Technical Change." Journal of the European Economic Association 1, no. 1 (2003): 1-37.
Acemoglu, Daron, and James A. Robinson. "The Rise and Decline of General Laws of Capitalism." NBER Working Paper 20766, 2014.
Acemoglu, Daron, and Veronica Guerrieri. "Capital Deepening and Non-balanced Economic Growth." Journal of Political Economy 116, no. 3 (2008): 467-498.
Ahsan, Reshad N., and Devashish Mitra. "Trade liberalization and labor's slice of the pie: Evidence from Indian firms." Journal of Development Economics 108 (2014): 1-16.
Antras, Pol. "Is the U.S. Aggregate Production Function Cobb-Douglas? New Estimates of the Elasticity of Substitution." B.E. Journal of Macroeconomics 4, no. 1 (2004).
Arpaia, Alfonso, Esther Perez, and Karl Pichelmann. "Understanding Labour's Income Share Dynamics in Europe." European Economy Economics Paper No. 379, European Commission, 2009.
Arrow, Kenneth J., Hollis B. Chenery, B. S. Minhas, and Robert M. Solow. "Capital-Labor Substitution and Economic Efficiency." Review of Economics and Statistics 43 (1961): 225-250.
Atkinson, A. B. "Factor shares: the principal problem of political economy?" Oxford Review of Economic Policy 25, no. 1 (2009): 3-16.
Bentolia, Samuel, and Gilles Saint-Paul. "Explaining Movements in the Labor Share." Contributions to Macroeconomics 3, no. 1 (2003).
Berndt, E. "Reconciling alternative estimates of the elasticity of substitution." Review of Economics and Statistics 58, no. 1 (1976): 81-114.
Bertoli, Simone, and Francesco Farina. "The functional distribution of income: a review of the theoretical literature and of the empirical evidence around its recent

54
54
pattern in European countries." University of Siena DEPFID Working Papers, September 2007.
Blackorby, C., and R. R. Russell. "Will the Real Elasticity of Substitution Please Stand Up? (A Comparison of the Allen/Uzawa and Morishima elasticities)." American Economic Review 79 (1989): 882-8.
Blanchard, O. "European unemployment: the evolution of facts and ideas." Economic Policy, January 2006: 5-59.
Blanchard, Olivier. "The Medium Run." Brookings Papers on Economic Activity 2 (1997): 89-158.
Bridgman, Benjamin. "Is Labor’s Loss Capital’s Gain? Gross versus Net Labor Shares." Bureau of Economic Analysis, June 2014.
Brock, Ellen, and Sabien Dobbelaere. "Has international trade affected workers bargaining power?" Review of World Economics 142, no. 2 (2006): 233-266.
Burtless, G. "Income Progress Across the American Income Distribution 2000–2005." Testimony for the Committee on Finance, US Senate, May 2007.
Chirinko, Robert S. "The Long and Short of It." Journal of Macroeconomics 30 (2008): 671-686.
Chirinko, Robert S., and Debdulal Mallick. "The Substitution Elasticity, Factor Shares, Long-Run Growth, and the Low-Frequency Panel Model." CESifo Working Paper Series No. 4895, October 2014.
Cobb, Charles W., and Paul H. Douglas. "A Theory of Production." The American Economic Review 18, no. 1 (1928): 139-165.
David, Paul A., and Th. Van De Klundert. "Biased Efficiency Growth and Capital-Labor Substitution in the U.S., 1899-1960." American Economic Review 55 (1965): 357-393.
Dew-Becker, Ian, and Robert J. Gordon. "Where did the Productivity Growth Go? Inflation Dynamics and the Distribution of Income." NBER Working Paper No. 11842, 2005.
Elsby, Michael W. L., Bart Hobjin, and Aysegul Sahin. "The Decline of the U.S. Labor Share." Brookings Papers on Economic Activity, September 2013.

55
55
Fragiadakis, Kostas, Leonidas Paroussos, Nikos Kouvaritakis, and Pantelis Capros. A Multi – Country Econometric Estimation of the Constant Elasticity of Substitution. Athens: National Technical University of Athens, Paper prepared for WIOD project, 2012.
Griliches, Zvi. "Capital-Skill Complementarity." Review of Economics and Statistics 51, no. 4 (1969): 465-68.
Hamermesh, Daniel S. Labor Demand. Princeton, NJ: Princeton University Press, 1993.
Harrison, Ann E. "Has Globalization Eroded Labor’s Share? Some Cross-Country Evidence." UC Berkeley and NBER, April 2005.
Hicks, John, R. The Theory of Wages. 2nd. London, UK: MacMillan, 1963.
Jones, Charles I, and Dean Scrimgeour. "The Steady-State Growth Theorem: A Comment on Uzawa (1961)." NBER Working Paper No. 10921, November 2004.
Jorgenson, Dale W., Mun S. Ho, and Jon Samuels. "A Prototype Industry‐Level Production Account for the United States, 1947‐2010." Second World KLEMS Conference. Cambridge, MA: Harvard University, 2012.
Juselius, Mikael. "Long-run relationships between labor and capital: Indirect evidence on the elasticity of substitution." Journal of Macroeconomics 30, no. 2 (June 2008): 739-756.
Kaldor, Nicholas. "Capital accumulation and economic growth." In The Theory of Capital, edited by F. Lutz. London, UK: MacMillan, 1961.
Kalt, Joseph P. "Technological Change and Factor Substitution in the United States: 1929-1967." International Economic Review 19, no. 3 (October 1978): 761-775.
Kamal, Fariha, Mary E. Lovely, and Devashish Mitra. "Trade Liberalization and Labor Shares in China." US Census Bureau Center for Economic Studies Paper No. CES-WP-14-24, May 2014.
Karabarbounis, Loukas, and Brent Nieman. "The Global Decline of the Labor Share." Quarterly Journal of Economics, 2014: 61-103.
Keynes, J.M. "Relative movements of real wages and output." Economic Jounral 49, no. 193 (1939): 34-51.

56
56
Klump, R., and O. De La Grandville. "Economic growth and the elasticity of substitution: Two theorems and some suggestions." American Economic Review 90, no. 1 (March 2000): 282-291.
Klump, R., P. McAdam, and A. Willman. "Factor substitution and factor augmenting technical progress in the US: A normalized supply-side system approach." Review of Economics and Statistics 89, no. 1 (February 2007): 183-192.
Kraemer, Hagen M. "The Alleged Stability of the Labour Share of Income in Macroeconomic Theories of Income Distribution." IMK Working Paper, August 2010.
Krusell, Per, Lee Ohanian, Victor Rios-Rull, and Giovanni Violante. "Capital Skill Complementary and Inequality." Econometrica 68 (2000): 1029-1053.
Lawrence, Robert Z. Blue Collar Blues. Washington, D.C.: The Peterson Institute for International Economics, 2008.
León-Ledesma, Miguel A., Peter McAdam, and Alpo Willman. "Identifying the Elasticity of Substitution with Biased Technical Change." American Economic Review 100 (September 2010): 1330-57.
Mallick, Debdulal. "The role of the elasticity of substitution in economic growth: A cross-country investigation." Labour Economics 19 (2012): 682-694.
Mankiw, N. Gregory. Macroeconomics. 6th. Worth Publishers, 2007.
Oberfield, Ezra, and Devesh Raval. "Micro Data and Macro Technology." NBER Working Paper No. 20452, September 2014.
Piketty, Thomas. Capital in the Twenty-First Century. Belknap: Cambridge, MA, 2014.
Piketty, Thomas, and Gabriel Zucman. "Capital is Back: Wealth-Income Ratios in Rich Countries 1700-2010." Working Paper, 2013.
Robinson, Joan. Economics of Imperfect Competition. London, UK: MacMillan, 1932.
Rognlie, Matthew. "A Note on Piketty and Diminishing Returns to Capital." Working Paper, June 2014.
Rognlie, Matthew. "Deciphering the fall and rise in the net capital share." Brookings Papers on Economic Activity, March 2015.

57
57
Schneider, Dorothee. "The Labor Share: A Review of Theory and Evidence." SFB 649 Discussion Paper 2011-069, Humboldt-Universität zu Berlin, October 2011.
Solow, Robert M. "A skeptical note on the constancy of relative shares." American Economic Review, 1958: 618-631.
Summers, Lawrence H. "The Inequality Puzzle." Democracy, no. 33 (Summer 2014).
Uzawa, Hirofumi. "Neutral Inventions and the Stability of Growth Equilibrium." The Review of Economic Studies 28, no. 2 (1961): 117-124.
Wei, Taoyuan. "Estimates of substitution elasticities and factor-augmented technical changes." Center for International Climate and Environmental Research (CICERO), March 2014.
Young, Andrew T. "US Elasticities of Substitution and Factor-Augmentation at the Industry Level." Working Paper, West Virginia University, 2010.

58
58
TABLES
Table 1: Shift-share analysis of sectoral changes in labor share 2000 to 2012
Table 2: Shift-share analysis of sectoral changes in labor share 1987-2011 (unrevised data)
Labor Compensation Change Total Impactdue to: Industry GDP Share Share Between Within Impact on
2000 2012 2000 2012 Sectors Sectors Decline % Agriculture 1.0 1.2 0.31 0.21 -0.095 -0.002 -0.001 -0.001 4.9 Mining 1.1 2.6 0.33 0.21 -0.115 -0.007 -0.004 -0.003 17.6 Manufacturing 15.1 12.5 0.59 0.46 -0.135 -0.017 -0.001 -0.017 44.4 Utilities 1.8 1.7 0.28 0.26 -0.020 0.000 0.000 0.000 0.4 Construction 4.5 3.6 0.66 0.64 -0.030 -0.002 -0.001 -0.001 4.9 Wholesale trade 6.1 5.9 0.52 0.48 -0.048 -0.003 0.000 -0.003 7.2 Retail trade 6.8 5.7 0.58 0.55 -0.030 -0.002 0.000 -0.002 4.8 Transportation and warehousing 3.0 2.9 0.67 0.58 -0.085 -0.003 0.000 -0.002 6.5 Information 4.6 4.8 0.52 0.35 -0.171 -0.008 0.000 -0.008 21.2 Finance, insurance, real estate, rental, and leasing 19.4 19.5 0.25 0.24 -0.010 -0.003 0.000 -0.002 6.4 Professional and business services 10.8 11.9 0.75 0.71 -0.032 -0.002 0.002 -0.004 4.8 Educational services, health care, and social assistance 6.6 8.2 0.83 0.83 0.004 0.004 0.004 0.000 -11.4 Arts, entertainment, recreation, accommodation, and food services3.8 3.7 0.60 0.62 0.020 0.001 0.000 0.001 -1.8 Other services, except government 2.7 2.2 0.61 0.71 0.100 0.002 0.000 0.002 -4.9Government 12.9 13.5 0.79 0.80 0.006 0.002 0.001 0.001 -5.0GDP 100.0 100.0 0.57 0.53 -0.039 0.001 -0.040Source BEA.Gov
Labor Compensation Change Total Impactdue to: Industry GDP Share Share Between Within Impact on
Sectors Sectors Decline %1987 2011 1987 2011
Agriculture, forestry, fishing, and hunting 1.66 1.15 0.202 0.251 0.050 0.002 0.002 0.001 -9.2 Mining 1.54 1.92 0.404 0.278 -0.126 -0.003 -0.001 -0.002 11.4 Utilities 2.66 1.98 0.245 0.239 -0.005 0.002 0.002 0.000 -8.0 Construction 4.44 3.51 0.683 0.686 0.004 -0.001 -0.001 0.000 3.1 Manufacturing 17.38 11.49 0.678 0.523 -0.156 -0.024 -0.006 -0.018 87.9 Wholesale trade 6.03 5.61 0.538 0.518 -0.020 -0.001 0.000 -0.001 3.5 Retail trade 7.30 6.01 0.603 0.551 -0.051 -0.003 0.000 -0.003 12.5 Transportation and warehousing 3.22 2.97 0.687 0.590 -0.097 -0.003 0.000 -0.003 11.6 Information 4.17 4.29 0.450 0.403 -0.047 -0.002 0.000 -0.002 8.0 Finance, insurance, real estate, rental, and leasing 17.95 20.29 0.233 0.236 0.003 -0.007 -0.008 0.001 27.4 Professional and business services 8.12 12.50 0.667 0.687 0.020 0.006 0.004 0.003 -23.8 Educational services, health care, and social assistance 5.86 8.70 0.800 0.818 0.018 0.008 0.006 0.002 -28.9 Arts, entertainment, recreation, accommodation, and food services 3.22 3.92 0.618 0.589 -0.029 -0.001 0.000 -0.001 3.1 Other services, except government 2.56 2.45 0.610 0.664 0.054 0.001 0.000 0.001 -4.7Government 13.90 13.23 0.848 0.849 0.001 -0.002 -0.002 0.000 6.2GDP 100.00 100.00 0.578 0.551 -0.027 -0.027 -0.003 -0.024 100.0Source BEA.Gov

59
59
Table 3: Shift-share analysis of changes in labor share in manufacturing 1987 to 2011 (unrevised data)
Table 4: Shift-share decomposition of changes in labor payroll share in manufacturing
due to:Value Share Labor Compensation change Impact Between Within % of total
Share Industry Industry Impact1987 2011 1987 2011 Shifts Shifts
Petroleum and coal products 2.3 9.8 0.432 0.122 -0.309 -0.049 -0.018 -0.030 31.3 Chemical products 9.9 14.6 0.496 0.352 -0.144 -0.030 -0.009 -0.021 19.1 Computer and electronic products 10.3 13.1 0.817 0.577 -0.240 -0.028 0.004 -0.031 17.8 Food and beverage and tobacco products 10.8 12.4 0.503 0.420 -0.082 -0.013 -0.003 -0.010 8.3 Machinery 8.0 7.6 0.755 0.641 -0.114 -0.009 0.000 -0.009 5.8 Primary metals 3.9 2.9 0.798 0.619 -0.178 -0.006 -0.001 -0.005 4.1 Miscellaneous manufacturing 2.7 4.6 0.704 0.579 -0.125 -0.005 0.000 -0.006 3.4 Motor vehicles, bodies and trailers, and parts 7.7 4.4 0.755 0.710 -0.045 -0.005 -0.003 -0.002 2.9 Plastics and rubber products 3.9 4.0 0.670 0.560 -0.110 -0.004 0.000 -0.004 2.8 Textile mills and textile product mills 2.6 1.1 0.776 0.621 -0.155 -0.003 -0.001 -0.002 2.0 Apparel and leather and allied products 2.7 0.7 0.779 0.720 -0.058 -0.002 -0.002 0.000 1.6 Furniture and related products 2.2 1.5 0.780 0.668 -0.112 -0.002 -0.001 -0.002 1.5 Printing and related support activities 3.2 1.8 0.828 0.833 0.005 -0.002 -0.002 0.000 1.2 Electrical equipment, appliances, and components 4.2 2.7 0.671 0.658 -0.012 0.000 0.000 0.000 0.1 Fabricated metal products 8.3 7.1 0.699 0.700 0.001 0.000 0.000 0.000 0.1 Nonmetallic mineral products 2.9 1.9 0.696 0.713 0.018 0.000 0.000 0.000 -0.1 Paper products 4.7 3.1 0.593 0.562 -0.031 0.000 0.001 -0.001 -0.3 Wood products 2.4 1.3 0.655 0.721 0.066 0.001 0.000 0.001 -0.7 Other transportation equipment 7.2 5.4 0.702 0.738 0.036 0.002 0.000 0.002 -1.0 Manufacturing 100.0 100.0 0.678 0.523 -0.156 -0.155 -0.035 -0.121 100.0Source BEA.Gov
Change in share percent of Change in share percent of1980 2000 2009 1980-2009 change 2000-2009 change
Payroll share in manufacturing value-added 0.411 0.313 0.270 -0.139 100.000 -0.043 100.000due to:(1) changes in 6-digitindustry shares -0.023 16.2 -0.010 22.5(2) within 6-digit industryshare changes -0.116 83.8 -0.033 77.5Source: NBER-CES Manufacturing Industry Database (473 6-digit industries)

60
60
Table 5: Total industry
Table 6: Total manufacturing
Table 7: Manufacturing industries with largest impacts 1987-2011
Regression Result
K/L Regression 1⁄ σ Year Coefficient λl – λk dlog(K/L) dlog(k) Predicted Actual Error
1947-1979 0.136 0.0227*** 0.026 0.024 -0.002 -0.161 0.166 0.327
1980-2010 0.187** 0.0196*** 0.024 0.022 -0.002 -0.088 -0.084 0.004
1999-2010 0.100 0.0230*** 0.026 0.023 -0.003 -0.127 -0.090 0.038
w/r Regression
1947-1979 0.720 1.389 0.015 0.052 0.024 -0.027 0.101 0.166 0.064
1980-2010 1.125* 0.889 -0.006 0.051 0.022 -0.029 -0.045 -0.084 -0.039
1999-2010 0.758 1.319 -0.007 -0.028 0.023 0.051 -0.059 -0.090 -0.030
Average
1947-1979 0.762 0.019 0.039 0.024 -0.015 -0.030 0.166 0.196
1980-2010 0.538 0.007 0.038 0.022 -0.015 -0.066 -0.084 -0.018
1999-2010 0.710 0.008 -0.001 0.023 0.024 -0.093 -0.090 0.004
Effective Capital Labor Ratio Change in Labor Share
Regression Result
K/L Regression 1⁄ σ Year Coefficient λl – λk dlog(K/L) dlog(k) Predicted Actual Error
1947-1979 0.423*** 0.0196*** 0.034 0.034 0.000 -0.001 0.025 0.026
1980-2010 0.311*** 0.0324*** 0.047 0.035 -0.012 -0.328 -0.371 -0.043
1999-2010 0.275* 0.0412*** 0.057 0.040 -0.017 -0.215 -0.231 -0.016
w/r Regression
1947-1979 1.039*** 0.962 0.003 -0.079 0.034 0.113 0.058 0.025 -0.033
1980-2010 1.411*** 0.709 -0.0393** 0.096 0.035 -0.061 -0.308 -0.371 -0.062
1999-2010 1.791** 0.558 -0.0749** 0.095 0.040 -0.055 -0.208 -0.231 -0.023
Average
1947-1979 0.693 0.011 -0.023 0.034 0.057 0.029 0.025 -0.004
1980-2010 0.510 -0.003 0.071 0.035 -0.036 -0.318 -0.371 -0.053
1999-2010 0.417 -0.017 0.076 0.040 -0.036 -0.212 -0.231 -0.019
Effective Capital Labor Ratio Change in Labor Share
K/L Regression 1⁄� σ Year Coefficient λl – λk dlog(K/L) dlog(k) Predicted Actual Error
Petroleum 0.0499*** 0.0257*** 0.027 0.023 -0.004 -0.772 -0.444 0.328
Chemicals 0.049 0.0331*** 0.035 0.031 -0.004 -0.771 -0.318 0.452
Computer and Electronic Product 0.0803*** 0.0631*** 0.069 0.061 -0.008 -0.893 -0.543 0.350
w/r Regression
Petroleum 6.981*** 0.143 -0.201*** 0.034 0.023 -0.011 -0.635 -0.444 0.191
Chemicals 2.006** 0.499 -0.0557* 0.055 0.031 -0.025 -0.247 -0.318 -0.071
Computer and Electronic Product 4.463*** 0.224 -0.280*** 0.081 0.061 -0.020 -0.694 -0.543 0.151
AVERAGE
Petroleum 0.097 0.030 0.023 -0.007 -0.703 -0.444 0.259
Chemicals 0.274 0.045 0.031 -0.014 -0.509 -0.318 0.190
Computer and Electronic Product 0.152 0.075 0.061 -0.014 -0.793 -0.543 0.251
Regression Result Effective Capital Labor Ratio Change in Labor Share

61
61
Table 8: 18 3-digit manufacturing industries
Table 9: Post & telecommunications
K/L Regression Regression Result Effective Capital Labor Ratio Change in Labor Share
1987-2011Industry Name 1⁄� σYear Coefficient λl – λk dlog(K/L) dlog(k) Predicted Actual Error
1 Food 0.003 0.0124*** 0.012 0.012 -0.001 -2.856 -0.147 2.709
2 Textiles 0.039 0.0334*** 0.035 0.030 -0.004 -1.085 -0.314 0.771
3 Apparel and Leather 0.142** 0.0579*** 0.067 0.061 -0.007 -0.398 -0.116 0.281
4 Wood 0.0994** 0.0199** 0.022 0.023 0.001 0.112 0.207 0.095
5 Paper 0.027 0.0215*** 0.022 0.020 -0.002 -0.836 -0.086 0.750
6 Printing 0.087 0.0301*** 0.033 0.031 -0.002 -0.228 -0.059 0.169
7 Petroleum 0.0499*** 0.0257*** 0.027 0.023 -0.004 -0.772 -0.444 0.328
8 Chemicals 0.049 0.0331*** 0.035 0.031 -0.004 -0.771 -0.318 0.452
9 Plastics -0.010 0.0321*** 0.032 0.028 -0.004 4.203 -0.246 -4.450
10 Nonmetallic Minerals 0.255*** 0.0142*** 0.019 0.021 0.002 0.047 0.037 -0.011
11 Primary Metals 0.127*** 0.0170*** 0.019 0.012 -0.007 -0.500 -0.313 0.188
12 Fabricated Metals 0.286*** 0.0151*** 0.021 0.016 -0.005 -0.130 0.009 0.139
13 Machinery 0.254*** 0.0338*** 0.045 0.034 -0.011 -0.323 -0.287 0.036
14 Computer and Electronic Product 0.0803*** 0.0631*** 0.069 0.061 -0.008 -0.893 -0.543 0.350
15 Electrical Equipment 0.062 0.0349*** 0.037 0.033 -0.004 -0.572 -0.089 0.484
16 Transportation 0.0331*** 0.0410*** 0.042 0.039 -0.003 -1.020 -0.008 1.011
17 Furniture 0.0687* 0.0340*** 0.037 0.031 -0.005 -0.742 -0.237 0.505
18 Miscellaneous 0.043 0.0296*** 0.031 0.028 -0.003 -0.667 -0.268 0.399
w/r Regression Regression Result Effective Capital Labor Ratio Change in Labor Share
1987-2011Industry Name 1⁄� σ Year Coefficient λl – λk dlog(K/L) dlog(k) Predicted Actual Error
1 Food 0.161 6.211 0.002 0.003 0.012 0.009 -0.077 -0.147 -0.070
2 Textiles 0.519 1.927 -0.009 -0.019 0.030 0.049 -0.238 -0.314 -0.076
3 Apparel and Leather 1.383*** 0.723 -0.031 0.080 0.061 -0.019 -0.072 -0.116 -0.044
4 Wood 1.406* 0.711 0.020 -0.049 0.023 0.073 0.295 0.207 -0.088
5 Paper 3.601*** 0.278 -0.0631*** 0.024 0.020 -0.005 -0.117 -0.086 0.031
6 Printing 0.278 3.597 0.0234* 0.032 0.031 -0.002 0.012 -0.059 -0.070
7 Petroleum 6.981*** 0.143 -0.201*** 0.034 0.023 -0.011 -0.635 -0.444 0.191
8 Chemicals 2.006** 0.499 -0.0557* 0.055 0.031 -0.025 -0.247 -0.318 -0.071
9 Plastics 1.324*** 0.755 -0.026 0.079 0.028 -0.051 -0.165 -0.246 -0.081
10 Nonmetallic Minerals 2.879*** 0.347 -0.0348*** 0.019 0.021 0.002 0.041 0.037 -0.004
11 Primary Metals 3.707*** 0.270 -0.0734*** 0.027 0.012 -0.015 -0.404 -0.313 0.091
12 Fabricated Metals 1.602*** 0.624 -0.013 0.022 0.016 -0.006 -0.034 0.009 0.043
13 Machinery 2.233*** 0.448 -0.0639*** 0.052 0.034 -0.018 -0.216 -0.287 -0.071
14 Computer and Electronic Product4.463*** 0.224 -0.280*** 0.081 0.061 -0.020 -0.694 -0.543 0.151
15 Electrical Equipment 1.068 0.936 0.006 -0.086 0.033 0.120 0.081 -0.089 -0.170
16 Transportation 10.17*** 0.098 -0.385*** 0.042 0.039 -0.003 -0.282 -0.008 0.273
17 Furniture 2.542*** 0.393 -0.0740*** 0.048 0.031 -0.017 -0.261 -0.237 0.024
18 Miscellaneous 0.441 2.268 0.002 0.004 0.028 0.024 -0.132 -0.268 -0.136
K/L Regression 1⁄ σ Year Coefficient λl – λk dlog(K/L) dlog(k) Predicted Actual Error
1947-1979 -0.047 0.0504*** 0.048 0.047 -0.001 0.270 -0.230 -0.500
1980-2010 0.186* 0.0511*** 0.063 0.057 -0.006 -0.320 -0.326 -0.006
1999-2010 0.798*** 0.0540*** 0.267 0.063 -0.204 -0.248 -0.264 -0.015
w/r Regression
1947-1979 -0.498 -2.008 0.0497* 0.033 0.047 0.014 -0.278 -0.230 0.048
1980-2010 0.820* 1.220 -0.011 -0.061 0.057 0.118 -0.263 -0.326 -0.063
1999-2010 1.112*** 0.899 -0.0595*** 0.531 0.063 -0.468 -0.252 -0.264 -0.012
1947-1979 -1.0275 0.041 0.047 0.007 -0.004 -0.230 -0.226
1980-2010 0.703 0.001 0.057 0.056 -0.292 -0.326 -0.035
1999-2010 0.8485 0.399 0.063 -0.336 -0.250 -0.264 -0.014
Regression Results Effective Capital Labor Ratio Change in Labor Share

62
62
Table 10: Mining and quarrying
Regression Results Effective Capital Labor Ratio Change in Labor Share
K/L Regression 1⁄ σ Year Coefficient λl – λk dlog(K/L) dlog(k) Predicted Actual Error1947-1979 0.132* 0.0340*** 0.039 0.036 -0.003 -0.284 -0.117 0.166
1980-2010 0.307*** 0.0182*** 0.026 0.023 -0.004 -0.099 -0.077 0.023
1999-2010 0.207* -0.003 -0.003 -0.010 -0.006 -0.119 -0.206 -0.087
w/r Regression
1947-1979 0.952*** 1.050 -0.007 -0.135 0.036 0.171 -0.109 -0.117 -0.009
1980-2010 1.934*** 0.517 -0.0320*** 0.034 0.023 -0.012 -0.134 -0.077 0.057
1999-2010 2.293* 0.436 -0.025 0.019 -0.010 -0.029 -0.182 -0.206 -0.024
AVERAGE
1947-1979 0.59121 -0.048 0.036 0.084 -0.196 -0.117 0.079
1980-2010 0.41203 0.030 0.023 -0.008 -0.117 -0.077 0.040
1999-2010 0.32155 0.008 -0.010 -0.018 -0.151 -0.206 -0.055

63
63
FIGURES
Figure 1: Share of labor compensation in US national income 1969 to 2013
Figure 2: Share of labor compensation in income (various measures) 1929 to 2014
0.6
0.61
0.62
0.63
0.64
0.65
0.66
0.67
0.68
1969
19
71
1973
19
75
1977
19
79
1981
19
83
1985
19
87
1989
19
91
1993
19
95
1997
19
99
2001
20
03
2005
20
07
2009
20
11
2013
0.45
0.5
0.55
0.6
0.65
0.7
0.75
1929
19
33
1937
19
41
1945
19
49
1953
19
57
1961
19
65
1969
19
73
1977
19
81
1985
19
89
1993
19
97
2001
20
05
2009
20
13
comp/national income
comp/gdp
comp/ndp
comp/nfi

64
64
Figure 3: Depreciation/GDP
Figure 4: Business sector: Output per hour, real compensation, labor share in gross and net value-added, 1969-2013
0.08
0.09
0.1
0.11
0.12
0.13
0.14
0.15
0.16
0.17
1929
19
32
1935
19
38
1941
19
44
1947
19
50
1953
19
56
1959
19
62
1965
19
68
1971
19
74
1977
19
80
1983
19
86
1989
19
92
1995
19
98
2001
20
04
2007
20
10
2013
80
100
120
140
160
180
200
220
240
260
1969
19
71
1973
19
75
1977
19
79
1981
19
83
1985
19
87
1989
19
91
1993
19
95
1997
19
99
2001
20
03
2005
20
07
2009
20
11
2013
NVA/Hour
GVA/hour
RealComp
Prodcomp
shnva
shgva

65
65
Figure 5: Shares in national income
0
0.1
0.2
0.3
0.4
0.5
0.6
0.7
0.8
1969
19
71
1973
19
75
1977
19
79
1981
19
83
1985
19
87
1989
19
91
1993
19
95
1997
19
99
2001
20
03
2005
20
07
2009
20
11
2013
comp/nfi
profits/nfi
other capital

66
66
Figure 6: Labor share in value-added: Total and selected Industries (Jorgenson Data)
Figure 7a: Share of manufacturing in private industry (unrevised data) 1987-2011
0.2
0.3
0.4
0.5
0.6
0.7
0.8
0.9 19
47
1949
19
51
1953
19
55
1957
19
59
1961
19
63
1965
19
67
1969
19
71
1973
19
75
1977
19
79
1981
19
83
1985
19
87
1989
19
91
1993
19
95
1997
19
99
2001
20
03
2005
20
07
2009
Mining and Quarrying
Total Manufacturing
Post and Telecommunications
0
0.05
0.1
0.15
0.2
0.25
0.3
1987
19
88
1989
19
90
1991
19
92
1993
19
94
1995
19
96
1997
19
98
1999
20
00
2001
20
02
2003
20
04
2005
20
06
2007
20
08
2009
20
10
2011
labor compensation
gross surplus
net surplus
current cost net fixed assets
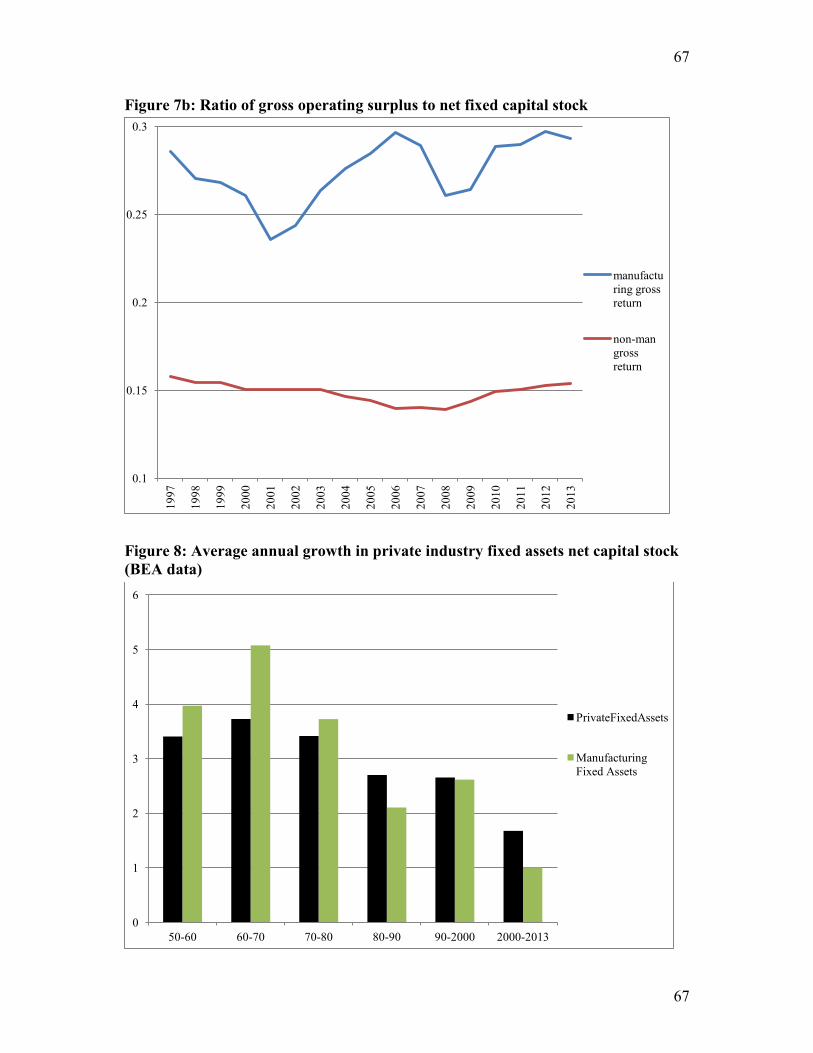
67
67
Figure 7b: Ratio of gross operating surplus to net fixed capital stock
Figure 8: Average annual growth in private industry fixed assets net capital stock (BEA data)
0.1
0.15
0.2
0.25
0.3
1997
1998
1999
2000
2001
2002
2003
2004
2005
2006
2007
2008
2009
2010
2011
2012
2013
manufacturing gross return
non-man gross return
0
1
2
3
4
5
6
50-60 60-70 70-80 80-90 90-2000 2000-2013
PrivateFixedAssets
Manufacturing Fixed Assets

68
68
Figure 9: Ratio of net fixed assets/real output in US manufacturing (BEA data)
Figure 10: Annual change in ratio of net fixed capital stock to full-time equivalent employment (BEA data)
0.8
0.9
1
1.1
1.2
1.3
1.4
1947
19
49
1951
19
53
1955
19
57
1959
19
61
1963
19
65
1967
19
69
1971
19
73
1975
19
77
1979
19
81
1983
19
85
1987
19
89
1991
19
93
1995
19
97
1999
20
01
2003
20
05
2007
20
09
2011
0
0.5
1
1.5
2
2.5
3
3.5
4
4.5
5
1960-1950 1970-1960 1980-1970 1990-1980 2000-1990 2012-2000
Private Industry
Manufacturing
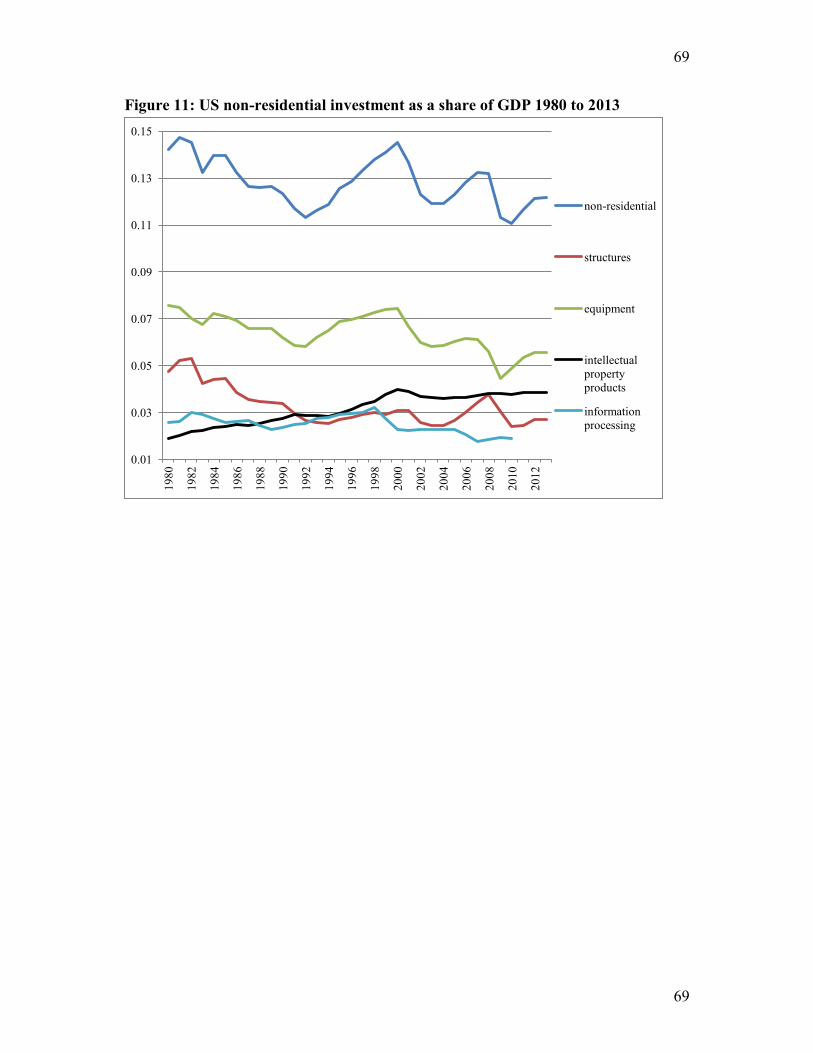
69
69
Figure 11: US non-residential investment as a share of GDP 1980 to 2013
0.01
0.03
0.05
0.07
0.09
0.11
0.13
0.15
1980
1982
1984
1986
1988
1990
1992
1994
1996
1998
2000
2002
2004
2006
2008
2010
2012
non-residential
structures
equipment
intellectual property products
information processing