recall index - stericycle expert solutions | protect ... · report investigates emerging trends...
TRANSCRIPT

1
Q1 2015Recall Index
THE MULTIPLIER EFFECT
2
Multiplier Effect Plagues the Supply Chain
In that light, the Q1 2015 Stericycle Recall Index looks at the multiplier effect, a scenario in which one recall event drastically expands over time multiplying to other manufacturers, products, regulatory bodies and geographic locations. When the same supplier, ingredient or component is utilized across multiple companies and products, the overall impact of a recall is staggering. The complexities of supply chain interdependency become an unfortunate reality that companies must face head on.
The multiplier effect has impacted numerous manufacturers and consumers in recent years and was a top trend in Q1, heavily affecting the food and automotive industries. Despite the significant impact of the multiplier effect on recent recall numbers, more and more companies are taking these challenges seriously by quickly responding to issues and proactively working to enhance levels of internal and supplier product quality.
With highly publicized recalls affecting millions of consumers, the first quarter of 2015 stood out for the rippling effects many of the recalls had throughout the supply chain.
The Stericycle Quarterly Recall Index analyzes cumulative recall data from the CPSC, FDA, NHTSA and USDA. Each quarter, the report investigates emerging trends within the recall industry and includes scorecards with key takeaways in each category.
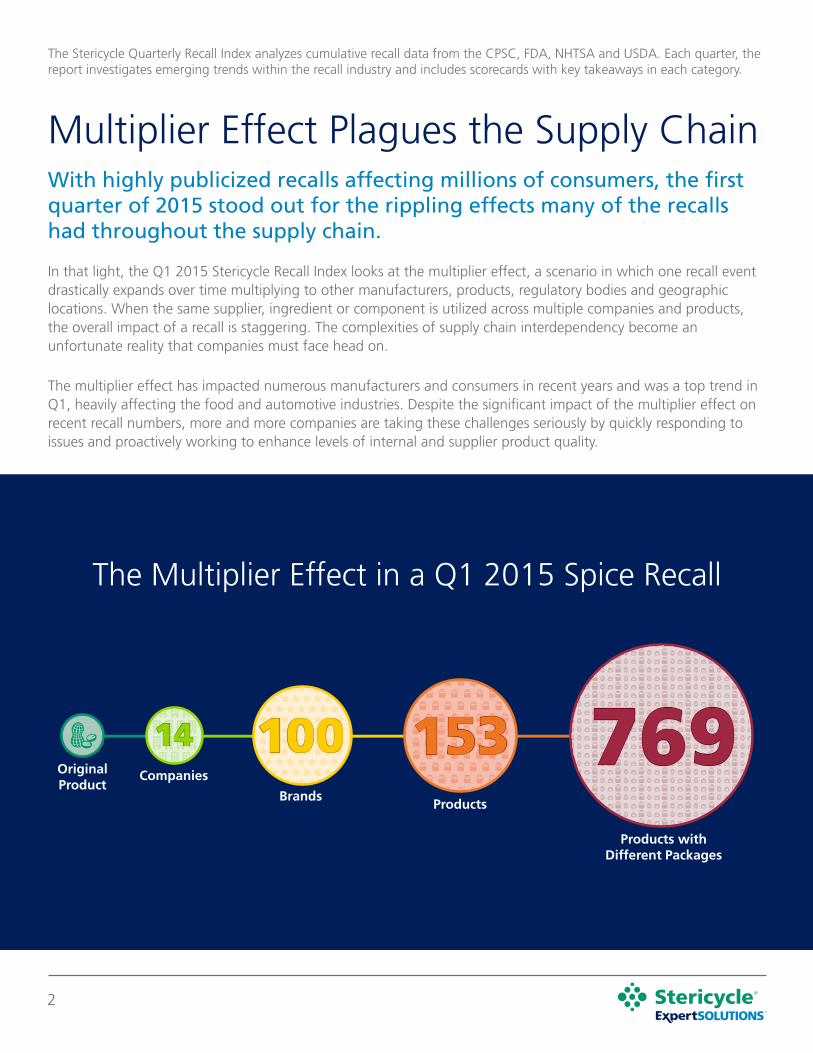
14Original Product
Companies
BrandsProducts
Products with Different Packages
100 153 769
The Multiplier Effect in a Q1 2015 Spice Recall

3© 2015 Stericycle, Inc. | www.stericycleexpertsolutions.com
Food Recalls Boil Over
What’s Hiding in Your Food?
Several high profile food recalls garnered national media coverage, due to the number of people sickened after consuming the products and the number of companies and consumers ultimately affected. This saturated amount of media coverage brought supply chain complexities to light and put additional pressure on regulatory agencies to increase food safety measures and hold companies accountable.
In Q1, the FDA had over 19 million food units recalled, a 40 percent increase from the previous quarter. Implications from several supplier-related product recalls dominated the food industry, showing how one product recall event can have a multiplier effect throughout the supply chain.
Surprisingly, an estimated 200 people die each year as a result of food allergies1. Undeclared allergens are a primary cause of food-related recalls, and stem from product labeling and packaging issues. Three high profile recall events, caused by food allergens and contamination at the end of Q4 2014, largely contributed to the recall spike in Q1 2015. For example, a spice recall, due to undeclared peanut allergens, caused a ripple effect throughout the supply chain in Q1. The recall ultimately affected 14 companies, over 150 products and crossed from FDA to USDA regulated products, a rare occurrence in the industry that essentially doubles the regulatory oversight involved in carrying out a recall.
The recall also contributed to higher than average numbers for undeclared allergens, with 95 percent of Q1 food recalls attributed to this one factor and 91 percent of recalled food units due directly to undeclared nuts/peanuts. With an estimated 15 million Americans having some form of food allergies2, food-related allergic reactions send someone to the emergency room every three minutes, according to Food Allergy Research & Education. These events have caused health officials to call for stricter monitoring of allergens in the U.S. food supply.
Q1 2015 19.4MM
2012-2014 7.4MMAVERAGE PER QUARTER
FDA Food Units Recalled
Recall Index, Q1 2015
1Allergy Facts and Figures | www.aafa.org2Facts and Statistics | www.foodallergy.org

4
Poisonous Outbreaks Spread Like Wildfire
Recall Index, Q1 2015 | Food Recalls Boil Over
Food poisoning outbreaks, such as those caused by listeria, are on the rise in the U.S. In fact, in 2014 four listeria outbreaks multiplied throughout the U.S., the highest number in the 16 year CDC database3.
In Q1, media outlets heavily covered the growing concern over listeria contamination, primarily because several large supplier-related listeria recalls multiplied into dozens of other products. One supplier became the subject of media scrutiny after issuing an apple recall that affected 15.25 million pounds of food and spread through 19 states and Canada. According to the CDC, the contamination eventually hospitalized 34 people, causing seven deaths, three pediatric illnesses, three premature births and one fetal loss. Multiple lawsuits were filed against manufacturers and retailers on behalf of those sickened.
Another supplier recall showed the uniqueness of listeria contamination; unlike other food contaminants, it can survive in cold and frozen foods. The media focused on this aspect as it reported on a frozen spinach recall that quickly multiplied throughout the supply chain. After the supplier issued a recall, eight additional brands recalled 30 products that were sold in retailers across the country.
Evidence that high profile listeria recalls put pressure on regulators also emerged in Q1. Federal prosecutors from the FDA filed a lawsuit seeking to permanently shut down an Illinois company after the FDA traced
a deadly listeria outbreak to the bean sprouts manufacturer. FDA records show the company had repeated problems with listeria contamination in the processing plant and failed to correct them before distributing more tainted food. The outbreak killed two people and sickened at least three others.
Despite prevalent coverage of listeria recalls in the media, there are a number of ways affected companies are proactively responding to these issues, underscoring their ongoing commitment to quality. Some companies have gone so far as to completely shut down their facilities in an effort to help pinpoint the cause of contamination. Other response measures include hiring trained microbiologists, working closely with federal officials to identify contamination causes, improving testing procedures to proactively trace outbreaks, improving employee training on sanitary practices, enhancing equipment sanitation efforts and implementing routine testing of existing procedures.
What is Listeria?
Listeria is a bacterium found in soil, water, decaying vegetation and some animals that causes severe reactions and sickness in affected people. Pregnant women, babies, the elderly and those with compromised immune systems are especially vulnerable to the bacteria.
# of Food Recalls by State
3Record Number of Listeria Outbreaks in 2014 | www.foodpoisoningbulletin.com
5
FSMA Proactively Protecting the Public
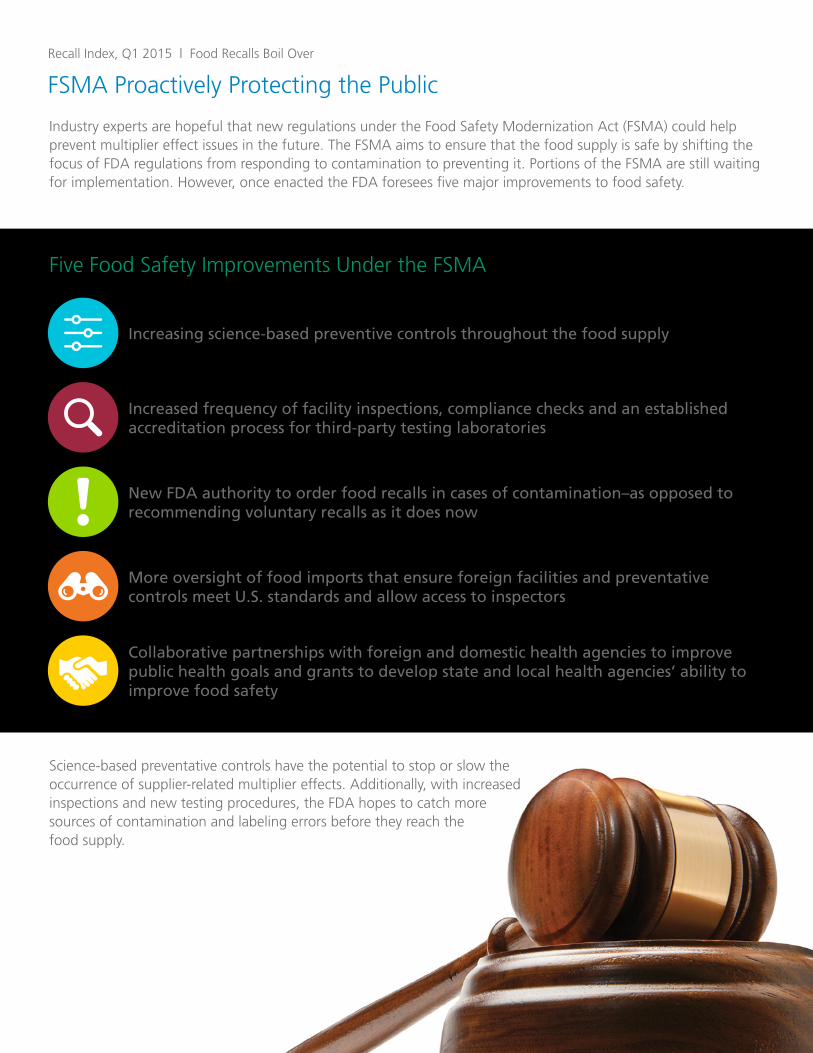
Industry experts are hopeful that new regulations under the Food Safety Modernization Act (FSMA) could help prevent multiplier effect issues in the future. The FSMA aims to ensure that the food supply is safe by shifting the focus of FDA regulations from responding to contamination to preventing it. Portions of the FSMA are still waiting for implementation. However, once enacted the FDA foresees five major improvements to food safety.
Five Food Safety Improvements Under the FSMA
Collaborative partnerships with foreign and domestic health agencies to improve public health goals and grants to develop state and local health agencies’ ability to improve food safety
More oversight of food imports that ensure foreign facilities and preventative controls meet U.S. standards and allow access to inspectors
New FDA authority to order food recalls in cases of contamination–as opposed to recommending voluntary recalls as it does now
Increased frequency of facility inspections, compliance checks and an established accreditation process for third-party testing laboratories
Increasing science-based preventive controls throughout the food supply
Recall Index, Q1 2015 | Food Recalls Boil Over
Science-based preventative controls have the potential to stop or slow the occurrence of supplier-related multiplier effects. Additionally, with increased inspections and new testing procedures, the FDA hopes to catch more sources of contamination and labeling errors before they reach the food supply.
6
Automotive Accelerated Pace Continues
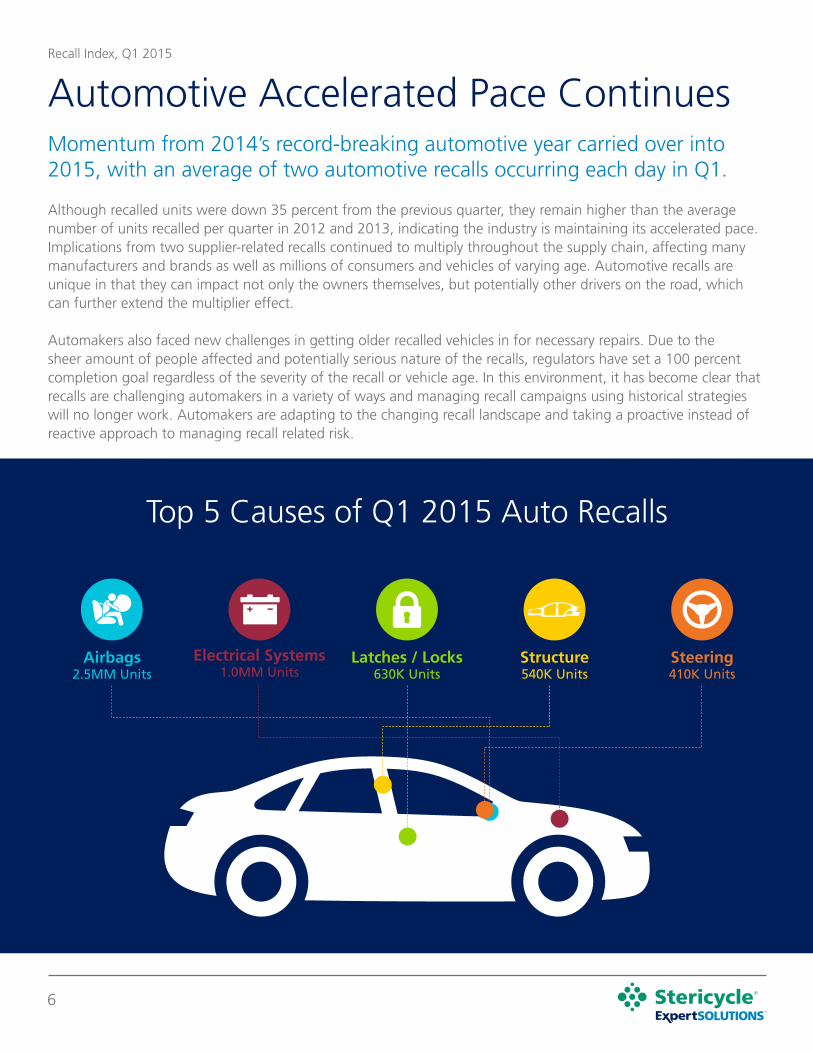
Although recalled units were down 35 percent from the previous quarter, they remain higher than the average number of units recalled per quarter in 2012 and 2013, indicating the industry is maintaining its accelerated pace. Implications from two supplier-related recalls continued to multiply throughout the supply chain, affecting many manufacturers and brands as well as millions of consumers and vehicles of varying age. Automotive recalls are unique in that they can impact not only the owners themselves, but potentially other drivers on the road, which can further extend the multiplier effect.
Automakers also faced new challenges in getting older recalled vehicles in for necessary repairs. Due to the sheer amount of people affected and potentially serious nature of the recalls, regulators have set a 100 percent completion goal regardless of the severity of the recall or vehicle age. In this environment, it has become clear that recalls are challenging automakers in a variety of ways and managing recall campaigns using historical strategies will no longer work. Automakers are adapting to the changing recall landscape and taking a proactive instead of reactive approach to managing recall related risk.
Momentum from 2014’s record-breaking automotive year carried over into 2015, with an average of two automotive recalls occurring each day in Q1.
Top 5 Causes of Q1 2015 Auto Recalls
Airbags2.5MM Units
Electrical Systems1.0MM Units
Latches / Locks630K Units
Structure540K Units
Steering410K Units
Recall Index, Q1 2015

7© 2015 Stericycle, Inc. | www.stericycleexpertsolutions.com
Supplier Recalls Spark Challenges for Automakers
When a single automotive supplier provides the same part to multiple automakers, who in turn use that part in multiple models over time, the overall impact of the multiplier effect is quickly compounded. Recall scale and scope become exacerbated making it even more difficult to solve the problem at hand. The multiplier effect is further complicated by downstream impacts on the supply chain, such as the difficulty manufacturers face with making new parts available when so many units have been affected. In addition, lack of available parts may require automakers to actually execute a recall not once, but twice–one recall to remove the faulty part and another to replace it. Multiple recalls add to the overall cost and create additional complexities when trying to ensure that all customers have completed both steps in the recall process.
As supplier-related recalls have become more prevalent over time, Q1 saw this trend continue with airbags being responsible for 41 percent of NHTSA recalls.
Not only were airbags the number one cause of recalls in 2014, but they continued as the leading cause in Q1 2015. The original recall multiplied and ultimately affected several automakers, dozens of brands and millions of automobile owners.
Another supplier-related recall of ignition switches only affected one manufacturer. However, the event multiplied in the supply chain, ultimately affecting multiple brands and millions of vehicles. This recall also received heavy coverage from the media due to the nature of potential injuries and number of consumers affected. In Q1, electrical systems, which include ignition switches, were responsible for 17 percent of recalled automotive units. Recent high-profile airbag and ignition switch recalls have shown just how complex managing a recall can be with global supply chains. It’s becoming more important now than ever for automakers to determine how to address supply chain constraints and inefficiencies.
Recall Index, Q1 2015 | Automotive Accelerated Pace Continues
Proven Outreach Strategy Drives Completion Rates
100% R
epair R
ate

8
With Age Comes Complexity
The ignition switch event affected vehicle model years as old as 1997, adding complexity to the recall. Automakers face difficulties in recalling models more than three years old because vehicle ownership or contact information may have changed over time, making notification challenging. Additionally, when faced with a recall on their older model car, some owners may not take the recall notice seriously if they haven’t experienced a problem with the car in the past. Other owners may not find the repairs convenient and delay getting recall repairs completed.
Regardless of the model year, NHTSA expects automakers to achieve the same recall completion rates for newer and older cars. To address the problem, automakers must start using a multitude of communication methods to reach owners, including sending letters, emails, using social media and making phone calls to increase recall repair completions. Automakers should also engage owners not just once, but many times to get repairs completed, while at the same time making the process as easy as possible from a consumer perspective.
NHTSA Revs Up the Regulatory Engine
With increasing consumer pressure on regulators and politicians to prevent multiplier effects, NHTSA sought more authority from Congress, while simultaneously flexing their existing authority. In Q1 NHTSA issued over $80 million in fines to automakers.
Under new proposed legislation, NHTSA would have the following capabilities:
Three times the funding
Increased fines from $35 million to $300 million
Ability to stop the sale of vehicles with recalls that increase the likelihood of serious injury or death
Require rental car agencies and used car dealers to repair safety defects before renting or selling recalled vehicles
With regulatory scrutiny and supplier-related issues on the rise, it is critical that automakers are prepared by implementing a recall plan and even testing that plan regularly. In today’s environment, manufacturers need the capability to run multiple outreach campaigns that include multi-faceted touch points over an extended period of time to reach consumers. By providing a recall remedy that is safe, effective and proactive automakers have the opportunity to maintain and enhance brand loyalty.
Recall Index, Q1 2015 | Automotive Accelerated Pace Continues

This dual effect places significant pressure on manufacturers who are typically not prepared to execute long-term, multi-touch point recall campaigns that garner a high degree of regulator interest in completion rates. The sheer nature of a recall event that can drastically expand in scope, complexity and scale in a short amount of time is unsettling to say the least. This reality further underscores that manufacturers will continually be subject to unforeseen impacts on their business and need to be prepared.
As a result, there are a number of steps companies can take to stay ahead of and even help prevent such issues in the future. With government agencies taking a more active role in ensuring quality processes and holding companies accountable, manufacturers should continue to work collaboratively with regulators and leverage industry experts to ensure they stay on top of the latest recall compliance requirements.
The multiplier effect illustrates that supplier-related recall issues and increasing regulatory scrutiny are real, complex challenges that companies across all industries are facing today.
Recall Index, Q1 2015
Extinguishing the Fire
Proactive enforcement of policies to further validate supplier quality, as well as internal quality procedures, will go a long way in helping manufacturers ensure their products meet all regulatory and brand standards. Companies can also look to invest in new technologies that will assist with enhanced quality and sanitation practices, along with bringing in outside experts and expanding employee training.
Ultimately, with legal and financial repercussions lasting up to a decade after a recall, companies cannot afford to be caught off guard when a crisis occurs. It is more important now than ever for manufacturers to be prepared and to know who they can engage with to handle a recall effectively and efficiently. By executing recalls in a compliant and timely manner companies can restore consumer confidence, protect their brand and stay focused on growth.
Preventing the Multiplier Effect
Establish a recall plan
Invest in new technologies
Protectively enforce safety policies
Validate supplier quality
Collaborate with regulators & industry experts

10
NHTSA
Top Causes for NHTSA Recalls
182 NHTSA RECALLS
in Q1 2015 (down 24% from Q4 2014)
Autos contributed 84% to Q1’s total recalled units
40% 58% 54% 41%Airbags
Q2 2014
Electrical Systems
Q3 2014
Airbags
Q4 2014
Airbags
Q1 2015
The Recall Scorecard, Q1 2015
The first three months of 2015 saw a 24 percent decrease in NHTSA-related recalls from the prior quarter, for a total of 182 events. This is the lowest quarter for recall events since Q1 2014.
The amount of affected units in Q1 was also down, dropping by 35 percent from Q4 for a total of 7.2 million. This was the lowest amount of affected units recalled since 2013. However, we are still seeing heightened activity as recalls starting in 2014 have carried over into Q1 of 2015. For example, airbags are still the leading cause of automobile recalls in Q1 2015 and this issue began in Q1 2014.
Additional Index findings include:
• Autos were responsible for 85 percent of Q1’s events, contributing to 84 percent of the quarter’s total recalled units
• Equipment recalls accounted for 15 percent of recalled units in Q1 with 24 recalls impacting over 1.1 million units

11© 2015 Stericycle, Inc. | www.stericycleexpertsolutions.com
FDA
Medical Device (FDA)
In Q1, FDA recalls (comprising pharmaceuticals, medical devices and food) increased by 5 percent from Q4 2014. There were 417 events, impacting over 100 million units. This equates to a 9 percent increase in units from the previous quarter. The trend of geographically distributed and international events continued in Q1. Fifty-five percent of all FDA recalls in the quarter were nationwide, staying consistent with earlier quarters in 2014, and the percentage of global events was also in line with prior quarters at 39 percent.
There were 252 medical device recalls in Q1, an increase of 15 percent from the prior quarter. In addition, the amount of recalled units is almost four times the amount recalled in Q4 2014 and more than the last three quarters combined. This is due to one very large recall impacting more than 50 million units. Sixty percent of medical device recalls affected the U.S. and at least one other country–which along with Q4 2014 is the highest percentage of global recalls in the last two years. Thirty companies experienced two or more events, and one manufacturer had 24 separate recalls in Q1.
The Recall Scorecard, Q1 2015
comprising pharma, medical devices & food in Q1 2015 (up 5% from Q4 2014)
417FDA EVENTS
of FDA recalls were international
39%
of medical devices in Q1 2015252
RECALLS
15% increase in events in Q1 2015 compared to Q4 2014 Units Recalled
Q1 2015
82.5MM
Q4 201423.8MM
4x rise in units

12
9.757.018.7
Pharmaceutical (FDA)In Q1 2015, there were 44 pharmaceutical recalls, down 40 percent from the prior quarter and the lowest quarter tracked since 2012. FDA Enforcement Reports not only documented fewer recalls, but also smaller events. There were only 1.7 million units recalled in Q1, which is significantly less than the 57 million recalled units in Q4 2014. The number of companies affected by a recall also experienced a record low in Q1. Twenty-eight companies were involved in a recall during the quarter, down 39 percent from Q4’s figure.
Additional Index findings include:
• The percentage of nationwide recalls was consistent with prior quarters–at 80 percent, while only 16 percent of Q1 2015 events were global, which is down 10 percent from Q4 2014
• One company had seven separate events, contributing to 16 percent of the quarter’s activity
The Recall Scorecard, Q1 2015
Q1Q3 Q4Q244
PHARMA RECALLS
in Q1 2015 (down 40% from Q4 2014)
of pharmaceutical recalls were nationwide in Q1 2015
80%
PharmaceuticalUnits RecalledIn Millions
The amount of companies involved in recalls was down
39%from Q4 2014
1.7

13© 2015 Stericycle, Inc. | www.stericycleexpertsolutions.com
FDA Food
USDA Food
The FDA food industry saw 121 events in Q1 2015, which is an increase of 15 percent from Q4. The quarter was also up in terms of the number of affected companies, with 114 manufacturers experiencing at least one recall in Q1. The increasing trend continued in the first three months of 2015 as the number of units rose by 40 percent to 19.4 million units recalled.
The quarter also experienced highs in other areas, including:
• Undeclared allergens accounted for 95 percent of recalled units in Q1
• Ninety-six percent of recalled units in Q1 2015 were Class I, due to the rise in undeclared allergen recalls, which presented a significant safety concern for allergic individuals
According to USDA reports, there were 52 recalls of meat, poultry or processed egg products in Q1 2015, up 68 percent from Q4. This equates to the same number of events in the last two quarters combined. However, the amount of recalled pounds dropped by 50 percent in Q1 to just barely over 1 million pounds. Fifty-one companies were impacted by a recall in Q1 2015–the highest number tracked since 2013.
The Recall Scorecard, Q1 2015
Herbs & Spices Vegetables
Grains Fruits
Candy / Dessert Supplements
90% 2%
3% 1%
3% 1%
Top Product Categories Behind FDA Food Events
121FDA Food Recalls
in Q1 2015 (up 15% from Q4 2014)
of recalled units due to undeclared allergens95%
52USDA recalls of meat, poultry or processed egg products in Q1 2015 (up 68% from Q4 2015)
companies were involved in a recall
51

14
CPSCThere were 57 CPSC recalls in Q1 2015, a decrease of seven percent from the prior quarter. Units recalled were also down substantially in Q1 by 57 percent. This was the lowest quarter since Q1 2014 and equated to just under 7 million units.
Top CPSC trends by units in Q1:
• One recall accounted for more than 65 percent of the affected units
• 4.6 million units recalled were safety units
• Burns, entanglement and injury were the leading hazards in Q1 2015
The Recall Scorecard, Q1 2015
Top Product Categories Behind CPSC Events
57CPSC Recalls
in Q1 2015 (down 7% from Q4 2014)
21injuries were reported in Q1 2015 as a result of CPSC recalls, the second lowest quarter since 2000
Safety Products
Personal Use Items Misc. Products
Home Furnishings & FixturesSports / Recreational Activities & Equipment
Heating, Cooling & Ventilating Equipment
Home & Family Maintenance Products
66%
14% 4%
8% 1%
5% 1%

15© 2015 Stericycle, Inc. | www.stericycleexpertsolutions.com
FDA DataTo track trends in food, pharmaceutical, and medical device recalls, the Stericycle Recall Index uses information publicly available in news releases posted on the FDA website. For additional insight into recalls governed by the FDA, Stericycle collects and analyzes data from the agency’s weekly enforcement reports, which provide additional details including recall class, quantity of units affected and number of reported incidents.
CPSC DataFor further insight into consumer product recall trends, Stericycle analyzes data from CPSC recall announcements. When compiling statistics and analyzing trends for consumer product recalls, the Stericycle Recall Index uses standard product categories and hazards recognized by the CPSC.
Stericycle ExpertSOLUTIONS helps partners minimize risk to the public and to their company brand by executing and planning for product recalls efficiently, effectively and compliantly. Each quarter, we analyze cumulative recall data across six product categories. This helps our partners navigate the regulatory environment and identify trends.
A Class I recall, according to the FDA, is a situation in which there is a reasonable probability that the product will cause serious adverse health consequences or death. A Class II recall is a situation in which the product could cause temporary or medically reversible adverse health consequences or where the probability of serious adverse health consequences is remote. The FDA defines a Class III recall as a situation in which the product is not likely to cause adverse health consequences.
How the Stericycle Recall Index is CompiledThe Stericycle Recall Index gathers and tracks cumulative data from the four primary federal agencies that oversee recalls in the United States: the Consumer Product Safety Commission (CPSC), the Food and Drug Administration (FDA), the Food Safety and Inspection Service (FSIS) of the United States Department of Agriculture (USDA), and the National Highway Traffic Safety Administration (NHTSA).
For additional insight into food recall trends involving meat, poultry, and egg products, the Stericycle Recall Index collects and analyzes data from recall announcements posted on the USDA’s FSIS website. Statistics and trends are compiled using standard product categories, classifications, and reasons for recalls as recognized by the USDA.
USDA Data
To understand trends in the automotive industry, the Stericycle Recall Index analyzes data from NHTSA reports on recalls of autos, child seats, equipment and tires.
NHTSA Data
Announced recalls represent those recalls documented in news releases published on agency websites. Enforced recalls refer to those recalls documented in weekly FDA enforcement reports that are summarized based on the FDA assigned Event ID. Their documentation can lag behind announced recalls by weeks or even months because the recall process may take time to complete.
Terminology
Stericycle ExpertSOLUTIONS & the Recall Index Explained