rec jobs outlook research - comres · rec jobs outlook research ... london | sw1p 3ja | t ... how...
TRANSCRIPT

REC JOBS OUTLOOK RESEARCH
METHODOLOGY NOTE
ComRes interviewed 200 UK employees and owners involved in hiring by telephone between September 27th and October 19th 2017.
Data were weighted to be representative of UK adults in employment by region, broad industry sector and public / private split. ComRes
is a member of the British Polling Council and abides by its rules.
For information about commissioning research please contact [email protected] or call +44 (0)20 7871 8670.
REPUTATION | COMMUNICATIONS | PUBLIC POLICY
Four Millbank | London | SW1P 3JA | T. +44 (0)20 7871 8660
Rond-Point Schuman / Schumanplein 6 | Box 5 | 1040 Bruxelles | T. +32 (0)2 234 63 82
51/F Raffles City | No.268 Xi Zang Middle Road | HuangPu District Shanghai | 200001 China | T. +86 (0)21 2312 7674

Jobs Outlook - Wave 19
CATI Fieldwork: 27th September - 19th October 2017Prepared by ComRes
Page 1
Sector ...................................................................................................................................................................................................................................................................................................................................................................................................................................................... 1Base: All respondents
S1. Which region is your organisation based in? ..................................................................................................................................................................................................................................................................................................................................................................................... 2Base: All respondents
S2. Which department do you work in, in your organisation? .................................................................................................................................................................................................................................................................................................................................................................. 4Base: All respondents
S3. Which of the following best describes your level of seniority? .......................................................................................................................................................................................................................................................................................................................................................... 5Base: All respondents
S4. Which of the following, if any, are you involved in as part of your role? ............................................................................................................................................................................................................................................................................................................................................ 6Base: All respondents
D1. How many people are employed or engaged by your organisation at all locations? ........................................................................................................................................................................................................................................................................................................................ 7Base: All respondents
D3. What industry sector does your organisation work in? ...................................................................................................................................................................................................................................................................................................................................................................... 8Base: All respondents
Q1. How much capacity, if any, is there in your organisation to take on more work without creating more jobs in the organisation? ................................................................................................................................................................................................................................................... 11Base: All respondents
Q2. Have you made any of the following changes to your workforce in the past year? ......................................................................................................................................................................................................................................................................................................................... 12Base: All respondents
Q3. Do you think economic conditions in the country as a whole are getting: ........................................................................................................................................................................................................................................................................................................................................ 13Base: All respondents
Q4. In view of the economic conditions, do you/does your organisation expect confidence in hiring and investment decisions to get: ................................................................................................................................................................................................................................................ 14Base: All respondents
Q5_SUM. In which of the following ways, if any, does your organisation recruit permanent members of staff and temporary or contract workers? SUMMARY TABLE ............................................................................................................................................................................................ 15Base: All respondents
Q5_SUM. In which of the following ways, if any, does your organisation recruit permanent members of staff and temporary or contract workers? SUMMARY TABLE ............................................................................................................................................................................................ 16Base: All who have recruited this type of staff before
Q5_1. In which of the following ways, if any, does your organisation recruit permanent members of staff and temporary or contract workers? Permanent members of staff .................................................................................................................................................................................... 17Base: All respondents
Q5_2. In which of the following ways, if any, does your organisation recruit permanent members of staff and temporary or contract workers? Temporary or contract workers ................................................................................................................................................................................ 19Base: All respondents
Q5_1. In which of the following ways, if any, does your organisation recruit permanent members of staff and temporary or contract workers? Permanent members of staff .................................................................................................................................................................................... 21Base: All who have recruited this type of staff before
Q5_2. In which of the following ways, if any, does your organisation recruit permanent members of staff and temporary or contract workers? Temporary or contract workers ................................................................................................................................................................................ 23Base: All who have recruited this type of staff before
Q6. How satisfied or dissatisfied are you with the quality of candidates presented to you by your recruitment agencies? .................................................................................................................................................................................................................................................................... 25Base: All who use recruitment agencies
Q7. How satisfied or dissatisfied are you overall with the recruitment agencies you have used in the last 2 years? ............................................................................................................................................................................................................................................................................. 26Base: All who use recruitment agencies
Q8_1. Which of the following job functions, if any, are you involved in recruiting for permanent members of staff and temporary agency workers? Permanent members of staff ............................................................................................................................................................................. 27Base: All who recruit permanent members of staff
Q8_2. Which of the following job functions, if any, are you involved in recruiting for permanent members of staff and temporary agency workers? Temporary agency workers .............................................................................................................................................................................. 29Base: All who recruit temporary agency workers
Q10_SUM. Which job functions in your organisation, if any, do you think will see an increase or decrease of permanent members of staff in the next three months? SUMMARY TABLE .............................................................................................................................................................. 31Base: All who recruit permanent members of staff in each job function

Jobs Outlook - Wave 19
CATI Fieldwork: 27th September - 19th October 2017Prepared by ComRes
Page 1
Q10_SUM. Average across all sectors (response based) SUMMARY TABLE ...................................................................................................................................................................................................................................................................................................................................... 32Base: All who recruit permanent members of staff in each job function
Q10_1. Which job functions in your organisation, if any, do you think will see an increase or decrease of permanent members of staff in the next three months? Accounting and financial services ............................................................................................................................................. 33Base: All who recruit permanent members of staff in each job function
Q10_2. Which job functions in your organisation, if any, do you think will see an increase or decrease of permanent members of staff in the next three months? Construction .............................................................................................................................................................................. 34Base: All who recruit permanent members of staff in each job function
Q10_3. Which job functions in your organisation, if any, do you think will see an increase or decrease of permanent members of staff in the next three months? Drivers ....................................................................................................................................................................................... 35Base: All who recruit permanent members of staff in each job function
Q10_4. Which job functions in your organisation, if any, do you think will see an increase or decrease of permanent members of staff in the next three months? Education ................................................................................................................................................................................... 36Base: All who recruit permanent members of staff in each job function
Q10_5. Which job functions in your organisation, if any, do you think will see an increase or decrease of permanent members of staff in the next three months? Engineering & technical ............................................................................................................................................................. 37Base: All who recruit permanent members of staff in each job function
Q10_6. Which job functions in your organisation, if any, do you think will see an increase or decrease of permanent members of staff in the next three months? Executive recruitment / interim management ............................................................................................................................ 38Base: All who recruit permanent members of staff in each job function
Q10_7. Which job functions in your organisation, if any, do you think will see an increase or decrease of permanent members of staff in the next three months? Health & social care ................................................................................................................................................................... 39Base: All who recruit permanent members of staff in each job function
Q10_8. Which job functions in your organisation, if any, do you think will see an increase or decrease of permanent members of staff in the next three months? Hospitality .................................................................................................................................................................................. 40Base: All who recruit permanent members of staff in each job function
Q10_9. Which job functions in your organisation, if any, do you think will see an increase or decrease of permanent members of staff in the next three months? Industrial .................................................................................................................................................................................... 41Base: All who recruit permanent members of staff in each job function
Q10_10. Which job functions in your organisation, if any, do you think will see an increase or decrease of permanent members of staff in the next three months? Legal & HR .............................................................................................................................................................................. 42Base: All who recruit permanent members of staff in each job function
Q10_11. Which job functions in your organisation, if any, do you think will see an increase or decrease of permanent members of staff in the next three months? Life sciences ............................................................................................................................................................................ 43Base: All who recruit permanent members of staff in each job function
Q10_12. Which job functions in your organisation, if any, do you think will see an increase or decrease of permanent members of staff in the next three months? Marketing, media & creative .................................................................................................................................................... 44Base: All who recruit permanent members of staff in each job function
Q10_13. Which job functions in your organisation, if any, do you think will see an increase or decrease of permanent members of staff in the next three months? Office professionals ................................................................................................................................................................. 45Base: All who recruit permanent members of staff in each job function
Q10_14. Which job functions in your organisation, if any, do you think will see an increase or decrease of permanent members of staff in the next three months? Sales & retail ........................................................................................................................................................................... 46Base: All who recruit permanent members of staff in each job function
Q10_15. Which job functions in your organisation, if any, do you think will see an increase or decrease of permanent members of staff in the next three months? Technology .............................................................................................................................................................................. 47Base: All who recruit permanent members of staff in each job function
Q11_SUM. Which job functions in your organisation, if any, do you think will see an increase or decrease of permanent members of staff in the next four to twelve months? SUMMARY TABLE ................................................................................................................................................. 48Base: All who recruit permanent members of staff in each job function
Q11_SUM. Average across all sectors (response based) SUMMARY TABLE ...................................................................................................................................................................................................................................................................................................................................... 49Base: All who recruit permanent members of staff in each job function
Q11_1. Which job functions in your organisation, if any, do you think will see an increase or decrease of permanent members of staff in the next four to twelve months? Accounting and financial services ................................................................................................................................ 50Base: All who recruit permanent members of staff in each job function
Q11_2. Which job functions in your organisation, if any, do you think will see an increase or decrease of permanent members of staff in the next four to twelve months? Construction ................................................................................................................................................................. 51Base: All who recruit permanent members of staff in each job function
Q11_3. Which job functions in your organisation, if any, do you think will see an increase or decrease of permanent members of staff in the next four to twelve months? Drivers .......................................................................................................................................................................... 52Base: All who recruit permanent members of staff in each job function
Q11_4. Which job functions in your organisation, if any, do you think will see an increase or decrease of permanent members of staff in the next four to twelve months? Education ..................................................................................................................................................................... 53Base: All who recruit permanent members of staff in each job function
Q11_5. Which job functions in your organisation, if any, do you think will see an increase or decrease of permanent members of staff in the next four to twelve months? Engineering & technical ................................................................................................................................................ 54Base: All who recruit permanent members of staff in each job function

Jobs Outlook - Wave 19
CATI Fieldwork: 27th September - 19th October 2017Prepared by ComRes
Page 1
Q11_6. Which job functions in your organisation, if any, do you think will see an increase or decrease of permanent members of staff in the next four to twelve months? Executive recruitment / interim management ............................................................................................................... 55Base: All who recruit permanent members of staff in each job function
Q11_7. Which job functions in your organisation, if any, do you think will see an increase or decrease of permanent members of staff in the next four to twelve months? Health & social care ..................................................................................................................................................... 56Base: All who recruit permanent members of staff in each job function
Q11_8. Which job functions in your organisation, if any, do you think will see an increase or decrease of permanent members of staff in the next four to twelve months? Hospitality ..................................................................................................................................................................... 57Base: All who recruit permanent members of staff in each job function
Q11_9. Which job functions in your organisation, if any, do you think will see an increase or decrease of permanent members of staff in the next four to twelve months? Industrial ....................................................................................................................................................................... 58Base: All who recruit permanent members of staff in each job function
Q11_10. Which job functions in your organisation, if any, do you think will see an increase or decrease of permanent members of staff in the next four to twelve months? Legal & HR ................................................................................................................................................................. 59Base: All who recruit permanent members of staff in each job function
Q11_11. Which job functions in your organisation, if any, do you think will see an increase or decrease of permanent members of staff in the next four to twelve months? Life sciences ............................................................................................................................................................... 60Base: All who recruit permanent members of staff in each job function
Q11_12. Which job functions in your organisation, if any, do you think will see an increase or decrease of permanent members of staff in the next four to twelve months? Marketing, media & creative ....................................................................................................................................... 61Base: All who recruit permanent members of staff in each job function
Q11_13. Which job functions in your organisation, if any, do you think will see an increase or decrease of permanent members of staff in the next four to twelve months? Office professionals .................................................................................................................................................... 62Base: All who recruit permanent members of staff in each job function
Q11_14. Which job functions in your organisation, if any, do you think will see an increase or decrease of permanent members of staff in the next four to twelve months? Sales & retail .............................................................................................................................................................. 63Base: All who recruit permanent members of staff in each job function
Q11_15. Which job functions in your organisation, if any, do you think will see an increase or decrease of permanent members of staff in the next four to twelve months? Technology ................................................................................................................................................................. 64Base: All who recruit permanent members of staff in each job function
Q12. In which, if any, of these job functions do you expect to find a shortage of appropriate candidates for permanent roles? ........................................................................................................................................................................................................................................................... 65Base: All who recruit permanent members of staff in each job function
Q14_SUM. Which job functions in your organisation, if any, do you think will see an increase or decrease in the number of temporary agency workers in the next three months? SUMMARY TABLE ......................................................................................................................................... 67Base: All who recruit temporary agency workers in each job function
Q14_SUM. Average across all sectors SUMMARY TABLE ................................................................................................................................................................................................................................................................................................................................................................... 68Base: All who recruit temporary agency workers in each job function
Q14_1. Which job functions in your organisation, if any, do you think will see an increase or decrease in the number of temporary agency workers in the next three months? Accounting and financial services ......................................................................................................................... 69Base: All who recruit temporary agency workers in each job function
Q14_2. Which job functions in your organisation, if any, do you think will see an increase or decrease in the number of temporary agency workers in the next three months? Construction .......................................................................................................................................................... 70Base: All who recruit temporary agency workers in each job function
Q14_3. Which job functions in your organisation, if any, do you think will see an increase or decrease in the number of temporary agency workers in the next three months? Drivers ................................................................................................................................................................... 71Base: All who recruit temporary agency workers in each job function
Q14_4. Which job functions in your organisation, if any, do you think will see an increase or decrease in the number of temporary agency workers in the next three months? Education .............................................................................................................................................................. 72Base: All who recruit temporary agency workers in each job function
Q14_5. Which job functions in your organisation, if any, do you think will see an increase or decrease in the number of temporary agency workers in the next three months? Engineering & technical ........................................................................................................................................ 73Base: All who recruit temporary agency workers in each job function
Q14_6. Which job functions in your organisation, if any, do you think will see an increase or decrease in the number of temporary agency workers in the next three months? Executive recruitment / interim management ........................................................................................................ 74Base: All who recruit temporary agency workers in each job function
Q14_7. Which job functions in your organisation, if any, do you think will see an increase or decrease in the number of temporary agency workers in the next three months? Health & social care .............................................................................................................................................. 75Base: All who recruit temporary agency workers in each job function
Q14_8. Which job functions in your organisation, if any, do you think will see an increase or decrease in the number of temporary agency workers in the next three months? Hospitality .............................................................................................................................................................. 76Base: All who recruit temporary agency workers in each job function
Q14_9. Which job functions in your organisation, if any, do you think will see an increase or decrease in the number of temporary agency workers in the next three months? Industrial ................................................................................................................................................................ 77Base: All who recruit temporary agency workers in each job function
Q14_10. Which job functions in your organisation, if any, do you think will see an increase or decrease in the number of temporary agency workers in the next three months? Legal & HR .......................................................................................................................................................... 78Base: All who recruit temporary agency workers in each job function
Jobs Outlook - Wave 19
CATI Fieldwork: 27th September - 19th October 2017Prepared by ComRes
Page 1
Q14_11. Which job functions in your organisation, if any, do you think will see an increase or decrease in the number of temporary agency workers in the next three months? Life sciences ....................................................................................................................................................... 79Base: All who recruit temporary agency workers in each job function
Q14_12. Which job functions in your organisation, if any, do you think will see an increase or decrease in the number of temporary agency workers in the next three months? Marketing, media & creative ................................................................................................................................ 80Base: All who recruit temporary agency workers in each job function
Q14_13. Which job functions in your organisation, if any, do you think will see an increase or decrease in the number of temporary agency workers in the next three months? Office professionals ............................................................................................................................................. 81Base: All who recruit temporary agency workers in each job function
Q14_14. Which job functions in your organisation, if any, do you think will see an increase or decrease in the number of temporary agency workers in the next three months? Sales & retail ....................................................................................................................................................... 82Base: All who recruit temporary agency workers in each job function
Q14_15. Which job functions in your organisation, if any, do you think will see an increase or decrease in the number of temporary agency workers in the next three months? Technology .......................................................................................................................................................... 83Base: All who recruit temporary agency workers in each job function
Q15_SUM. Which job functions in your organisation, if any, do you think will see an increase or decrease in the number of temporary agency workers in the next four to twelve months? SUMMARY TABLE ............................................................................................................................ 84Base: All who recruit temporary agency workers in each job function
Q15_SUM. Average across all sectors SUMMARY TABLE ................................................................................................................................................................................................................................................................................................................................................................... 85Base: All who recruit temporary agency workers in each job function
Q15_1. Which job functions in your organisation, if any, do you think will see an increase or decrease in the number of temporary agency workers in the next four to twelve months? Accounting and financial services ............................................................................................................ 86Base: All who recruit temporary agency workers in each job function
Q15_2. Which job functions in your organisation, if any, do you think will see an increase or decrease in the number of temporary agency workers in the next four to twelve months? Construction ............................................................................................................................................. 87Base: All who recruit temporary agency workers in each job function
Q15_3. Which job functions in your organisation, if any, do you think will see an increase or decrease in the number of temporary agency workers in the next four to twelve months? Drivers ...................................................................................................................................................... 88Base: All who recruit temporary agency workers in each job function
Q15_4. Which job functions in your organisation, if any, do you think will see an increase or decrease in the number of temporary agency workers in the next four to twelve months? Education ................................................................................................................................................. 89Base: All who recruit temporary agency workers in each job function
Q15_5. Which job functions in your organisation, if any, do you think will see an increase or decrease in the number of temporary agency workers in the next four to twelve months? Engineering & technical ........................................................................................................................... 90Base: All who recruit temporary agency workers in each job function
Q15_6. Which job functions in your organisation, if any, do you think will see an increase or decrease in the number of temporary agency workers in the next four to twelve months? Executive recruitment / interim management ........................................................................................... 91Base: All who recruit temporary agency workers in each job function
Q15_7. Which job functions in your organisation, if any, do you think will see an increase or decrease in the number of temporary agency workers in the next four to twelve months? Health & social care ................................................................................................................................. 92Base: All who recruit temporary agency workers in each job function
Q15_8. Which job functions in your organisation, if any, do you think will see an increase or decrease in the number of temporary agency workers in the next four to twelve months? Hospitality ................................................................................................................................................ 93Base: All who recruit temporary agency workers in each job function
Q15_9. Which job functions in your organisation, if any, do you think will see an increase or decrease in the number of temporary agency workers in the next four to twelve months? Industrial .................................................................................................................................................. 94Base: All who recruit temporary agency workers in each job function
Q15_10. Which job functions in your organisation, if any, do you think will see an increase or decrease in the number of temporary agency workers in the next four to twelve months? Legal & HR ............................................................................................................................................. 95Base: All who recruit temporary agency workers in each job function
Q15_11. Which job functions in your organisation, if any, do you think will see an increase or decrease in the number of temporary agency workers in the next four to twelve months? Life sciences .......................................................................................................................................... 96Base: All who recruit temporary agency workers in each job function
Q15_12. Which job functions in your organisation, if any, do you think will see an increase or decrease in the number of temporary agency workers in the next four to twelve months? Marketing, media & creative .................................................................................................................. 97Base: All who recruit temporary agency workers in each job function
Q15_13. Which job functions in your organisation, if any, do you think will see an increase or decrease in the number of temporary agency workers in the next four to twelve months? Office professionals ............................................................................................................................... 98Base: All who recruit temporary agency workers in each job function
Q15_14. Which job functions in your organisation, if any, do you think will see an increase or decrease in the number of temporary agency workers in the next four to twelve months? Sales & retail .......................................................................................................................................... 99Base: All who recruit temporary agency workers in each job function
Q15_15. Which job functions in your organisation, if any, do you think will see an increase or decrease in the number of temporary agency workers in the next four to twelve months? Technology ........................................................................................................................................... 100Base: All who recruit temporary agency workers in each job function
Q16. In which, if any, of these job functions do you expect to find a shortage of appropriate candidates for temporary agency worker roles? ................................................................................................................................................................................................................................... 101Base: All who recruit temporary agency workers in each job function

Jobs Outlook - Wave 19
CATI Fieldwork: 27th September - 19th October 2017Prepared by ComRes
Page 1
Q17_SUM. How important or otherwise are each of the following factors to you when it comes to choosing and using a recruitment agency to source temporary agency workers? Please rate each factor on a scale from 1 to 5, where 1 means not at all important and 5 meansvery important. SUMMARY TABLE ..................................................................................................................................................................................................................................................................................................................................................................................................... 103Base: All who recruit temporary agency workers
Q17_1. How important or otherwise are each of the following factors to you when it comes to choosing and using a recruitment agency to source temporary agency workers? Please rate each factor on a scale from 1 to 5, where 1 means not at all important and 5 means veryimportant. Price/Costs of the workers .................................................................................................................................................................................................................................................................................................................................................................................................. 104Base: All who recruit temporary agency workers
Q17_2. How important or otherwise are each of the following factors to you when it comes to choosing and using a recruitment agency to source temporary agency workers? Please rate each factor on a scale from 1 to 5, where 1 means not at all important and 5 means veryimportant. Quality of service ................................................................................................................................................................................................................................................................................................................................................................................................................ 105Base: All who recruit temporary agency workers
Q17_3. How important or otherwise are each of the following factors to you when it comes to choosing and using a recruitment agency to source temporary agency workers? Please rate each factor on a scale from 1 to 5, where 1 means not at all important and 5 means veryimportant. Brand image of the agency ................................................................................................................................................................................................................................................................................................................................................................................................. 106Base: All who recruit temporary agency workers
Q17_4. How important or otherwise are each of the following factors to you when it comes to choosing and using a recruitment agency to source temporary agency workers? Please rate each factor on a scale from 1 to 5, where 1 means not at all important and 5 means veryimportant. Expertise of the agency, in terms of regions and sectors covered ..................................................................................................................................................................................................................................................................................................................................... 107Base: All who recruit temporary agency workers
Q17_5. How important or otherwise are each of the following factors to you when it comes to choosing and using a recruitment agency to source temporary agency workers? Please rate each factor on a scale from 1 to 5, where 1 means not at all important and 5 means veryimportant. Management information provided ..................................................................................................................................................................................................................................................................................................................................................................................... 108Base: All who recruit temporary agency workers
Q17_6. How important or otherwise are each of the following factors to you when it comes to choosing and using a recruitment agency to source temporary agency workers? Please rate each factor on a scale from 1 to 5, where 1 means not at all important and 5 means veryimportant. Membership of a trade of professional organisation ........................................................................................................................................................................................................................................................................................................................................................... 109Base: All who recruit temporary agency workers
Q17_7. How important or otherwise are each of the following factors to you when it comes to choosing and using a recruitment agency to source temporary agency workers? Please rate each factor on a scale from 1 to 5, where 1 means not at all important and 5 means veryimportant. Other ................................................................................................................................................................................................................................................................................................................................................................................................................................... 110Base: All who recruit temporary agency workers
Q18_SUM. How important or otherwise would you say that temporary agency workers are for your organisation for each of the following? Rate on a scale from 1 to 5, where 1 means not at all important and 5 means very important. SUMMARY TABLE ................................................. 111Base: All who recruit temporary agency workers
Q18_1. How important or otherwise would you say that temporary agency workers are for your organisation for each of the following? Rate on a scale from 1 to 5, where 1 means not at all important and 5 means very important. Meeting peaks in demand at certain times ofyear (seasonality) .................................................................................................................................................................................................................................................................................................................................................................................................................................. 112Base: All who recruit temporary agency workers
Q18_2. How important or otherwise would you say that temporary agency workers are for your organisation for each of the following? Rate on a scale from 1 to 5, where 1 means not at all important and 5 means very important. Responding to growth, as new customers arewon ........................................................................................................................................................................................................................................................................................................................................................................................................................................................ 113Base: All who recruit temporary agency workers
Q18_3. How important or otherwise would you say that temporary agency workers are for your organisation for each of the following? Rate on a scale from 1 to 5, where 1 means not at all important and 5 means very important. Managing fast changing organisationalrequirements .......................................................................................................................................................................................................................................................................................................................................................................................................................................... 114Base: All who recruit temporary agency workers
Q18_4. How important or otherwise would you say that temporary agency workers are for your organisation for each of the following? Rate on a scale from 1 to 5, where 1 means not at all important and 5 means very important. Covering short term staff leave or absences ................. 115Base: All who recruit temporary agency workers
Q18_5. How important or otherwise would you say that temporary agency workers are for your organisation for each of the following? Rate on a scale from 1 to 5, where 1 means not at all important and 5 means very important. Helping to keep running costs down ............................. 116Base: All who recruit temporary agency workers
Q18_6. How important or otherwise would you say that temporary agency workers are for your organisation for each of the following? Rate on a scale from 1 to 5, where 1 means not at all important and 5 means very important. Managing uncertainty during economicdownturn or at other times ..................................................................................................................................................................................................................................................................................................................................................................................................................... 117Base: All who recruit temporary agency workers
Q18_7. How important or otherwise would you say that temporary agency workers are for your organisation for each of the following? Rate on a scale from 1 to 5, where 1 means not at all important and 5 means very important. Providing short term access to key strategicskills ....................................................................................................................................................................................................................................................................................................................................................................................................................................................... 118Base: All who recruit temporary agency workers
Q19. In terms of temporary agency workers' pay rates, would you say that: ........................................................................................................................................................................................................................................................................................................................................ 119Base: All who recruit temporary agency workers
Q20. Approximately what percentage of the temporary workers you use go on to become permanent members of your staff each year? ......................................................................................................................................................................................................................................... 120Base: All who recruit temporary workers
T1. The government is due to announce the budget in November of this year. If the Chancellor introduces new measures which may add payroll costs to your business (for example, like when Pension Auto Enrolment was introduced), which of the following actions, if any,

Jobs Outlook - Wave 19
CATI Fieldwork: 27th September - 19th October 2017Prepared by ComRes
Page 1
would your business take? .................................................................................................................................................................................................................................................................................................................................................................................................................... 121Base: Wave 20

Table 1/1
Jobs Outlook - Wave 19SectorBase: All respondents
REGION SIZE SECTOR
Total North MidlandsSouth excluding
LondonSouth including
London London Other 0-49 50-249 250+ Private PublicSignificance Level: 95% a b c d e *f g h i j k
Unweighted Total 200 43 49 45 79 34 29 114 40 46 165 35
Weighted Total 200 44 48 45 78 34 30 116 40 44 165 35100.0% 100.0% 100.0% 100.0% 100.0% 100.0% 100.0% 100.0% 100.0% 100.0% 100.0% 100.0%
Private 165 40 43 32 60 28 22 96 32 37 165 -82.4% 91.2% 88.7% 72.0% 77.0% 83.8% 73.3% 82.4% 81.6% 83.2% 100.0% -
c c k
Public 35 4 5 13 18 5 8 20 7 7 - 3517.6% 8.8% 11.3% 28.0% 23.0% 16.2% 26.7% 17.6% 18.4% 16.8% - 100.0%
ab j
Columns Tested: a,b,c,d,e,f - g,h,i - j,k
CATI Fieldwork: 27th September - 19th October 2017 Prepared by ComRes Page 1

Table 2/1
Jobs Outlook - Wave 19S1. Which region is your organisation based in?Base: All respondents
REGION SIZE SECTOR
Total North MidlandsSouth excluding
LondonSouth including
London London Other 0-49 50-249 250+ Private PublicSignificance Level: 95% a b c d e *f g h i j k
Unweighted Total 200 43 49 45 79 34 29 114 40 46 165 35
Weighted Total 200 44 48 45 78 34 30 116 40 44 165 35100.0% 100.0% 100.0% 100.0% 100.0% 100.0% 100.0% 100.0% 100.0% 100.0% 100.0% 100.0%
South West 17 - - 17 17 - - 5 7 5 11 68.4% - - 37.5% 21.4% - - 4.7% 16.6% 10.7% 6.4% 17.8%
abe abe g j
South East 28 - - 28 28 - - 17 4 6 22 614.0% - - 62.5% 35.7% - - 14.8% 11.2% 14.4% 13.2% 17.8%
abde abe
London 34 - - - 34 34 - 23 4 7 28 516.8% - - - 42.9% 100.0% - 19.7% 9.7% 15.5% 17.1% 15.5%
abc abcd
East of England 18 - 18 - - - - 11 5 3 16 39.2% - 38.2% - - - - 9.3% 12.0% 6.3% 9.5% 7.8%
acde
West Midlands 16 - 16 - - - - 9 3 5 15 28.2% - 34.0% - - - - 7.6% 7.4% 10.5% 8.9% 5.0%
acde
East Midlands 13 - 13 - - - - 9 2 2 12 16.7% - 27.8% - - - - 8.0% 5.4% 4.5% 7.6% 2.6%
acde
North West 21 21 - - - - - 14 4 4 21 110.7% 48.8% - - - - - 11.9% 9.7% 8.5% 12.5% 2.4%
bcde
North East 7 7 - - - - - 5 - 1 6 13.4% 15.5% - - - - - 4.7% - 3.2% 3.4% 3.6%
bcde
Yorkshire & The Humber 16 16 - - - - - 7 4 4 14 27.8% 35.6% - - - - - 6.1% 10.9% 9.5% 8.4% 4.9%
bcde
Scotland 16 - - - - - 16 9 6 2 11 58.1% - - - - - 54.7% 7.5% 14.3% 4.1% 6.5% 15.5%
Wales 8 - - - - - 8 4 1 3 8 -4.2% - - - - - 28.4% 3.6% 2.7% 7.1% 5.1% -
Northern Ireland 5 - - - - - 5 3 - 3 3 22.5% - - - - - 16.9% 2.2% - 5.7% 1.6% 6.9%
Columns Tested: a,b,c,d,e,f - g,h,i - j,k
CATI Fieldwork: 27th September - 19th October 2017 Prepared by ComRes Page 2

Table 2/2
Jobs Outlook - Wave 19S1. Which region is your organisation based in?Base: All respondents
REGION SIZE SECTOR
Total North MidlandsSouth excluding
LondonSouth including
London London Other 0-49 50-249 250+ Private PublicSignificance Level: 95% a b c d e *f g h i j k
Unweighted Total 200 43 49 45 79 34 29 114 40 46 165 35
Weighted Total 200 44 48 45 78 34 30 116 40 44 165 35100.0% 100.0% 100.0% 100.0% 100.0% 100.0% 100.0% 100.0% 100.0% 100.0% 100.0% 100.0%
Channel Islands - - - - - - - - - - - -- - - - - - - - - - - -
None of the above - - - - - - - - - - - -- - - - - - - - - - - -
Columns Tested: a,b,c,d,e,f - g,h,i - j,k
CATI Fieldwork: 27th September - 19th October 2017 Prepared by ComRes Page 3

Table 3/1
Jobs Outlook - Wave 19S2. Which department do you work in, in your organisation?Base: All respondents
REGION SIZE SECTOR
Total North MidlandsSouth excluding
LondonSouth including
London London Other 0-49 50-249 250+ Private PublicSignificance Level: 95% a b c d e *f g h i j k
Unweighted Total 200 43 49 45 79 34 29 114 40 46 165 35
Weighted Total 200 44 48 45 78 34 30 116 40 44 165 35100.0% 100.0% 100.0% 100.0% 100.0% 100.0% 100.0% 100.0% 100.0% 100.0% 100.0% 100.0%
HR 90 19 19 23 38 15 14 29 22 39 70 2044.9% 42.3% 40.2% 51.4% 48.2% 44.0% 47.5% 24.6% 54.8% 89.4% 42.3% 57.1%
g gh
Other 110 25 29 22 41 19 16 88 18 5 95 1555.1% 57.7% 59.8% 48.6% 51.8% 56.0% 52.5% 75.4% 45.2% 10.6% 57.7% 42.9%
hi i
Columns Tested: a,b,c,d,e,f - g,h,i - j,k
CATI Fieldwork: 27th September - 19th October 2017 Prepared by ComRes Page 4

Table 4/1
Jobs Outlook - Wave 19S3. Which of the following best describes your level of seniority?Base: All respondents
REGION SIZE SECTOR
Total North MidlandsSouth excluding
LondonSouth including
London London Other 0-49 50-249 250+ Private PublicSignificance Level: 95% a b c d e *f g h i j k
Unweighted Total 200 43 49 45 79 34 29 114 40 46 165 35
Weighted Total 200 44 48 45 78 34 30 116 40 44 165 35100.0% 100.0% 100.0% 100.0% 100.0% 100.0% 100.0% 100.0% 100.0% 100.0% 100.0% 100.0%
Senior management/ board level 89 22 19 17 34 17 14 66 10 12 76 1344.5% 50.3% 39.1% 38.4% 43.6% 50.6% 47.1% 57.0% 26.4% 27.9% 45.9% 37.9%
hi
Management 71 12 23 16 28 12 9 36 17 18 59 1235.4% 26.7% 46.7% 35.3% 35.2% 35.0% 30.3% 30.9% 42.9% 40.4% 35.7% 33.8%
Non-Managerial 40 10 7 12 17 5 7 14 12 14 30 1020.1% 23.0% 14.1% 26.4% 21.2% 14.4% 22.5% 12.1% 30.7% 31.7% 18.3% 28.3%
g g
Columns Tested: a,b,c,d,e,f - g,h,i - j,k
CATI Fieldwork: 27th September - 19th October 2017 Prepared by ComRes Page 5

Table 5/1
Jobs Outlook - Wave 19S4. Which of the following, if any, are you involved in as part of your role?Base: All respondents
REGION SIZE SECTOR
Total North MidlandsSouth excluding
LondonSouth including
London London Other 0-49 50-249 250+ Private PublicSignificance Level: 95% a b c d e *f g h i j k
Unweighted Total 200 43 49 45 79 34 29 114 40 46 165 35
Weighted Total 200 44 48 45 78 34 30 116 40 44 165 35100.0% 100.0% 100.0% 100.0% 100.0% 100.0% 100.0% 100.0% 100.0% 100.0% 100.0% 100.0%
Recruitment (hiring or engaging new staffon a permanent or temporarybasis)
200 44 48 45 78 34 30 116 40 44 165 35100.0% 100.0% 100.0% 100.0% 100.0% 100.0% 100.0% 100.0% 100.0% 100.0% 100.0% 100.0%
Training of employees 142 30 34 33 56 24 23 88 28 26 119 2471.2% 68.2% 69.7% 72.8% 71.6% 70.0% 77.2% 75.7% 71.0% 59.5% 72.2% 66.8%
i
Assessment of employees 156 33 40 36 61 24 23 97 30 29 128 2878.2% 76.1% 82.3% 81.1% 77.6% 72.9% 76.5% 83.3% 76.1% 66.8% 78.0% 79.4%
i
Supporting employees (e.g. withquestions or grievances)
182 37 42 42 74 31 30 109 37 35 150 3290.8% 84.4% 86.2% 94.0% 93.8% 93.6% 100.0% 94.0% 92.9% 80.6% 91.0% 89.9%
i
None - - - - - - - - - - - -- - - - - - - - - - - -
Columns Tested: a,b,c,d,e,f - g,h,i - j,k
CATI Fieldwork: 27th September - 19th October 2017 Prepared by ComRes Page 6

Table 6/1
Jobs Outlook - Wave 19D1. How many people are employed or engaged by your organisation at all locations?Base: All respondents
REGION SIZE SECTOR
Total North MidlandsSouth excluding
LondonSouth including
London London Other 0-49 50-249 250+ Private PublicSignificance Level: 95% a b c d e *f g h i j k
Unweighted Total 200 43 49 45 79 34 29 114 40 46 165 35
Weighted Total 200 44 48 45 78 34 30 116 40 44 165 35100.0% 100.0% 100.0% 100.0% 100.0% 100.0% 100.0% 100.0% 100.0% 100.0% 100.0% 100.0%
0-9 49 11 10 10 22 11 6 49 - - 42 824.7% 25.7% 21.0% 23.3% 27.6% 33.3% 21.4% 42.4% - - 25.4% 21.4%
hi
10-49 67 15 19 12 24 12 9 67 - - 54 1333.5% 34.4% 39.1% 27.3% 30.6% 34.9% 30.6% 57.6% - - 32.7% 36.8%
hi
50-249 40 8 10 11 15 4 7 - 40 - 32 719.9% 18.7% 20.5% 24.7% 19.1% 11.5% 22.9% - 100.0% - 19.7% 20.8%
gi
250+ 44 9 9 11 18 7 7 - - 44 37 722.0% 21.2% 19.5% 24.7% 22.8% 20.3% 25.1% - - 100.0% 22.2% 21.0%
gh
Columns Tested: a,b,c,d,e,f - g,h,i - j,k
CATI Fieldwork: 27th September - 19th October 2017 Prepared by ComRes Page 7

Table 7/1
Jobs Outlook - Wave 19D3. What industry sector does your organisation work in?Base: All respondents
REGION SIZE SECTOR
Total North MidlandsSouth excluding
LondonSouth including
London London Other 0-49 50-249 250+ Private PublicSignificance Level: 95% a b c d e *f g h i j k
Unweighted Total 200 43 49 45 79 34 29 114 40 46 165 35
Weighted Total 200 44 48 45 78 34 30 116 40 44 165 35100.0% 100.0% 100.0% 100.0% 100.0% 100.0% 100.0% 100.0% 100.0% 100.0% 100.0% 100.0%
Agriculture, forestry & fishing 3 - 1 1 1 - 1 1 1 1 1 21.3% - 1.9% 1.9% 1.1% - 2.9% .7% 2.4% 2.0% .6% 4.9%
j
Production 18 3 8 4 4 - 3 10 4 5 17 19.0% 7.1% 15.6% 10.0% 5.7% - 9.5% 8.3% 9.2% 10.5% 10.4% 2.5%
e
Construction 12 2 6 2 4 2 1 9 2 1 10 36.1% 4.0% 11.9% 4.3% 4.7% 5.3% 3.3% 8.1% 4.5% 2.1% 5.8% 7.6%
Motor trades 9 2 3 1 3 2 2 4 3 3 9 14.7% 4.0% 5.9% 2.1% 3.6% 5.8% 6.9% 3.4% 7.3% 6.0% 5.2% 2.6%
Wholesale 10 1 3 2 6 4 - 4 4 2 10 -4.8% 2.1% 6.1% 4.1% 7.3% 11.6% - 3.3% 9.6% 4.3% 5.8% -
Retail 10 3 4 2 2 - 1 8 - 2 8 25.1% 7.3% 8.1% 4.0% 2.3% - 4.4% 7.2% - 4.1% 5.1% 5.0%
Transport & storage (inc. postal) 10 3 - 3 5 2 2 6 1 2 9 14.8% 6.0% - 6.2% 5.9% 5.5% 7.6% 5.5% 2.4% 4.8% 5.2% 2.5%
Accommodation & food services 12 2 1 3 6 3 4 8 2 3 12 16.2% 4.0% 2.1% 6.1% 7.2% 8.7% 13.7% 6.5% 4.8% 6.7% 7.0% 2.5%
Information & communication 8 2 2 1 3 2 1 6 2 - 7 14.2% 4.4% 4.6% 2.4% 4.2% 6.6% 3.3% 5.5% 5.2% - 4.5% 2.8%
Legal and Finance 8 3 3 - 1 1 - 4 1 2 7 13.8% 7.6% 6.7% - 1.4% 3.3% - 3.8% 2.8% 4.8% 4.1% 2.8%
Property 4 2 1 - 1 1 - 3 - 1 2 22.0% 5.1% 1.8% - 1.1% 2.7% - 2.3% - 3.2% 1.4% 5.1%
Professional, scientific & technical 17 4 3 4 8 4 2 13 2 2 15 28.5% 8.4% 6.6% 8.9% 10.5% 12.6% 6.6% 11.3% 4.8% 4.5% 9.2% 5.3%
Business administration and supportservices
16 4 3 3 6 3 2 12 4 - 14 27.8% 8.8% 6.8% 7.1% 8.1% 9.5% 6.9% 10.1% 9.5% - 8.2% 5.5%
i i
Columns Tested: a,b,c,d,e,f - g,h,i - j,k
CATI Fieldwork: 27th September - 19th October 2017 Prepared by ComRes Page 8

Table 7/2
Jobs Outlook - Wave 19D3. What industry sector does your organisation work in?Base: All respondents
REGION SIZE SECTOR
Total North MidlandsSouth excluding
LondonSouth including
London London Other 0-49 50-249 250+ Private PublicSignificance Level: 95% a b c d e *f g h i j k
Unweighted Total 200 43 49 45 79 34 29 114 40 46 165 35
Weighted Total 200 44 48 45 78 34 30 116 40 44 165 35100.0% 100.0% 100.0% 100.0% 100.0% 100.0% 100.0% 100.0% 100.0% 100.0% 100.0% 100.0%
Public administration and defence 11 - 1 3 7 4 3 7 3 1 7 45.3% - 2.0% 5.9% 8.3% 11.5% 10.6% 6.0% 6.8% 2.1% 4.1% 10.9%
a
Education 17 5 5 3 6 3 2 5 4 8 15 28.6% 10.6% 10.1% 6.1% 7.2% 8.6% 7.1% 4.3% 9.4% 19.2% 9.2% 6.1%
g
Health 24 4 5 8 11 3 5 8 5 11 18 612.2% 8.1% 9.8% 18.2% 14.0% 8.4% 17.3% 7.2% 11.8% 25.7% 10.9% 18.3%
g
Arts, entertainment, recreation and otherservices
11 6 - 6 6 - - 7 4 - 6 65.6% 12.6% - 12.7% 7.3% - - 6.4% 9.6% - 3.5% 15.7%
be be i j
Other - - - - - - - - - - - -- - - - - - - - - - - -
NETS
Net: Agriculture, forestry & fishing/Production
21 3 8 5 5 - 4 11 5 5 18 310.3% 7.1% 17.5% 12.0% 6.8% - 12.4% 9.1% 11.5% 12.5% 10.9% 7.4%
e e
Net: Construction/Property 16 4 7 2 5 3 1 12 2 2 12 48.1% 9.1% 13.8% 4.3% 5.9% 8.0% 3.3% 10.4% 4.5% 5.2% 7.1% 12.7%
Net: Motor trades/Wholesale/Retail/Transport & storage(inc. postal)/Accommodation & foodservices
51 10 11 10 21 11 10 30 10 11 47 425.6% 23.3% 22.2% 22.4% 26.3% 31.6% 32.6% 26.0% 24.1% 26.0% 28.4% 12.7%
Columns Tested: a,b,c,d,e,f - g,h,i - j,k
CATI Fieldwork: 27th September - 19th October 2017 Prepared by ComRes Page 9
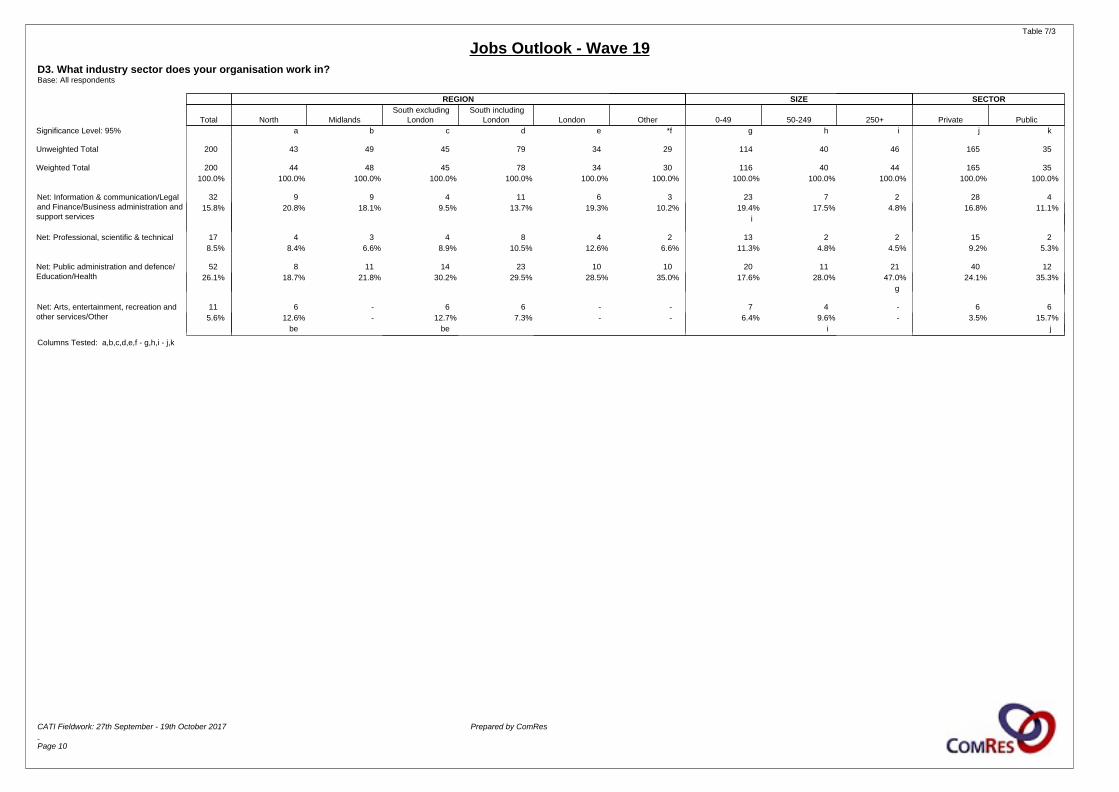
Table 7/3
Jobs Outlook - Wave 19D3. What industry sector does your organisation work in?Base: All respondents
REGION SIZE SECTOR
Total North MidlandsSouth excluding
LondonSouth including
London London Other 0-49 50-249 250+ Private PublicSignificance Level: 95% a b c d e *f g h i j k
Unweighted Total 200 43 49 45 79 34 29 114 40 46 165 35
Weighted Total 200 44 48 45 78 34 30 116 40 44 165 35100.0% 100.0% 100.0% 100.0% 100.0% 100.0% 100.0% 100.0% 100.0% 100.0% 100.0% 100.0%
Net: Information & communication/Legaland Finance/Business administration andsupport services
32 9 9 4 11 6 3 23 7 2 28 415.8% 20.8% 18.1% 9.5% 13.7% 19.3% 10.2% 19.4% 17.5% 4.8% 16.8% 11.1%
i
Net: Professional, scientific & technical 17 4 3 4 8 4 2 13 2 2 15 28.5% 8.4% 6.6% 8.9% 10.5% 12.6% 6.6% 11.3% 4.8% 4.5% 9.2% 5.3%
Net: Public administration and defence/Education/Health
52 8 11 14 23 10 10 20 11 21 40 1226.1% 18.7% 21.8% 30.2% 29.5% 28.5% 35.0% 17.6% 28.0% 47.0% 24.1% 35.3%
g
Net: Arts, entertainment, recreation andother services/Other
11 6 - 6 6 - - 7 4 - 6 65.6% 12.6% - 12.7% 7.3% - - 6.4% 9.6% - 3.5% 15.7%
be be i j
Columns Tested: a,b,c,d,e,f - g,h,i - j,k
CATI Fieldwork: 27th September - 19th October 2017 Prepared by ComRes Page 10
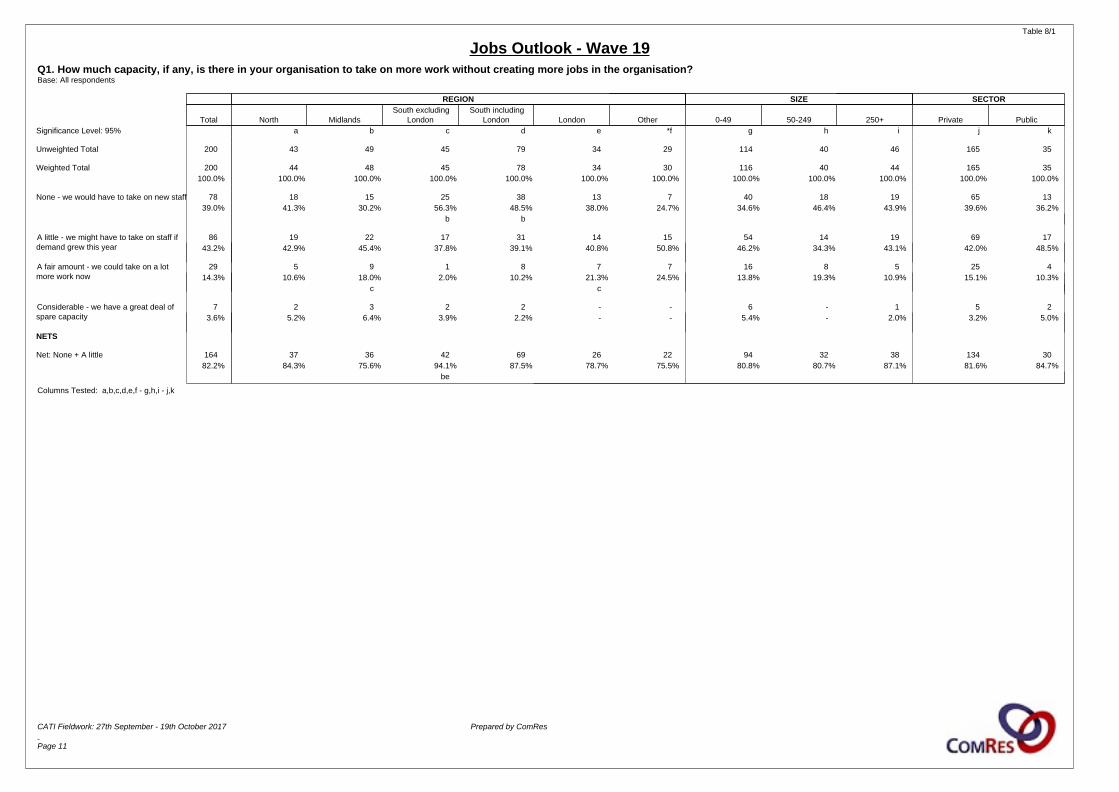
Table 8/1
Jobs Outlook - Wave 19Q1. How much capacity, if any, is there in your organisation to take on more work without creating more jobs in the organisation?Base: All respondents
REGION SIZE SECTOR
Total North MidlandsSouth excluding
LondonSouth including
London London Other 0-49 50-249 250+ Private PublicSignificance Level: 95% a b c d e *f g h i j k
Unweighted Total 200 43 49 45 79 34 29 114 40 46 165 35
Weighted Total 200 44 48 45 78 34 30 116 40 44 165 35100.0% 100.0% 100.0% 100.0% 100.0% 100.0% 100.0% 100.0% 100.0% 100.0% 100.0% 100.0%
None - we would have to take on new staff 78 18 15 25 38 13 7 40 18 19 65 1339.0% 41.3% 30.2% 56.3% 48.5% 38.0% 24.7% 34.6% 46.4% 43.9% 39.6% 36.2%
b b
A little - we might have to take on staff ifdemand grew this year
86 19 22 17 31 14 15 54 14 19 69 1743.2% 42.9% 45.4% 37.8% 39.1% 40.8% 50.8% 46.2% 34.3% 43.1% 42.0% 48.5%
A fair amount - we could take on a lotmore work now
29 5 9 1 8 7 7 16 8 5 25 414.3% 10.6% 18.0% 2.0% 10.2% 21.3% 24.5% 13.8% 19.3% 10.9% 15.1% 10.3%
c c
Considerable - we have a great deal ofspare capacity
7 2 3 2 2 - - 6 - 1 5 23.6% 5.2% 6.4% 3.9% 2.2% - - 5.4% - 2.0% 3.2% 5.0%
NETS
Net: None + A little 164 37 36 42 69 26 22 94 32 38 134 3082.2% 84.3% 75.6% 94.1% 87.5% 78.7% 75.5% 80.8% 80.7% 87.1% 81.6% 84.7%
be
Columns Tested: a,b,c,d,e,f - g,h,i - j,k
CATI Fieldwork: 27th September - 19th October 2017 Prepared by ComRes Page 11
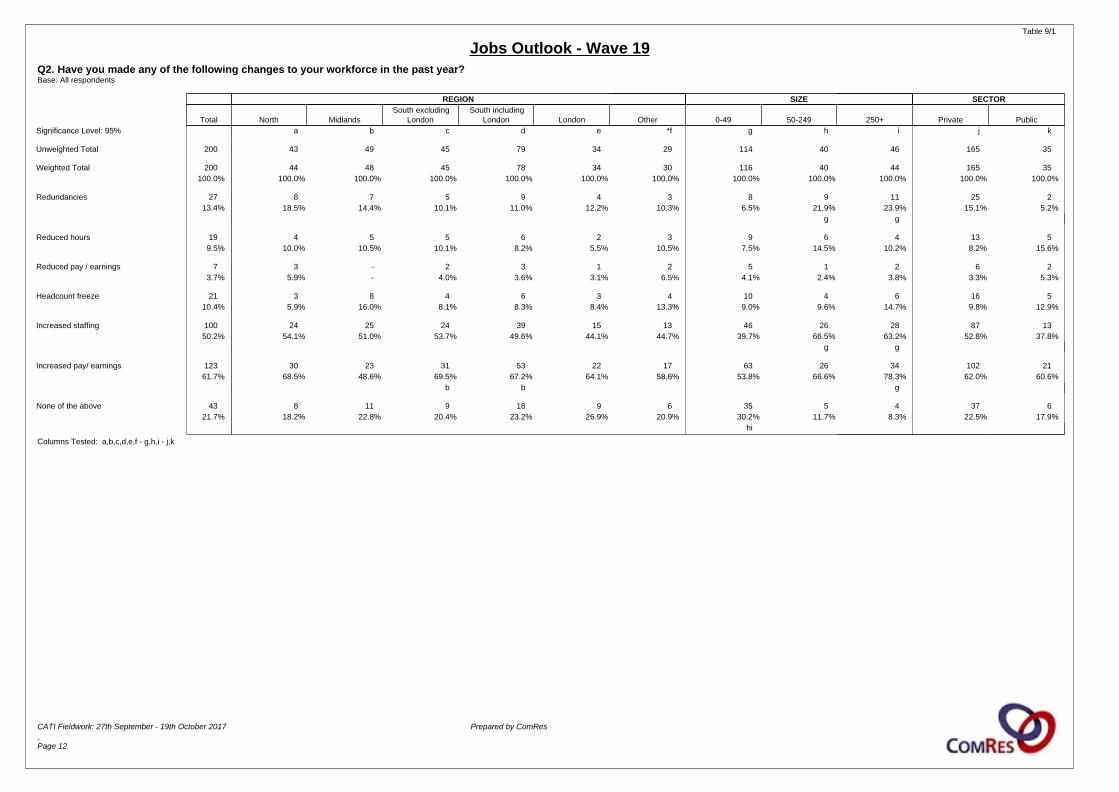
Table 9/1
Jobs Outlook - Wave 19Q2. Have you made any of the following changes to your workforce in the past year?Base: All respondents
REGION SIZE SECTOR
Total North MidlandsSouth excluding
LondonSouth including
London London Other 0-49 50-249 250+ Private PublicSignificance Level: 95% a b c d e *f g h i j k
Unweighted Total 200 43 49 45 79 34 29 114 40 46 165 35
Weighted Total 200 44 48 45 78 34 30 116 40 44 165 35100.0% 100.0% 100.0% 100.0% 100.0% 100.0% 100.0% 100.0% 100.0% 100.0% 100.0% 100.0%
Redundancies 27 8 7 5 9 4 3 8 9 11 25 213.4% 18.5% 14.4% 10.1% 11.0% 12.2% 10.3% 6.5% 21.9% 23.9% 15.1% 5.2%
g g
Reduced hours 19 4 5 5 6 2 3 9 6 4 13 59.5% 10.0% 10.5% 10.1% 8.2% 5.5% 10.5% 7.5% 14.5% 10.2% 8.2% 15.6%
Reduced pay / earnings 7 3 - 2 3 1 2 5 1 2 6 23.7% 5.9% - 4.0% 3.6% 3.1% 6.5% 4.1% 2.4% 3.8% 3.3% 5.3%
Headcount freeze 21 3 8 4 6 3 4 10 4 6 16 510.4% 5.9% 16.0% 8.1% 8.3% 8.4% 13.3% 9.0% 9.6% 14.7% 9.8% 12.9%
Increased staffing 100 24 25 24 39 15 13 46 26 28 87 1350.2% 54.1% 51.0% 53.7% 49.6% 44.1% 44.7% 39.7% 66.5% 63.2% 52.8% 37.8%
g g
Increased pay/ earnings 123 30 23 31 53 22 17 63 26 34 102 2161.7% 68.5% 48.6% 69.5% 67.2% 64.1% 58.6% 53.8% 66.6% 78.3% 62.0% 60.6%
b b g
None of the above 43 8 11 9 18 9 6 35 5 4 37 621.7% 18.2% 22.8% 20.4% 23.2% 26.9% 20.9% 30.2% 11.7% 8.3% 22.5% 17.9%
hi
Columns Tested: a,b,c,d,e,f - g,h,i - j,k
CATI Fieldwork: 27th September - 19th October 2017 Prepared by ComRes Page 12

Table 10/1
Jobs Outlook - Wave 19Q3. Do you think economic conditions in the country as a whole are getting:Base: All respondents
REGION SIZE SECTOR
Total North MidlandsSouth excluding
LondonSouth including
London London Other 0-49 50-249 250+ Private PublicSignificance Level: 95% a b c d e *f g h i j k
Unweighted Total 200 43 49 45 79 34 29 114 40 46 165 35
Weighted Total 200 44 48 45 78 34 30 116 40 44 165 35100.0% 100.0% 100.0% 100.0% 100.0% 100.0% 100.0% 100.0% 100.0% 100.0% 100.0% 100.0%
A lot better (5) 3 - - 2 2 - 1 2 - 1 2 11.4% - - 4.0% 2.3% - 3.3% 1.6% - 2.0% 1.1% 2.5%
A little better (4) 52 17 8 8 16 8 11 26 13 13 41 1025.8% 38.8% 16.4% 18.8% 20.6% 23.1% 35.7% 22.0% 32.8% 29.6% 25.0% 29.4%
bcd
No change (3) 70 16 21 13 26 12 8 47 12 10 59 1134.9% 35.9% 42.6% 29.6% 32.6% 36.7% 26.6% 40.3% 31.4% 23.7% 35.5% 31.7%
i
A little worse (2) 54 6 17 14 22 8 9 33 11 10 45 926.9% 13.3% 35.0% 30.9% 27.7% 23.3% 31.5% 28.2% 26.5% 23.7% 27.0% 26.1%
a
A lot worse (1) 12 3 2 4 6 3 - 5 2 6 10 25.9% 7.8% 4.0% 8.1% 8.3% 8.5% - 3.9% 4.4% 12.7% 6.0% 5.3%
g
Don't know 10 2 1 4 7 3 1 5 2 4 9 25.2% 4.1% 2.0% 8.6% 8.5% 8.4% 2.9% 4.1% 4.9% 8.4% 5.2% 5.0%
NETS
Net: Better 54 17 8 10 18 8 12 27 13 14 43 1127.2% 38.8% 16.4% 22.8% 22.9% 23.1% 39.0% 23.6% 32.8% 31.6% 26.2% 31.9%
b
Net: Better/ No change 124 33 28 23 44 20 19 74 26 24 102 2262.1% 74.7% 59.0% 52.4% 55.6% 59.8% 65.6% 63.9% 64.3% 55.3% 61.7% 63.6%
cd
Net: Worse 66 9 19 17 28 11 9 37 12 16 54 1132.8% 21.1% 39.0% 39.0% 35.9% 31.8% 31.5% 32.1% 30.9% 36.3% 33.1% 31.4%
Mean score 2.9 3.1 2.7 2.8 2.8 2.8 3.1 2.9 3.0 2.8 2.9 3.0b
Columns Tested: a,b,c,d,e,f - g,h,i - j,k
CATI Fieldwork: 27th September - 19th October 2017 Prepared by ComRes Page 13

Table 11/1
Jobs Outlook - Wave 19Q4. In view of the economic conditions, do you/does your organisation expect confidence in hiring and investment decisions to get:Base: All respondents
REGION SIZE SECTOR
Total North MidlandsSouth excluding
LondonSouth including
London London Other 0-49 50-249 250+ Private PublicSignificance Level: 95% a b c d e *f g h i j k
Unweighted Total 200 43 49 45 79 34 29 114 40 46 165 35
Weighted Total 200 44 48 45 78 34 30 116 40 44 165 35100.0% 100.0% 100.0% 100.0% 100.0% 100.0% 100.0% 100.0% 100.0% 100.0% 100.0% 100.0%
A lot better (5) 7 1 1 1 4 3 1 4 1 2 6 13.3% 2.0% 2.3% 2.0% 4.8% 8.4% 3.3% 3.3% 2.4% 4.1% 3.5% 2.5%
A little better (4) 58 17 8 14 22 8 11 26 16 16 46 1128.8% 39.5% 16.0% 31.4% 28.0% 23.4% 35.5% 22.3% 40.4% 35.4% 28.1% 31.7%
b g
No change (3) 81 19 22 15 28 13 12 55 13 14 68 1340.7% 43.5% 46.3% 33.2% 35.4% 38.2% 41.5% 47.3% 32.4% 30.8% 41.4% 37.3%
A little worse (2) 30 3 7 9 16 7 3 21 3 6 24 614.8% 6.9% 14.7% 20.7% 21.0% 21.5% 10.2% 18.0% 7.4% 13.0% 14.6% 15.7%
a
A lot worse (1) 4 1 2 - 1 1 - 4 - - 3 12.0% 2.0% 4.6% - 1.1% 2.7% - 3.5% - - 1.9% 2.5%
Don't know 21 3 8 6 8 2 3 7 7 7 17 410.4% 6.0% 16.1% 12.6% 9.7% 5.8% 9.4% 5.6% 17.3% 16.7% 10.4% 10.3%
g g
NETS
Net: Better 64 18 9 15 26 11 11 30 17 17 52 1232.1% 41.5% 18.3% 33.5% 32.8% 31.9% 38.8% 25.6% 42.8% 39.5% 31.6% 34.2%
b g
Net: Better/ No change 146 37 31 30 53 24 24 85 30 31 120 2572.8% 85.0% 64.6% 66.7% 68.1% 70.1% 80.3% 72.9% 75.3% 70.3% 73.1% 71.5%
bcd
Net: Worse 34 4 9 9 17 8 3 25 3 6 27 616.8% 9.0% 19.3% 20.7% 22.2% 24.1% 10.2% 21.5% 7.4% 13.0% 16.5% 18.2%
h
Mean score 3.2 3.3 3.0 3.2 3.2 3.1 3.4 3.0 3.5 3.4 3.2 3.2b g g
Columns Tested: a,b,c,d,e,f - g,h,i - j,k
CATI Fieldwork: 27th September - 19th October 2017 Prepared by ComRes Page 14
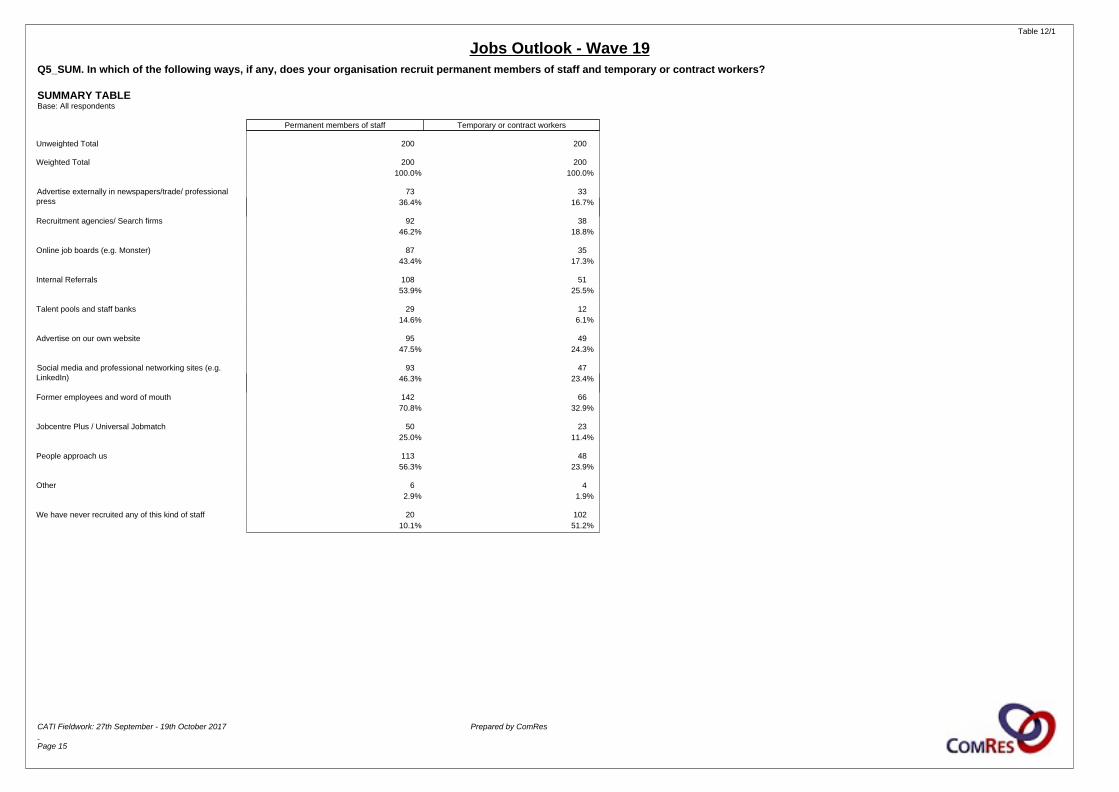
Table 12/1
Jobs Outlook - Wave 19Q5_SUM. In which of the following ways, if any, does your organisation recruit permanent members of staff and temporary or contract workers? SUMMARY TABLEBase: All respondents
Permanent members of staff Temporary or contract workers
Unweighted Total 200 200
Weighted Total 200 200100.0% 100.0%
Advertise externally in newspapers/trade/ professionalpress
73 3336.4% 16.7%
Recruitment agencies/ Search firms 92 3846.2% 18.8%
Online job boards (e.g. Monster) 87 3543.4% 17.3%
Internal Referrals 108 5153.9% 25.5%
Talent pools and staff banks 29 1214.6% 6.1%
Advertise on our own website 95 4947.5% 24.3%
Social media and professional networking sites (e.g.LinkedIn)
93 4746.3% 23.4%
Former employees and word of mouth 142 6670.8% 32.9%
Jobcentre Plus / Universal Jobmatch 50 2325.0% 11.4%
People approach us 113 4856.3% 23.9%
Other 6 42.9% 1.9%
We have never recruited any of this kind of staff 20 10210.1% 51.2%
CATI Fieldwork: 27th September - 19th October 2017 Prepared by ComRes Page 15

Table 13/1
Jobs Outlook - Wave 19Q5_SUM. In which of the following ways, if any, does your organisation recruit permanent members of staff and temporary or contract workers? SUMMARY TABLEBase: All who have recruited this type of staff before
Permanent members of staff Temporary or contract workers
Unweighted Total 180 100
Weighted Total 180 98100.0% 100.0%
Advertise externally in newspapers/trade/ professionalpress
73 3340.5% 34.1%
Recruitment agencies/ Search firms 92 3851.4% 38.5%
Online job boards (e.g. Monster) 87 3548.3% 35.5%
Internal Referrals 108 5160.0% 52.3%
Talent pools and staff banks 29 1216.2% 12.5%
Advertise on our own website 95 4952.8% 49.8%
Social media and professional networking sites (e.g.LinkedIn)
93 4751.5% 47.9%
Former employees and word of mouth 142 6678.7% 67.4%
Jobcentre Plus / Universal Jobmatch 50 2327.8% 23.4%
People approach us 113 4862.6% 48.9%
Other 6 43.2% 3.9%
CATI Fieldwork: 27th September - 19th October 2017 Prepared by ComRes Page 16

Table 14/1
Jobs Outlook - Wave 19Q5_1. In which of the following ways, if any, does your organisation recruit permanent members of staff and temporary or contract workers? Permanent members of staffBase: All respondents
REGION SIZE SECTOR
Total North MidlandsSouth excluding
LondonSouth including
London London Other 0-49 50-249 250+ Private PublicSignificance Level: 95% a b c d e *f g h i j k
Unweighted Total 200 43 49 45 79 34 29 114 40 46 165 35
Weighted Total 200 44 48 45 78 34 30 116 40 44 165 35100.0% 100.0% 100.0% 100.0% 100.0% 100.0% 100.0% 100.0% 100.0% 100.0% 100.0% 100.0%
Former employees and word of mouth 142 29 31 34 56 22 26 73 34 34 113 2970.8% 65.7% 64.9% 75.3% 71.0% 65.2% 87.1% 63.0% 86.0% 77.5% 68.5% 81.4%
g
People approach us 113 23 22 25 48 23 19 62 26 25 89 2356.3% 52.1% 46.6% 56.5% 61.6% 68.4% 63.9% 53.0% 64.4% 57.6% 54.2% 65.9%
Internal Referrals 108 20 24 28 45 17 19 46 31 30 86 2253.9% 45.2% 50.4% 62.5% 57.1% 49.8% 64.5% 39.7% 79.2% 68.8% 52.2% 62.1%
g g
Advertise on our own website 95 15 21 23 42 19 16 35 25 35 77 1847.5% 35.2% 44.1% 51.7% 53.6% 56.0% 55.3% 30.3% 61.8% 80.1% 46.6% 52.0%
g g
Social media and professional networkingsites (e.g. LinkedIn)
93 20 22 20 34 15 16 42 23 28 75 1746.3% 46.3% 44.7% 43.9% 44.0% 44.1% 55.2% 36.0% 56.9% 64.1% 45.6% 49.5%
g g
Recruitment agencies/ Search firms 92 22 23 14 34 20 14 44 23 25 79 1446.2% 49.6% 48.3% 31.0% 43.2% 59.4% 45.8% 38.0% 57.1% 57.8% 47.7% 39.0%
c g g
Online job boards (e.g. Monster) 87 18 18 24 42 18 9 33 20 35 68 1943.4% 41.4% 38.3% 53.6% 53.3% 52.9% 28.8% 28.1% 49.7% 78.4% 41.5% 52.8%
g gh
Advertise externally in newspapers/trade/professional press
73 13 21 14 29 15 10 37 15 21 62 1136.4% 29.1% 43.8% 31.0% 36.9% 44.6% 33.9% 31.8% 37.4% 47.7% 37.4% 31.8%
Jobcentre Plus / Universal Jobmatch 50 15 9 7 15 8 11 15 13 22 43 725.0% 33.8% 18.2% 16.5% 19.6% 23.6% 37.6% 12.8% 32.7% 50.3% 26.2% 19.6%
g g
Columns Tested: a,b,c,d,e,f - g,h,i - j,k
CATI Fieldwork: 27th September - 19th October 2017 Prepared by ComRes Page 17

Table 14/2
Jobs Outlook - Wave 19Q5_1. In which of the following ways, if any, does your organisation recruit permanent members of staff and temporary or contract workers? Permanent members of staffBase: All respondents
REGION SIZE SECTOR
Total North MidlandsSouth excluding
LondonSouth including
London London Other 0-49 50-249 250+ Private PublicSignificance Level: 95% a b c d e *f g h i j k
Unweighted Total 200 43 49 45 79 34 29 114 40 46 165 35
Weighted Total 200 44 48 45 78 34 30 116 40 44 165 35100.0% 100.0% 100.0% 100.0% 100.0% 100.0% 100.0% 100.0% 100.0% 100.0% 100.0% 100.0%
Talent pools and staff banks 29 5 8 7 14 7 2 12 5 13 25 414.6% 12.0% 16.1% 16.7% 18.2% 20.3% 6.5% 10.0% 11.7% 29.5% 15.0% 12.5%
gh
Other 6 1 2 2 2 - 1 4 - 2 5 12.9% 2.1% 4.0% 4.3% 2.5% - 3.5% 3.4% - 4.2% 3.0% 2.5%
We have never recruited any of this kindof staff
20 7 5 6 6 - 2 19 - 1 18 210.1% 15.6% 10.5% 14.2% 8.1% - 6.4% 16.6% - 2.0% 11.2% 4.9%
e e hi
Columns Tested: a,b,c,d,e,f - g,h,i - j,k
CATI Fieldwork: 27th September - 19th October 2017 Prepared by ComRes Page 18

Table 15/1
Jobs Outlook - Wave 19Q5_2. In which of the following ways, if any, does your organisation recruit permanent members of staff and temporary or contract workers? Temporary or contract workersBase: All respondents
REGION SIZE SECTOR
Total North MidlandsSouth excluding
LondonSouth including
London London Other 0-49 50-249 250+ Private PublicSignificance Level: 95% a b c d e *f g h i j k
Unweighted Total 200 43 49 45 79 34 29 114 40 46 165 35
Weighted Total 200 44 48 45 78 34 30 116 40 44 165 35100.0% 100.0% 100.0% 100.0% 100.0% 100.0% 100.0% 100.0% 100.0% 100.0% 100.0% 100.0%
Former employees and word of mouth 66 13 18 14 24 10 11 27 21 17 53 1332.9% 30.4% 36.5% 31.3% 30.4% 29.2% 37.4% 23.7% 53.6% 38.6% 32.0% 37.1%
g
Internal Referrals 51 8 11 15 23 8 9 16 17 18 42 925.5% 18.5% 23.8% 33.0% 28.7% 23.0% 30.3% 14.1% 42.2% 40.5% 25.3% 26.5%
g g
Advertise on our own website 49 9 11 11 19 8 10 15 12 22 39 924.3% 20.2% 22.1% 24.5% 24.1% 23.6% 34.4% 12.7% 30.5% 49.2% 23.8% 26.6%
g g
People approach us 48 8 11 11 19 8 10 22 12 13 40 823.9% 18.2% 21.9% 25.1% 24.3% 23.4% 34.4% 19.0% 30.6% 30.6% 24.3% 21.8%
Social media and professional networkingsites (e.g. LinkedIn)
47 10 14 9 14 5 9 19 13 14 39 823.4% 22.4% 28.3% 20.6% 18.1% 14.7% 30.8% 16.7% 33.1% 32.2% 23.7% 21.9%
g g
Recruitment agencies/ Search firms 38 12 10 4 8 4 8 14 11 12 33 418.8% 27.1% 20.3% 8.4% 9.7% 11.5% 28.2% 12.3% 27.9% 27.8% 20.2% 12.3%
cd g g
Online job boards (e.g. Monster) 35 7 11 10 15 5 2 10 9 16 27 717.3% 16.3% 21.9% 22.2% 18.9% 14.4% 7.5% 8.3% 23.1% 36.1% 16.5% 21.2%
g g
Advertise externally in newspapers/trade/professional press
33 7 9 5 12 7 5 15 7 12 28 516.7% 16.5% 17.8% 12.2% 15.8% 20.5% 17.4% 13.1% 16.4% 26.2% 17.2% 14.0%
g
Jobcentre Plus / Universal Jobmatch 23 7 5 3 5 2 6 4 7 12 18 511.4% 16.9% 9.8% 6.1% 5.9% 5.8% 20.6% 3.5% 18.0% 26.5% 10.8% 14.5%
g g
Columns Tested: a,b,c,d,e,f - g,h,i - j,k
CATI Fieldwork: 27th September - 19th October 2017 Prepared by ComRes Page 19

Table 15/2
Jobs Outlook - Wave 19Q5_2. In which of the following ways, if any, does your organisation recruit permanent members of staff and temporary or contract workers? Temporary or contract workersBase: All respondents
REGION SIZE SECTOR
Total North MidlandsSouth excluding
LondonSouth including
London London Other 0-49 50-249 250+ Private PublicSignificance Level: 95% a b c d e *f g h i j k
Unweighted Total 200 43 49 45 79 34 29 114 40 46 165 35
Weighted Total 200 44 48 45 78 34 30 116 40 44 165 35100.0% 100.0% 100.0% 100.0% 100.0% 100.0% 100.0% 100.0% 100.0% 100.0% 100.0% 100.0%
Talent pools and staff banks 12 3 4 1 4 3 2 4 5 4 11 16.1% 5.9% 7.8% 2.0% 5.0% 8.9% 6.5% 3.3% 11.7% 8.3% 6.9% 2.5%
g
Other 4 - 2 2 2 - - 3 - 1 3 11.9% - 4.3% 4.0% 2.3% - - 2.6% - 2.0% 1.8% 2.5%
We have never recruited any of this kindof staff
102 24 21 23 44 22 13 73 14 16 85 1851.2% 54.4% 43.0% 50.4% 56.7% 65.1% 45.2% 62.7% 34.5% 35.9% 51.3% 50.6%
hi
Columns Tested: a,b,c,d,e,f - g,h,i - j,k
CATI Fieldwork: 27th September - 19th October 2017 Prepared by ComRes Page 20

Table 16/1
Jobs Outlook - Wave 19Q5_1. In which of the following ways, if any, does your organisation recruit permanent members of staff and temporary or contract workers? Permanent members of staffBase: All who have recruited this type of staff before
REGION SIZE SECTOR
Total North MidlandsSouth excluding
LondonSouth including
London London Other 0-49 50-249 250+ Private PublicSignificance Level: 95% a b c d e *f g h i j k
Unweighted Total 180 37 44 38 72 34 27 95 40 45 147 33
Weighted Total 180 37 43 38 72 34 28 97 40 43 146 33100.0% 100.0% 100.0% 100.0% 100.0% 100.0% 100.0% 100.0% 100.0% 100.0% 100.0% 100.0%
Former employees and word of mouth 142 29 31 34 56 22 26 73 34 34 113 2978.7% 77.9% 72.6% 87.8% 77.2% 65.2% 93.1% 75.5% 86.0% 79.1% 77.1% 85.7%
e
People approach us 113 23 22 25 48 23 19 62 26 25 89 2362.6% 61.7% 52.1% 65.8% 67.0% 68.4% 68.3% 63.5% 64.4% 58.8% 61.0% 69.3%
Internal Referrals 108 20 24 28 45 17 19 46 31 30 86 2260.0% 53.5% 56.3% 72.8% 62.1% 49.8% 68.9% 47.6% 79.2% 70.2% 58.8% 65.3%
e g g
Advertise on our own website 95 15 21 23 42 19 16 35 25 35 77 1852.8% 41.8% 49.3% 60.3% 58.3% 56.0% 59.1% 36.3% 61.8% 81.8% 52.4% 54.8%
g gh
Social media and professional networkingsites (e.g. LinkedIn)
93 20 22 20 34 15 16 42 23 28 75 1751.5% 54.9% 50.0% 51.2% 47.9% 44.1% 59.0% 43.1% 56.9% 65.4% 51.4% 52.1%
g
Recruitment agencies/ Search firms 92 22 23 14 34 20 14 44 23 25 79 1451.4% 58.8% 53.9% 36.1% 47.0% 59.4% 48.9% 45.6% 57.1% 59.0% 53.7% 41.0%
Online job boards (e.g. Monster) 87 18 18 24 42 18 9 33 20 35 68 1948.3% 49.1% 42.8% 62.4% 58.0% 52.9% 30.8% 33.6% 49.7% 80.1% 46.7% 55.5%
gh
Advertise externally in newspapers/trade/professional press
73 13 21 14 29 15 10 37 15 21 62 1140.5% 34.5% 49.0% 36.2% 40.1% 44.6% 36.2% 38.1% 37.4% 48.7% 42.1% 33.5%
Jobcentre Plus / Universal Jobmatch 50 15 9 7 15 8 11 15 13 22 43 727.8% 40.1% 20.3% 19.2% 21.3% 23.6% 40.2% 15.4% 32.7% 51.4% 29.5% 20.7%
d g g
Columns Tested: a,b,c,d,e,f - g,h,i - j,k
CATI Fieldwork: 27th September - 19th October 2017 Prepared by ComRes Page 21

Table 16/2
Jobs Outlook - Wave 19Q5_1. In which of the following ways, if any, does your organisation recruit permanent members of staff and temporary or contract workers? Permanent members of staffBase: All who have recruited this type of staff before
REGION SIZE SECTOR
Total North MidlandsSouth excluding
LondonSouth including
London London Other 0-49 50-249 250+ Private PublicSignificance Level: 95% a b c d e *f g h i j k
Unweighted Total 180 37 44 38 72 34 27 95 40 45 147 33
Weighted Total 180 37 43 38 72 34 28 97 40 43 146 33100.0% 100.0% 100.0% 100.0% 100.0% 100.0% 100.0% 100.0% 100.0% 100.0% 100.0% 100.0%
Talent pools and staff banks 29 5 8 7 14 7 2 12 5 13 25 416.2% 14.2% 18.0% 19.4% 19.8% 20.3% 6.9% 11.9% 11.7% 30.1% 16.9% 13.2%
gh
Other 6 1 2 2 2 - 1 4 - 2 5 13.2% 2.4% 4.5% 5.0% 2.7% - 3.7% 4.1% - 4.3% 3.4% 2.6%
Columns Tested: a,b,c,d,e,f - g,h,i - j,k
CATI Fieldwork: 27th September - 19th October 2017 Prepared by ComRes Page 22

Table 17/1
Jobs Outlook - Wave 19Q5_2. In which of the following ways, if any, does your organisation recruit permanent members of staff and temporary or contract workers? Temporary or contract workersBase: All who have recruited this type of staff before
REGION SIZE SECTOR
Total North MidlandsSouth excluding
LondonSouth including
London London Other 0-49 50-249 250+ Private PublicSignificance Level: 95% *a *b *c d *e *f g *h i j *k
Unweighted Total 100 22 28 22 34 12 16 43 27 30 84 16
Weighted Total 98 20 27 22 34 12 16 43 26 28 80 17100.0% 100.0% 100.0% 100.0% 100.0% 100.0% 100.0% 100.0% 100.0% 100.0% 100.0% 100.0%
Former employees and word of mouth 66 13 18 14 24 10 11 27 21 17 53 1367.4% 66.6% 64.1% 63.0% 70.1% 83.5% 68.3% 63.4% 81.8% 60.3% 65.7% 75.2%
Internal Referrals 51 8 11 15 23 8 9 16 17 18 42 952.3% 40.5% 41.7% 66.4% 66.3% 66.0% 55.3% 37.9% 64.4% 63.1% 52.0% 53.5%
g
Advertise on our own website 49 9 11 11 19 8 10 15 12 22 39 949.8% 44.4% 38.7% 49.3% 55.6% 67.5% 62.8% 34.1% 46.6% 76.7% 48.9% 53.8%
g
People approach us 48 8 11 11 19 8 10 22 12 13 40 848.9% 39.9% 38.4% 50.5% 56.2% 66.9% 62.8% 51.1% 46.7% 47.8% 50.0% 44.1%
Social media and professional networkingsites (e.g. LinkedIn)
47 10 14 9 14 5 9 19 13 14 39 847.9% 49.2% 49.7% 41.6% 41.7% 42.0% 56.3% 44.8% 50.5% 50.3% 48.7% 44.3%
Recruitment agencies/ Search firms 38 12 10 4 8 4 8 14 11 12 33 438.5% 59.3% 35.5% 16.9% 22.4% 33.0% 51.5% 32.9% 42.5% 43.4% 41.5% 24.8%
Online job boards (e.g. Monster) 35 7 11 10 15 5 2 10 9 16 27 735.5% 35.8% 38.4% 44.7% 43.5% 41.2% 13.7% 22.2% 35.2% 56.4% 33.9% 42.9%
g
Advertise externally in newspapers/trade/professional press
33 7 9 5 12 7 5 15 7 12 28 534.1% 36.1% 31.3% 24.7% 36.4% 58.6% 31.7% 35.2% 25.0% 40.8% 35.4% 28.4%
Jobcentre Plus / Universal Jobmatch 23 7 5 3 5 2 6 4 7 12 18 523.4% 37.1% 17.2% 12.2% 13.7% 16.5% 37.6% 9.3% 27.5% 41.4% 22.1% 29.4%
g
Talent pools and staff banks 12 3 4 1 4 3 2 4 5 4 11 112.5% 13.0% 13.7% 4.1% 11.5% 25.5% 11.8% 9.0% 17.9% 12.9% 14.1% 5.1%
Columns Tested: a,b,c,d,e,f - g,h,i - j,k
CATI Fieldwork: 27th September - 19th October 2017 Prepared by ComRes Page 23

Table 17/2
Jobs Outlook - Wave 19Q5_2. In which of the following ways, if any, does your organisation recruit permanent members of staff and temporary or contract workers? Temporary or contract workersBase: All who have recruited this type of staff before
REGION SIZE SECTOR
Total North MidlandsSouth excluding
LondonSouth including
London London Other 0-49 50-249 250+ Private PublicSignificance Level: 95% *a *b *c d *e *f g *h i j *k
Unweighted Total 100 22 28 22 34 12 16 43 27 30 84 16
Weighted Total 98 20 27 22 34 12 16 43 26 28 80 17100.0% 100.0% 100.0% 100.0% 100.0% 100.0% 100.0% 100.0% 100.0% 100.0% 100.0% 100.0%
Other 4 - 2 2 2 - - 3 - 1 3 13.9% - 7.5% 8.0% 5.3% - - 6.9% - 3.1% 3.7% 5.0%
Columns Tested: a,b,c,d,e,f - g,h,i - j,k
CATI Fieldwork: 27th September - 19th October 2017 Prepared by ComRes Page 24

Table 18/1
Jobs Outlook - Wave 19Q6. How satisfied or dissatisfied are you with the quality of candidates presented to you by your recruitment agencies?Base: All who use recruitment agencies
REGION SIZE SECTOR
Total North MidlandsSouth excluding
LondonSouth including
London London Other 0-49 50-249 250+ Private PublicSignificance Level: 95% *a *b *c d *e *f g *h *i j *k
Unweighted Total 102 24 26 15 37 22 15 47 26 29 85 17
Weighted Total 102 25 25 14 36 22 16 49 25 27 84 17100.0% 100.0% 100.0% 100.0% 100.0% 100.0% 100.0% 100.0% 100.0% 100.0% 100.0% 100.0%
Very satisfied (5) 19 2 6 3 6 3 5 9 6 4 15 418.2% 7.6% 23.7% 19.4% 15.6% 13.3% 32.2% 18.7% 22.3% 13.7% 17.3% 23.1%
Fairly satisfied (4) 53 15 12 8 18 10 9 21 14 18 43 1152.3% 59.9% 45.8% 59.5% 50.6% 45.0% 54.9% 42.9% 55.2% 66.5% 50.5% 61.5%
Neither satisfied nor dissatisfied (3) 17 5 6 2 6 4 - 10 4 3 14 316.7% 21.9% 22.6% 14.4% 16.2% 17.4% - 21.2% 15.4% 9.9% 16.9% 15.3%
Fairly dissatisfied (2) 7 2 1 - 3 3 1 5 1 1 7 -6.9% 7.0% 4.1% - 8.7% 14.3% 6.8% 10.8% 3.5% 3.0% 8.3% -
Very dissatisfied (1) 2 1 - - - - 1 1 1 - 2 -1.8% 3.6% - - - - 6.1% 2.0% 3.5% - 2.2% -
Don't know 4 - 1 1 3 2 - 2 - 2 4 -4.0% - 3.8% 6.7% 8.8% 10.1% - 4.5% - 6.9% 4.9% -
NETS
Net: Satisfied 72 17 18 11 24 13 14 30 20 22 57 1570.6% 67.4% 69.5% 78.9% 66.3% 58.3% 87.1% 61.6% 77.5% 80.2% 67.7% 84.7%
Net: Dissatisfied 9 3 1 - 3 3 2 6 2 1 9 -8.7% 10.6% 4.1% - 8.7% 14.3% 12.9% 12.7% 7.1% 3.0% 10.5% -
Mean score 3.8 3.6 3.9 4.1 3.8 3.6 4.0 3.7 3.9 4.0 3.8 4.1
Columns Tested: a,b,c,d,e,f - g,h,i - j,k
CATI Fieldwork: 27th September - 19th October 2017 Prepared by ComRes Page 25

Table 19/1
Jobs Outlook - Wave 19Q7. How satisfied or dissatisfied are you overall with the recruitment agencies you have used in the last 2 years?Base: All who use recruitment agencies
REGION SIZE SECTOR
Total North MidlandsSouth excluding
LondonSouth including
London London Other 0-49 50-249 250+ Private PublicSignificance Level: 95% *a *b *c d *e *f g *h *i j *k
Unweighted Total 102 24 26 15 37 22 15 47 26 29 85 17
Weighted Total 102 25 25 14 36 22 16 49 25 27 84 17100.0% 100.0% 100.0% 100.0% 100.0% 100.0% 100.0% 100.0% 100.0% 100.0% 100.0% 100.0%
Very satisfied (5) 20 3 6 1 5 4 6 10 5 5 17 219.3% 11.2% 23.1% 6.5% 13.6% 18.1% 38.9% 20.5% 18.9% 17.5% 20.7% 12.4%
Fairly satisfied (4) 56 12 14 11 21 10 9 23 16 16 45 1154.7% 49.1% 53.9% 80.2% 59.1% 45.7% 55.0% 47.8% 62.8% 59.4% 53.3% 61.8%
Neither satisfied nor dissatisfied (3) 14 6 5 - 3 3 1 8 3 3 11 313.8% 22.2% 19.2% - 7.5% 12.3% 6.2% 17.3% 11.3% 9.9% 13.4% 15.6%
Fairly dissatisfied (2) 6 3 - - 2 2 - 4 1 1 4 25.5% 14.0% - - 5.8% 9.5% - 7.8% 3.5% 3.0% 4.5% 10.1%
Very dissatisfied (1) 1 - - - 1 1 - 1 - - 1 -1.0% - - - 2.7% 4.4% - 2.0% - - 1.2% -
Don't know 6 1 1 2 4 2 - 2 1 3 6 -5.8% 3.5% 3.8% 13.3% 11.3% 10.1% - 4.5% 3.4% 10.3% 7.0% -
NETS
Net: Satisfied 75 15 19 12 26 14 15 33 21 21 62 1374.0% 60.3% 76.9% 86.7% 72.7% 63.7% 93.8% 68.3% 81.7% 76.8% 73.9% 74.2%
Net: Dissatisfied 7 3 - - 3 3 - 5 1 1 5 26.4% 14.0% - - 8.5% 13.9% - 9.8% 3.5% 3.0% 5.7% 10.1%
Mean score 3.9 3.6 4.0 4.1 3.8 3.7 4.3 3.8 4.0 4.0 3.9 3.8
Columns Tested: a,b,c,d,e,f - g,h,i - j,k
CATI Fieldwork: 27th September - 19th October 2017 Prepared by ComRes Page 26

Table 20/1
Jobs Outlook - Wave 19Q8_1. Which of the following job functions, if any, are you involved in recruiting for permanent members of staff and temporary agency workers? Permanent members of staffBase: All who recruit permanent members of staff
REGION SIZE SECTOR
Total North MidlandsSouth excluding
LondonSouth including
London London Other 0-49 50-249 250+ Private PublicSignificance Level: 95% a b c d e *f g h i j k
Unweighted Total 180 37 44 38 72 34 27 95 40 45 147 33
Weighted Total 180 37 43 38 72 34 28 97 40 43 146 33100.0% 100.0% 100.0% 100.0% 100.0% 100.0% 100.0% 100.0% 100.0% 100.0% 100.0% 100.0%
Accounting and financial services 87 17 18 19 34 15 18 41 17 29 69 1848.4% 47.1% 40.8% 49.2% 46.9% 44.4% 65.7% 42.3% 42.5% 67.5% 46.9% 55.2%
gh
Construction 26 5 7 4 10 6 5 14 9 4 23 314.6% 12.6% 16.1% 9.9% 13.3% 17.1% 18.1% 14.1% 21.7% 8.9% 16.0% 8.5%
Drivers 39 8 8 9 13 5 10 18 9 11 35 421.7% 21.7% 18.0% 22.2% 18.5% 14.2% 36.0% 19.0% 23.5% 26.0% 23.6% 13.2%
Education 34 8 8 8 12 4 6 13 9 12 28 719.0% 22.4% 18.1% 21.6% 17.0% 11.8% 21.1% 13.3% 23.3% 28.0% 18.9% 19.8%
g
Engineering & technical 44 13 14 5 8 3 10 20 11 13 37 724.4% 34.0% 31.7% 11.8% 10.5% 9.0% 36.5% 20.2% 28.7% 30.0% 25.1% 21.5%
cde cde
Executive recruitment / interimmanagement
55 10 14 11 22 11 9 22 12 21 46 930.7% 27.2% 31.4% 29.8% 31.1% 32.6% 33.3% 23.2% 28.9% 49.3% 31.3% 28.0%
g
Health & social care 32 8 7 6 9 3 8 13 5 14 26 717.9% 21.7% 16.1% 16.7% 12.8% 8.4% 28.8% 13.0% 13.5% 32.9% 17.5% 19.5%
gh
Hospitality 28 2 5 9 15 6 6 7 4 18 24 415.8% 4.7% 11.5% 24.4% 21.3% 17.7% 23.1% 7.1% 9.9% 40.9% 16.7% 11.9%
a a gh
Industrial 23 4 7 4 6 2 6 13 5 6 19 412.8% 11.9% 16.0% 9.9% 7.9% 5.5% 22.2% 13.1% 11.9% 13.2% 12.8% 13.2%
Legal & HR 57 12 11 12 23 11 12 17 16 24 43 1431.9% 31.9% 24.5% 31.4% 31.8% 32.3% 43.6% 18.0% 40.1% 55.7% 29.7% 41.7%
g g
Life sciences 6 1 2 - 1 1 2 2 - 4 5 13.4% 2.4% 4.8% - 1.3% 2.9% 8.1% 2.1% - 9.7% 3.4% 3.6%
gh
Columns Tested: a,b,c,d,e,f - g,h,i - j,k
CATI Fieldwork: 27th September - 19th October 2017 Prepared by ComRes Page 27

Table 20/2
Jobs Outlook - Wave 19Q8_1. Which of the following job functions, if any, are you involved in recruiting for permanent members of staff and temporary agency workers? Permanent members of staffBase: All who recruit permanent members of staff
REGION SIZE SECTOR
Total North MidlandsSouth excluding
LondonSouth including
London London Other 0-49 50-249 250+ Private PublicSignificance Level: 95% a b c d e *f g h i j k
Unweighted Total 180 37 44 38 72 34 27 95 40 45 147 33
Weighted Total 180 37 43 38 72 34 28 97 40 43 146 33100.0% 100.0% 100.0% 100.0% 100.0% 100.0% 100.0% 100.0% 100.0% 100.0% 100.0% 100.0%
Marketing, media & creative 48 7 14 9 18 8 9 20 7 20 42 526.5% 19.2% 31.9% 24.5% 24.5% 24.5% 32.8% 20.7% 18.8% 46.5% 28.8% 16.0%
gh
Office professionals 96 22 20 19 33 14 21 45 21 31 76 2053.6% 60.2% 47.1% 48.9% 45.3% 41.3% 76.6% 46.2% 52.3% 71.6% 51.9% 61.1%
g
Sales & retail 49 10 15 10 16 6 9 26 7 17 41 827.4% 26.3% 33.7% 25.3% 21.8% 17.9% 33.4% 26.6% 17.1% 38.7% 28.0% 24.8%
h
Technology 46 10 8 9 18 9 10 16 11 19 36 925.3% 26.1% 18.0% 23.8% 25.2% 26.8% 35.9% 16.1% 27.8% 43.8% 24.9% 27.1%
g
None 10 1 3 2 5 3 1 8 - 2 8 25.4% 2.3% 6.8% 5.0% 6.9% 9.0% 3.7% 8.0% - 4.6% 5.5% 5.2%
Average number of mentions 3.9 3.8 3.9 3.7 3.5 3.4 5.3 3.2 3.6 5.9 4.0 3.8gh
Columns Tested: a,b,c,d,e,f - g,h,i - j,k
CATI Fieldwork: 27th September - 19th October 2017 Prepared by ComRes Page 28

Table 21/1
Jobs Outlook - Wave 19Q8_2. Which of the following job functions, if any, are you involved in recruiting for permanent members of staff and temporary agency workers? Temporary agency workersBase: All who recruit temporary agency workers
REGION SIZE SECTOR
Total North MidlandsSouth excluding
LondonSouth including
London London Other 0-49 50-249 250+ Private PublicSignificance Level: 95% *a *b *c *d *e *f *g *h *i j *k
Unweighted Total 39 13 10 4 8 4 8 14 12 13 35 4
Weighted Total 38 12 10 4 8 4 8 14 11 12 33 4100.0% 100.0% 100.0% 100.0% 100.0% 100.0% 100.0% 100.0% 100.0% 100.0% 100.0% 100.0%
Accounting and financial services 11 4 2 1 2 1 4 2 3 7 11 130.3% 29.8% 19.2% 23.1% 24.1% 25.0% 49.4% 14.2% 23.0% 55.5% 31.6% 20.1%
Construction 7 1 2 1 1 - 3 4 2 1 7 -18.8% 7.6% 20.6% 28.3% 13.9% - 36.8% 28.5% 17.5% 8.6% 21.2% -
Drivers 9 3 2 1 1 - 4 5 1 4 9 -25.2% 22.3% 18.7% 24.5% 12.1% - 48.9% 34.0% 8.1% 30.4% 28.5% -
Education 5 1 1 - 2 2 1 1 1 3 4 113.9% 10.7% 9.9% - 25.4% 50.0% 12.5% 8.9% 8.7% 24.3% 11.9% 29.4%
Engineering & technical 7 1 4 - - - 2 3 - 4 7 -17.6% 7.1% 38.7% - - - 24.1% 20.4% - 30.3% 19.9% -
Executive recruitment / interimmanagement
8 3 2 - - - 3 2 1 5 8 -20.3% 22.8% 18.7% - - - 37.1% 13.5% 7.6% 39.7% 22.9% -
Health & social care 5 2 - - 2 2 1 1 3 1 5 -12.5% 14.4% - - 25.4% 50.0% 12.5% 6.8% 24.1% 8.6% 14.1% -
Hospitality 3 - 1 - 1 1 1 - - 3 3 -7.8% - 9.4% - 12.7% 25.0% 12.5% - - 23.9% 8.8% -
Industrial 8 2 4 1 1 - 2 3 2 4 8 -22.4% 14.7% 38.7% 24.2% 11.9% - 24.1% 20.4% 16.4% 30.3% 25.3% -
Legal & HR 7 4 1 1 2 1 1 1 2 5 7 -19.6% 30.4% 9.4% 24.5% 24.7% 25.0% 11.5% 6.7% 15.7% 38.0% 22.1% -
Life sciences - - - - - - - - - - - -- - - - - - - - - - - -
Marketing, media & creative 10 2 4 2 2 - 3 4 4 3 10 127.9% 14.2% 39.8% 52.7% 26.0% - 35.1% 27.7% 34.9% 21.8% 28.6% 22.4%
Office professionals 17 4 5 2 3 1 5 7 2 9 16 146.4% 37.4% 49.2% 52.7% 38.7% 25.0% 63.1% 49.3% 16.9% 69.8% 48.8% 28.0%
Sales & retail 6 1 2 1 1 - 2 3 - 3 5 115.4% 7.1% 18.7% 24.5% 12.1% - 26.5% 21.9% - 21.8% 13.8% 28.0%
Columns Tested: a,b,c,d,e,f - g,h,i - j,k
CATI Fieldwork: 27th September - 19th October 2017 Prepared by ComRes Page 29

Table 21/2
Jobs Outlook - Wave 19Q8_2. Which of the following job functions, if any, are you involved in recruiting for permanent members of staff and temporary agency workers? Temporary agency workersBase: All who recruit temporary agency workers
REGION SIZE SECTOR
Total North MidlandsSouth excluding
LondonSouth including
London London Other 0-49 50-249 250+ Private PublicSignificance Level: 95% *a *b *c *d *e *f *g *h *i j *k
Unweighted Total 39 13 10 4 8 4 8 14 12 13 35 4
Weighted Total 38 12 10 4 8 4 8 14 11 12 33 4100.0% 100.0% 100.0% 100.0% 100.0% 100.0% 100.0% 100.0% 100.0% 100.0% 100.0% 100.0%
Technology 7 1 1 1 2 1 3 2 1 4 7 -17.7% 7.1% 9.4% 24.5% 24.7% 25.0% 36.1% 13.8% 7.6% 31.4% 20.0% -
None 3 2 1 - - - - 1 - 2 3 -7.3% 14.6% 10.5% - - - - 7.2% - 14.2% 8.3% -
Average number of mentions 3.2 2.6 3.4 2.8 2.5 2.3 4.3 2.9 1.8 5.1 3.5 1.3
Columns Tested: a,b,c,d,e,f - g,h,i - j,k
CATI Fieldwork: 27th September - 19th October 2017 Prepared by ComRes Page 30

Table 22/1
Jobs Outlook - Wave 19Q10_SUM. Which job functions in your organisation, if any, do you think will see an increase or decrease of permanent members of staff in the next three months? SUMMARY TABLEBase: All who recruit permanent members of staff in each job function
Total Increase greatly Increase slightly Stay the same Decrease slightly Decrease greatly Don't know Net: Increase Net: DecreaseNet: Increase + Stay
the same Mean
Accounting and financial services 87 3 6 73 - - 6 9 - 81 3.1100.0% 3.3% 6.8% 83.4% - - 6.5% 10.1% - 93.5%
Construction 26 2 7 14 3 - 1 9 3 22 3.3100.0% 7.1% 25.9% 51.8% 11.5% - 3.7% 33.0% 11.5% 84.8%
Drivers 39 1 3 32 1 1 2 4 2 35 3.0100.0% 2.5% 7.1% 81.0% 2.5% 2.5% 4.5% 9.5% 4.9% 90.5%
Education 34 1 8 24 - - 2 9 - 32 3.3100.0% 2.8% 22.5% 69.2% - - 5.5% 25.3% - 94.5%
Engineering & technical 44 1 11 29 - - 4 12 - 40 3.3100.0% 2.4% 24.0% 65.0% - - 8.7% 26.3% - 91.3%
Executive recruitment / interimmanagement
55 1 4 47 1 - 3 5 1 51 3.1100.0% 1.6% 6.5% 84.9% 1.8% - 5.1% 8.2% 1.8% 93.1%
Health & social care 32 3 8 18 1 - 3 10 1 28 3.4100.0% 8.5% 23.8% 56.0% 3.0% - 8.8% 32.3% 3.0% 88.2%
Hospitality 28 1 5 21 - - 2 6 - 27 3.3100.0% 3.1% 17.8% 72.6% - - 6.5% 20.9% - 93.5%
Industrial 23 - 4 17 - - 2 4 - 21 3.2100.0% - 16.3% 75.5% - - 8.2% 16.3% - 91.8%
Legal & HR 57 - 3 51 - - 4 3 - 54 3.1100.0% - 4.9% 88.7% - - 6.4% 4.9% - 93.6%
Life sciences 6 - - 5 - - 1 - - 5 3.0100.0% - - 83.1% - - 16.9% - - 83.1%
Marketing, media & creative 48 1 10 32 - - 5 11 - 43 3.3100.0% 2.0% 21.0% 66.8% - - 10.2% 23.0% - 89.8%
Office professionals 96 4 8 80 - - 5 11 - 92 3.2100.0% 4.0% 7.9% 83.4% - - 4.7% 11.9% - 95.3%
Sales & retail 49 2 9 32 1 - 6 10 1 43 3.3100.0% 3.7% 17.4% 65.3% 1.8% - 11.8% 21.1% 1.8% 86.3%
Technology 46 1 6 38 - - 1 7 - 45 3.2100.0% 2.4% 12.9% 82.7% - - 2.1% 15.3% - 97.9%
Average (response based includingbases)
672 20 89 511 7 1 44 109 8 620 3.2100.0% 3.0% 13.2% 76.1% 1.0% .1% 6.6% 16.2% 1.2% 92.2%
CATI Fieldwork: 27th September - 19th October 2017 Prepared by ComRes Page 31

Table 23/1
Jobs Outlook - Wave 19Q10_SUM. Average across all sectors (response based) SUMMARY TABLEBase: All who recruit permanent members of staff in each job function
REGION SIZE SECTOR
Total North MidlandsSouth excluding
LondonSouth including
London London Other 0-49 50-249 250+ Private PublicSignificance Level: 95% a b c d e f g h i j k
Unweighted Total 680 143 159 133 237 104 141 279 148 253 559 121
Weighted Total 672 136 155 134 237 103 143 286 143 243 550 122100.0% 100.0% 100.0% 100.0% 100.0% 100.0% 100.0% 100.0% 100.0% 100.0% 100.0% 100.0%
Increase greatly (5) 20 1 4 4 9 5 6 13 4 4 16 43.0% .6% 2.5% 3.3% 3.9% 4.7% 4.1% 4.4% 2.6% 1.5% 3.0% 2.9%
a
Increase slightly (4) 89 20 25 18 29 11 15 37 27 24 73 1613.2% 14.4% 16.3% 13.3% 12.2% 10.9% 10.2% 13.1% 18.8% 10.0% 13.3% 12.7%
i
Stay same (3) 511 106 118 98 179 80 109 226 107 178 413 9976.1% 77.6% 75.9% 73.2% 75.2% 77.9% 76.3% 79.1% 74.7% 73.4% 75.1% 80.7%
Decrease slightly (2) 7 - - - 4 4 3 5 2 - 5 21.0% - - - 1.6% 3.7% 2.1% 1.7% 1.4% - .9% 1.5%
abc i
Decrease greatly (1) 1 - - - 1 1 - - 1 - 1 -.1% - - - .4% .9% - - .7% - .2% -
Don't know 44 10 8 14 16 2 10 5 3 37 42 36.6% 7.4% 5.2% 10.2% 6.6% 1.9% 7.3% 1.8% 1.8% 15.1% 7.6% 2.2%
e gh k
NETS
Net: Increase 109 21 29 22 38 16 20 50 31 28 89 1916.2% 15.0% 18.9% 16.6% 16.2% 15.6% 14.2% 17.4% 21.4% 11.5% 16.3% 15.6%
i
Net: Decrease 8 - - - 5 5 3 5 3 - 6 21.2% - - - 2.0% 4.6% 2.1% 1.7% 2.0% - 1.1% 1.5%
abc i i
Net: Increase + Stay the same 620 126 147 121 217 96 129 276 138 206 502 11892.2% 92.6% 94.8% 89.8% 91.4% 93.5% 90.6% 96.5% 96.1% 84.9% 91.3% 96.3%
i i
Mean score 3.2 3.2 3.2 3.2 3.2 3.2 3.2 3.2 3.2 3.2 3.2 3.2
Columns Tested: a,b,c,d,e,f - g,h,i - j,k
CATI Fieldwork: 27th September - 19th October 2017 Prepared by ComRes Page 32

Table 24/1
Jobs Outlook - Wave 19Q10_1. Which job functions in your organisation, if any, do you think will see an increase or decrease of permanent members of staff in the next three months? Accounting and financial servicesBase: All who recruit permanent members of staff in each job function
REGION SIZE SECTOR
Total North MidlandsSouth excluding
LondonSouth including
London London Other 0-49 50-249 250+ Private PublicSignificance Level: 95% *a *b *c d *e *f g *h i j *k
Unweighted Total 87 19 18 17 32 15 18 40 17 30 69 18
Weighted Total 87 17 18 19 34 15 18 41 17 29 69 18100.0% 100.0% 100.0% 100.0% 100.0% 100.0% 100.0% 100.0% 100.0% 100.0% 100.0% 100.0%
Increase greatly (5) 3 - 1 1 1 - 1 2 1 - 3 -3.3% - 5.8% 4.8% 2.7% - 5.3% 4.8% 5.4% - 4.2% -
Increase slightly (4) 6 1 2 - 2 2 1 1 1 4 3 36.8% 5.9% 11.4% - 5.7% 13.0% 5.1% 2.6% 6.7% 12.7% 4.7% 14.6%
Stay same (3) 73 16 14 16 28 12 15 38 14 21 58 1583.4% 89.3% 77.4% 85.6% 83.3% 80.5% 83.8% 92.6% 82.8% 70.9% 84.2% 80.7%
i
Decrease slightly (2) - - - - - - - - - - - -- - - - - - - - - - - -
Decrease greatly (1) - - - - - - - - - - - -- - - - - - - - - - - -
Don't know 6 1 1 2 3 1 1 - 1 5 5 16.5% 4.8% 5.5% 9.6% 8.2% 6.5% 5.8% - 5.2% 16.3% 6.9% 4.8%
g
NETS
Net: Increase 9 1 3 1 3 2 2 3 2 4 6 310.1% 5.9% 17.1% 4.8% 8.4% 13.0% 10.4% 7.4% 12.1% 12.7% 8.9% 14.6%
Net: Decrease - - - - - - - - - - - -- - - - - - - - - - - -
Net: Increase + Stay the same 81 17 17 17 31 14 17 41 16 24 64 1893.5% 95.2% 94.5% 90.4% 91.8% 93.5% 94.2% 100.0% 94.8% 83.7% 93.1% 95.2%
i
Mean score 3.1 3.1 3.2 3.1 3.1 3.1 3.2 3.1 3.2 3.2 3.1 3.2
Columns Tested: a,b,c,d,e,f - g,h,i - j,k
CATI Fieldwork: 27th September - 19th October 2017 Prepared by ComRes Page 33

Table 25/1
Jobs Outlook - Wave 19Q10_2. Which job functions in your organisation, if any, do you think will see an increase or decrease of permanent members of staff in the next three months? ConstructionBase: All who recruit permanent members of staff in each job function
REGION SIZE SECTOR
Total North MidlandsSouth excluding
LondonSouth including
London London Other 0-49 50-249 250+ Private PublicSignificance Level: 95% *a *b *c *d *e *f *g *h *i *j *k
Unweighted Total 26 4 7 4 10 6 5 14 8 4 23 3
Weighted Total 26 5 7 4 10 6 5 14 9 4 23 3100.0% 100.0% 100.0% 100.0% 100.0% 100.0% 100.0% 100.0% 100.0% 100.0% 100.0% 100.0%
Increase greatly (5) 2 - - 1 1 - 1 2 - - 2 -7.1% - - 23.3% 9.3% - 19.3% 13.6% - - 8.0% -
Increase slightly (4) 7 3 4 - - - - 2 5 - 7 -25.9% 60.9% 56.7% - - - - 14.2% 55.9% - 29.0% -
Stay same (3) 14 2 3 3 6 3 3 8 3 3 12 251.8% 39.1% 43.3% 76.7% 60.2% 49.3% 59.4% 57.3% 32.9% 74.7% 50.2% 65.5%
Decrease slightly (2) 3 - - - 2 2 1 2 1 - 2 111.5% - - - 20.3% 33.8% 21.3% 14.9% 11.2% - 8.7% 34.5%
Decrease greatly (1) - - - - - - - - - - - -- - - - - - - - - - - -
Don't know 1 - - - 1 1 - - - 1 1 -3.7% - - - 10.1% 16.9% - - - 25.3% 4.2% -
NETS
Net: Increase 9 3 4 1 1 - 1 4 5 - 9 -33.0% 60.9% 56.7% 23.3% 9.3% - 19.3% 27.8% 55.9% - 37.0% -
Net: Decrease 3 - - - 2 2 1 2 1 - 2 111.5% - - - 20.3% 33.8% 21.3% 14.9% 11.2% - 8.7% 34.5%
Net: Increase + Stay the same 22 5 7 4 7 3 4 12 8 3 20 284.8% 100.0% 100.0% 100.0% 69.5% 49.3% 78.7% 85.1% 88.8% 74.7% 87.1% 65.5%
Mean score 3.3 3.6 3.6 3.5 3.0 2.6 3.2 3.3 3.4 3.0 3.4 2.7
Columns Tested: a,b,c,d,e,f - g,h,i - j,k
CATI Fieldwork: 27th September - 19th October 2017 Prepared by ComRes Page 34

Table 26/1
Jobs Outlook - Wave 19Q10_3. Which job functions in your organisation, if any, do you think will see an increase or decrease of permanent members of staff in the next three months? DriversBase: All who recruit permanent members of staff in each job function
REGION SIZE SECTOR
Total North MidlandsSouth excluding
LondonSouth including
London London Other 0-49 50-249 250+ Private PublicSignificance Level: 95% *a *b *c *d *e *f *g *h *i j *k
Unweighted Total 41 9 8 9 14 5 10 19 10 12 36 5
Weighted Total 39 8 8 9 13 5 10 18 9 11 35 4100.0% 100.0% 100.0% 100.0% 100.0% 100.0% 100.0% 100.0% 100.0% 100.0% 100.0% 100.0%
Increase greatly (5) 1 - - - - - 1 1 - - 1 -2.5% - - - - - 9.7% 5.3% - - 2.8% -
Increase slightly (4) 3 2 1 - - - - 1 2 - 3 -7.1% 22.6% 12.2% - - - - 4.9% 19.8% - 8.0% -
Stay same (3) 32 5 7 8 11 4 8 16 7 9 27 481.0% 67.0% 87.8% 89.1% 85.7% 79.7% 80.6% 84.6% 69.9% 84.2% 78.5% 100.0%
Decrease slightly (2) 1 - - - - - 1 1 - - 1 -2.5% - - - - - 9.7% 5.2% - - 2.8% -
Decrease greatly (1) 1 - - - 1 1 - - 1 - 1 -2.5% - - - 7.3% 20.3% - - 10.3% - 2.8% -
Don't know 2 1 - 1 1 - - - - 2 2 -4.5% 10.5% - 10.9% 7.0% - - - - 15.8% 5.1% -
NETS
Net: Increase 4 2 1 - - - 1 2 2 - 4 -9.5% 22.6% 12.2% - - - 9.7% 10.2% 19.8% - 10.8% -
Net: Decrease 2 - - - 1 1 1 1 1 - 2 -4.9% - - - 7.3% 20.3% 9.7% 5.2% 10.3% - 5.6% -
Net: Increase + Stay the same 35 7 8 8 11 4 9 18 8 9 31 490.5% 89.5% 100.0% 89.1% 85.7% 79.7% 90.3% 94.8% 89.7% 84.2% 89.3% 100.0%
Mean score 3.0 3.3 3.1 3.0 2.8 2.6 3.1 3.1 3.0 3.0 3.1 3.0
Columns Tested: a,b,c,d,e,f - g,h,i - j,k
CATI Fieldwork: 27th September - 19th October 2017 Prepared by ComRes Page 35
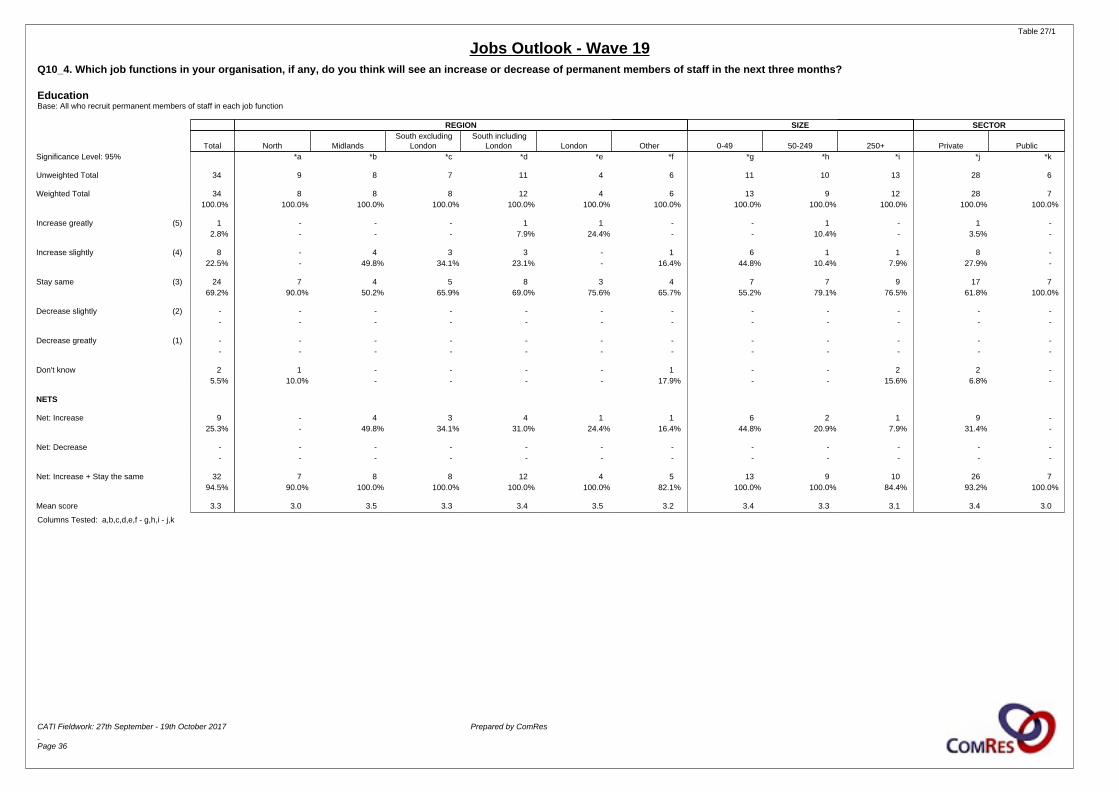
Table 27/1
Jobs Outlook - Wave 19Q10_4. Which job functions in your organisation, if any, do you think will see an increase or decrease of permanent members of staff in the next three months? EducationBase: All who recruit permanent members of staff in each job function
REGION SIZE SECTOR
Total North MidlandsSouth excluding
LondonSouth including
London London Other 0-49 50-249 250+ Private PublicSignificance Level: 95% *a *b *c *d *e *f *g *h *i *j *k
Unweighted Total 34 9 8 7 11 4 6 11 10 13 28 6
Weighted Total 34 8 8 8 12 4 6 13 9 12 28 7100.0% 100.0% 100.0% 100.0% 100.0% 100.0% 100.0% 100.0% 100.0% 100.0% 100.0% 100.0%
Increase greatly (5) 1 - - - 1 1 - - 1 - 1 -2.8% - - - 7.9% 24.4% - - 10.4% - 3.5% -
Increase slightly (4) 8 - 4 3 3 - 1 6 1 1 8 -22.5% - 49.8% 34.1% 23.1% - 16.4% 44.8% 10.4% 7.9% 27.9% -
Stay same (3) 24 7 4 5 8 3 4 7 7 9 17 769.2% 90.0% 50.2% 65.9% 69.0% 75.6% 65.7% 55.2% 79.1% 76.5% 61.8% 100.0%
Decrease slightly (2) - - - - - - - - - - - -- - - - - - - - - - - -
Decrease greatly (1) - - - - - - - - - - - -- - - - - - - - - - - -
Don't know 2 1 - - - - 1 - - 2 2 -5.5% 10.0% - - - - 17.9% - - 15.6% 6.8% -
NETS
Net: Increase 9 - 4 3 4 1 1 6 2 1 9 -25.3% - 49.8% 34.1% 31.0% 24.4% 16.4% 44.8% 20.9% 7.9% 31.4% -
Net: Decrease - - - - - - - - - - - -- - - - - - - - - - - -
Net: Increase + Stay the same 32 7 8 8 12 4 5 13 9 10 26 794.5% 90.0% 100.0% 100.0% 100.0% 100.0% 82.1% 100.0% 100.0% 84.4% 93.2% 100.0%
Mean score 3.3 3.0 3.5 3.3 3.4 3.5 3.2 3.4 3.3 3.1 3.4 3.0
Columns Tested: a,b,c,d,e,f - g,h,i - j,k
CATI Fieldwork: 27th September - 19th October 2017 Prepared by ComRes Page 36

Table 28/1
Jobs Outlook - Wave 19Q10_5. Which job functions in your organisation, if any, do you think will see an increase or decrease of permanent members of staff in the next three months? Engineering & technicalBase: All who recruit permanent members of staff in each job function
REGION SIZE SECTOR
Total North MidlandsSouth excluding
LondonSouth including
London London Other 0-49 50-249 250+ Private PublicSignificance Level: 95% *a *b *c *d *e *f *g *h *i j *k
Unweighted Total 44 12 14 5 8 3 10 19 11 14 37 7
Weighted Total 44 13 14 5 8 3 10 20 11 13 37 7100.0% 100.0% 100.0% 100.0% 100.0% 100.0% 100.0% 100.0% 100.0% 100.0% 100.0% 100.0%
Increase greatly (5) 1 - 1 - - - - 1 - - 1 -2.4% - 7.6% - - - - 5.3% - - 2.8% -
Increase slightly (4) 11 5 1 1 3 2 2 4 5 2 9 224.0% 37.5% 6.8% 20.3% 39.5% 68.2% 18.7% 20.2% 41.5% 14.3% 23.5% 26.4%
Stay same (3) 29 7 10 3 4 1 8 14 7 8 23 565.0% 55.9% 70.6% 59.6% 48.5% 31.8% 81.3% 69.0% 58.5% 64.7% 63.3% 73.6%
Decrease slightly (2) - - - - - - - - - - - -- - - - - - - - - - - -
Decrease greatly (1) - - - - - - - - - - - -- - - - - - - - - - - -
Don't know 4 1 2 1 1 - - 1 - 3 4 -8.7% 6.7% 15.0% 20.1% 12.0% - - 5.5% - 21.0% 10.3% -
NETS
Net: Increase 12 5 2 1 3 2 2 5 5 2 10 226.3% 37.5% 14.4% 20.3% 39.5% 68.2% 18.7% 25.4% 41.5% 14.3% 26.3% 26.4%
Net: Decrease - - - - - - - - - - - -- - - - - - - - - - - -
Net: Increase + Stay the same 40 12 12 4 7 3 10 19 11 10 33 791.3% 93.3% 85.0% 79.9% 88.0% 100.0% 100.0% 94.5% 100.0% 79.0% 89.7% 100.0%
Mean score 3.3 3.4 3.3 3.3 3.4 3.7 3.2 3.3 3.4 3.2 3.3 3.3
Columns Tested: a,b,c,d,e,f - g,h,i - j,k
CATI Fieldwork: 27th September - 19th October 2017 Prepared by ComRes Page 37
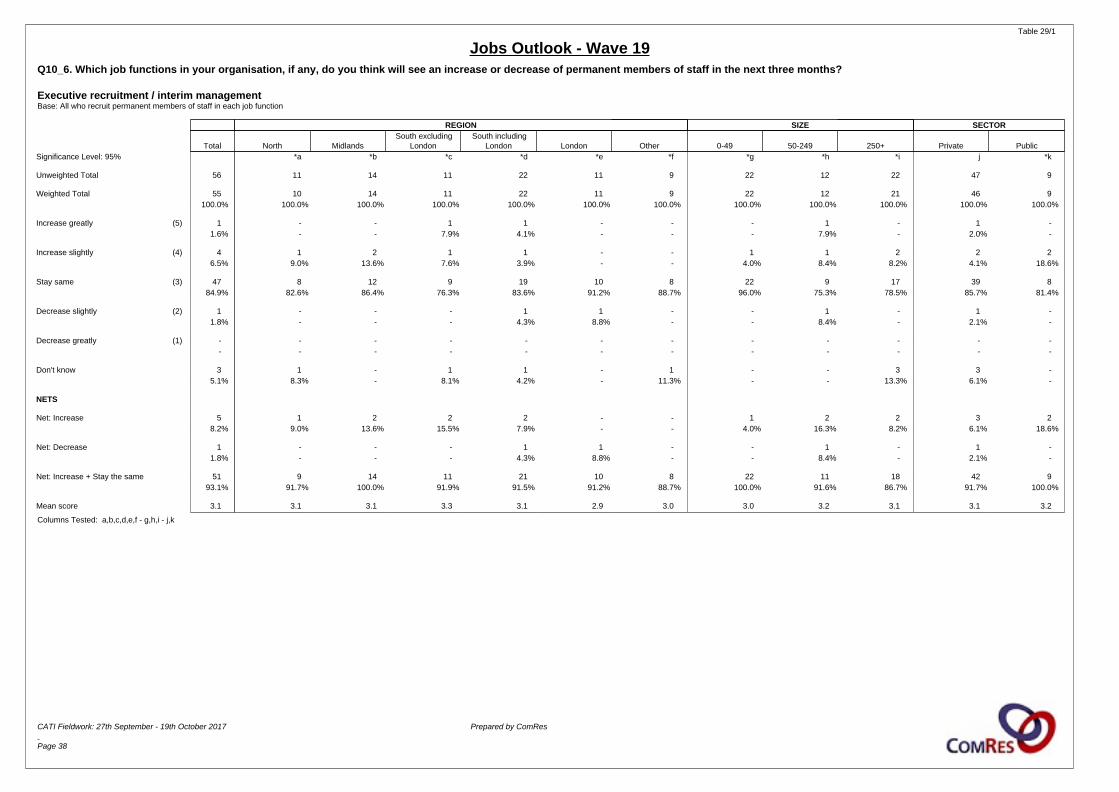
Table 29/1
Jobs Outlook - Wave 19Q10_6. Which job functions in your organisation, if any, do you think will see an increase or decrease of permanent members of staff in the next three months? Executive recruitment / interim managementBase: All who recruit permanent members of staff in each job function
REGION SIZE SECTOR
Total North MidlandsSouth excluding
LondonSouth including
London London Other 0-49 50-249 250+ Private PublicSignificance Level: 95% *a *b *c *d *e *f *g *h *i j *k
Unweighted Total 56 11 14 11 22 11 9 22 12 22 47 9
Weighted Total 55 10 14 11 22 11 9 22 12 21 46 9100.0% 100.0% 100.0% 100.0% 100.0% 100.0% 100.0% 100.0% 100.0% 100.0% 100.0% 100.0%
Increase greatly (5) 1 - - 1 1 - - - 1 - 1 -1.6% - - 7.9% 4.1% - - - 7.9% - 2.0% -
Increase slightly (4) 4 1 2 1 1 - - 1 1 2 2 26.5% 9.0% 13.6% 7.6% 3.9% - - 4.0% 8.4% 8.2% 4.1% 18.6%
Stay same (3) 47 8 12 9 19 10 8 22 9 17 39 884.9% 82.6% 86.4% 76.3% 83.6% 91.2% 88.7% 96.0% 75.3% 78.5% 85.7% 81.4%
Decrease slightly (2) 1 - - - 1 1 - - 1 - 1 -1.8% - - - 4.3% 8.8% - - 8.4% - 2.1% -
Decrease greatly (1) - - - - - - - - - - - -- - - - - - - - - - - -
Don't know 3 1 - 1 1 - 1 - - 3 3 -5.1% 8.3% - 8.1% 4.2% - 11.3% - - 13.3% 6.1% -
NETS
Net: Increase 5 1 2 2 2 - - 1 2 2 3 28.2% 9.0% 13.6% 15.5% 7.9% - - 4.0% 16.3% 8.2% 6.1% 18.6%
Net: Decrease 1 - - - 1 1 - - 1 - 1 -1.8% - - - 4.3% 8.8% - - 8.4% - 2.1% -
Net: Increase + Stay the same 51 9 14 11 21 10 8 22 11 18 42 993.1% 91.7% 100.0% 91.9% 91.5% 91.2% 88.7% 100.0% 91.6% 86.7% 91.7% 100.0%
Mean score 3.1 3.1 3.1 3.3 3.1 2.9 3.0 3.0 3.2 3.1 3.1 3.2
Columns Tested: a,b,c,d,e,f - g,h,i - j,k
CATI Fieldwork: 27th September - 19th October 2017 Prepared by ComRes Page 38

Table 30/1
Jobs Outlook - Wave 19Q10_7. Which job functions in your organisation, if any, do you think will see an increase or decrease of permanent members of staff in the next three months? Health & social careBase: All who recruit permanent members of staff in each job function
REGION SIZE SECTOR
Total North MidlandsSouth excluding
LondonSouth including
London London Other 0-49 50-249 250+ Private PublicSignificance Level: 95% *a *b *c *d *e *f *g *h *i *j *k
Unweighted Total 33 9 7 6 9 3 8 12 6 15 26 7
Weighted Total 32 8 7 6 9 3 8 13 5 14 26 7100.0% 100.0% 100.0% 100.0% 100.0% 100.0% 100.0% 100.0% 100.0% 100.0% 100.0% 100.0%
Increase greatly (5) 3 - 1 - 2 2 - - 1 2 1 28.5% - 12.6% - 20.0% 65.7% - - 18.0% 12.4% 3.8% 27.0%
Increase slightly (4) 8 - 2 5 5 - 1 4 1 3 7 123.8% - 29.8% 72.1% 50.2% - 12.0% 31.6% 17.8% 19.2% 26.5% 13.3%
Stay same (3) 18 7 4 1 2 1 5 7 3 9 15 356.0% 88.8% 57.6% 14.3% 20.4% 34.3% 62.8% 53.7% 48.0% 61.0% 58.4% 46.2%
Decrease slightly (2) 1 - - - - - 1 1 - - 1 -3.0% - - - - - 12.0% 7.6% - - 3.7% -
Decrease greatly (1) - - - - - - - - - - - -- - - - - - - - - - - -
Don't know 3 1 - 1 1 - 1 1 1 1 2 18.8% 11.2% - 13.6% 9.5% - 13.1% 7.1% 16.3% 7.4% 7.6% 13.5%
NETS
Net: Increase 10 - 3 5 6 2 1 4 2 4 8 332.3% - 42.4% 72.1% 70.2% 65.7% 12.0% 31.6% 35.8% 31.6% 30.3% 40.3%
Net: Decrease 1 - - - - - 1 1 - - 1 -3.0% - - - - - 12.0% 7.6% - - 3.7% -
Net: Increase + Stay the same 28 7 7 6 8 3 6 11 5 13 23 688.2% 88.8% 100.0% 86.4% 90.5% 100.0% 74.8% 85.3% 83.7% 92.6% 88.7% 86.5%
Mean score 3.4 3.0 3.6 3.8 4.0 4.3 3.0 3.3 3.6 3.5 3.3 3.8
Columns Tested: a,b,c,d,e,f - g,h,i - j,k
CATI Fieldwork: 27th September - 19th October 2017 Prepared by ComRes Page 39

Table 31/1
Jobs Outlook - Wave 19Q10_8. Which job functions in your organisation, if any, do you think will see an increase or decrease of permanent members of staff in the next three months? HospitalityBase: All who recruit permanent members of staff in each job function
REGION SIZE SECTOR
Total North MidlandsSouth excluding
LondonSouth including
London London Other 0-49 50-249 250+ Private PublicSignificance Level: 95% *a *b *c *d *e *f *g *h *i *j *k
Unweighted Total 28 2 5 9 15 6 6 7 3 18 25 3
Weighted Total 28 2 5 9 15 6 6 7 4 18 24 4100.0% 100.0% 100.0% 100.0% 100.0% 100.0% 100.0% 100.0% 100.0% 100.0% 100.0% 100.0%
Increase greatly (5) 1 - - 1 1 - - 1 - - - 13.1% - - 9.4% 5.8% - - 12.8% - - - 22.2%
Increase slightly (4) 5 - 1 - 2 2 2 - 1 4 5 -17.8% - 20.5% - 12.6% 32.5% 33.0% - 27.2% 22.7% 20.7% -
Stay same (3) 21 2 4 7 11 4 4 6 3 12 18 372.6% 100.0% 79.5% 70.9% 69.6% 67.5% 67.0% 87.2% 72.8% 66.7% 71.7% 77.8%
Decrease slightly (2) - - - - - - - - - - - -- - - - - - - - - - - -
Decrease greatly (1) - - - - - - - - - - - -- - - - - - - - - - - -
Don't know 2 - - 2 2 - - - - 2 2 -6.5% - - 19.7% 12.1% - - - - 10.5% 7.6% -
NETS
Net: Increase 6 - 1 1 3 2 2 1 1 4 5 120.9% - 20.5% 9.4% 18.4% 32.5% 33.0% 12.8% 27.2% 22.7% 20.7% 22.2%
Net: Decrease - - - - - - - - - - - -- - - - - - - - - - - -
Net: Increase + Stay the same 27 2 5 8 13 6 6 7 4 16 23 493.5% 100.0% 100.0% 80.3% 87.9% 100.0% 100.0% 100.0% 100.0% 89.5% 92.4% 100.0%
Mean score 3.3 3.0 3.2 3.2 3.3 3.3 3.3 3.3 3.3 3.3 3.2 3.4
Columns Tested: a,b,c,d,e,f - g,h,i - j,k
CATI Fieldwork: 27th September - 19th October 2017 Prepared by ComRes Page 40
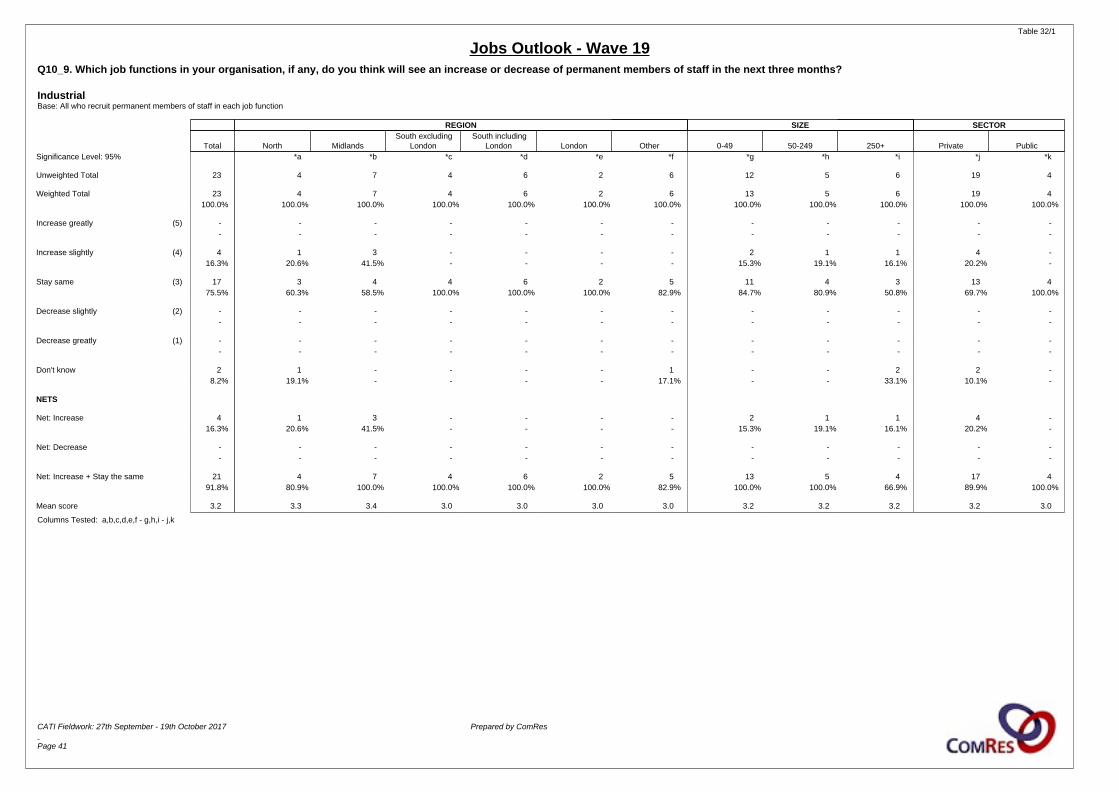
Table 32/1
Jobs Outlook - Wave 19Q10_9. Which job functions in your organisation, if any, do you think will see an increase or decrease of permanent members of staff in the next three months? IndustrialBase: All who recruit permanent members of staff in each job function
REGION SIZE SECTOR
Total North MidlandsSouth excluding
LondonSouth including
London London Other 0-49 50-249 250+ Private PublicSignificance Level: 95% *a *b *c *d *e *f *g *h *i *j *k
Unweighted Total 23 4 7 4 6 2 6 12 5 6 19 4
Weighted Total 23 4 7 4 6 2 6 13 5 6 19 4100.0% 100.0% 100.0% 100.0% 100.0% 100.0% 100.0% 100.0% 100.0% 100.0% 100.0% 100.0%
Increase greatly (5) - - - - - - - - - - - -- - - - - - - - - - - -
Increase slightly (4) 4 1 3 - - - - 2 1 1 4 -16.3% 20.6% 41.5% - - - - 15.3% 19.1% 16.1% 20.2% -
Stay same (3) 17 3 4 4 6 2 5 11 4 3 13 475.5% 60.3% 58.5% 100.0% 100.0% 100.0% 82.9% 84.7% 80.9% 50.8% 69.7% 100.0%
Decrease slightly (2) - - - - - - - - - - - -- - - - - - - - - - - -
Decrease greatly (1) - - - - - - - - - - - -- - - - - - - - - - - -
Don't know 2 1 - - - - 1 - - 2 2 -8.2% 19.1% - - - - 17.1% - - 33.1% 10.1% -
NETS
Net: Increase 4 1 3 - - - - 2 1 1 4 -16.3% 20.6% 41.5% - - - - 15.3% 19.1% 16.1% 20.2% -
Net: Decrease - - - - - - - - - - - -- - - - - - - - - - - -
Net: Increase + Stay the same 21 4 7 4 6 2 5 13 5 4 17 491.8% 80.9% 100.0% 100.0% 100.0% 100.0% 82.9% 100.0% 100.0% 66.9% 89.9% 100.0%
Mean score 3.2 3.3 3.4 3.0 3.0 3.0 3.0 3.2 3.2 3.2 3.2 3.0
Columns Tested: a,b,c,d,e,f - g,h,i - j,k
CATI Fieldwork: 27th September - 19th October 2017 Prepared by ComRes Page 41

Table 33/1
Jobs Outlook - Wave 19Q10_10. Which job functions in your organisation, if any, do you think will see an increase or decrease of permanent members of staff in the next three months? Legal & HRBase: All who recruit permanent members of staff in each job function
REGION SIZE SECTOR
Total North MidlandsSouth excluding
LondonSouth including
London London Other 0-49 50-249 250+ Private PublicSignificance Level: 95% *a *b *c *d *e *f *g *h *i j *k
Unweighted Total 59 13 11 12 23 11 12 17 17 25 45 14
Weighted Total 57 12 11 12 23 11 12 17 16 24 43 14100.0% 100.0% 100.0% 100.0% 100.0% 100.0% 100.0% 100.0% 100.0% 100.0% 100.0% 100.0%
Increase greatly (5) - - - - - - - - - - - -- - - - - - - - - - - -
Increase slightly (4) 3 1 - - - - 2 - 2 1 1 24.9% 7.7% - - - - 15.7% - 11.7% 3.9% 2.1% 13.6%
Stay same (3) 51 10 11 10 21 11 9 17 13 20 40 1188.7% 85.2% 100.0% 85.0% 92.1% 100.0% 75.7% 100.0% 82.8% 84.4% 91.4% 80.1%
Decrease slightly (2) - - - - - - - - - - - -- - - - - - - - - - - -
Decrease greatly (1) - - - - - - - - - - - -- - - - - - - - - - - -
Don't know 4 1 - 2 2 - 1 - 1 3 3 16.4% 7.1% - 15.0% 7.9% - 8.7% - 5.5% 11.7% 6.5% 6.3%
NETS
Net: Increase 3 1 - - - - 2 - 2 1 1 24.9% 7.7% - - - - 15.7% - 11.7% 3.9% 2.1% 13.6%
Net: Decrease - - - - - - - - - - - -- - - - - - - - - - - -
Net: Increase + Stay the same 54 11 11 10 21 11 11 17 15 21 41 1393.6% 92.9% 100.0% 85.0% 92.1% 100.0% 91.3% 100.0% 94.5% 88.3% 93.5% 93.7%
Mean score 3.1 3.1 3.0 3.0 3.0 3.0 3.2 3.0 3.1 3.0 3.0 3.1
Columns Tested: a,b,c,d,e,f - g,h,i - j,k
CATI Fieldwork: 27th September - 19th October 2017 Prepared by ComRes Page 42

Table 34/1
Jobs Outlook - Wave 19Q10_11. Which job functions in your organisation, if any, do you think will see an increase or decrease of permanent members of staff in the next three months? Life sciencesBase: All who recruit permanent members of staff in each job function
REGION SIZE SECTOR
Total North MidlandsSouth excluding
LondonSouth including
London London Other 0-49 50-249 250+ Private PublicSignificance Level: 95% *a *b *c *d *e *f *g *h *i *j *k
Unweighted Total 6 1 2 - 1 1 2 2 - 4 5 1
Weighted Total 6 1 2 - 1 1 2 2 - 4 5 1100.0% 100.0% 100.0% - 100.0% 100.0% 100.0% 100.0% - 100.0% 100.0% 100.0%
Increase greatly (5) - - - - - - - - - - - -- - - - - - - - - - - -
Increase slightly (4) - - - - - - - - - - - -- - - - - - - - - - - -
Stay same (3) 5 1 2 - 1 1 1 2 - 3 4 183.1% 100.0% 100.0% - 100.0% 100.0% 53.6% 100.0% - 74.9% 79.0% 100.0%
Decrease slightly (2) - - - - - - - - - - - -- - - - - - - - - - - -
Decrease greatly (1) - - - - - - - - - - - -- - - - - - - - - - - -
Don't know 1 - - - - - 1 - - 1 1 -16.9% - - - - - 46.4% - - 25.1% 21.0% -
NETS
Net: Increase - - - - - - - - - - - -- - - - - - - - - - - -
Net: Decrease - - - - - - - - - - - -- - - - - - - - - - - -
Net: Increase + Stay the same 5 1 2 - 1 1 1 2 - 3 4 183.1% 100.0% 100.0% - 100.0% 100.0% 53.6% 100.0% - 74.9% 79.0% 100.0%
Mean score 3.0 3.0 3.0 - 3.0 3.0 3.0 3.0 - 3.0 3.0 3.0
Columns Tested: a,b,c,d,e,f - g,h,i - j,k
CATI Fieldwork: 27th September - 19th October 2017 Prepared by ComRes Page 43

Table 35/1
Jobs Outlook - Wave 19Q10_12. Which job functions in your organisation, if any, do you think will see an increase or decrease of permanent members of staff in the next three months? Marketing, media & creativeBase: All who recruit permanent members of staff in each job function
REGION SIZE SECTOR
Total North MidlandsSouth excluding
LondonSouth including
London London Other 0-49 50-249 250+ Private PublicSignificance Level: 95% *a *b *c *d *e *f *g *h *i j *k
Unweighted Total 49 8 14 10 18 8 9 20 8 21 43 6
Weighted Total 48 7 14 9 18 8 9 20 7 20 42 5100.0% 100.0% 100.0% 100.0% 100.0% 100.0% 100.0% 100.0% 100.0% 100.0% 100.0% 100.0%
Increase greatly (5) 1 - - - - - 1 1 - - 1 -2.0% - - - - - 10.7% 4.8% - - 2.3% -
Increase slightly (4) 10 1 3 3 5 2 1 6 2 2 9 121.0% 14.4% 21.3% 30.2% 28.6% 26.8% 10.6% 30.5% 24.6% 10.1% 21.5% 16.3%
Stay same (3) 32 5 9 6 12 6 6 12 6 14 27 466.8% 73.8% 63.8% 59.9% 66.1% 73.2% 67.2% 59.3% 75.4% 71.1% 64.6% 83.7%
Decrease slightly (2) - - - - - - - - - - - -- - - - - - - - - - - -
Decrease greatly (1) - - - - - - - - - - - -- - - - - - - - - - - -
Don't know 5 1 2 1 1 - 1 1 - 4 5 -10.2% 11.8% 14.9% 9.9% 5.3% - 11.5% 5.4% - 18.9% 11.5% -
NETS
Net: Increase 11 1 3 3 5 2 2 7 2 2 10 123.0% 14.4% 21.3% 30.2% 28.6% 26.8% 21.3% 35.3% 24.6% 10.1% 23.8% 16.3%
Net: Decrease - - - - - - - - - - - -- - - - - - - - - - - -
Net: Increase + Stay the same 43 6 12 8 17 8 8 19 7 16 37 589.8% 88.2% 85.1% 90.1% 94.7% 100.0% 88.5% 94.6% 100.0% 81.1% 88.5% 100.0%
Mean score 3.3 3.2 3.3 3.3 3.3 3.3 3.4 3.4 3.2 3.1 3.3 3.2
Columns Tested: a,b,c,d,e,f - g,h,i - j,k
CATI Fieldwork: 27th September - 19th October 2017 Prepared by ComRes Page 44

Table 36/1
Jobs Outlook - Wave 19Q10_13. Which job functions in your organisation, if any, do you think will see an increase or decrease of permanent members of staff in the next three months? Office professionalsBase: All who recruit permanent members of staff in each job function
REGION SIZE SECTOR
Total North MidlandsSouth excluding
LondonSouth including
London London Other 0-49 50-249 250+ Private PublicSignificance Level: 95% *a *b *c d *e *f g *h i j *k
Unweighted Total 97 22 21 19 33 14 21 43 22 32 77 20
Weighted Total 96 22 20 19 33 14 21 45 21 31 76 20100.0% 100.0% 100.0% 100.0% 100.0% 100.0% 100.0% 100.0% 100.0% 100.0% 100.0% 100.0%
Increase greatly (5) 4 - 1 1 2 1 1 4 - - 3 14.0% - 5.0% 4.7% 5.7% 7.0% 4.6% 8.6% - - 3.9% 4.3%
Increase slightly (4) 8 3 2 - 1 1 2 3 4 1 5 37.9% 12.1% 9.4% - 3.4% 8.0% 9.1% 6.4% 18.6% 2.8% 6.3% 13.8%
Stay same (3) 80 18 17 16 28 12 17 38 17 25 64 1783.4% 80.4% 85.6% 85.4% 85.3% 85.1% 81.4% 85.0% 81.4% 82.4% 83.8% 81.9%
Decrease slightly (2) - - - - - - - - - - - -- - - - - - - - - - - -
Decrease greatly (1) - - - - - - - - - - - -- - - - - - - - - - - -
Don't know 5 2 - 2 2 - 1 - - 5 5 -4.7% 7.5% - 9.9% 5.7% - 4.9% - - 14.8% 6.0% -
g
NETS
Net: Increase 11 3 3 1 3 2 3 7 4 1 8 411.9% 12.1% 14.4% 4.7% 9.0% 14.9% 13.7% 15.0% 18.6% 2.8% 10.2% 18.1%
Net: Decrease - - - - - - - - - - - -- - - - - - - - - - - -
Net: Increase + Stay the same 92 21 20 17 31 14 20 45 21 26 71 2095.3% 92.5% 100.0% 90.1% 94.3% 100.0% 95.1% 100.0% 100.0% 85.2% 94.0% 100.0%
i
Mean score 3.2 3.1 3.2 3.1 3.2 3.2 3.2 3.2 3.2 3.0 3.2 3.2
Columns Tested: a,b,c,d,e,f - g,h,i - j,k
CATI Fieldwork: 27th September - 19th October 2017 Prepared by ComRes Page 45

Table 37/1
Jobs Outlook - Wave 19Q10_14. Which job functions in your organisation, if any, do you think will see an increase or decrease of permanent members of staff in the next three months? Sales & retailBase: All who recruit permanent members of staff in each job function
REGION SIZE SECTOR
Total North MidlandsSouth excluding
LondonSouth including
London London Other 0-49 50-249 250+ Private PublicSignificance Level: 95% *a *b *c *d *e *f *g *h *i j *k
Unweighted Total 50 10 15 10 16 6 9 25 7 18 42 8
Weighted Total 49 10 15 10 16 6 9 26 7 17 41 8100.0% 100.0% 100.0% 100.0% 100.0% 100.0% 100.0% 100.0% 100.0% 100.0% 100.0% 100.0%
Increase greatly (5) 2 1 - - - - 1 1 - 1 2 -3.7% 8.5% - - - - 10.5% 3.8% - 5.0% 4.4% -
Increase slightly (4) 9 2 - 4 6 2 1 5 - 4 8 117.4% 19.5% - 38.8% 36.3% 32.2% 10.4% 19.0% - 22.1% 18.8% 10.6%
Stay same (3) 32 6 12 5 8 3 6 17 7 8 26 765.3% 63.3% 79.2% 51.7% 52.2% 52.9% 67.8% 65.8% 100.0% 50.4% 62.6% 78.6%
Decrease slightly (2) 1 - - - 1 1 - 1 - - - 11.8% - - - 5.7% 14.9% - 3.5% - - - 10.8%
Decrease greatly (1) - - - - - - - - - - - -- - - - - - - - - - - -
Don't know 6 1 3 1 1 - 1 2 - 4 6 -11.8% 8.6% 20.8% 9.4% 5.8% - 11.3% 8.0% - 22.6% 14.2% -
NETS
Net: Increase 10 3 - 4 6 2 2 6 - 5 10 121.1% 28.1% - 38.8% 36.3% 32.2% 20.9% 22.8% - 27.0% 23.2% 10.6%
Net: Decrease 1 - - - 1 1 - 1 - - - 11.8% - - - 5.7% 14.9% - 3.5% - - - 10.8%
Net: Increase + Stay the same 43 9 12 9 14 5 8 23 7 13 35 786.3% 91.4% 79.2% 90.6% 88.5% 85.1% 88.7% 88.5% 100.0% 77.4% 85.8% 89.2%
Mean score 3.3 3.4 3.0 3.4 3.3 3.2 3.4 3.3 3.0 3.4 3.3 3.0
Columns Tested: a,b,c,d,e,f - g,h,i - j,k
CATI Fieldwork: 27th September - 19th October 2017 Prepared by ComRes Page 46
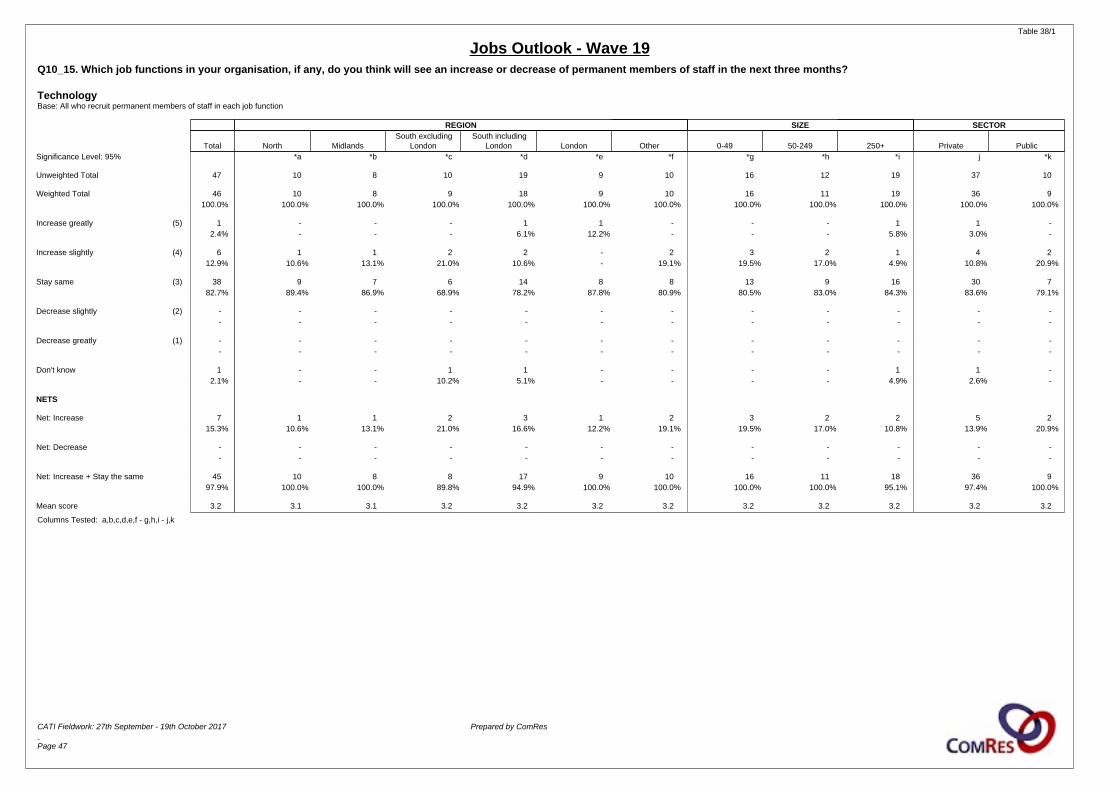
Table 38/1
Jobs Outlook - Wave 19Q10_15. Which job functions in your organisation, if any, do you think will see an increase or decrease of permanent members of staff in the next three months? TechnologyBase: All who recruit permanent members of staff in each job function
REGION SIZE SECTOR
Total North MidlandsSouth excluding
LondonSouth including
London London Other 0-49 50-249 250+ Private PublicSignificance Level: 95% *a *b *c *d *e *f *g *h *i j *k
Unweighted Total 47 10 8 10 19 9 10 16 12 19 37 10
Weighted Total 46 10 8 9 18 9 10 16 11 19 36 9100.0% 100.0% 100.0% 100.0% 100.0% 100.0% 100.0% 100.0% 100.0% 100.0% 100.0% 100.0%
Increase greatly (5) 1 - - - 1 1 - - - 1 1 -2.4% - - - 6.1% 12.2% - - - 5.8% 3.0% -
Increase slightly (4) 6 1 1 2 2 - 2 3 2 1 4 212.9% 10.6% 13.1% 21.0% 10.6% - 19.1% 19.5% 17.0% 4.9% 10.8% 20.9%
Stay same (3) 38 9 7 6 14 8 8 13 9 16 30 782.7% 89.4% 86.9% 68.9% 78.2% 87.8% 80.9% 80.5% 83.0% 84.3% 83.6% 79.1%
Decrease slightly (2) - - - - - - - - - - - -- - - - - - - - - - - -
Decrease greatly (1) - - - - - - - - - - - -- - - - - - - - - - - -
Don't know 1 - - 1 1 - - - - 1 1 -2.1% - - 10.2% 5.1% - - - - 4.9% 2.6% -
NETS
Net: Increase 7 1 1 2 3 1 2 3 2 2 5 215.3% 10.6% 13.1% 21.0% 16.6% 12.2% 19.1% 19.5% 17.0% 10.8% 13.9% 20.9%
Net: Decrease - - - - - - - - - - - -- - - - - - - - - - - -
Net: Increase + Stay the same 45 10 8 8 17 9 10 16 11 18 36 997.9% 100.0% 100.0% 89.8% 94.9% 100.0% 100.0% 100.0% 100.0% 95.1% 97.4% 100.0%
Mean score 3.2 3.1 3.1 3.2 3.2 3.2 3.2 3.2 3.2 3.2 3.2 3.2
Columns Tested: a,b,c,d,e,f - g,h,i - j,k
CATI Fieldwork: 27th September - 19th October 2017 Prepared by ComRes Page 47

Table 39/1
Jobs Outlook - Wave 19Q11_SUM. Which job functions in your organisation, if any, do you think will see an increase or decrease of permanent members of staff in the next four to twelve months? SUMMARY TABLEBase: All who recruit permanent members of staff in each job function
Total Increase greatly Increase slightly Stay the same Decrease slightly Decrease greatly Don't know Net: Increase Net: DecreaseNet: Increase + Stay
the same Mean
Accounting and financial services 87 1 9 70 1 - 6 10 1 80 3.1100.0% 1.2% 10.1% 80.3% 1.0% - 7.4% 11.2% 1.0% 91.5%
Construction 26 1 9 14 - - 2 10 - 24 3.4100.0% 3.4% 34.0% 55.2% - - 7.4% 37.4% - 92.6%
Drivers 39 - 8 26 1 1 4 8 2 33 3.1100.0% - 19.6% 66.1% 2.5% 2.5% 9.4% 19.6% 4.9% 85.7%
Education 34 2 13 19 - - 1 15 - 33 3.5100.0% 5.6% 37.5% 54.4% - - 2.4% 43.2% - 97.6%
Engineering & technical 44 1 11 27 1 - 4 12 1 39 3.3100.0% 2.4% 24.3% 62.5% 2.4% - 8.4% 26.7% 2.4% 89.2%
Executive recruitment / interimmanagement
55 - 6 45 1 1 3 6 2 51 3.1100.0% - 10.7% 81.1% 1.6% 1.8% 4.9% 10.7% 3.4% 91.8%
Health & social care 32 2 9 17 1 - 3 11 1 29 3.4100.0% 5.7% 29.2% 53.7% 3.0% - 8.4% 35.0% 3.0% 88.7%
Hospitality 28 - 5 22 - - 2 5 - 27 3.2100.0% - 17.5% 76.0% - - 6.5% 17.5% - 93.5%
Industrial 23 - 7 14 - - 3 7 - 20 3.3100.0% - 29.0% 59.2% - - 11.8% 29.0% - 88.2%
Legal & HR 57 - 5 47 1 - 5 5 1 52 3.1100.0% - 8.4% 82.1% 1.5% - 7.9% 8.4% 1.5% 90.5%
Life sciences 6 - - 6 - - - - - 6 3.0100.0% - - 100.0% - - - - - 100.0%
Marketing, media & creative 48 - 12 31 1 - 4 12 1 43 3.3100.0% - 25.1% 65.4% 1.9% - 7.7% 25.1% 1.9% 90.4%
Office professionals 96 1 16 72 1 - 6 17 1 89 3.2100.0% 1.1% 16.4% 75.0% .9% - 6.6% 17.5% .9% 92.5%
Sales & retail 49 1 11 33 1 - 4 12 1 45 3.3100.0% 1.7% 22.1% 67.0% 1.8% - 7.4% 23.7% 1.8% 90.8%
Technology 46 - 8 33 2 - 3 8 2 41 3.1100.0% - 17.2% 72.6% 4.0% - 6.2% 17.2% 4.0% 89.7%
Average (response based includingbases)
672 9 127 476 10 2 48 136 12 612 3.2100.0% 1.3% 18.9% 70.9% 1.5% .3% 7.1% 20.2% 1.8% 91.1%
CATI Fieldwork: 27th September - 19th October 2017 Prepared by ComRes Page 48

Table 40/1
Jobs Outlook - Wave 19Q11_SUM. Average across all sectors (response based) SUMMARY TABLEBase: All who recruit permanent members of staff in each job function
REGION SIZE SECTOR
Total North MidlandsSouth excluding
LondonSouth including
London London Other 0-49 50-249 250+ Private PublicSignificance Level: 95% a b c d e f g h i j k
Unweighted Total 680 143 159 133 237 104 141 279 148 253 559 121
Weighted Total 672 136 155 134 237 103 143 286 143 243 550 122100.0% 100.0% 100.0% 100.0% 100.0% 100.0% 100.0% 100.0% 100.0% 100.0% 100.0% 100.0%
Increase greatly (5) 9 1 3 1 3 2 2 5 2 2 8 11.3% .6% 2.0% .7% 1.2% 1.8% 1.3% 1.7% 1.3% .7% 1.4% .7%
Increase slightly (4) 127 32 25 26 47 21 23 61 28 38 113 1418.9% 23.4% 16.1% 19.7% 19.9% 20.3% 16.1% 21.4% 19.4% 15.7% 20.6% 11.2%
k
Stay same (3) 476 94 114 94 163 69 106 217 99 160 388 8870.9% 68.6% 73.5% 70.1% 68.6% 66.7% 74.0% 75.9% 69.3% 65.9% 70.6% 72.4%
i
Decrease slightly (2) 10 - 7 - 1 1 2 2 - 8 4 61.5% - 4.7% - .4% .9% 1.4% .6% - 3.4% .7% 5.1%
acd gh j
Decrease greatly (1) 2 - - - 2 2 - - 2 - 2 -.3% - - - .8% 1.9% - - 1.4% - .4% -
Don't know 48 10 6 13 22 9 10 1 12 34 35 137.1% 7.4% 3.7% 9.6% 9.1% 8.5% 7.1% .3% 8.6% 14.2% 6.3% 10.5%
b b g g
NETS
Net: Increase 136 33 28 27 50 23 25 66 30 40 121 1520.2% 24.0% 18.1% 20.3% 21.1% 22.1% 17.4% 23.1% 20.7% 16.4% 22.0% 12.0%
k
Net: Decrease 12 - 7 - 3 3 2 2 2 8 6 61.8% - 4.7% - 1.2% 2.7% 1.4% .6% 1.4% 3.4% 1.1% 5.1%
acd a g j
Net: Increase + Stay the same 612 126 142 122 213 91 131 283 129 200 509 10391.1% 92.6% 91.6% 90.4% 89.7% 88.8% 91.4% 99.0% 90.1% 82.4% 92.6% 84.4%
hi i k
Mean score 3.2 3.3 3.2 3.2 3.2 3.2 3.2 3.2 3.2 3.2 3.2 3.1k
Columns Tested: a,b,c,d,e,f - g,h,i - j,k
CATI Fieldwork: 27th September - 19th October 2017 Prepared by ComRes Page 49

Table 41/1
Jobs Outlook - Wave 19Q11_1. Which job functions in your organisation, if any, do you think will see an increase or decrease of permanent members of staff in the next four to twelve months? Accounting and financial servicesBase: All who recruit permanent members of staff in each job function
REGION SIZE SECTOR
Total North MidlandsSouth excluding
LondonSouth including
London London Other 0-49 50-249 250+ Private PublicSignificance Level: 95% *a *b *c d *e *f g *h i j *k
Unweighted Total 87 19 18 17 32 15 18 40 17 30 69 18
Weighted Total 87 17 18 19 34 15 18 41 17 29 69 18100.0% 100.0% 100.0% 100.0% 100.0% 100.0% 100.0% 100.0% 100.0% 100.0% 100.0% 100.0%
Increase greatly (5) 1 - 1 - - - - 1 - - 1 -1.2% - 5.8% - - - - 2.5% - - 1.5% -
Increase slightly (4) 9 3 2 1 3 2 1 3 2 4 7 210.1% 16.2% 11.6% 4.9% 8.6% 13.3% 5.3% 7.0% 11.6% 13.5% 10.1% 9.8%
Stay same (3) 70 14 13 16 27 11 16 37 13 20 56 1480.3% 78.9% 72.1% 85.6% 80.3% 73.7% 89.6% 90.6% 77.5% 67.5% 81.6% 75.6%
i
Decrease slightly (2) 1 - 1 - - - - - - 1 - 11.0% - 5.1% - - - - - - 3.1% - 4.8%
Decrease greatly (1) - - - - - - - - - - - -- - - - - - - - - - - -
Don't know 6 1 1 2 4 2 1 - 2 5 5 27.4% 4.8% 5.5% 9.6% 11.1% 13.0% 5.1% - 10.9% 15.9% 6.8% 9.8%
g
NETS
Net: Increase 10 3 3 1 3 2 1 4 2 4 8 211.2% 16.2% 17.4% 4.9% 8.6% 13.3% 5.3% 9.4% 11.6% 13.5% 11.6% 9.8%
Net: Decrease 1 - 1 - - - - - - 1 - 11.0% - 5.1% - - - - - - 3.1% - 4.8%
Net: Increase + Stay the same 80 17 16 17 30 13 17 41 15 24 64 1691.5% 95.2% 89.5% 90.4% 88.9% 87.0% 94.9% 100.0% 89.1% 81.0% 93.2% 85.4%
i
Mean score 3.1 3.2 3.2 3.1 3.1 3.2 3.1 3.1 3.1 3.1 3.1 3.1
Columns Tested: a,b,c,d,e,f - g,h,i - j,k
CATI Fieldwork: 27th September - 19th October 2017 Prepared by ComRes Page 50

Table 42/1
Jobs Outlook - Wave 19Q11_2. Which job functions in your organisation, if any, do you think will see an increase or decrease of permanent members of staff in the next four to twelve months? ConstructionBase: All who recruit permanent members of staff in each job function
REGION SIZE SECTOR
Total North MidlandsSouth excluding
LondonSouth including
London London Other 0-49 50-249 250+ Private PublicSignificance Level: 95% *a *b *c *d *e *f *g *h *i *j *k
Unweighted Total 26 4 7 4 10 6 5 14 8 4 23 3
Weighted Total 26 5 7 4 10 6 5 14 9 4 23 3100.0% 100.0% 100.0% 100.0% 100.0% 100.0% 100.0% 100.0% 100.0% 100.0% 100.0% 100.0%
Increase greatly (5) 1 - - 1 1 - - 1 - - 1 -3.4% - - 23.3% 9.3% - - 6.5% - - 3.8% -
Increase slightly (4) 9 3 2 1 2 1 2 5 4 - 9 -34.0% 60.9% 28.9% 27.8% 21.2% 16.9% 40.6% 36.8% 44.7% - 38.1% -
Stay same (3) 14 2 4 2 6 4 3 8 3 4 12 355.2% 39.1% 57.2% 48.9% 59.4% 66.3% 59.4% 56.7% 32.9% 100.0% 49.8% 100.0%
Decrease slightly (2) - - - - - - - - - - - -- - - - - - - - - - - -
Decrease greatly (1) - - - - - - - - - - - -- - - - - - - - - - - -
Don't know 2 - 1 - 1 1 - - 2 - 2 -7.4% - 13.9% - 10.1% 16.8% - - 22.4% - 8.3% -
NETS
Net: Increase 10 3 2 2 3 1 2 6 4 - 10 -37.4% 60.9% 28.9% 51.1% 30.5% 16.9% 40.6% 43.3% 44.7% - 42.0% -
Net: Decrease - - - - - - - - - - - -- - - - - - - - - - - -
Net: Increase + Stay the same 24 5 6 4 9 5 5 14 7 4 21 392.6% 100.0% 86.1% 100.0% 89.9% 83.2% 100.0% 100.0% 77.6% 100.0% 91.7% 100.0%
Mean score 3.4 3.6 3.3 3.7 3.4 3.2 3.4 3.5 3.6 3.0 3.5 3.0
Columns Tested: a,b,c,d,e,f - g,h,i - j,k
CATI Fieldwork: 27th September - 19th October 2017 Prepared by ComRes Page 51

Table 43/1
Jobs Outlook - Wave 19Q11_3. Which job functions in your organisation, if any, do you think will see an increase or decrease of permanent members of staff in the next four to twelve months? DriversBase: All who recruit permanent members of staff in each job function
REGION SIZE SECTOR
Total North MidlandsSouth excluding
LondonSouth including
London London Other 0-49 50-249 250+ Private PublicSignificance Level: 95% *a *b *c *d *e *f *g *h *i j *k
Unweighted Total 41 9 8 9 14 5 10 19 10 12 36 5
Weighted Total 39 8 8 9 13 5 10 18 9 11 35 4100.0% 100.0% 100.0% 100.0% 100.0% 100.0% 100.0% 100.0% 100.0% 100.0% 100.0% 100.0%
Increase greatly (5) - - - - - - - - - - - -- - - - - - - - - - - -
Increase slightly (4) 8 3 1 2 2 - 2 5 2 1 8 -19.6% 33.8% 12.2% 22.8% 14.6% - 20.5% 26.5% 19.8% 8.0% 22.1% -
Stay same (3) 26 4 7 6 8 3 6 13 6 8 22 466.1% 55.7% 87.8% 66.2% 63.8% 59.5% 60.6% 68.3% 59.5% 67.9% 64.4% 79.1%
Decrease slightly (2) 1 - - - - - 1 1 - - 1 -2.5% - - - - - 9.7% 5.2% - - 2.8% -
Decrease greatly (1) 1 - - - 1 1 - - 1 - 1 -2.5% - - - 7.3% 20.3% - - 10.3% - 2.8% -
Don't know 4 1 - 1 2 1 1 - 1 3 3 19.4% 10.5% - 10.9% 14.3% 20.3% 9.3% - 10.3% 24.1% 7.9% 20.9%
NETS
Net: Increase 8 3 1 2 2 - 2 5 2 1 8 -19.6% 33.8% 12.2% 22.8% 14.6% - 20.5% 26.5% 19.8% 8.0% 22.1% -
Net: Decrease 2 - - - 1 1 1 1 1 - 2 -4.9% - - - 7.3% 20.3% 9.7% 5.2% 10.3% - 5.6% -
Net: Increase + Stay the same 33 7 8 8 10 3 8 18 7 9 30 485.7% 89.5% 100.0% 89.1% 78.4% 59.5% 81.0% 94.8% 79.3% 75.9% 86.5% 79.1%
Mean score 3.1 3.4 3.1 3.3 3.0 2.5 3.1 3.2 3.0 3.1 3.1 3.0
Columns Tested: a,b,c,d,e,f - g,h,i - j,k
CATI Fieldwork: 27th September - 19th October 2017 Prepared by ComRes Page 52

Table 44/1
Jobs Outlook - Wave 19Q11_4. Which job functions in your organisation, if any, do you think will see an increase or decrease of permanent members of staff in the next four to twelve months? EducationBase: All who recruit permanent members of staff in each job function
REGION SIZE SECTOR
Total North MidlandsSouth excluding
LondonSouth including
London London Other 0-49 50-249 250+ Private PublicSignificance Level: 95% *a *b *c *d *e *f *g *h *i *j *k
Unweighted Total 34 9 8 7 11 4 6 11 10 13 28 6
Weighted Total 34 8 8 8 12 4 6 13 9 12 28 7100.0% 100.0% 100.0% 100.0% 100.0% 100.0% 100.0% 100.0% 100.0% 100.0% 100.0% 100.0%
Increase greatly (5) 2 - - - 1 1 1 1 1 - 2 -5.6% - - - 7.9% 24.4% 16.4% 7.5% 10.4% - 7.0% -
Increase slightly (4) 13 2 3 3 6 3 2 7 2 4 12 137.5% 26.2% 37.4% 34.1% 47.5% 75.6% 32.8% 55.3% 20.7% 31.4% 41.9% 19.1%
Stay same (3) 19 5 5 5 5 - 3 5 6 7 13 554.4% 63.8% 62.6% 65.9% 44.6% - 50.8% 37.2% 68.9% 61.7% 48.1% 80.9%
Decrease slightly (2) - - - - - - - - - - - -- - - - - - - - - - - -
Decrease greatly (1) - - - - - - - - - - - -- - - - - - - - - - - -
Don't know 1 1 - - - - - - - 1 1 -2.4% 10.0% - - - - - - - 6.9% 3.0% -
NETS
Net: Increase 15 2 3 3 7 4 3 8 3 4 14 143.2% 26.2% 37.4% 34.1% 55.4% 100.0% 49.2% 62.8% 31.1% 31.4% 48.9% 19.1%
Net: Decrease - - - - - - - - - - - -- - - - - - - - - - - -
Net: Increase + Stay the same 33 7 8 8 12 4 6 13 9 11 27 797.6% 90.0% 100.0% 100.0% 100.0% 100.0% 100.0% 100.0% 100.0% 93.1% 97.0% 100.0%
Mean score 3.5 3.3 3.4 3.3 3.6 4.2 3.7 3.7 3.4 3.3 3.6 3.2
Columns Tested: a,b,c,d,e,f - g,h,i - j,k
CATI Fieldwork: 27th September - 19th October 2017 Prepared by ComRes Page 53

Table 45/1
Jobs Outlook - Wave 19Q11_5. Which job functions in your organisation, if any, do you think will see an increase or decrease of permanent members of staff in the next four to twelve months? Engineering & technicalBase: All who recruit permanent members of staff in each job function
REGION SIZE SECTOR
Total North MidlandsSouth excluding
LondonSouth including
London London Other 0-49 50-249 250+ Private PublicSignificance Level: 95% *a *b *c *d *e *f *g *h *i j *k
Unweighted Total 44 12 14 5 8 3 10 19 11 14 37 7
Weighted Total 44 13 14 5 8 3 10 20 11 13 37 7100.0% 100.0% 100.0% 100.0% 100.0% 100.0% 100.0% 100.0% 100.0% 100.0% 100.0% 100.0%
Increase greatly (5) 1 - 1 - - - - 1 - - 1 -2.4% - 7.6% - - - - 5.3% - - 2.8% -
Increase slightly (4) 11 4 2 2 3 1 2 4 6 1 10 124.3% 30.3% 14.8% 40.3% 38.7% 36.3% 19.1% 20.8% 50.0% 7.1% 26.5% 13.5%
Stay same (3) 27 8 10 3 4 1 6 15 5 8 22 562.5% 63.1% 70.6% 59.7% 48.5% 31.8% 61.4% 74.0% 41.5% 63.6% 60.3% 73.6%
Decrease slightly (2) 1 - - - - - 1 - - 1 1 -2.4% - - - - - 10.4% - - 8.1% 2.8% -
Decrease greatly (1) - - - - - - - - - - - -- - - - - - - - - - - -
Don't know 4 1 1 - 1 1 1 - 1 3 3 18.4% 6.7% 7.1% - 12.8% 31.8% 9.2% - 8.5% 21.1% 7.5% 12.9%
NETS
Net: Increase 12 4 3 2 3 1 2 5 6 1 11 126.7% 30.3% 22.3% 40.3% 38.7% 36.3% 19.1% 26.0% 50.0% 7.1% 29.3% 13.5%
Net: Decrease 1 - - - - - 1 - - 1 1 -2.4% - - - - - 10.4% - - 8.1% 2.8% -
Net: Increase + Stay the same 39 12 13 5 7 2 8 20 10 9 33 689.2% 93.3% 92.9% 100.0% 87.2% 68.2% 80.5% 100.0% 91.5% 70.8% 89.6% 87.1%
Mean score 3.3 3.3 3.3 3.4 3.4 3.5 3.1 3.3 3.5 3.0 3.3 3.2
Columns Tested: a,b,c,d,e,f - g,h,i - j,k
CATI Fieldwork: 27th September - 19th October 2017 Prepared by ComRes Page 54

Table 46/1
Jobs Outlook - Wave 19Q11_6. Which job functions in your organisation, if any, do you think will see an increase or decrease of permanent members of staff in the next four to twelve months? Executive recruitment / interim managementBase: All who recruit permanent members of staff in each job function
REGION SIZE SECTOR
Total North MidlandsSouth excluding
LondonSouth including
London London Other 0-49 50-249 250+ Private PublicSignificance Level: 95% *a *b *c *d *e *f *g *h *i j *k
Unweighted Total 56 11 14 11 22 11 9 22 12 22 47 9
Weighted Total 55 10 14 11 22 11 9 22 12 21 46 9100.0% 100.0% 100.0% 100.0% 100.0% 100.0% 100.0% 100.0% 100.0% 100.0% 100.0% 100.0%
Increase greatly (5) - - - - - - - - - - - -- - - - - - - - - - - -
Increase slightly (4) 6 1 1 2 4 2 - 2 - 4 5 110.7% 8.9% 8.3% 15.6% 17.2% 19.0% - 9.3% - 17.8% 10.9% 9.3%
Stay same (3) 45 8 12 9 17 8 8 20 11 14 38 781.1% 82.7% 85.1% 76.3% 74.3% 72.2% 90.0% 90.7% 91.6% 65.3% 83.1% 71.4%
Decrease slightly (2) 1 - 1 - - - - - - 1 - 11.6% - 6.6% - - - - - - 4.2% - 9.5%
Decrease greatly (1) 1 - - - 1 1 - - 1 - 1 -1.8% - - - 4.3% 8.8% - - 8.4% - 2.1% -
Don't know 3 1 - 1 1 - 1 - - 3 2 14.9% 8.3% - 8.1% 4.2% - 10.0% - - 12.7% 3.9% 9.9%
NETS
Net: Increase 6 1 1 2 4 2 - 2 - 4 5 110.7% 8.9% 8.3% 15.6% 17.2% 19.0% - 9.3% - 17.8% 10.9% 9.3%
Net: Decrease 2 - 1 - 1 1 - - 1 1 1 13.4% - 6.6% - 4.3% 8.8% - - 8.4% 4.2% 2.1% 9.5%
Net: Increase + Stay the same 51 9 13 11 21 10 8 22 11 18 43 891.8% 91.7% 93.4% 91.9% 91.5% 91.2% 90.0% 100.0% 91.6% 83.1% 94.0% 80.6%
Mean score 3.1 3.1 3.0 3.2 3.1 3.0 3.0 3.1 2.8 3.2 3.1 3.0
Columns Tested: a,b,c,d,e,f - g,h,i - j,k
CATI Fieldwork: 27th September - 19th October 2017 Prepared by ComRes Page 55

Table 47/1
Jobs Outlook - Wave 19Q11_7. Which job functions in your organisation, if any, do you think will see an increase or decrease of permanent members of staff in the next four to twelve months? Health & social careBase: All who recruit permanent members of staff in each job function
REGION SIZE SECTOR
Total North MidlandsSouth excluding
LondonSouth including
London London Other 0-49 50-249 250+ Private PublicSignificance Level: 95% *a *b *c *d *e *f *g *h *i *j *k
Unweighted Total 33 9 7 6 9 3 8 12 6 15 26 7
Weighted Total 32 8 7 6 9 3 8 13 5 14 26 7100.0% 100.0% 100.0% 100.0% 100.0% 100.0% 100.0% 100.0% 100.0% 100.0% 100.0% 100.0%
Increase greatly (5) 2 - - - 1 1 1 - 1 1 1 15.7% - - - 9.6% 31.4% 12.0% - 17.8% 6.2% 3.7% 13.6%
Increase slightly (4) 9 1 4 4 4 - 1 5 1 4 7 329.2% 11.2% 56.3% 58.0% 40.3% - 11.0% 39.2% 16.3% 25.2% 26.5% 40.2%
Stay same (3) 17 6 2 2 4 2 5 7 3 8 16 153.7% 77.6% 29.9% 28.4% 40.7% 68.6% 65.4% 53.7% 49.6% 55.3% 62.6% 18.5%
Decrease slightly (2) 1 - 1 - - - - - - 1 1 -3.0% - 13.7% - - - - - - 6.7% 3.7% -
Decrease greatly (1) - - - - - - - - - - - -- - - - - - - - - - - -
Don't know 3 1 - 1 1 - 1 1 1 1 1 28.4% 11.2% - 13.6% 9.5% - 11.6% 7.1% 16.3% 6.5% 3.5% 27.7%
NETS
Net: Increase 11 1 4 4 5 1 2 5 2 4 8 435.0% 11.2% 56.3% 58.0% 49.9% 31.4% 23.0% 39.2% 34.1% 31.5% 30.2% 53.8%
Net: Decrease 1 - 1 - - - - - - 1 1 -3.0% - 13.7% - - - - - - 6.7% 3.7% -
Net: Increase + Stay the same 29 7 6 6 8 3 7 12 5 12 24 588.7% 88.8% 86.3% 86.4% 90.5% 100.0% 88.4% 92.9% 83.7% 86.7% 92.8% 72.3%
Mean score 3.4 3.1 3.4 3.7 3.7 3.6 3.4 3.4 3.6 3.3 3.3 3.9
Columns Tested: a,b,c,d,e,f - g,h,i - j,k
CATI Fieldwork: 27th September - 19th October 2017 Prepared by ComRes Page 56

Table 48/1
Jobs Outlook - Wave 19Q11_8. Which job functions in your organisation, if any, do you think will see an increase or decrease of permanent members of staff in the next four to twelve months? HospitalityBase: All who recruit permanent members of staff in each job function
REGION SIZE SECTOR
Total North MidlandsSouth excluding
LondonSouth including
London London Other 0-49 50-249 250+ Private PublicSignificance Level: 95% *a *b *c *d *e *f *g *h *i *j *k
Unweighted Total 28 2 5 9 15 6 6 7 3 18 25 3
Weighted Total 28 2 5 9 15 6 6 7 4 18 24 4100.0% 100.0% 100.0% 100.0% 100.0% 100.0% 100.0% 100.0% 100.0% 100.0% 100.0% 100.0%
Increase greatly (5) - - - - - - - - - - - -- - - - - - - - - - - -
Increase slightly (4) 5 - - 2 4 2 1 2 - 3 5 -17.5% - - 19.7% 25.6% 34.8% 16.7% 28.7% - 17.1% 20.4% -
Stay same (3) 22 2 5 6 10 4 5 5 4 13 18 476.0% 100.0% 100.0% 60.6% 62.4% 65.2% 83.3% 71.3% 100.0% 72.4% 72.0% 100.0%
Decrease slightly (2) - - - - - - - - - - - -- - - - - - - - - - - -
Decrease greatly (1) - - - - - - - - - - - -- - - - - - - - - - - -
Don't know 2 - - 2 2 - - - - 2 2 -6.5% - - 19.7% 12.1% - - - - 10.5% 7.6% -
NETS
Net: Increase 5 - - 2 4 2 1 2 - 3 5 -17.5% - - 19.7% 25.6% 34.8% 16.7% 28.7% - 17.1% 20.4% -
Net: Decrease - - - - - - - - - - - -- - - - - - - - - - - -
Net: Increase + Stay the same 27 2 5 8 13 6 6 7 4 16 23 493.5% 100.0% 100.0% 80.3% 87.9% 100.0% 100.0% 100.0% 100.0% 89.5% 92.4% 100.0%
Mean score 3.2 3.0 3.0 3.2 3.3 3.3 3.2 3.3 3.0 3.2 3.2 3.0
Columns Tested: a,b,c,d,e,f - g,h,i - j,k
CATI Fieldwork: 27th September - 19th October 2017 Prepared by ComRes Page 57

Table 49/1
Jobs Outlook - Wave 19Q11_9. Which job functions in your organisation, if any, do you think will see an increase or decrease of permanent members of staff in the next four to twelve months? IndustrialBase: All who recruit permanent members of staff in each job function
REGION SIZE SECTOR
Total North MidlandsSouth excluding
LondonSouth including
London London Other 0-49 50-249 250+ Private PublicSignificance Level: 95% *a *b *c *d *e *f *g *h *i *j *k
Unweighted Total 23 4 7 4 6 2 6 12 5 6 19 4
Weighted Total 23 4 7 4 6 2 6 13 5 6 19 4100.0% 100.0% 100.0% 100.0% 100.0% 100.0% 100.0% 100.0% 100.0% 100.0% 100.0% 100.0%
Increase greatly (5) - - - - - - - - - - - -- - - - - - - - - - - -
Increase slightly (4) 7 1 4 1 1 - 1 4 2 1 7 -29.0% 20.6% 56.4% 24.6% 16.5% - 15.7% 30.3% 41.1% 16.1% 35.8% -
Stay same (3) 14 3 3 3 4 1 4 9 2 3 10 359.2% 60.3% 43.6% 75.4% 66.4% 48.0% 69.2% 69.7% 38.4% 52.9% 54.5% 79.1%
Decrease slightly (2) - - - - - - - - - - - -- - - - - - - - - - - -
Decrease greatly (1) - - - - - - - - - - - -- - - - - - - - - - - -
Don't know 3 1 - - 1 1 1 - 1 2 2 111.8% 19.1% - - 17.1% 52.0% 15.1% - 20.5% 31.0% 9.7% 20.9%
NETS
Net: Increase 7 1 4 1 1 - 1 4 2 1 7 -29.0% 20.6% 56.4% 24.6% 16.5% - 15.7% 30.3% 41.1% 16.1% 35.8% -
Net: Decrease - - - - - - - - - - - -- - - - - - - - - - - -
Net: Increase + Stay the same 20 4 7 4 5 1 5 13 4 4 17 388.2% 80.9% 100.0% 100.0% 82.9% 48.0% 84.9% 100.0% 79.5% 69.0% 90.3% 79.1%
Mean score 3.3 3.3 3.6 3.2 3.2 3.0 3.2 3.3 3.5 3.2 3.4 3.0
Columns Tested: a,b,c,d,e,f - g,h,i - j,k
CATI Fieldwork: 27th September - 19th October 2017 Prepared by ComRes Page 58

Table 50/1
Jobs Outlook - Wave 19Q11_10. Which job functions in your organisation, if any, do you think will see an increase or decrease of permanent members of staff in the next four to twelve months? Legal & HRBase: All who recruit permanent members of staff in each job function
REGION SIZE SECTOR
Total North MidlandsSouth excluding
LondonSouth including
London London Other 0-49 50-249 250+ Private PublicSignificance Level: 95% *a *b *c *d *e *f *g *h *i j *k
Unweighted Total 59 13 11 12 23 11 12 17 17 25 45 14
Weighted Total 57 12 11 12 23 11 12 17 16 24 43 14100.0% 100.0% 100.0% 100.0% 100.0% 100.0% 100.0% 100.0% 100.0% 100.0% 100.0% 100.0%
Increase greatly (5) - - - - - - - - - - - -- - - - - - - - - - - -
Increase slightly (4) 5 2 - - 1 1 2 - 2 3 4 18.4% 15.3% - - 4.8% 10.2% 15.9% - 12.1% 12.1% 8.9% 6.9%
Stay same (3) 47 9 10 10 19 9 9 17 12 18 37 1082.1% 77.5% 91.6% 85.0% 83.1% 80.9% 76.4% 100.0% 76.3% 72.9% 84.8% 73.7%
Decrease slightly (2) 1 - 1 - - - - - - 1 - 11.5% - 8.4% - - - - - - 3.7% - 6.4%
Decrease greatly (1) - - - - - - - - - - - -- - - - - - - - - - - -
Don't know 5 1 - 2 3 1 1 - 2 3 3 27.9% 7.1% - 15.0% 12.1% 8.9% 7.7% - 11.6% 11.2% 6.3% 12.9%
NETS
Net: Increase 5 2 - - 1 1 2 - 2 3 4 18.4% 15.3% - - 4.8% 10.2% 15.9% - 12.1% 12.1% 8.9% 6.9%
Net: Decrease 1 - 1 - - - - - - 1 - 11.5% - 8.4% - - - - - - 3.7% - 6.4%
Net: Increase + Stay the same 52 11 10 10 20 10 11 17 14 20 41 1190.5% 92.9% 91.6% 85.0% 87.9% 91.1% 92.3% 100.0% 88.4% 85.1% 93.7% 80.7%
Mean score 3.1 3.2 2.9 3.0 3.1 3.1 3.2 3.0 3.1 3.1 3.1 3.0
Columns Tested: a,b,c,d,e,f - g,h,i - j,k
CATI Fieldwork: 27th September - 19th October 2017 Prepared by ComRes Page 59

Table 51/1
Jobs Outlook - Wave 19Q11_11. Which job functions in your organisation, if any, do you think will see an increase or decrease of permanent members of staff in the next four to twelve months? Life sciencesBase: All who recruit permanent members of staff in each job function
REGION SIZE SECTOR
Total North MidlandsSouth excluding
LondonSouth including
London London Other 0-49 50-249 250+ Private PublicSignificance Level: 95% *a *b *c *d *e *f *g *h *i *j *k
Unweighted Total 6 1 2 - 1 1 2 2 - 4 5 1
Weighted Total 6 1 2 - 1 1 2 2 - 4 5 1100.0% 100.0% 100.0% - 100.0% 100.0% 100.0% 100.0% - 100.0% 100.0% 100.0%
Increase greatly (5) - - - - - - - - - - - -- - - - - - - - - - - -
Increase slightly (4) - - - - - - - - - - - -- - - - - - - - - - - -
Stay same (3) 6 1 2 - 1 1 2 2 - 4 5 1100.0% 100.0% 100.0% - 100.0% 100.0% 100.0% 100.0% - 100.0% 100.0% 100.0%
Decrease slightly (2) - - - - - - - - - - - -- - - - - - - - - - - -
Decrease greatly (1) - - - - - - - - - - - -- - - - - - - - - - - -
Don't know - - - - - - - - - - - -- - - - - - - - - - - -
NETS
Net: Increase - - - - - - - - - - - -- - - - - - - - - - - -
Net: Decrease - - - - - - - - - - - -- - - - - - - - - - - -
Net: Increase + Stay the same 6 1 2 - 1 1 2 2 - 4 5 1100.0% 100.0% 100.0% - 100.0% 100.0% 100.0% 100.0% - 100.0% 100.0% 100.0%
Mean score 3.0 3.0 3.0 - 3.0 3.0 3.0 3.0 - 3.0 3.0 3.0
Columns Tested: a,b,c,d,e,f - g,h,i - j,k
CATI Fieldwork: 27th September - 19th October 2017 Prepared by ComRes Page 60

Table 52/1
Jobs Outlook - Wave 19Q11_12. Which job functions in your organisation, if any, do you think will see an increase or decrease of permanent members of staff in the next four to twelve months? Marketing, media & creativeBase: All who recruit permanent members of staff in each job function
REGION SIZE SECTOR
Total North MidlandsSouth excluding
LondonSouth including
London London Other 0-49 50-249 250+ Private PublicSignificance Level: 95% *a *b *c *d *e *f *g *h *i j *k
Unweighted Total 49 8 14 10 18 8 9 20 8 21 43 6
Weighted Total 48 7 14 9 18 8 9 20 7 20 42 5100.0% 100.0% 100.0% 100.0% 100.0% 100.0% 100.0% 100.0% 100.0% 100.0% 100.0% 100.0%
Increase greatly (5) - - - - - - - - - - - -- - - - - - - - - - - -
Increase slightly (4) 12 2 2 3 6 3 2 6 3 3 12 -25.1% 27.3% 14.5% 30.6% 34.3% 38.5% 21.3% 30.4% 38.8% 14.7% 28.2% -
Stay same (3) 31 4 10 6 11 5 6 14 5 13 28 465.4% 60.9% 72.0% 59.5% 60.4% 61.5% 68.5% 69.6% 61.2% 62.6% 65.3% 66.0%
Decrease slightly (2) 1 - 1 - - - - - - 1 - 11.9% - 6.5% - - - - - - 4.4% - 16.6%
Decrease greatly (1) - - - - - - - - - - - -- - - - - - - - - - - -
Don't know 4 1 1 1 1 - 1 - - 4 3 17.7% 11.8% 7.0% 9.9% 5.3% - 10.2% - - 18.3% 6.5% 17.4%
NETS
Net: Increase 12 2 2 3 6 3 2 6 3 3 12 -25.1% 27.3% 14.5% 30.6% 34.3% 38.5% 21.3% 30.4% 38.8% 14.7% 28.2% -
Net: Decrease 1 - 1 - - - - - - 1 - 11.9% - 6.5% - - - - - - 4.4% - 16.6%
Net: Increase + Stay the same 43 6 12 8 17 8 8 20 7 16 39 490.4% 88.2% 86.5% 90.1% 94.7% 100.0% 89.8% 100.0% 100.0% 77.3% 93.5% 66.0%
Mean score 3.3 3.3 3.1 3.3 3.4 3.4 3.2 3.3 3.4 3.1 3.3 2.8
Columns Tested: a,b,c,d,e,f - g,h,i - j,k
CATI Fieldwork: 27th September - 19th October 2017 Prepared by ComRes Page 61

Table 53/1
Jobs Outlook - Wave 19Q11_13. Which job functions in your organisation, if any, do you think will see an increase or decrease of permanent members of staff in the next four to twelve months? Office professionalsBase: All who recruit permanent members of staff in each job function
REGION SIZE SECTOR
Total North MidlandsSouth excluding
LondonSouth including
London London Other 0-49 50-249 250+ Private PublicSignificance Level: 95% *a *b *c d *e *f g *h i j *k
Unweighted Total 97 22 21 19 33 14 21 43 22 32 77 20
Weighted Total 96 22 20 19 33 14 21 45 21 31 76 20100.0% 100.0% 100.0% 100.0% 100.0% 100.0% 100.0% 100.0% 100.0% 100.0% 100.0% 100.0%
Increase greatly (5) 1 - 1 - - - - 1 - - 1 -1.1% - 5.0% - - - - 2.3% - - 1.3% -
Increase slightly (4) 16 5 2 2 5 3 4 8 4 4 14 216.4% 20.5% 10.6% 9.9% 15.4% 22.9% 19.3% 18.2% 18.6% 12.4% 18.0% 10.6%
Stay same (3) 72 16 15 15 25 10 16 36 15 22 56 1675.0% 72.0% 75.3% 80.3% 76.0% 70.1% 76.3% 79.5% 72.1% 70.3% 73.5% 80.5%
Decrease slightly (2) 1 - 1 - - - - - - 1 - 1.9% - 4.4% - - - - - - 2.9% - 4.3%
Decrease greatly (1) - - - - - - - - - - - -- - - - - - - - - - - -
Don't know 6 2 1 2 3 1 1 - 2 4 5 16.6% 7.5% 4.8% 9.9% 8.6% 7.0% 4.4% - 9.3% 14.4% 7.2% 4.5%
g
NETS
Net: Increase 17 5 3 2 5 3 4 9 4 4 15 217.5% 20.5% 15.6% 9.9% 15.4% 22.9% 19.3% 20.5% 18.6% 12.4% 19.3% 10.6%
Net: Decrease 1 - 1 - - - - - - 1 - 1.9% - 4.4% - - - - - - 2.9% - 4.3%
Net: Increase + Stay the same 89 21 18 17 30 13 20 45 19 26 71 1992.5% 92.5% 90.9% 90.1% 91.4% 93.0% 95.6% 100.0% 90.7% 82.7% 92.8% 91.1%
i
Mean score 3.2 3.2 3.2 3.1 3.2 3.2 3.2 3.2 3.2 3.1 3.2 3.1
Columns Tested: a,b,c,d,e,f - g,h,i - j,k
CATI Fieldwork: 27th September - 19th October 2017 Prepared by ComRes Page 62
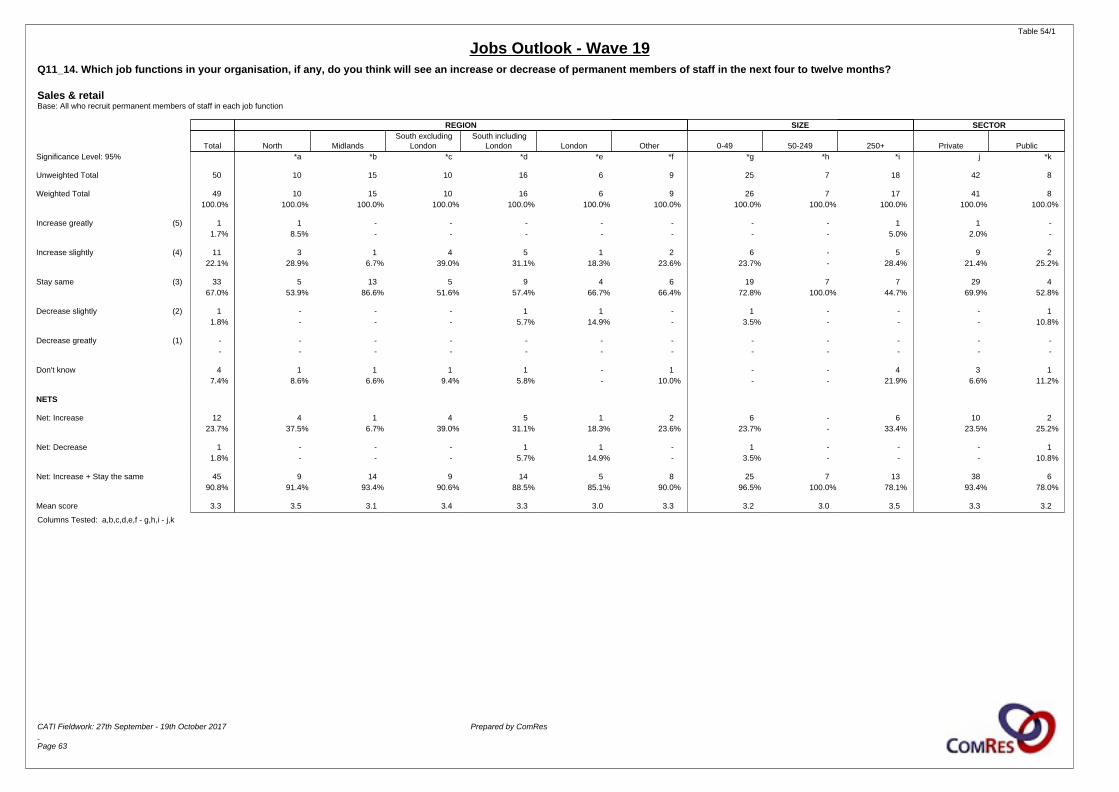
Table 54/1
Jobs Outlook - Wave 19Q11_14. Which job functions in your organisation, if any, do you think will see an increase or decrease of permanent members of staff in the next four to twelve months? Sales & retailBase: All who recruit permanent members of staff in each job function
REGION SIZE SECTOR
Total North MidlandsSouth excluding
LondonSouth including
London London Other 0-49 50-249 250+ Private PublicSignificance Level: 95% *a *b *c *d *e *f *g *h *i j *k
Unweighted Total 50 10 15 10 16 6 9 25 7 18 42 8
Weighted Total 49 10 15 10 16 6 9 26 7 17 41 8100.0% 100.0% 100.0% 100.0% 100.0% 100.0% 100.0% 100.0% 100.0% 100.0% 100.0% 100.0%
Increase greatly (5) 1 1 - - - - - - - 1 1 -1.7% 8.5% - - - - - - - 5.0% 2.0% -
Increase slightly (4) 11 3 1 4 5 1 2 6 - 5 9 222.1% 28.9% 6.7% 39.0% 31.1% 18.3% 23.6% 23.7% - 28.4% 21.4% 25.2%
Stay same (3) 33 5 13 5 9 4 6 19 7 7 29 467.0% 53.9% 86.6% 51.6% 57.4% 66.7% 66.4% 72.8% 100.0% 44.7% 69.9% 52.8%
Decrease slightly (2) 1 - - - 1 1 - 1 - - - 11.8% - - - 5.7% 14.9% - 3.5% - - - 10.8%
Decrease greatly (1) - - - - - - - - - - - -- - - - - - - - - - - -
Don't know 4 1 1 1 1 - 1 - - 4 3 17.4% 8.6% 6.6% 9.4% 5.8% - 10.0% - - 21.9% 6.6% 11.2%
NETS
Net: Increase 12 4 1 4 5 1 2 6 - 6 10 223.7% 37.5% 6.7% 39.0% 31.1% 18.3% 23.6% 23.7% - 33.4% 23.5% 25.2%
Net: Decrease 1 - - - 1 1 - 1 - - - 11.8% - - - 5.7% 14.9% - 3.5% - - - 10.8%
Net: Increase + Stay the same 45 9 14 9 14 5 8 25 7 13 38 690.8% 91.4% 93.4% 90.6% 88.5% 85.1% 90.0% 96.5% 100.0% 78.1% 93.4% 78.0%
Mean score 3.3 3.5 3.1 3.4 3.3 3.0 3.3 3.2 3.0 3.5 3.3 3.2
Columns Tested: a,b,c,d,e,f - g,h,i - j,k
CATI Fieldwork: 27th September - 19th October 2017 Prepared by ComRes Page 63

Table 55/1
Jobs Outlook - Wave 19Q11_15. Which job functions in your organisation, if any, do you think will see an increase or decrease of permanent members of staff in the next four to twelve months? TechnologyBase: All who recruit permanent members of staff in each job function
REGION SIZE SECTOR
Total North MidlandsSouth excluding
LondonSouth including
London London Other 0-49 50-249 250+ Private PublicSignificance Level: 95% *a *b *c *d *e *f *g *h *i j *k
Unweighted Total 47 10 8 10 19 9 10 16 12 19 37 10
Weighted Total 46 10 8 9 18 9 10 16 11 19 36 9100.0% 100.0% 100.0% 100.0% 100.0% 100.0% 100.0% 100.0% 100.0% 100.0% 100.0% 100.0%
Increase greatly (5) - - - - - - - - - - - -- - - - - - - - - - - -
Increase slightly (4) 8 4 1 1 2 1 1 4 1 3 7 117.2% 38.7% 13.1% 11.0% 11.6% 12.2% 9.7% 25.3% 8.8% 15.4% 18.8% 10.7%
Stay same (3) 33 6 5 7 14 7 8 12 9 12 27 672.6% 61.3% 63.2% 78.8% 77.9% 77.0% 80.9% 74.7% 82.5% 65.0% 73.4% 69.2%
Decrease slightly (2) 2 - 2 - - - - - - 2 1 14.0% - 23.8% - - - - - - 9.7% 2.6% 9.8%
Decrease greatly (1) - - - - - - - - - - - -- - - - - - - - - - - -
Don't know 3 - - 1 2 1 1 - 1 2 2 16.2% - - 10.2% 10.5% 10.7% 9.3% - 8.8% 9.9% 5.2% 10.2%
NETS
Net: Increase 8 4 1 1 2 1 1 4 1 3 7 117.2% 38.7% 13.1% 11.0% 11.6% 12.2% 9.7% 25.3% 8.8% 15.4% 18.8% 10.7%
Net: Decrease 2 - 2 - - - - - - 2 1 14.0% - 23.8% - - - - - - 9.7% 2.6% 9.8%
Net: Increase + Stay the same 41 10 6 8 16 8 9 16 10 15 34 789.7% 100.0% 76.2% 89.8% 89.5% 89.3% 90.7% 100.0% 91.2% 80.4% 92.2% 79.9%
Mean score 3.1 3.4 2.9 3.1 3.1 3.1 3.1 3.3 3.1 3.1 3.2 3.0
Columns Tested: a,b,c,d,e,f - g,h,i - j,k
CATI Fieldwork: 27th September - 19th October 2017 Prepared by ComRes Page 64

Table 56/1
Jobs Outlook - Wave 19Q12. In which, if any, of these job functions do you expect to find a shortage of appropriate candidates for permanent roles?Base: All who recruit permanent members of staff in each job function
REGION SIZE SECTOR
Total North MidlandsSouth excluding
LondonSouth including
London London Other 0-49 50-249 250+ Private PublicSignificance Level: 95% a b c d e *f g h i j k
Unweighted Total 170 36 41 36 67 31 26 87 40 43 139 31
Weighted Total 170 36 40 37 67 31 27 89 40 41 138 32100.0% 100.0% 100.0% 100.0% 100.0% 100.0% 100.0% 100.0% 100.0% 100.0% 100.0% 100.0%
Accounting and financial services 13 2 3 3 5 2 3 5 4 4 10 314.5% 10.7% 15.9% 14.9% 14.7% 14.5% 16.6% 12.5% 22.2% 12.9% 14.4% 15.0%
Construction 11 3 3 1 3 2 2 6 4 1 11 -40.9% 60.9% 41.1% 27.8% 31.3% 33.7% 40.6% 43.9% 43.9% 23.8% 45.9% -
Drivers 8 1 4 - 1 1 2 5 2 1 8 -19.7% 11.3% 48.9% - 7.3% 20.3% 20.5% 26.4% 20.5% 8.2% 22.3% -
Education 7 1 4 2 3 1 - 3 1 4 7 121.9% 10.0% 48.1% 23.2% 23.6% 24.4% - 22.4% 10.4% 30.2% 24.0% 13.2%
Engineering & technical 16 6 5 1 3 2 2 7 5 4 15 135.7% 44.7% 35.1% 19.2% 38.8% 68.2% 23.1% 36.9% 40.7% 29.5% 40.4% 12.1%
Executive recruitment / interimmanagement
8 3 3 - 2 2 1 3 3 3 8 115.4% 27.6% 20.5% - 8.6% 17.7% 10.9% 13.1% 24.6% 12.7% 16.6% 9.3%
Health & social care 14 5 3 4 5 1 1 3 4 7 11 343.0% 66.2% 42.2% 55.8% 49.2% 34.3% 13.1% 22.9% 65.9% 52.2% 43.7% 40.2%
Hospitality 6 - - 4 5 1 1 2 2 2 3 320.2% - - 39.4% 30.4% 16.3% 16.7% 28.2% 48.2% 10.7% 12.1% 69.7%
Industrial 6 1 4 - - - 1 3 1 2 6 -25.8% 20.6% 54.7% - - - 21.0% 25.5% 19.1% 32.2% 32.0% -
Legal & HR 3 2 - - 1 1 - 1 2 - 3 -5.3% 16.3% - - 4.8% 10.2% - 6.3% 12.0% - 7.0% -
Life sciences 1 - 1 - - - - - - 1 1 -15.3% - 45.8% - - - - - - 22.8% 19.0% -
Marketing, media & creative 4 - - 1 1 - 3 2 - 2 4 -8.3% - - 9.8% 5.2% - 33.3% 9.9% - 9.8% 9.3% -
Office professionals 10 5 1 2 3 1 2 7 2 2 8 310.7% 20.5% 5.0% 9.6% 8.5% 7.0% 9.3% 14.7% 9.2% 5.9% 10.1% 12.8%
Sales & retail 10 2 1 3 4 1 3 7 - 3 8 219.9% 17.9% 6.3% 29.8% 24.6% 16.2% 35.4% 27.3% - 16.5% 19.7% 21.0%
Columns Tested: a,b,c,d,e,f - g,h,i - j,k
CATI Fieldwork: 27th September - 19th October 2017 Prepared by ComRes Page 65

Table 56/2
Jobs Outlook - Wave 19Q12. In which, if any, of these job functions do you expect to find a shortage of appropriate candidates for permanent roles?Base: All who recruit permanent members of staff in each job function
REGION SIZE SECTOR
Total North MidlandsSouth excluding
LondonSouth including
London London Other 0-49 50-249 250+ Private PublicSignificance Level: 95% a b c d e *f g h i j k
Unweighted Total 170 36 41 36 67 31 26 87 40 43 139 31
Weighted Total 170 36 40 37 67 31 27 89 40 41 138 32100.0% 100.0% 100.0% 100.0% 100.0% 100.0% 100.0% 100.0% 100.0% 100.0% 100.0% 100.0%
Technology 8 3 1 1 3 2 1 4 1 3 8 -17.6% 30.5% 12.3% 10.0% 17.2% 24.5% 10.1% 25.9% 9.2% 15.8% 22.0% -
None 101 17 25 23 40 16 19 56 22 22 77 2459.3% 47.5% 61.6% 64.1% 59.3% 53.6% 71.9% 63.2% 55.8% 54.3% 55.8% 74.8%
Net: Any 69 19 15 13 27 14 7 33 18 19 61 840.7% 52.5% 38.4% 35.9% 40.7% 46.4% 28.1% 36.8% 44.2% 45.7% 44.2% 25.2%
Columns Tested: a,b,c,d,e,f - g,h,i - j,k
CATI Fieldwork: 27th September - 19th October 2017 Prepared by ComRes Page 66

Table 57/1
Jobs Outlook - Wave 19Q14_SUM. Which job functions in your organisation, if any, do you think will see an increase or decrease in the number of temporary agency workers in the next three months? SUMMARY TABLEBase: All who recruit temporary agency workers in each job function
Total Greatly increase Slightly increase Stay the same Slightly decrease Greatly decrease Don't know Net: Increase Net: DecreaseNet: Increase + Stay
the same Mean
Accounting and financial services 11 - - 10 1 - 1 - 1 10 2.9100.0% - - 84.2% 8.5% - 7.4% - 8.5% 84.2%
Construction 7 - 2 5 - - - 2 - 7 3.3100.0% - 28.0% 72.0% - - - 28.0% - 100.0%
Drivers 9 1 2 6 - - 1 3 - 9 3.5100.0% 11.3% 19.1% 60.8% - - 8.8% 30.3% - 91.2%
Education 5 - - 5 - - - - - 5 3.0100.0% - - 100.0% - - - - - 100.0%
Engineering & technical 7 - - 6 - - 1 - - 6 3.0100.0% - - 87.4% - - 12.6% - - 87.4%
Executive recruitment / interimmanagement
8 - - 7 - - 1 - - 7 3.0100.0% - - 89.0% - - 11.0% - - 89.0%
Health & social care 5 - - 4 1 - - - 1 4 2.8100.0% - - 81.6% 18.4% - - - 18.4% 81.6%
Hospitality 3 - - 3 - - - - - 3 3.0100.0% - - 100.0% - - - - - 100.0%
Industrial 8 1 - 6 1 - 1 1 1 7 3.1100.0% 10.9% - 68.4% 10.8% - 9.9% 10.9% 10.8% 79.3%
Legal & HR 7 - 1 6 - - 1 1 - 7 3.1100.0% - 12.5% 76.1% - - 11.4% 12.5% - 88.6%
Life sciences - - - - - - - - - - -- - - - - - - - - -
Marketing, media & creative 10 - 1 9 - - 1 1 - 10 3.1100.0% - 8.8% 83.2% - - 8.0% 8.8% - 92.0%
Office professionals 17 - 1 16 - - 1 1 - 17 3.1100.0% - 5.3% 89.9% - - 4.8% 5.3% - 95.2%
Sales & retail 6 - - 5 - - 1 - - 5 3.0100.0% - - 85.6% - - 14.4% - - 85.6%
Technology 7 - - 7 - - - - - 7 3.0100.0% - - 100.0% - - - - - 100.0%
Average (response based includingbases)
111 2 7 92 3 - 8 9 3 101 3.1100.0% 1.8% 5.9% 83.1% 2.5% - 6.8% 7.7% 2.5% 90.8%
CATI Fieldwork: 27th September - 19th October 2017 Prepared by ComRes Page 67

Table 58/1
Jobs Outlook - Wave 19Q14_SUM. Average across all sectors SUMMARY TABLEBase: All who recruit temporary agency workers in each job function
REGION SIZE SECTOR
Total North MidlandsSouth excluding
LondonSouth including
London London Other 0-49 50-249 250+ Private PublicSignificance Level: 95% a b *c *d *e f g *h i j *k
Unweighted Total 116 30 31 11 20 9 35 38 22 56 111 5
Weighted Total 111 27 29 10 19 9 36 38 20 53 106 6100.0% 100.0% 100.0% 100.0% 100.0% 100.0% 100.0% 100.0% 100.0% 100.0% 100.0% 100.0%
Greatly increase (5) 2 - 1 - - - 1 1 - 1 2 -1.8% - 3.1% - - - 3.0% 2.8% - 1.7% 1.9% -
Slightly increase (4) 7 3 - 3 3 - 1 2 2 3 7 -5.9% 10.1% - 26.3% 14.4% - 3.0% 5.2% 9.0% 5.2% 6.2% -
Stay the same (3) 92 16 27 7 16 9 34 35 16 41 87 683.1% 58.4% 93.6% 65.0% 80.9% 100.0% 94.1% 92.0% 82.1% 77.1% 82.2% 100.0%
a a
Slightly decrease (2) 3 1 1 1 1 - - - 2 1 3 -2.5% 3.2% 3.3% 8.7% 4.7% - - - 8.9% 1.8% 2.6% -
Greatly decrease (1) - - - - - - - - - - - -- - - - - - - - - - - -
Don't know 8 8 - - - - - - - 8 8 -6.8% 28.2% - - - - - - - 14.2% 7.1% -
bf g
NETS
Net: Increase 9 3 1 3 3 - 2 3 2 4 9 -7.7% 10.1% 3.1% 26.3% 14.4% - 5.9% 8.0% 9.0% 6.9% 8.1% -
Net: Decrease 3 1 1 1 1 - - - 2 1 3 -2.5% 3.2% 3.3% 8.7% 4.7% - - - 8.9% 1.8% 2.6% -
Net: Increase + Stay the same 101 18 28 10 18 9 36 38 18 45 95 690.8% 68.5% 96.7% 91.3% 95.3% 100.0% 100.0% 100.0% 91.1% 84.0% 90.3% 100.0%
a a i
Mean score 3.1 3.1 3.0 3.2 3.1 3.0 3.1 3.1 3.0 3.1 3.1 3.0
Columns Tested: a,b,c,d,e,f - g,h,i - j,k
CATI Fieldwork: 27th September - 19th October 2017 Prepared by ComRes Page 68

Table 59/1
Jobs Outlook - Wave 19Q14_1. Which job functions in your organisation, if any, do you think will see an increase or decrease in the number of temporary agency workers in the next three months? Accounting and financial servicesBase: All who recruit temporary agency workers in each job function
REGION SIZE SECTOR
Total North MidlandsSouth excluding
LondonSouth including
London London Other 0-49 50-249 250+ Private PublicSignificance Level: 95% *a *b *c *d *e *f *g *h *i *j *k
Unweighted Total 12 4 2 1 2 1 4 2 3 7 11 1
Weighted Total 11 4 2 1 2 1 4 2 3 7 11 1100.0% 100.0% 100.0% 100.0% 100.0% 100.0% 100.0% 100.0% 100.0% 100.0% 100.0% 100.0%
Greatly increase (5) - - - - - - - - - - - -- - - - - - - - - - - -
Slightly increase (4) - - - - - - - - - - - -- - - - - - - - - - - -
Stay the same (3) 10 3 1 1 2 1 4 2 3 5 9 184.2% 76.3% 48.7% 100.0% 100.0% 100.0% 100.0% 100.0% 100.0% 73.5% 82.8% 100.0%
Slightly decrease (2) 1 - 1 - - - - - - 1 1 -8.5% - 51.3% - - - - - - 14.2% 9.2% -
Greatly decrease (1) - - - - - - - - - - - -- - - - - - - - - - - -
Don't know 1 1 - - - - - - - 1 1 -7.4% 23.7% - - - - - - - 12.3% 8.0% -
NETS
Net: Increase - - - - - - - - - - - -- - - - - - - - - - - -
Net: Decrease 1 - 1 - - - - - - 1 1 -8.5% - 51.3% - - - - - - 14.2% 9.2% -
Net: Increase + Stay the same 10 3 1 1 2 1 4 2 3 5 9 184.2% 76.3% 48.7% 100.0% 100.0% 100.0% 100.0% 100.0% 100.0% 73.5% 82.8% 100.0%
Mean score 2.9 3.0 2.5 3.0 3.0 3.0 3.0 3.0 3.0 2.8 2.9 3.0
Columns Tested: a,b,c,d,e,f - g,h,i - j,k
CATI Fieldwork: 27th September - 19th October 2017 Prepared by ComRes Page 69
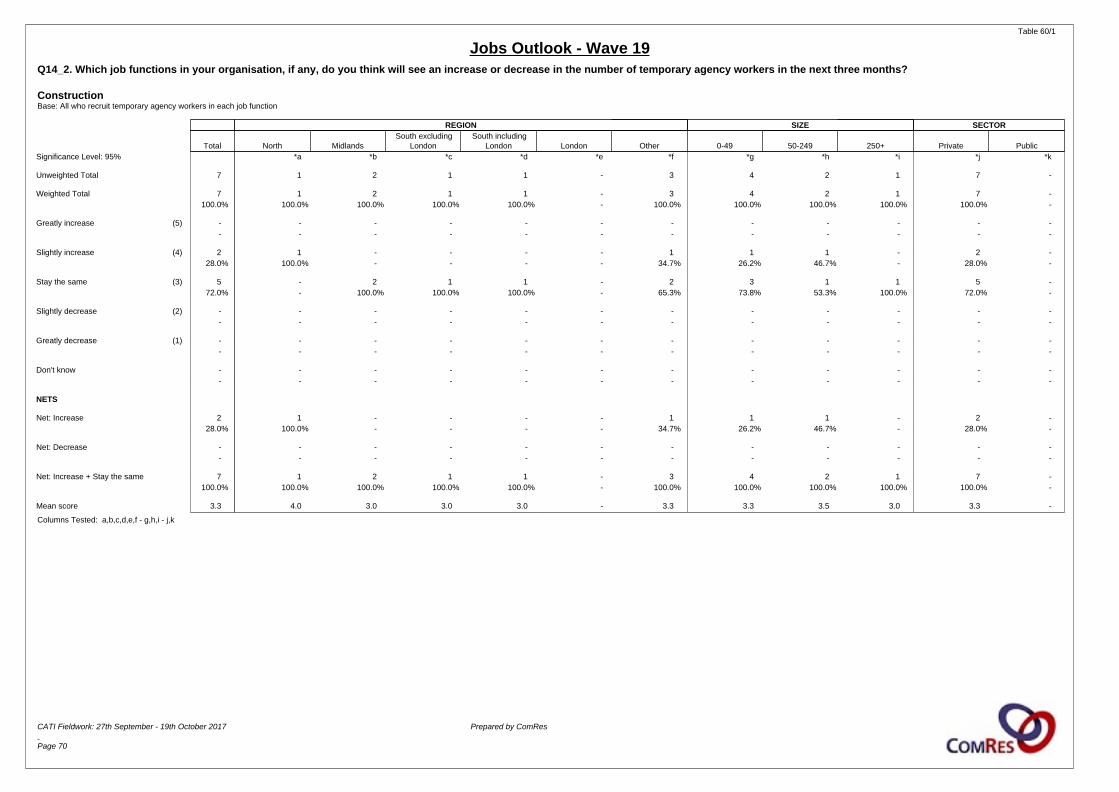
Table 60/1
Jobs Outlook - Wave 19Q14_2. Which job functions in your organisation, if any, do you think will see an increase or decrease in the number of temporary agency workers in the next three months? ConstructionBase: All who recruit temporary agency workers in each job function
REGION SIZE SECTOR
Total North MidlandsSouth excluding
LondonSouth including
London London Other 0-49 50-249 250+ Private PublicSignificance Level: 95% *a *b *c *d *e *f *g *h *i *j *k
Unweighted Total 7 1 2 1 1 - 3 4 2 1 7 -
Weighted Total 7 1 2 1 1 - 3 4 2 1 7 -100.0% 100.0% 100.0% 100.0% 100.0% - 100.0% 100.0% 100.0% 100.0% 100.0% -
Greatly increase (5) - - - - - - - - - - - -- - - - - - - - - - - -
Slightly increase (4) 2 1 - - - - 1 1 1 - 2 -28.0% 100.0% - - - - 34.7% 26.2% 46.7% - 28.0% -
Stay the same (3) 5 - 2 1 1 - 2 3 1 1 5 -72.0% - 100.0% 100.0% 100.0% - 65.3% 73.8% 53.3% 100.0% 72.0% -
Slightly decrease (2) - - - - - - - - - - - -- - - - - - - - - - - -
Greatly decrease (1) - - - - - - - - - - - -- - - - - - - - - - - -
Don't know - - - - - - - - - - - -- - - - - - - - - - - -
NETS
Net: Increase 2 1 - - - - 1 1 1 - 2 -28.0% 100.0% - - - - 34.7% 26.2% 46.7% - 28.0% -
Net: Decrease - - - - - - - - - - - -- - - - - - - - - - - -
Net: Increase + Stay the same 7 1 2 1 1 - 3 4 2 1 7 -100.0% 100.0% 100.0% 100.0% 100.0% - 100.0% 100.0% 100.0% 100.0% 100.0% -
Mean score 3.3 4.0 3.0 3.0 3.0 - 3.3 3.3 3.5 3.0 3.3 -
Columns Tested: a,b,c,d,e,f - g,h,i - j,k
CATI Fieldwork: 27th September - 19th October 2017 Prepared by ComRes Page 70

Table 61/1
Jobs Outlook - Wave 19Q14_3. Which job functions in your organisation, if any, do you think will see an increase or decrease in the number of temporary agency workers in the next three months? DriversBase: All who recruit temporary agency workers in each job function
REGION SIZE SECTOR
Total North MidlandsSouth excluding
LondonSouth including
London London Other 0-49 50-249 250+ Private PublicSignificance Level: 95% *a *b *c *d *e *f *g *h *i *j *k
Unweighted Total 10 3 2 1 1 - 4 5 1 4 10 -
Weighted Total 9 3 2 1 1 - 4 5 1 4 9 -100.0% 100.0% 100.0% 100.0% 100.0% - 100.0% 100.0% 100.0% 100.0% 100.0% -
Greatly increase (5) 1 - - - - - 1 1 - - 1 -11.3% - - - - - 26.2% 22.0% - - 11.3% -
Slightly increase (4) 2 2 - - - - - 1 1 - 2 -19.1% 68.3% - - - - - 18.6% 100.0% - 19.1% -
Stay the same (3) 6 - 2 1 1 - 3 3 - 3 6 -60.8% - 100.0% 100.0% 100.0% - 73.8% 59.4% - 77.5% 60.8% -
Slightly decrease (2) - - - - - - - - - - - -- - - - - - - - - - - -
Greatly decrease (1) - - - - - - - - - - - -- - - - - - - - - - - -
Don't know 1 1 - - - - - - - 1 1 -8.8% 31.7% - - - - - - - 22.5% 8.8% -
NETS
Net: Increase 3 2 - - - - 1 2 1 - 3 -30.3% 68.3% - - - - 26.2% 40.6% 100.0% - 30.3% -
Net: Decrease - - - - - - - - - - - -- - - - - - - - - - - -
Net: Increase + Stay the same 9 2 2 1 1 - 4 5 1 3 9 -91.2% 68.3% 100.0% 100.0% 100.0% - 100.0% 100.0% 100.0% 77.5% 91.2% -
Mean score 3.5 4.0 3.0 3.0 3.0 - 3.5 3.6 4.0 3.0 3.5 -
Columns Tested: a,b,c,d,e,f - g,h,i - j,k
CATI Fieldwork: 27th September - 19th October 2017 Prepared by ComRes Page 71

Table 62/1
Jobs Outlook - Wave 19Q14_4. Which job functions in your organisation, if any, do you think will see an increase or decrease in the number of temporary agency workers in the next three months? EducationBase: All who recruit temporary agency workers in each job function
REGION SIZE SECTOR
Total North MidlandsSouth excluding
LondonSouth including
London London Other 0-49 50-249 250+ Private PublicSignificance Level: 95% *a *b *c *d *e *f *g *h *i *j *k
Unweighted Total 5 1 1 - 2 2 1 1 1 3 4 1
Weighted Total 5 1 1 - 2 2 1 1 1 3 4 1100.0% 100.0% 100.0% - 100.0% 100.0% 100.0% 100.0% 100.0% 100.0% 100.0% 100.0%
Greatly increase (5) - - - - - - - - - - - -- - - - - - - - - - - -
Slightly increase (4) - - - - - - - - - - - -- - - - - - - - - - - -
Stay the same (3) 5 1 1 - 2 2 1 1 1 3 4 1100.0% 100.0% 100.0% - 100.0% 100.0% 100.0% 100.0% 100.0% 100.0% 100.0% 100.0%
Slightly decrease (2) - - - - - - - - - - - -- - - - - - - - - - - -
Greatly decrease (1) - - - - - - - - - - - -- - - - - - - - - - - -
Don't know - - - - - - - - - - - -- - - - - - - - - - - -
NETS
Net: Increase - - - - - - - - - - - -- - - - - - - - - - - -
Net: Decrease - - - - - - - - - - - -- - - - - - - - - - - -
Net: Increase + Stay the same 5 1 1 - 2 2 1 1 1 3 4 1100.0% 100.0% 100.0% - 100.0% 100.0% 100.0% 100.0% 100.0% 100.0% 100.0% 100.0%
Mean score 3.0 3.0 3.0 - 3.0 3.0 3.0 3.0 3.0 3.0 3.0 3.0
Columns Tested: a,b,c,d,e,f - g,h,i - j,k
CATI Fieldwork: 27th September - 19th October 2017 Prepared by ComRes Page 72

Table 63/1
Jobs Outlook - Wave 19Q14_5. Which job functions in your organisation, if any, do you think will see an increase or decrease in the number of temporary agency workers in the next three months? Engineering & technicalBase: All who recruit temporary agency workers in each job function
REGION SIZE SECTOR
Total North MidlandsSouth excluding
LondonSouth including
London London Other 0-49 50-249 250+ Private PublicSignificance Level: 95% *a *b *c *d *e *f *g *h *i *j *k
Unweighted Total 7 1 4 - - - 2 3 - 4 7 -
Weighted Total 7 1 4 - - - 2 3 - 4 7 -100.0% 100.0% 100.0% - - - 100.0% 100.0% - 100.0% 100.0% -
Greatly increase (5) - - - - - - - - - - - -- - - - - - - - - - - -
Slightly increase (4) - - - - - - - - - - - -- - - - - - - - - - - -
Stay the same (3) 6 - 4 - - - 2 3 - 3 6 -87.4% - 100.0% - - - 100.0% 100.0% - 77.4% 87.4% -
Slightly decrease (2) - - - - - - - - - - - -- - - - - - - - - - - -
Greatly decrease (1) - - - - - - - - - - - -- - - - - - - - - - - -
Don't know 1 1 - - - - - - - 1 1 -12.6% 100.0% - - - - - - - 22.6% 12.6% -
NETS
Net: Increase - - - - - - - - - - - -- - - - - - - - - - - -
Net: Decrease - - - - - - - - - - - -- - - - - - - - - - - -
Net: Increase + Stay the same 6 - 4 - - - 2 3 - 3 6 -87.4% - 100.0% - - - 100.0% 100.0% - 77.4% 87.4% -
Mean score 3.0 - 3.0 - - - 3.0 3.0 - 3.0 3.0 -
Columns Tested: a,b,c,d,e,f - g,h,i - j,k
CATI Fieldwork: 27th September - 19th October 2017 Prepared by ComRes Page 73

Table 64/1
Jobs Outlook - Wave 19Q14_6. Which job functions in your organisation, if any, do you think will see an increase or decrease in the number of temporary agency workers in the next three months? Executive recruitment / interim managementBase: All who recruit temporary agency workers in each job function
REGION SIZE SECTOR
Total North MidlandsSouth excluding
LondonSouth including
London London Other 0-49 50-249 250+ Private PublicSignificance Level: 95% *a *b *c *d *e *f *g *h *i *j *k
Unweighted Total 8 3 2 - - - 3 2 1 5 8 -
Weighted Total 8 3 2 - - - 3 2 1 5 8 -100.0% 100.0% 100.0% - - - 100.0% 100.0% 100.0% 100.0% 100.0% -
Greatly increase (5) - - - - - - - - - - - -- - - - - - - - - - - -
Slightly increase (4) - - - - - - - - - - - -- - - - - - - - - - - -
Stay the same (3) 7 2 2 - - - 3 2 1 4 7 -89.0% 68.9% 100.0% - - - 100.0% 100.0% 100.0% 82.8% 89.0% -
Slightly decrease (2) - - - - - - - - - - - -- - - - - - - - - - - -
Greatly decrease (1) - - - - - - - - - - - -- - - - - - - - - - - -
Don't know 1 1 - - - - - - - 1 1 -11.0% 31.1% - - - - - - - 17.2% 11.0% -
NETS
Net: Increase - - - - - - - - - - - -- - - - - - - - - - - -
Net: Decrease - - - - - - - - - - - -- - - - - - - - - - - -
Net: Increase + Stay the same 7 2 2 - - - 3 2 1 4 7 -89.0% 68.9% 100.0% - - - 100.0% 100.0% 100.0% 82.8% 89.0% -
Mean score 3.0 3.0 3.0 - - - 3.0 3.0 3.0 3.0 3.0 -
Columns Tested: a,b,c,d,e,f - g,h,i - j,k
CATI Fieldwork: 27th September - 19th October 2017 Prepared by ComRes Page 74

Table 65/1
Jobs Outlook - Wave 19Q14_7. Which job functions in your organisation, if any, do you think will see an increase or decrease in the number of temporary agency workers in the next three months? Health & social careBase: All who recruit temporary agency workers in each job function
REGION SIZE SECTOR
Total North MidlandsSouth excluding
LondonSouth including
London London Other 0-49 50-249 250+ Private PublicSignificance Level: 95% *a *b *c *d *e *f *g *h *i *j *k
Unweighted Total 5 2 - - 2 2 1 1 3 1 5 -
Weighted Total 5 2 - - 2 2 1 1 3 1 5 -100.0% 100.0% - - 100.0% 100.0% 100.0% 100.0% 100.0% 100.0% 100.0% -
Greatly increase (5) - - - - - - - - - - - -- - - - - - - - - - - -
Slightly increase (4) - - - - - - - - - - - -- - - - - - - - - - - -
Stay the same (3) 4 1 - - 2 2 1 1 2 1 4 -81.6% 49.3% - - 100.0% 100.0% 100.0% 100.0% 67.7% 100.0% 81.6% -
Slightly decrease (2) 1 1 - - - - - - 1 - 1 -18.4% 50.7% - - - - - - 32.3% - 18.4% -
Greatly decrease (1) - - - - - - - - - - - -- - - - - - - - - - - -
Don't know - - - - - - - - - - - -- - - - - - - - - - - -
NETS
Net: Increase - - - - - - - - - - - -- - - - - - - - - - - -
Net: Decrease 1 1 - - - - - - 1 - 1 -18.4% 50.7% - - - - - - 32.3% - 18.4% -
Net: Increase + Stay the same 4 1 - - 2 2 1 1 2 1 4 -81.6% 49.3% - - 100.0% 100.0% 100.0% 100.0% 67.7% 100.0% 81.6% -
Mean score 2.8 2.5 - - 3.0 3.0 3.0 3.0 2.7 3.0 2.8 -
Columns Tested: a,b,c,d,e,f - g,h,i - j,k
CATI Fieldwork: 27th September - 19th October 2017 Prepared by ComRes Page 75

Table 66/1
Jobs Outlook - Wave 19Q14_8. Which job functions in your organisation, if any, do you think will see an increase or decrease in the number of temporary agency workers in the next three months? HospitalityBase: All who recruit temporary agency workers in each job function
REGION SIZE SECTOR
Total North MidlandsSouth excluding
LondonSouth including
London London Other 0-49 50-249 250+ Private PublicSignificance Level: 95% *a *b *c *d *e *f *g *h *i *j *k
Unweighted Total 3 - 1 - 1 1 1 - - 3 3 -
Weighted Total 3 - 1 - 1 1 1 - - 3 3 -100.0% - 100.0% - 100.0% 100.0% 100.0% - - 100.0% 100.0% -
Greatly increase (5) - - - - - - - - - - - -- - - - - - - - - - - -
Slightly increase (4) - - - - - - - - - - - -- - - - - - - - - - - -
Stay the same (3) 3 - 1 - 1 1 1 - - 3 3 -100.0% - 100.0% - 100.0% 100.0% 100.0% - - 100.0% 100.0% -
Slightly decrease (2) - - - - - - - - - - - -- - - - - - - - - - - -
Greatly decrease (1) - - - - - - - - - - - -- - - - - - - - - - - -
Don't know - - - - - - - - - - - -- - - - - - - - - - - -
NETS
Net: Increase - - - - - - - - - - - -- - - - - - - - - - - -
Net: Decrease - - - - - - - - - - - -- - - - - - - - - - - -
Net: Increase + Stay the same 3 - 1 - 1 1 1 - - 3 3 -100.0% - 100.0% - 100.0% 100.0% 100.0% - - 100.0% 100.0% -
Mean score 3.0 - 3.0 - 3.0 3.0 3.0 - - 3.0 3.0 -
Columns Tested: a,b,c,d,e,f - g,h,i - j,k
CATI Fieldwork: 27th September - 19th October 2017 Prepared by ComRes Page 76

Table 67/1
Jobs Outlook - Wave 19Q14_9. Which job functions in your organisation, if any, do you think will see an increase or decrease in the number of temporary agency workers in the next three months? IndustrialBase: All who recruit temporary agency workers in each job function
REGION SIZE SECTOR
Total North MidlandsSouth excluding
LondonSouth including
London London Other 0-49 50-249 250+ Private PublicSignificance Level: 95% *a *b *c *d *e *f *g *h *i *j *k
Unweighted Total 9 2 4 1 1 - 2 3 2 4 9 -
Weighted Total 8 2 4 1 1 - 2 3 2 4 8 -100.0% 100.0% 100.0% 100.0% 100.0% - 100.0% 100.0% 100.0% 100.0% 100.0% -
Greatly increase (5) 1 - 1 - - - - - - 1 1 -10.9% - 24.2% - - - - - - 24.6% 10.9% -
Slightly increase (4) - - - - - - - - - - - -- - - - - - - - - - - -
Stay the same (3) 6 1 3 - - - 2 3 1 2 6 -68.4% 51.9% 75.8% - - - 100.0% 100.0% 49.9% 52.8% 68.4% -
Slightly decrease (2) 1 - - 1 1 - - - 1 - 1 -10.8% - - 100.0% 100.0% - - - 50.1% - 10.8% -
Greatly decrease (1) - - - - - - - - - - - -- - - - - - - - - - - -
Don't know 1 1 - - - - - - - 1 1 -9.9% 48.1% - - - - - - - 22.6% 9.9% -
NETS
Net: Increase 1 - 1 - - - - - - 1 1 -10.9% - 24.2% - - - - - - 24.6% 10.9% -
Net: Decrease 1 - - 1 1 - - - 1 - 1 -10.8% - - 100.0% 100.0% - - - 50.1% - 10.8% -
Net: Increase + Stay the same 7 1 4 - - - 2 3 1 3 7 -79.3% 51.9% 100.0% - - - 100.0% 100.0% 49.9% 77.4% 79.3% -
Mean score 3.1 3.0 3.5 2.0 2.0 - 3.0 3.0 2.5 3.6 3.1 -
Columns Tested: a,b,c,d,e,f - g,h,i - j,k
CATI Fieldwork: 27th September - 19th October 2017 Prepared by ComRes Page 77

Table 68/1
Jobs Outlook - Wave 19Q14_10. Which job functions in your organisation, if any, do you think will see an increase or decrease in the number of temporary agency workers in the next three months? Legal & HRBase: All who recruit temporary agency workers in each job function
REGION SIZE SECTOR
Total North MidlandsSouth excluding
LondonSouth including
London London Other 0-49 50-249 250+ Private PublicSignificance Level: 95% *a *b *c *d *e *f *g *h *i *j *k
Unweighted Total 8 4 1 1 2 1 1 1 2 5 8 -
Weighted Total 7 4 1 1 2 1 1 1 2 5 7 -100.0% 100.0% 100.0% 100.0% 100.0% 100.0% 100.0% 100.0% 100.0% 100.0% 100.0% -
Greatly increase (5) - - - - - - - - - - - -- - - - - - - - - - - -
Slightly increase (4) 1 - - 1 1 - - - - 1 1 -12.5% - - 100.0% 48.7% - - - - 19.7% 12.5% -
Stay the same (3) 6 3 1 - 1 1 1 1 2 3 6 -76.1% 76.7% 100.0% - 51.3% 100.0% 100.0% 100.0% 100.0% 62.3% 76.1% -
Slightly decrease (2) - - - - - - - - - - - -- - - - - - - - - - - -
Greatly decrease (1) - - - - - - - - - - - -- - - - - - - - - - - -
Don't know 1 1 - - - - - - - 1 1 -11.4% 23.3% - - - - - - - 18.0% 11.4% -
NETS
Net: Increase 1 - - 1 1 - - - - 1 1 -12.5% - - 100.0% 48.7% - - - - 19.7% 12.5% -
Net: Decrease - - - - - - - - - - - -- - - - - - - - - - - -
Net: Increase + Stay the same 7 3 1 1 2 1 1 1 2 4 7 -88.6% 76.7% 100.0% 100.0% 100.0% 100.0% 100.0% 100.0% 100.0% 82.0% 88.6% -
Mean score 3.1 3.0 3.0 4.0 3.5 3.0 3.0 3.0 3.0 3.2 3.1 -
Columns Tested: a,b,c,d,e,f - g,h,i - j,k
CATI Fieldwork: 27th September - 19th October 2017 Prepared by ComRes Page 78

Table 69/1
Jobs Outlook - Wave 19Q14_11. Which job functions in your organisation, if any, do you think will see an increase or decrease in the number of temporary agency workers in the next three months? Life sciencesBase: All who recruit temporary agency workers in each job function
REGION SIZE SECTOR
Total North MidlandsSouth excluding
LondonSouth including
London London Other 0-49 50-249 250+ Private PublicSignificance Level: 95% *a *b *c *d *e *f *g *h *i *j *k
Unweighted Total - - - - - - - - - - - -
Weighted Total - - - - - - - - - - - -- - - - - - - - - - - -
Greatly increase (5) - - - - - - - - - - - -- - - - - - - - - - - -
Slightly increase (4) - - - - - - - - - - - -- - - - - - - - - - - -
Stay the same (3) - - - - - - - - - - - -- - - - - - - - - - - -
Slightly decrease (2) - - - - - - - - - - - -- - - - - - - - - - - -
Greatly decrease (1) - - - - - - - - - - - -- - - - - - - - - - - -
Don't know - - - - - - - - - - - -- - - - - - - - - - - -
NETS
Net: Increase - - - - - - - - - - - -- - - - - - - - - - - -
Net: Decrease - - - - - - - - - - - -- - - - - - - - - - - -
Net: Increase + Stay the same - - - - - - - - - - - -- - - - - - - - - - - -
Mean score - - - - - - - - - - - -
Columns Tested: a,b,c,d,e,f - g,h,i - j,k
CATI Fieldwork: 27th September - 19th October 2017 Prepared by ComRes Page 79

Table 70/1
Jobs Outlook - Wave 19Q14_12. Which job functions in your organisation, if any, do you think will see an increase or decrease in the number of temporary agency workers in the next three months? Marketing, media & creativeBase: All who recruit temporary agency workers in each job function
REGION SIZE SECTOR
Total North MidlandsSouth excluding
LondonSouth including
London London Other 0-49 50-249 250+ Private PublicSignificance Level: 95% *a *b *c *d *e *f *g *h *i *j *k
Unweighted Total 11 2 4 2 2 - 3 4 4 3 10 1
Weighted Total 10 2 4 2 2 - 3 4 4 3 10 1100.0% 100.0% 100.0% 100.0% 100.0% - 100.0% 100.0% 100.0% 100.0% 100.0% 100.0%
Greatly increase (5) - - - - - - - - - - - -- - - - - - - - - - - -
Slightly increase (4) 1 - - 1 1 - - - - 1 1 -8.8% - - 46.4% 46.4% - - - - 34.4% 9.7% -
Stay the same (3) 9 1 4 1 1 - 3 4 4 1 8 183.2% 50.1% 100.0% 53.6% 53.6% - 100.0% 100.0% 100.0% 34.2% 81.5% 100.0%
Slightly decrease (2) - - - - - - - - - - - -- - - - - - - - - - - -
Greatly decrease (1) - - - - - - - - - - - -- - - - - - - - - - - -
Don't know 1 1 - - - - - - - 1 1 -8.0% 49.9% - - - - - - - 31.4% 8.8% -
NETS
Net: Increase 1 - - 1 1 - - - - 1 1 -8.8% - - 46.4% 46.4% - - - - 34.4% 9.7% -
Net: Decrease - - - - - - - - - - - -- - - - - - - - - - - -
Net: Increase + Stay the same 10 1 4 2 2 - 3 4 4 2 9 192.0% 50.1% 100.0% 100.0% 100.0% - 100.0% 100.0% 100.0% 68.6% 91.2% 100.0%
Mean score 3.1 3.0 3.0 3.5 3.5 - 3.0 3.0 3.0 3.5 3.1 3.0
Columns Tested: a,b,c,d,e,f - g,h,i - j,k
CATI Fieldwork: 27th September - 19th October 2017 Prepared by ComRes Page 80

Table 71/1
Jobs Outlook - Wave 19Q14_13. Which job functions in your organisation, if any, do you think will see an increase or decrease in the number of temporary agency workers in the next three months? Office professionalsBase: All who recruit temporary agency workers in each job function
REGION SIZE SECTOR
Total North MidlandsSouth excluding
LondonSouth including
London London Other 0-49 50-249 250+ Private PublicSignificance Level: 95% *a *b *c *d *e *f *g *h *i *j *k
Unweighted Total 18 5 5 2 3 1 5 7 2 9 17 1
Weighted Total 17 4 5 2 3 1 5 7 2 9 16 1100.0% 100.0% 100.0% 100.0% 100.0% 100.0% 100.0% 100.0% 100.0% 100.0% 100.0% 100.0%
Greatly increase (5) - - - - - - - - - - - -- - - - - - - - - - - -
Slightly increase (4) 1 - - 1 1 - - - - 1 1 -5.3% - - 46.4% 31.2% - - - - 10.8% 5.7% -
Stay the same (3) 16 4 5 1 2 1 5 7 2 7 14 189.9% 81.1% 100.0% 53.6% 68.8% 100.0% 100.0% 100.0% 100.0% 79.4% 89.2% 100.0%
Slightly decrease (2) - - - - - - - - - - - -- - - - - - - - - - - -
Greatly decrease (1) - - - - - - - - - - - -- - - - - - - - - - - -
Don't know 1 1 - - - - - - - 1 1 -4.8% 18.9% - - - - - - - 9.8% 5.2% -
NETS
Net: Increase 1 - - 1 1 - - - - 1 1 -5.3% - - 46.4% 31.2% - - - - 10.8% 5.7% -
Net: Decrease - - - - - - - - - - - -- - - - - - - - - - - -
Net: Increase + Stay the same 17 4 5 2 3 1 5 7 2 8 15 195.2% 81.1% 100.0% 100.0% 100.0% 100.0% 100.0% 100.0% 100.0% 90.2% 94.8% 100.0%
Mean score 3.1 3.0 3.0 3.5 3.3 3.0 3.0 3.0 3.0 3.1 3.1 3.0
Columns Tested: a,b,c,d,e,f - g,h,i - j,k
CATI Fieldwork: 27th September - 19th October 2017 Prepared by ComRes Page 81

Table 72/1
Jobs Outlook - Wave 19Q14_14. Which job functions in your organisation, if any, do you think will see an increase or decrease in the number of temporary agency workers in the next three months? Sales & retailBase: All who recruit temporary agency workers in each job function
REGION SIZE SECTOR
Total North MidlandsSouth excluding
LondonSouth including
London London Other 0-49 50-249 250+ Private PublicSignificance Level: 95% *a *b *c *d *e *f *g *h *i *j *k
Unweighted Total 6 1 2 1 1 - 2 3 - 3 5 1
Weighted Total 6 1 2 1 1 - 2 3 - 3 5 1100.0% 100.0% 100.0% 100.0% 100.0% - 100.0% 100.0% - 100.0% 100.0% 100.0%
Greatly increase (5) - - - - - - - - - - - -- - - - - - - - - - - -
Slightly increase (4) - - - - - - - - - - - -- - - - - - - - - - - -
Stay the same (3) 5 - 2 1 1 - 2 3 - 2 4 185.6% - 100.0% 100.0% 100.0% - 100.0% 100.0% - 68.6% 81.8% 100.0%
Slightly decrease (2) - - - - - - - - - - - -- - - - - - - - - - - -
Greatly decrease (1) - - - - - - - - - - - -- - - - - - - - - - - -
Don't know 1 1 - - - - - - - 1 1 -14.4% 100.0% - - - - - - - 31.4% 18.2% -
NETS
Net: Increase - - - - - - - - - - - -- - - - - - - - - - - -
Net: Decrease - - - - - - - - - - - -- - - - - - - - - - - -
Net: Increase + Stay the same 5 - 2 1 1 - 2 3 - 2 4 185.6% - 100.0% 100.0% 100.0% - 100.0% 100.0% - 68.6% 81.8% 100.0%
Mean score 3.0 - 3.0 3.0 3.0 - 3.0 3.0 - 3.0 3.0 3.0
Columns Tested: a,b,c,d,e,f - g,h,i - j,k
CATI Fieldwork: 27th September - 19th October 2017 Prepared by ComRes Page 82

Table 73/1
Jobs Outlook - Wave 19Q14_15. Which job functions in your organisation, if any, do you think will see an increase or decrease in the number of temporary agency workers in the next three months? TechnologyBase: All who recruit temporary agency workers in each job function
REGION SIZE SECTOR
Total North MidlandsSouth excluding
LondonSouth including
London London Other 0-49 50-249 250+ Private PublicSignificance Level: 95% *a *b *c *d *e *f *g *h *i *j *k
Unweighted Total 7 1 1 1 2 1 3 2 1 4 7 -
Weighted Total 7 1 1 1 2 1 3 2 1 4 7 -100.0% 100.0% 100.0% 100.0% 100.0% 100.0% 100.0% 100.0% 100.0% 100.0% 100.0% -
Greatly increase (5) - - - - - - - - - - - -- - - - - - - - - - - -
Slightly increase (4) - - - - - - - - - - - -- - - - - - - - - - - -
Stay the same (3) 7 1 1 1 2 1 3 2 1 4 7 -100.0% 100.0% 100.0% 100.0% 100.0% 100.0% 100.0% 100.0% 100.0% 100.0% 100.0% -
Slightly decrease (2) - - - - - - - - - - - -- - - - - - - - - - - -
Greatly decrease (1) - - - - - - - - - - - -- - - - - - - - - - - -
Don't know - - - - - - - - - - - -- - - - - - - - - - - -
NETS
Net: Increase - - - - - - - - - - - -- - - - - - - - - - - -
Net: Decrease - - - - - - - - - - - -- - - - - - - - - - - -
Net: Increase + Stay the same 7 1 1 1 2 1 3 2 1 4 7 -100.0% 100.0% 100.0% 100.0% 100.0% 100.0% 100.0% 100.0% 100.0% 100.0% 100.0% -
Mean score 3.0 3.0 3.0 3.0 3.0 3.0 3.0 3.0 3.0 3.0 3.0 -
Columns Tested: a,b,c,d,e,f - g,h,i - j,k
CATI Fieldwork: 27th September - 19th October 2017 Prepared by ComRes Page 83

Table 74/1
Jobs Outlook - Wave 19Q15_SUM. Which job functions in your organisation, if any, do you think will see an increase or decrease in the number of temporary agency workers in the next four to twelve months? SUMMARY TABLEBase: All who recruit temporary agency workers in each job function
Total Greatly increase Slightly increase Stay the same Slightly decrease Greatly decrease Don't know Net: Increase Net: DecreaseNet: Increase + Stay
the same Mean
Accounting and financial services 11 - - 9 2 - 1 - 2 9 2.8100.0% - - 75.7% 16.9% - 7.4% - 16.9% 75.7%
Construction 7 - 3 3 1 - - 3 1 6 3.3100.0% - 41.8% 44.5% 13.6% - - 41.8% 13.6% 86.4%
Drivers 9 1 3 4 1 - 1 4 1 8 3.5100.0% 11.3% 28.8% 41.0% 10.2% - 8.8% 40.0% 10.2% 81.0%
Education 5 - 1 4 - - - 1 - 5 3.2100.0% - 18.5% 81.5% - - - 18.5% - 100.0%
Engineering & technical 7 - 1 4 1 - 1 1 1 5 3.0100.0% - 15.6% 57.2% 14.5% - 12.6% 15.6% 14.5% 72.8%
Executive recruitment / interimmanagement
8 - - 7 - - 1 - - 7 3.0100.0% - - 89.0% - - 11.0% - - 89.0%
Health & social care 5 - 1 4 - - - 1 - 5 3.2100.0% - 18.4% 81.6% - - - 18.4% - 100.0%
Hospitality 3 - - 3 - - - - - 3 3.0100.0% - - 100.0% - - - - - 100.0%
Industrial 8 - 2 5 1 - 1 2 1 7 3.1100.0% - 22.4% 56.2% 11.4% - 9.9% 22.4% 11.4% 78.7%
Legal & HR 7 - - 6 1 - 1 - 1 6 2.9100.0% - - 75.6% 13.1% - 11.4% - 13.1% 75.6%
Life sciences - - - - - - - - - - -- - - - - - - - - -
Marketing, media & creative 10 - 1 8 1 - 1 1 1 9 3.0100.0% - 8.8% 74.1% 9.2% - 8.0% 8.8% 9.2% 82.8%
Office professionals 17 - 2 14 1 - 1 2 1 16 3.1100.0% - 12.2% 77.5% 5.5% - 4.8% 12.2% 5.5% 89.7%
Sales & retail 6 - 2 3 - - 1 2 - 5 3.4100.0% - 36.7% 48.9% - - 14.4% 36.7% - 85.6%
Technology 7 - 1 5 1 - - 1 1 6 3.0100.0% - 13.8% 71.7% 14.5% - - 13.8% 14.5% 85.5%
Average (response based includingbases)
111 1 17 76 10 - 8 18 10 94 3.1100.0% 1.0% 14.9% 68.7% 8.7% - 6.8% 15.8% 8.7% 84.6%
CATI Fieldwork: 27th September - 19th October 2017 Prepared by ComRes Page 84

Table 75/1
Jobs Outlook - Wave 19Q15_SUM. Average across all sectors SUMMARY TABLEBase: All who recruit temporary agency workers in each job function
REGION SIZE SECTOR
Total North MidlandsSouth excluding
LondonSouth including
London London Other 0-49 50-249 250+ Private PublicSignificance Level: 95% a b *c *d *e f g *h i j *k
Unweighted Total 116 30 31 11 20 9 35 38 22 56 111 5
Weighted Total 111 27 29 10 19 9 36 38 20 53 106 6100.0% 100.0% 100.0% 100.0% 100.0% 100.0% 100.0% 100.0% 100.0% 100.0% 100.0% 100.0%
Greatly increase (5) 1 - - - - - 1 1 - - 1 -1.0% - - - - - 3.0% 2.8% - - 1.0% -
Slightly increase (4) 17 4 4 5 6 1 3 7 3 6 14 214.9% 13.4% 13.3% 43.9% 29.0% 11.1% 9.7% 19.4% 13.4% 12.2% 13.4% 43.7%
Stay the same (3) 76 16 24 6 14 8 23 21 17 38 73 368.7% 58.4% 83.4% 56.1% 71.0% 88.9% 63.2% 55.0% 86.6% 71.8% 69.4% 56.3%
a
Slightly decrease (2) 10 - 1 - - - 9 9 - 1 10 -8.7% - 3.3% - - - 24.1% 22.8% - 1.8% 9.1% -
ab i
Greatly decrease (1) - - - - - - - - - - - -- - - - - - - - - - - -
Don't know 8 8 - - - - - - - 8 8 -6.8% 28.2% - - - - - - - 14.2% 7.1% -
bf g
NETS
Net: Increase 18 4 4 5 6 1 5 8 3 6 15 215.8% 13.4% 13.3% 43.9% 29.0% 11.1% 12.7% 22.2% 13.4% 12.2% 14.4% 43.7%
Net: Decrease 10 - 1 - - - 9 9 - 1 10 -8.7% - 3.3% - - - 24.1% 22.8% - 1.8% 9.1% -
ab i
Net: Increase + Stay the same 94 19 28 10 19 9 27 29 20 45 88 684.6% 71.8% 96.7% 100.0% 100.0% 100.0% 75.9% 77.2% 100.0% 84.0% 83.8% 100.0%
af
Mean score 3.1 3.2 3.1 3.4 3.3 3.1 2.9 3.0 3.1 3.1 3.1 3.4
Columns Tested: a,b,c,d,e,f - g,h,i - j,k
CATI Fieldwork: 27th September - 19th October 2017 Prepared by ComRes Page 85

Table 76/1
Jobs Outlook - Wave 19Q15_1. Which job functions in your organisation, if any, do you think will see an increase or decrease in the number of temporary agency workers in the next four to twelve months? Accounting and financial servicesBase: All who recruit temporary agency workers in each job function
REGION SIZE SECTOR
Total North MidlandsSouth excluding
LondonSouth including
London London Other 0-49 50-249 250+ Private PublicSignificance Level: 95% *a *b *c *d *e *f *g *h *i *j *k
Unweighted Total 12 4 2 1 2 1 4 2 3 7 11 1
Weighted Total 11 4 2 1 2 1 4 2 3 7 11 1100.0% 100.0% 100.0% 100.0% 100.0% 100.0% 100.0% 100.0% 100.0% 100.0% 100.0% 100.0%
Greatly increase (5) - - - - - - - - - - - -- - - - - - - - - - - -
Slightly increase (4) - - - - - - - - - - - -- - - - - - - - - - - -
Stay the same (3) 9 3 1 1 2 1 3 1 3 5 8 175.7% 76.3% 48.7% 100.0% 100.0% 100.0% 76.7% 52.6% 100.0% 73.5% 73.7% 100.0%
Slightly decrease (2) 2 - 1 - - - 1 1 - 1 2 -16.9% - 51.3% - - - 23.3% 47.4% - 14.2% 18.3% -
Greatly decrease (1) - - - - - - - - - - - -- - - - - - - - - - - -
Don't know 1 1 - - - - - - - 1 1 -7.4% 23.7% - - - - - - - 12.3% 8.0% -
NETS
Net: Increase - - - - - - - - - - - -- - - - - - - - - - - -
Net: Decrease 2 - 1 - - - 1 1 - 1 2 -16.9% - 51.3% - - - 23.3% 47.4% - 14.2% 18.3% -
Net: Increase + Stay the same 9 3 1 1 2 1 3 1 3 5 8 175.7% 76.3% 48.7% 100.0% 100.0% 100.0% 76.7% 52.6% 100.0% 73.5% 73.7% 100.0%
Mean score 2.8 3.0 2.5 3.0 3.0 3.0 2.8 2.5 3.0 2.8 2.8 3.0
Columns Tested: a,b,c,d,e,f - g,h,i - j,k
CATI Fieldwork: 27th September - 19th October 2017 Prepared by ComRes Page 86

Table 77/1
Jobs Outlook - Wave 19Q15_2. Which job functions in your organisation, if any, do you think will see an increase or decrease in the number of temporary agency workers in the next four to twelve months? ConstructionBase: All who recruit temporary agency workers in each job function
REGION SIZE SECTOR
Total North MidlandsSouth excluding
LondonSouth including
London London Other 0-49 50-249 250+ Private PublicSignificance Level: 95% *a *b *c *d *e *f *g *h *i *j *k
Unweighted Total 7 1 2 1 1 - 3 4 2 1 7 -
Weighted Total 7 1 2 1 1 - 3 4 2 1 7 -100.0% 100.0% 100.0% 100.0% 100.0% - 100.0% 100.0% 100.0% 100.0% 100.0% -
Greatly increase (5) - - - - - - - - - - - -- - - - - - - - - - - -
Slightly increase (4) 3 1 1 - - - 1 2 1 - 3 -41.8% 100.0% 48.6% - - - 34.7% 50.3% 46.7% - 41.8% -
Stay the same (3) 3 - 1 1 1 - 1 1 1 1 3 -44.5% - 51.4% 100.0% 100.0% - 34.0% 26.1% 53.3% 100.0% 44.5% -
Slightly decrease (2) 1 - - - - - 1 1 - - 1 -13.6% - - - - - 31.3% 23.6% - - 13.6% -
Greatly decrease (1) - - - - - - - - - - - -- - - - - - - - - - - -
Don't know - - - - - - - - - - - -- - - - - - - - - - - -
NETS
Net: Increase 3 1 1 - - - 1 2 1 - 3 -41.8% 100.0% 48.6% - - - 34.7% 50.3% 46.7% - 41.8% -
Net: Decrease 1 - - - - - 1 1 - - 1 -13.6% - - - - - 31.3% 23.6% - - 13.6% -
Net: Increase + Stay the same 6 1 2 1 1 - 2 3 2 1 6 -86.4% 100.0% 100.0% 100.0% 100.0% - 68.7% 76.4% 100.0% 100.0% 86.4% -
Mean score 3.3 4.0 3.5 3.0 3.0 - 3.0 3.3 3.5 3.0 3.3 -
Columns Tested: a,b,c,d,e,f - g,h,i - j,k
CATI Fieldwork: 27th September - 19th October 2017 Prepared by ComRes Page 87

Table 78/1
Jobs Outlook - Wave 19Q15_3. Which job functions in your organisation, if any, do you think will see an increase or decrease in the number of temporary agency workers in the next four to twelve months? DriversBase: All who recruit temporary agency workers in each job function
REGION SIZE SECTOR
Total North MidlandsSouth excluding
LondonSouth including
London London Other 0-49 50-249 250+ Private PublicSignificance Level: 95% *a *b *c *d *e *f *g *h *i *j *k
Unweighted Total 10 3 2 1 1 - 4 5 1 4 10 -
Weighted Total 9 3 2 1 1 - 4 5 1 4 9 -100.0% 100.0% 100.0% 100.0% 100.0% - 100.0% 100.0% 100.0% 100.0% 100.0% -
Greatly increase (5) 1 - - - - - 1 1 - - 1 -11.3% - - - - - 26.2% 22.0% - - 11.3% -
Slightly increase (4) 3 2 - 1 1 - - 1 1 1 3 -28.8% 68.3% - 100.0% 100.0% - - 18.6% 100.0% 24.7% 28.8% -
Stay the same (3) 4 - 2 - - - 2 2 - 2 4 -41.0% - 100.0% - - - 50.3% 39.6% - 52.8% 41.0% -
Slightly decrease (2) 1 - - - - - 1 1 - - 1 -10.2% - - - - - 23.6% 19.8% - - 10.2% -
Greatly decrease (1) - - - - - - - - - - - -- - - - - - - - - - - -
Don't know 1 1 - - - - - - - 1 1 -8.8% 31.7% - - - - - - - 22.5% 8.8% -
NETS
Net: Increase 4 2 - 1 1 - 1 2 1 1 4 -40.0% 68.3% - 100.0% 100.0% - 26.2% 40.6% 100.0% 24.7% 40.0% -
Net: Decrease 1 - - - - - 1 1 - - 1 -10.2% - - - - - 23.6% 19.8% - - 10.2% -
Net: Increase + Stay the same 8 2 2 1 1 - 3 4 1 3 8 -81.0% 68.3% 100.0% 100.0% 100.0% - 76.4% 80.2% 100.0% 77.5% 81.0% -
Mean score 3.5 4.0 3.0 4.0 4.0 - 3.3 3.4 4.0 3.3 3.5 -
Columns Tested: a,b,c,d,e,f - g,h,i - j,k
CATI Fieldwork: 27th September - 19th October 2017 Prepared by ComRes Page 88

Table 79/1
Jobs Outlook - Wave 19Q15_4. Which job functions in your organisation, if any, do you think will see an increase or decrease in the number of temporary agency workers in the next four to twelve months? EducationBase: All who recruit temporary agency workers in each job function
REGION SIZE SECTOR
Total North MidlandsSouth excluding
LondonSouth including
London London Other 0-49 50-249 250+ Private PublicSignificance Level: 95% *a *b *c *d *e *f *g *h *i *j *k
Unweighted Total 5 1 1 - 2 2 1 1 1 3 4 1
Weighted Total 5 1 1 - 2 2 1 1 1 3 4 1100.0% 100.0% 100.0% - 100.0% 100.0% 100.0% 100.0% 100.0% 100.0% 100.0% 100.0%
Greatly increase (5) - - - - - - - - - - - -- - - - - - - - - - - -
Slightly increase (4) 1 - - - 1 1 - - - 1 1 -18.5% - - - 50.0% 50.0% - - - 32.5% 24.5% -
Stay the same (3) 4 1 1 - 1 1 1 1 1 2 3 181.5% 100.0% 100.0% - 50.0% 50.0% 100.0% 100.0% 100.0% 67.5% 75.5% 100.0%
Slightly decrease (2) - - - - - - - - - - - -- - - - - - - - - - - -
Greatly decrease (1) - - - - - - - - - - - -- - - - - - - - - - - -
Don't know - - - - - - - - - - - -- - - - - - - - - - - -
NETS
Net: Increase 1 - - - 1 1 - - - 1 1 -18.5% - - - 50.0% 50.0% - - - 32.5% 24.5% -
Net: Decrease - - - - - - - - - - - -- - - - - - - - - - - -
Net: Increase + Stay the same 5 1 1 - 2 2 1 1 1 3 4 1100.0% 100.0% 100.0% - 100.0% 100.0% 100.0% 100.0% 100.0% 100.0% 100.0% 100.0%
Mean score 3.2 3.0 3.0 - 3.5 3.5 3.0 3.0 3.0 3.3 3.2 3.0
Columns Tested: a,b,c,d,e,f - g,h,i - j,k
CATI Fieldwork: 27th September - 19th October 2017 Prepared by ComRes Page 89

Table 80/1
Jobs Outlook - Wave 19Q15_5. Which job functions in your organisation, if any, do you think will see an increase or decrease in the number of temporary agency workers in the next four to twelve months? Engineering & technicalBase: All who recruit temporary agency workers in each job function
REGION SIZE SECTOR
Total North MidlandsSouth excluding
LondonSouth including
London London Other 0-49 50-249 250+ Private PublicSignificance Level: 95% *a *b *c *d *e *f *g *h *i *j *k
Unweighted Total 7 1 4 - - - 2 3 - 4 7 -
Weighted Total 7 1 4 - - - 2 3 - 4 7 -100.0% 100.0% 100.0% - - - 100.0% 100.0% - 100.0% 100.0% -
Greatly increase (5) - - - - - - - - - - - -- - - - - - - - - - - -
Slightly increase (4) 1 - 1 - - - - 1 - - 1 -15.6% - 27.3% - - - - 35.5% - - 15.6% -
Stay the same (3) 4 - 3 - - - 1 1 - 3 4 -57.2% - 72.7% - - - 52.1% 31.4% - 77.4% 57.2% -
Slightly decrease (2) 1 - - - - - 1 1 - - 1 -14.5% - - - - - 47.9% 33.1% - - 14.5% -
Greatly decrease (1) - - - - - - - - - - - -- - - - - - - - - - - -
Don't know 1 1 - - - - - - - 1 1 -12.6% 100.0% - - - - - - - 22.6% 12.6% -
NETS
Net: Increase 1 - 1 - - - - 1 - - 1 -15.6% - 27.3% - - - - 35.5% - - 15.6% -
Net: Decrease 1 - - - - - 1 1 - - 1 -14.5% - - - - - 47.9% 33.1% - - 14.5% -
Net: Increase + Stay the same 5 - 4 - - - 1 2 - 3 5 -72.8% - 100.0% - - - 52.1% 66.9% - 77.4% 72.8% -
Mean score 3.0 - 3.3 - - - 2.5 3.0 - 3.0 3.0 -
Columns Tested: a,b,c,d,e,f - g,h,i - j,k
CATI Fieldwork: 27th September - 19th October 2017 Prepared by ComRes Page 90
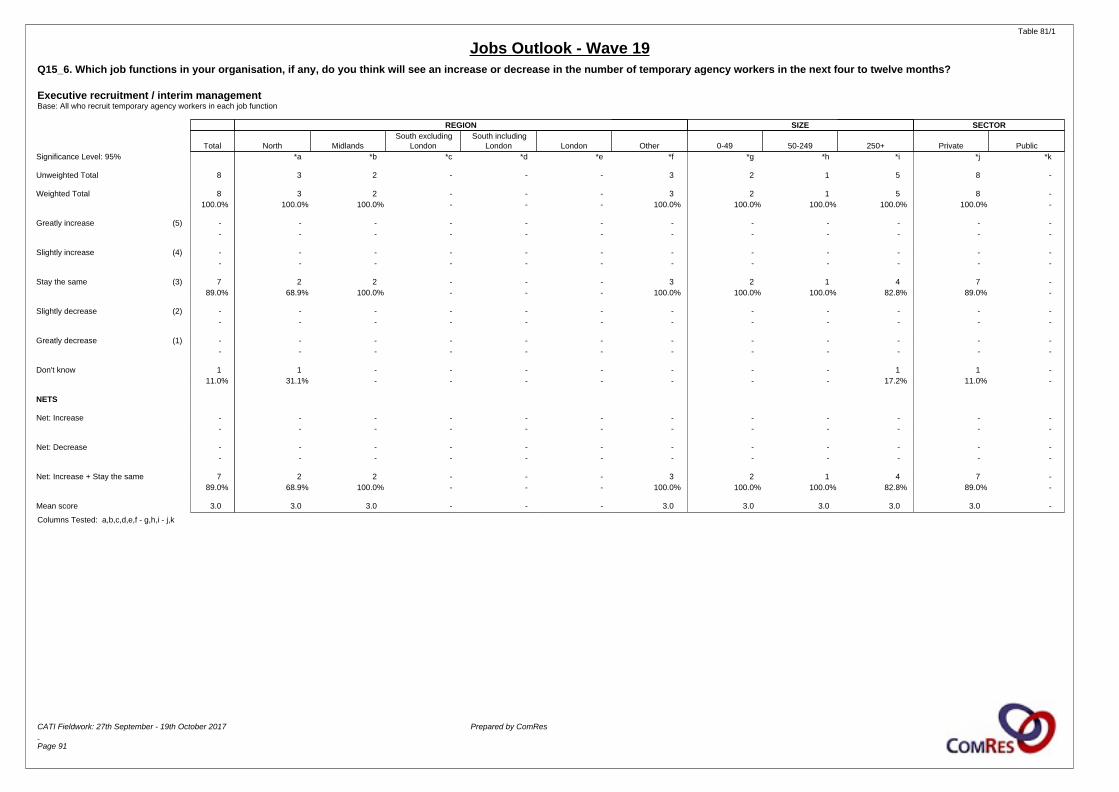
Table 81/1
Jobs Outlook - Wave 19Q15_6. Which job functions in your organisation, if any, do you think will see an increase or decrease in the number of temporary agency workers in the next four to twelve months? Executive recruitment / interim managementBase: All who recruit temporary agency workers in each job function
REGION SIZE SECTOR
Total North MidlandsSouth excluding
LondonSouth including
London London Other 0-49 50-249 250+ Private PublicSignificance Level: 95% *a *b *c *d *e *f *g *h *i *j *k
Unweighted Total 8 3 2 - - - 3 2 1 5 8 -
Weighted Total 8 3 2 - - - 3 2 1 5 8 -100.0% 100.0% 100.0% - - - 100.0% 100.0% 100.0% 100.0% 100.0% -
Greatly increase (5) - - - - - - - - - - - -- - - - - - - - - - - -
Slightly increase (4) - - - - - - - - - - - -- - - - - - - - - - - -
Stay the same (3) 7 2 2 - - - 3 2 1 4 7 -89.0% 68.9% 100.0% - - - 100.0% 100.0% 100.0% 82.8% 89.0% -
Slightly decrease (2) - - - - - - - - - - - -- - - - - - - - - - - -
Greatly decrease (1) - - - - - - - - - - - -- - - - - - - - - - - -
Don't know 1 1 - - - - - - - 1 1 -11.0% 31.1% - - - - - - - 17.2% 11.0% -
NETS
Net: Increase - - - - - - - - - - - -- - - - - - - - - - - -
Net: Decrease - - - - - - - - - - - -- - - - - - - - - - - -
Net: Increase + Stay the same 7 2 2 - - - 3 2 1 4 7 -89.0% 68.9% 100.0% - - - 100.0% 100.0% 100.0% 82.8% 89.0% -
Mean score 3.0 3.0 3.0 - - - 3.0 3.0 3.0 3.0 3.0 -
Columns Tested: a,b,c,d,e,f - g,h,i - j,k
CATI Fieldwork: 27th September - 19th October 2017 Prepared by ComRes Page 91

Table 82/1
Jobs Outlook - Wave 19Q15_7. Which job functions in your organisation, if any, do you think will see an increase or decrease in the number of temporary agency workers in the next four to twelve months? Health & social careBase: All who recruit temporary agency workers in each job function
REGION SIZE SECTOR
Total North MidlandsSouth excluding
LondonSouth including
London London Other 0-49 50-249 250+ Private PublicSignificance Level: 95% *a *b *c *d *e *f *g *h *i *j *k
Unweighted Total 5 2 - - 2 2 1 1 3 1 5 -
Weighted Total 5 2 - - 2 2 1 1 3 1 5 -100.0% 100.0% - - 100.0% 100.0% 100.0% 100.0% 100.0% 100.0% 100.0% -
Greatly increase (5) - - - - - - - - - - - -- - - - - - - - - - - -
Slightly increase (4) 1 1 - - - - - - 1 - 1 -18.4% 50.7% - - - - - - 32.3% - 18.4% -
Stay the same (3) 4 1 - - 2 2 1 1 2 1 4 -81.6% 49.3% - - 100.0% 100.0% 100.0% 100.0% 67.7% 100.0% 81.6% -
Slightly decrease (2) - - - - - - - - - - - -- - - - - - - - - - - -
Greatly decrease (1) - - - - - - - - - - - -- - - - - - - - - - - -
Don't know - - - - - - - - - - - -- - - - - - - - - - - -
NETS
Net: Increase 1 1 - - - - - - 1 - 1 -18.4% 50.7% - - - - - - 32.3% - 18.4% -
Net: Decrease - - - - - - - - - - - -- - - - - - - - - - - -
Net: Increase + Stay the same 5 2 - - 2 2 1 1 3 1 5 -100.0% 100.0% - - 100.0% 100.0% 100.0% 100.0% 100.0% 100.0% 100.0% -
Mean score 3.2 3.5 - - 3.0 3.0 3.0 3.0 3.3 3.0 3.2 -
Columns Tested: a,b,c,d,e,f - g,h,i - j,k
CATI Fieldwork: 27th September - 19th October 2017 Prepared by ComRes Page 92

Table 83/1
Jobs Outlook - Wave 19Q15_8. Which job functions in your organisation, if any, do you think will see an increase or decrease in the number of temporary agency workers in the next four to twelve months? HospitalityBase: All who recruit temporary agency workers in each job function
REGION SIZE SECTOR
Total North MidlandsSouth excluding
LondonSouth including
London London Other 0-49 50-249 250+ Private PublicSignificance Level: 95% *a *b *c *d *e *f *g *h *i *j *k
Unweighted Total 3 - 1 - 1 1 1 - - 3 3 -
Weighted Total 3 - 1 - 1 1 1 - - 3 3 -100.0% - 100.0% - 100.0% 100.0% 100.0% - - 100.0% 100.0% -
Greatly increase (5) - - - - - - - - - - - -- - - - - - - - - - - -
Slightly increase (4) - - - - - - - - - - - -- - - - - - - - - - - -
Stay the same (3) 3 - 1 - 1 1 1 - - 3 3 -100.0% - 100.0% - 100.0% 100.0% 100.0% - - 100.0% 100.0% -
Slightly decrease (2) - - - - - - - - - - - -- - - - - - - - - - - -
Greatly decrease (1) - - - - - - - - - - - -- - - - - - - - - - - -
Don't know - - - - - - - - - - - -- - - - - - - - - - - -
NETS
Net: Increase - - - - - - - - - - - -- - - - - - - - - - - -
Net: Decrease - - - - - - - - - - - -- - - - - - - - - - - -
Net: Increase + Stay the same 3 - 1 - 1 1 1 - - 3 3 -100.0% - 100.0% - 100.0% 100.0% 100.0% - - 100.0% 100.0% -
Mean score 3.0 - 3.0 - 3.0 3.0 3.0 - - 3.0 3.0 -
Columns Tested: a,b,c,d,e,f - g,h,i - j,k
CATI Fieldwork: 27th September - 19th October 2017 Prepared by ComRes Page 93

Table 84/1
Jobs Outlook - Wave 19Q15_9. Which job functions in your organisation, if any, do you think will see an increase or decrease in the number of temporary agency workers in the next four to twelve months? IndustrialBase: All who recruit temporary agency workers in each job function
REGION SIZE SECTOR
Total North MidlandsSouth excluding
LondonSouth including
London London Other 0-49 50-249 250+ Private PublicSignificance Level: 95% *a *b *c *d *e *f *g *h *i *j *k
Unweighted Total 9 2 4 1 1 - 2 3 2 4 9 -
Weighted Total 8 2 4 1 1 - 2 3 2 4 8 -100.0% 100.0% 100.0% 100.0% 100.0% - 100.0% 100.0% 100.0% 100.0% 100.0% -
Greatly increase (5) - - - - - - - - - - - -- - - - - - - - - - - -
Slightly increase (4) 2 - 2 - - - - 1 - 1 2 -22.4% - 50.2% - - - - 33.7% - 24.6% 22.4% -
Stay the same (3) 5 1 2 1 1 - 1 1 2 2 5 -56.2% 51.9% 49.8% 100.0% 100.0% - 52.1% 33.2% 100.0% 52.8% 56.2% -
Slightly decrease (2) 1 - - - - - 1 1 - - 1 -11.4% - - - - - 47.9% 33.1% - - 11.4% -
Greatly decrease (1) - - - - - - - - - - - -- - - - - - - - - - - -
Don't know 1 1 - - - - - - - 1 1 -9.9% 48.1% - - - - - - - 22.6% 9.9% -
NETS
Net: Increase 2 - 2 - - - - 1 - 1 2 -22.4% - 50.2% - - - - 33.7% - 24.6% 22.4% -
Net: Decrease 1 - - - - - 1 1 - - 1 -11.4% - - - - - 47.9% 33.1% - - 11.4% -
Net: Increase + Stay the same 7 1 4 1 1 - 1 2 2 3 7 -78.7% 51.9% 100.0% 100.0% 100.0% - 52.1% 66.9% 100.0% 77.4% 78.7% -
Mean score 3.1 3.0 3.5 3.0 3.0 - 2.5 3.0 3.0 3.3 3.1 -
Columns Tested: a,b,c,d,e,f - g,h,i - j,k
CATI Fieldwork: 27th September - 19th October 2017 Prepared by ComRes Page 94

Table 85/1
Jobs Outlook - Wave 19Q15_10. Which job functions in your organisation, if any, do you think will see an increase or decrease in the number of temporary agency workers in the next four to twelve months? Legal & HRBase: All who recruit temporary agency workers in each job function
REGION SIZE SECTOR
Total North MidlandsSouth excluding
LondonSouth including
London London Other 0-49 50-249 250+ Private PublicSignificance Level: 95% *a *b *c *d *e *f *g *h *i *j *k
Unweighted Total 8 4 1 1 2 1 1 1 2 5 8 -
Weighted Total 7 4 1 1 2 1 1 1 2 5 7 -100.0% 100.0% 100.0% 100.0% 100.0% 100.0% 100.0% 100.0% 100.0% 100.0% 100.0% -
Greatly increase (5) - - - - - - - - - - - -- - - - - - - - - - - -
Slightly increase (4) - - - - - - - - - - - -- - - - - - - - - - - -
Stay the same (3) 6 3 1 1 2 1 - - 2 4 6 -75.6% 76.7% 100.0% 100.0% 100.0% 100.0% - - 100.0% 82.0% 75.6% -
Slightly decrease (2) 1 - - - - - 1 1 - - 1 -13.1% - - - - - 100.0% 100.0% - - 13.1% -
Greatly decrease (1) - - - - - - - - - - - -- - - - - - - - - - - -
Don't know 1 1 - - - - - - - 1 1 -11.4% 23.3% - - - - - - - 18.0% 11.4% -
NETS
Net: Increase - - - - - - - - - - - -- - - - - - - - - - - -
Net: Decrease 1 - - - - - 1 1 - - 1 -13.1% - - - - - 100.0% 100.0% - - 13.1% -
Net: Increase + Stay the same 6 3 1 1 2 1 - - 2 4 6 -75.6% 76.7% 100.0% 100.0% 100.0% 100.0% - - 100.0% 82.0% 75.6% -
Mean score 2.9 3.0 3.0 3.0 3.0 3.0 2.0 2.0 3.0 3.0 2.9 -
Columns Tested: a,b,c,d,e,f - g,h,i - j,k
CATI Fieldwork: 27th September - 19th October 2017 Prepared by ComRes Page 95

Table 86/1
Jobs Outlook - Wave 19Q15_11. Which job functions in your organisation, if any, do you think will see an increase or decrease in the number of temporary agency workers in the next four to twelve months? Life sciencesBase: All who recruit temporary agency workers in each job function
REGION SIZE SECTOR
Total North MidlandsSouth excluding
LondonSouth including
London London Other 0-49 50-249 250+ Private PublicSignificance Level: 95% *a *b *c *d *e *f *g *h *i *j *k
Unweighted Total - - - - - - - - - - - -
Weighted Total - - - - - - - - - - - -- - - - - - - - - - - -
Greatly increase (5) - - - - - - - - - - - -- - - - - - - - - - - -
Slightly increase (4) - - - - - - - - - - - -- - - - - - - - - - - -
Stay the same (3) - - - - - - - - - - - -- - - - - - - - - - - -
Slightly decrease (2) - - - - - - - - - - - -- - - - - - - - - - - -
Greatly decrease (1) - - - - - - - - - - - -- - - - - - - - - - - -
Don't know - - - - - - - - - - - -- - - - - - - - - - - -
NETS
Net: Increase - - - - - - - - - - - -- - - - - - - - - - - -
Net: Decrease - - - - - - - - - - - -- - - - - - - - - - - -
Net: Increase + Stay the same - - - - - - - - - - - -- - - - - - - - - - - -
Mean score - - - - - - - - - - - -
Columns Tested: a,b,c,d,e,f - g,h,i - j,k
CATI Fieldwork: 27th September - 19th October 2017 Prepared by ComRes Page 96

Table 87/1
Jobs Outlook - Wave 19Q15_12. Which job functions in your organisation, if any, do you think will see an increase or decrease in the number of temporary agency workers in the next four to twelve months? Marketing, media & creativeBase: All who recruit temporary agency workers in each job function
REGION SIZE SECTOR
Total North MidlandsSouth excluding
LondonSouth including
London London Other 0-49 50-249 250+ Private PublicSignificance Level: 95% *a *b *c *d *e *f *g *h *i *j *k
Unweighted Total 11 2 4 2 2 - 3 4 4 3 10 1
Weighted Total 10 2 4 2 2 - 3 4 4 3 10 1100.0% 100.0% 100.0% 100.0% 100.0% - 100.0% 100.0% 100.0% 100.0% 100.0% 100.0%
Greatly increase (5) - - - - - - - - - - - -- - - - - - - - - - - -
Slightly increase (4) 1 - - 1 1 - - - - 1 1 -8.8% - - 46.4% 46.4% - - - - 34.4% 9.7% -
Stay the same (3) 8 1 4 1 1 - 2 3 4 1 7 174.1% 50.1% 100.0% 53.6% 53.6% - 67.2% 75.6% 100.0% 34.2% 71.4% 100.0%
Slightly decrease (2) 1 - - - - - 1 1 - - 1 -9.2% - - - - - 32.8% 24.4% - - 10.1% -
Greatly decrease (1) - - - - - - - - - - - -- - - - - - - - - - - -
Don't know 1 1 - - - - - - - 1 1 -8.0% 49.9% - - - - - - - 31.4% 8.8% -
NETS
Net: Increase 1 - - 1 1 - - - - 1 1 -8.8% - - 46.4% 46.4% - - - - 34.4% 9.7% -
Net: Decrease 1 - - - - - 1 1 - - 1 -9.2% - - - - - 32.8% 24.4% - - 10.1% -
Net: Increase + Stay the same 9 1 4 2 2 - 2 3 4 2 8 182.8% 50.1% 100.0% 100.0% 100.0% - 67.2% 75.6% 100.0% 68.6% 81.1% 100.0%
Mean score 3.0 3.0 3.0 3.5 3.5 - 2.7 2.8 3.0 3.5 3.0 3.0
Columns Tested: a,b,c,d,e,f - g,h,i - j,k
CATI Fieldwork: 27th September - 19th October 2017 Prepared by ComRes Page 97
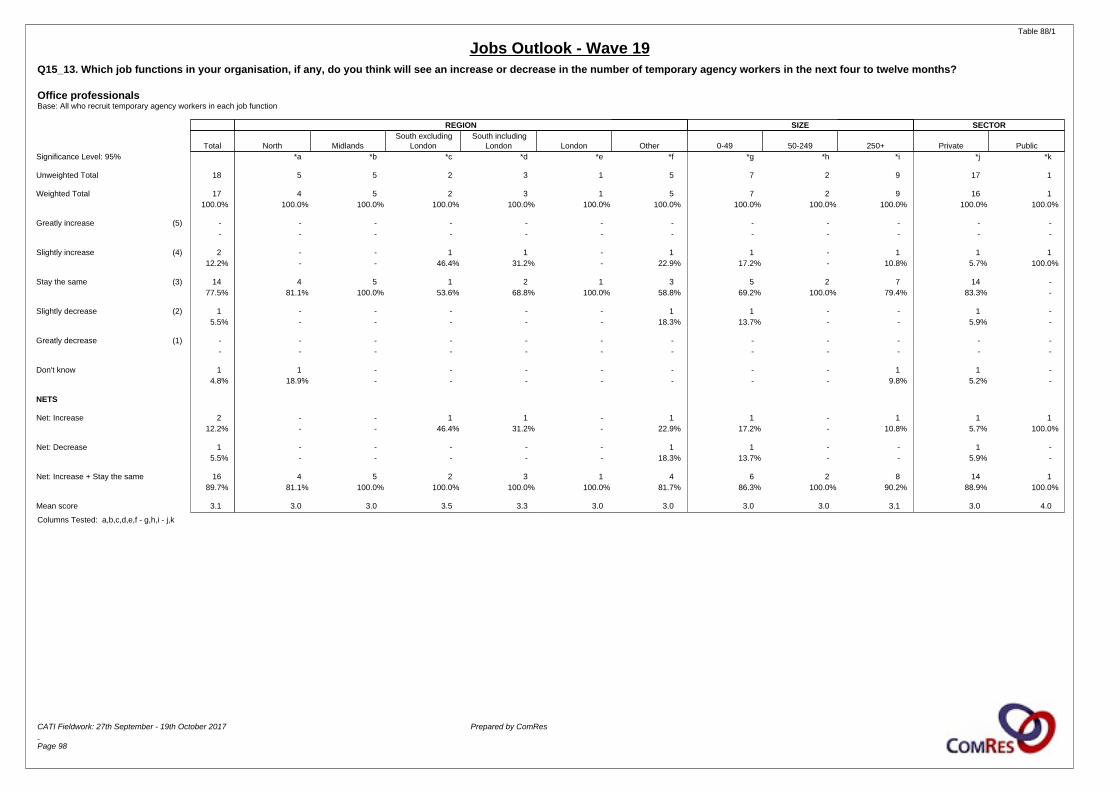
Table 88/1
Jobs Outlook - Wave 19Q15_13. Which job functions in your organisation, if any, do you think will see an increase or decrease in the number of temporary agency workers in the next four to twelve months? Office professionalsBase: All who recruit temporary agency workers in each job function
REGION SIZE SECTOR
Total North MidlandsSouth excluding
LondonSouth including
London London Other 0-49 50-249 250+ Private PublicSignificance Level: 95% *a *b *c *d *e *f *g *h *i *j *k
Unweighted Total 18 5 5 2 3 1 5 7 2 9 17 1
Weighted Total 17 4 5 2 3 1 5 7 2 9 16 1100.0% 100.0% 100.0% 100.0% 100.0% 100.0% 100.0% 100.0% 100.0% 100.0% 100.0% 100.0%
Greatly increase (5) - - - - - - - - - - - -- - - - - - - - - - - -
Slightly increase (4) 2 - - 1 1 - 1 1 - 1 1 112.2% - - 46.4% 31.2% - 22.9% 17.2% - 10.8% 5.7% 100.0%
Stay the same (3) 14 4 5 1 2 1 3 5 2 7 14 -77.5% 81.1% 100.0% 53.6% 68.8% 100.0% 58.8% 69.2% 100.0% 79.4% 83.3% -
Slightly decrease (2) 1 - - - - - 1 1 - - 1 -5.5% - - - - - 18.3% 13.7% - - 5.9% -
Greatly decrease (1) - - - - - - - - - - - -- - - - - - - - - - - -
Don't know 1 1 - - - - - - - 1 1 -4.8% 18.9% - - - - - - - 9.8% 5.2% -
NETS
Net: Increase 2 - - 1 1 - 1 1 - 1 1 112.2% - - 46.4% 31.2% - 22.9% 17.2% - 10.8% 5.7% 100.0%
Net: Decrease 1 - - - - - 1 1 - - 1 -5.5% - - - - - 18.3% 13.7% - - 5.9% -
Net: Increase + Stay the same 16 4 5 2 3 1 4 6 2 8 14 189.7% 81.1% 100.0% 100.0% 100.0% 100.0% 81.7% 86.3% 100.0% 90.2% 88.9% 100.0%
Mean score 3.1 3.0 3.0 3.5 3.3 3.0 3.0 3.0 3.0 3.1 3.0 4.0
Columns Tested: a,b,c,d,e,f - g,h,i - j,k
CATI Fieldwork: 27th September - 19th October 2017 Prepared by ComRes Page 98

Table 89/1
Jobs Outlook - Wave 19Q15_14. Which job functions in your organisation, if any, do you think will see an increase or decrease in the number of temporary agency workers in the next four to twelve months? Sales & retailBase: All who recruit temporary agency workers in each job function
REGION SIZE SECTOR
Total North MidlandsSouth excluding
LondonSouth including
London London Other 0-49 50-249 250+ Private PublicSignificance Level: 95% *a *b *c *d *e *f *g *h *i *j *k
Unweighted Total 6 1 2 1 1 - 2 3 - 3 5 1
Weighted Total 6 1 2 1 1 - 2 3 - 3 5 1100.0% 100.0% 100.0% 100.0% 100.0% - 100.0% 100.0% - 100.0% 100.0% 100.0%
Greatly increase (5) - - - - - - - - - - - -- - - - - - - - - - - -
Slightly increase (4) 2 - - 1 1 - 1 1 - 1 1 136.7% - - 100.0% 100.0% - 54.6% 38.6% - 34.4% 20.0% 100.0%
Stay the same (3) 3 - 2 - - - 1 2 - 1 3 -48.9% - 100.0% - - - 45.4% 61.4% - 34.2% 61.7% -
Slightly decrease (2) - - - - - - - - - - - -- - - - - - - - - - - -
Greatly decrease (1) - - - - - - - - - - - -- - - - - - - - - - - -
Don't know 1 1 - - - - - - - 1 1 -14.4% 100.0% - - - - - - - 31.4% 18.2% -
NETS
Net: Increase 2 - - 1 1 - 1 1 - 1 1 136.7% - - 100.0% 100.0% - 54.6% 38.6% - 34.4% 20.0% 100.0%
Net: Decrease - - - - - - - - - - - -- - - - - - - - - - - -
Net: Increase + Stay the same 5 - 2 1 1 - 2 3 - 2 4 185.6% - 100.0% 100.0% 100.0% - 100.0% 100.0% - 68.6% 81.8% 100.0%
Mean score 3.4 - 3.0 4.0 4.0 - 3.5 3.4 - 3.5 3.2 4.0
Columns Tested: a,b,c,d,e,f - g,h,i - j,k
CATI Fieldwork: 27th September - 19th October 2017 Prepared by ComRes Page 99

Table 90/1
Jobs Outlook - Wave 19Q15_15. Which job functions in your organisation, if any, do you think will see an increase or decrease in the number of temporary agency workers in the next four to twelve months? TechnologyBase: All who recruit temporary agency workers in each job function
REGION SIZE SECTOR
Total North MidlandsSouth excluding
LondonSouth including
London London Other 0-49 50-249 250+ Private PublicSignificance Level: 95% *a *b *c *d *e *f *g *h *i *j *k
Unweighted Total 7 1 1 1 2 1 3 2 1 4 7 -
Weighted Total 7 1 1 1 2 1 3 2 1 4 7 -100.0% 100.0% 100.0% 100.0% 100.0% 100.0% 100.0% 100.0% 100.0% 100.0% 100.0% -
Greatly increase (5) - - - - - - - - - - - -- - - - - - - - - - - -
Slightly increase (4) 1 - - 1 1 - - - - 1 1 -13.8% - - 100.0% 48.7% - - - - 23.9% 13.8% -
Stay the same (3) 5 1 1 - 1 1 2 1 1 3 5 -71.7% 100.0% 100.0% - 51.3% 100.0% 68.1% 51.1% 100.0% 76.1% 71.7% -
Slightly decrease (2) 1 - - - - - 1 1 - - 1 -14.5% - - - - - 31.9% 48.9% - - 14.5% -
Greatly decrease (1) - - - - - - - - - - - -- - - - - - - - - - - -
Don't know - - - - - - - - - - - -- - - - - - - - - - - -
NETS
Net: Increase 1 - - 1 1 - - - - 1 1 -13.8% - - 100.0% 48.7% - - - - 23.9% 13.8% -
Net: Decrease 1 - - - - - 1 1 - - 1 -14.5% - - - - - 31.9% 48.9% - - 14.5% -
Net: Increase + Stay the same 6 1 1 1 2 1 2 1 1 4 6 -85.5% 100.0% 100.0% 100.0% 100.0% 100.0% 68.1% 51.1% 100.0% 100.0% 85.5% -
Mean score 3.0 3.0 3.0 4.0 3.5 3.0 2.7 2.5 3.0 3.2 3.0 -
Columns Tested: a,b,c,d,e,f - g,h,i - j,k
CATI Fieldwork: 27th September - 19th October 2017 Prepared by ComRes Page 100

Table 91/1
Jobs Outlook - Wave 19Q16. In which, if any, of these job functions do you expect to find a shortage of appropriate candidates for temporary agency worker roles?Base: All who recruit temporary agency workers in each job function
REGION SIZE SECTOR
Total North MidlandsSouth excluding
LondonSouth including
London London Other 0-49 50-249 250+ Private PublicSignificance Level: 95% *a *b *c *d *e *f *g *h *i j *k
Unweighted Total 36 11 9 4 8 4 8 13 12 11 32 4
Weighted Total 35 10 9 4 8 4 8 13 11 11 31 4100.0% 100.0% 100.0% 100.0% 100.0% 100.0% 100.0% 100.0% 100.0% 100.0% 100.0% 100.0%
Accounting and financial services 1 1 - - - - - - 1 - 1 -7.4% 23.7% - - - - - - 32.9% - 8.0% -
Construction 3 1 1 1 1 - - 2 1 - 3 -41.7% 100.0% 48.6% 100.0% 100.0% - - 50.1% 46.7% - 41.7% -
Drivers 2 1 - - - - 1 2 - - 2 -20.8% 34.2% - - - - 26.2% 40.6% - - 20.8% -
Education 3 1 1 - 1 1 - 1 1 1 2 161.4% 100.0% 100.0% - 50.0% 50.0% - 100.0% 100.0% 32.4% 48.9% 100.0%
Engineering & technical 1 - 1 - - - - 1 - - 1 -15.6% - 27.3% - - - - 35.5% - - 15.6% -
Executive recruitment / interimmanagement
- - - - - - - - - - - -- - - - - - - - - - - -
Health & social care 2 2 - - - - - - 2 - 2 -36.4% 100.0% - - - - - - 63.8% - 36.4% -
Hospitality - - - - - - - - - - - -- - - - - - - - - - - -
Industrial 4 1 2 1 1 - - 2 2 - 4 -44.5% 51.9% 51.5% 100.0% 100.0% - - 66.9% 100.0% - 44.5% -
Legal & HR - - - - - - - - - - - -- - - - - - - - - - - -
Life sciences - - - - - - - - - - - -- - - - - - - - - - - -
Marketing, media & creative - - - - - - - - - - - -- - - - - - - - - - - -
Office professionals - - - - - - - - - - - -- - - - - - - - - - - -
Sales & retail - - - - - - - - - - - -- - - - - - - - - - - -
Columns Tested: a,b,c,d,e,f - g,h,i - j,k
CATI Fieldwork: 27th September - 19th October 2017 Prepared by ComRes Page 101

Table 91/2
Jobs Outlook - Wave 19Q16. In which, if any, of these job functions do you expect to find a shortage of appropriate candidates for temporary agency worker roles?Base: All who recruit temporary agency workers in each job function
REGION SIZE SECTOR
Total North MidlandsSouth excluding
LondonSouth including
London London Other 0-49 50-249 250+ Private PublicSignificance Level: 95% *a *b *c *d *e *f *g *h *i j *k
Unweighted Total 36 11 9 4 8 4 8 13 12 11 32 4
Weighted Total 35 10 9 4 8 4 8 13 11 11 31 4100.0% 100.0% 100.0% 100.0% 100.0% 100.0% 100.0% 100.0% 100.0% 100.0% 100.0% 100.0%
Technology 1 - - 1 1 - - - - 1 1 -13.8% - - 100.0% 48.7% - - - - 23.9% 13.8% -
None 20 4 5 1 4 3 7 6 6 9 17 358.4% 44.4% 54.9% 23.1% 49.4% 75.0% 87.2% 45.0% 52.0% 82.1% 56.7% 70.6%
Net: Any 14 6 4 3 4 1 1 7 5 2 13 141.6% 55.6% 45.1% 76.9% 50.6% 25.0% 12.8% 55.0% 48.0% 17.9% 43.3% 29.4%
Columns Tested: a,b,c,d,e,f - g,h,i - j,k
CATI Fieldwork: 27th September - 19th October 2017 Prepared by ComRes Page 102

Table 92/1
Jobs Outlook - Wave 19Q17_SUM. How important or otherwise are each of the following factors to you when it comes to choosing and using a recruitment agency to source temporary agency workers? Please rate each factor on a scale from 1 to 5, where 1 means not at all important and 5 means very important. SUMMARY TABLEBase: All who recruit temporary agency workers
Total 1 Not at all important 2 3 4 5 Very important N/A Net: Not important Net: Important Mean
Price/Costs of the workers 38 1 1 6 11 18 1 2 28 4.2100.0% 2.4% 2.7% 16.7% 28.1% 47.2% 2.8% 5.2% 75.4%
Quality of service 38 1 1 1 10 24 1 2 34 4.5100.0% 2.4% 2.2% 2.4% 25.9% 64.2% 2.8% 4.7% 90.1%
Brand image of the agency 38 5 10 12 9 2 1 14 10 2.8100.0% 12.4% 25.6% 31.4% 22.7% 5.1% 2.8% 38.0% 27.8%
Expertise of the agency, in terms ofregions and sectors covered
38 1 2 4 8 22 1 3 30 4.3100.0% 2.4% 5.0% 9.7% 21.7% 58.3% 2.8% 7.4% 80.0%
Management information provided 38 2 7 6 9 11 2 9 21 3.6100.0% 5.2% 18.4% 16.7% 24.5% 30.1% 5.2% 23.5% 54.6%
Membership of a trade of professionalorganisation
38 5 6 12 7 8 1 11 14 3.2100.0% 12.5% 16.5% 31.0% 17.4% 20.2% 2.4% 29.0% 37.6%
Other 38 - - - - - 38 - - -100.0% - - - - - 100.0% - -
CATI Fieldwork: 27th September - 19th October 2017 Prepared by ComRes Page 103

Table 93/1
Jobs Outlook - Wave 19Q17_1. How important or otherwise are each of the following factors to you when it comes to choosing and using a recruitment agency to source temporary agency workers? Please rate each factor on a scale from 1 to 5, where 1 means not at all important and 5 means very important. Price/Costs of the workersBase: All who recruit temporary agency workers
REGION SIZE SECTOR
Total North MidlandsSouth excluding
LondonSouth including
London London Other 0-49 50-249 250+ Private PublicSignificance Level: 95% *a *b *c *d *e *f *g *h *i j *k
Unweighted Total 39 13 10 4 8 4 8 14 12 13 35 4
Weighted Total 38 12 10 4 8 4 8 14 11 12 33 4100.0% 100.0% 100.0% 100.0% 100.0% 100.0% 100.0% 100.0% 100.0% 100.0% 100.0% 100.0%
1 Not at all important (1) 1 - 1 - - - - 1 - - 1 -2.4% - 9.4% - - - - 6.4% - - 2.7% -
2 (2) 1 - 1 - - - - - 1 - 1 -2.7% - 10.6% - - - - - 9.3% - 3.1% -
3 (3) 6 4 1 1 1 - - 1 4 2 6 -16.7% 36.6% 10.5% 24.2% 11.9% - - 6.3% 33.4% 13.6% 18.8% -
4 (4) 11 4 2 2 3 1 2 3 2 6 11 -28.1% 31.5% 19.2% 52.7% 38.7% 25.0% 24.1% 20.5% 16.9% 47.1% 31.8% -
5 Very important (5) 18 4 5 1 4 3 5 10 4 4 13 447.2% 31.9% 50.3% 23.1% 49.4% 75.0% 63.4% 66.7% 40.4% 30.7% 40.4% 100.0%
N/A 1 - - - - - 1 - - 1 1 -2.8% - - - - - 12.5% - - 8.6% 3.1% -
NETS
Net: Not important 2 - 2 - - - - 1 1 - 2 -5.2% - 20.0% - - - - 6.4% 9.3% - 5.9% -
Net: Important 28 8 7 3 7 4 7 12 6 10 24 475.4% 63.4% 69.6% 75.8% 88.1% 100.0% 87.5% 87.2% 57.3% 77.8% 72.2% 100.0%
Mean score 4.2 4.0 3.9 4.0 4.4 4.8 4.7 4.4 3.9 4.2 4.1 5.0
Columns Tested: a,b,c,d,e,f - g,h,i - j,k
CATI Fieldwork: 27th September - 19th October 2017 Prepared by ComRes Page 104

Table 94/1
Jobs Outlook - Wave 19Q17_2. How important or otherwise are each of the following factors to you when it comes to choosing and using a recruitment agency to source temporary agency workers? Please rate each factor on a scale from 1 to 5, where 1 means not at all important and 5 means very important. Quality of serviceBase: All who recruit temporary agency workers
REGION SIZE SECTOR
Total North MidlandsSouth excluding
LondonSouth including
London London Other 0-49 50-249 250+ Private PublicSignificance Level: 95% *a *b *c *d *e *f *g *h *i j *k
Unweighted Total 39 13 10 4 8 4 8 14 12 13 35 4
Weighted Total 38 12 10 4 8 4 8 14 11 12 33 4100.0% 100.0% 100.0% 100.0% 100.0% 100.0% 100.0% 100.0% 100.0% 100.0% 100.0% 100.0%
1 Not at all important (1) 1 - 1 - - - - 1 - - 1 -2.4% - 9.4% - - - - 6.4% - - 2.7% -
2 (2) 1 1 - - - - - - - 1 1 -2.2% 7.1% - - - - - - - 6.8% 2.5% -
3 (3) 1 1 - - - - - 1 - - 1 -2.4% 7.6% - - - - - 6.3% - - 2.7% -
4 (4) 10 2 3 2 3 1 2 4 3 3 10 -25.9% 14.7% 30.9% 52.7% 38.7% 25.0% 24.3% 28.5% 26.1% 22.8% 29.3% -
5 Very important (5) 24 8 6 2 5 3 5 8 8 8 20 464.2% 70.6% 59.7% 47.3% 61.3% 75.0% 63.2% 58.8% 73.9% 61.8% 59.6% 100.0%
N/A 1 - - - - - 1 - - 1 1 -2.8% - - - - - 12.5% - - 8.6% 3.1% -
NETS
Net: Not important 2 1 1 - - - - 1 - 1 2 -4.7% 7.1% 9.4% - - - - 6.4% - 6.8% 5.3% -
Net: Important 34 10 9 4 8 4 7 12 11 10 30 490.1% 85.3% 90.6% 100.0% 100.0% 100.0% 87.5% 87.2% 100.0% 84.6% 88.9% 100.0%
Mean score 4.5 4.5 4.3 4.5 4.6 4.8 4.7 4.3 4.7 4.5 4.5 5.0
Columns Tested: a,b,c,d,e,f - g,h,i - j,k
CATI Fieldwork: 27th September - 19th October 2017 Prepared by ComRes Page 105

Table 95/1
Jobs Outlook - Wave 19Q17_3. How important or otherwise are each of the following factors to you when it comes to choosing and using a recruitment agency to source temporary agency workers? Please rate each factor on a scale from 1 to 5, where 1 means not at all important and 5 means very important. Brand image of the agencyBase: All who recruit temporary agency workers
REGION SIZE SECTOR
Total North MidlandsSouth excluding
LondonSouth including
London London Other 0-49 50-249 250+ Private PublicSignificance Level: 95% *a *b *c *d *e *f *g *h *i j *k
Unweighted Total 39 13 10 4 8 4 8 14 12 13 35 4
Weighted Total 38 12 10 4 8 4 8 14 11 12 33 4100.0% 100.0% 100.0% 100.0% 100.0% 100.0% 100.0% 100.0% 100.0% 100.0% 100.0% 100.0%
1 Not at all important (1) 5 2 1 - 2 2 - 2 3 - 5 -12.4% 14.4% 10.6% - 25.4% 50.0% - 14.0% 24.1% - 14.0% -
2 (2) 10 2 4 2 2 - 2 2 3 5 10 -25.6% 14.7% 40.3% 48.6% 24.0% - 25.3% 14.3% 26.7% 37.8% 28.9% -
3 (3) 12 4 3 2 4 2 1 5 3 4 8 331.4% 32.4% 29.7% 51.4% 50.7% 50.0% 14.5% 38.3% 24.1% 30.0% 25.5% 77.6%
4 (4) 9 5 1 - - - 3 3 3 3 8 122.7% 38.5% 10.0% - - - 35.6% 19.9% 25.0% 23.7% 22.7% 22.4%
5 Very important (5) 2 - 1 - - - 1 2 - - 2 -5.1% - 9.4% - - - 12.0% 13.5% - - 5.8% -
N/A 1 - - - - - 1 - - 1 1 -2.8% - - - - - 12.5% - - 8.6% 3.1% -
NETS
Net: Not important 14 3 5 2 4 2 2 4 6 5 14 -38.0% 29.1% 50.9% 48.6% 49.3% 50.0% 25.3% 28.3% 50.8% 37.8% 42.9% -
Net: Important 10 5 2 - - - 4 5 3 3 9 127.8% 38.5% 19.4% - - - 47.7% 33.4% 25.0% 23.7% 28.5% 22.4%
Mean score 2.8 3.0 2.7 2.5 2.3 2.0 3.4 3.0 2.5 2.8 2.8 3.2
Columns Tested: a,b,c,d,e,f - g,h,i - j,k
CATI Fieldwork: 27th September - 19th October 2017 Prepared by ComRes Page 106

Table 96/1
Jobs Outlook - Wave 19Q17_4. How important or otherwise are each of the following factors to you when it comes to choosing and using a recruitment agency to source temporary agency workers? Please rate each factor on a scale from 1 to 5, where 1 means not at all important and 5 means very important. Expertise of the agency, in terms of regions and sectors coveredBase: All who recruit temporary agency workers
REGION SIZE SECTOR
Total North MidlandsSouth excluding
LondonSouth including
London London Other 0-49 50-249 250+ Private PublicSignificance Level: 95% *a *b *c *d *e *f *g *h *i j *k
Unweighted Total 39 13 10 4 8 4 8 14 12 13 35 4
Weighted Total 38 12 10 4 8 4 8 14 11 12 33 4100.0% 100.0% 100.0% 100.0% 100.0% 100.0% 100.0% 100.0% 100.0% 100.0% 100.0% 100.0%
1 Not at all important (1) 1 - 1 - - - - 1 - - 1 -2.4% - 9.4% - - - - 6.4% - - 2.7% -
2 (2) 2 - - 1 2 1 - - 2 - 2 -5.0% - - 24.2% 24.6% 25.0% - - 16.9% - 5.6% -
3 (3) 4 2 1 - 1 1 - 1 2 1 4 -9.7% 14.1% 10.5% - 12.7% 25.0% - 6.8% 16.8% 6.8% 11.0% -
4 (4) 8 5 1 - - - 2 5 1 2 6 221.7% 41.2% 10.6% - - - 27.0% 37.3% 8.2% 15.9% 17.1% 57.4%
5 Very important (5) 22 5 7 3 5 2 5 7 6 8 20 258.3% 44.6% 69.6% 75.8% 62.7% 50.0% 60.5% 49.5% 58.1% 68.7% 60.3% 42.6%
N/A 1 - - - - - 1 - - 1 1 -2.8% - - - - - 12.5% - - 8.6% 3.1% -
NETS
Net: Not important 3 - 1 1 2 1 - 1 2 - 3 -7.4% - 9.4% 24.2% 24.6% 25.0% - 6.4% 16.9% - 8.4% -
Net: Important 30 10 8 3 5 2 7 12 7 10 26 480.0% 85.9% 80.2% 75.8% 62.7% 50.0% 87.5% 86.8% 66.3% 84.6% 77.5% 100.0%
Mean score 4.3 4.3 4.3 4.3 4.0 3.8 4.7 4.2 4.1 4.7 4.3 4.4
Columns Tested: a,b,c,d,e,f - g,h,i - j,k
CATI Fieldwork: 27th September - 19th October 2017 Prepared by ComRes Page 107

Table 97/1
Jobs Outlook - Wave 19Q17_5. How important or otherwise are each of the following factors to you when it comes to choosing and using a recruitment agency to source temporary agency workers? Please rate each factor on a scale from 1 to 5, where 1 means not at all important and 5 means very important. Management information providedBase: All who recruit temporary agency workers
REGION SIZE SECTOR
Total North MidlandsSouth excluding
LondonSouth including
London London Other 0-49 50-249 250+ Private PublicSignificance Level: 95% *a *b *c *d *e *f *g *h *i j *k
Unweighted Total 39 13 10 4 8 4 8 14 12 13 35 4
Weighted Total 38 12 10 4 8 4 8 14 11 12 33 4100.0% 100.0% 100.0% 100.0% 100.0% 100.0% 100.0% 100.0% 100.0% 100.0% 100.0% 100.0%
1 Not at all important (1) 2 - 2 - - - - 1 - 1 2 -5.2% - 19.8% - - - - 7.2% - 7.5% 5.8% -
2 (2) 7 1 2 1 2 1 2 3 2 2 6 118.4% 7.0% 19.8% 24.2% 24.6% 25.0% 27.0% 21.7% 17.4% 15.3% 17.1% 28.0%
3 (3) 6 3 2 1 1 - - 2 1 4 6 -16.7% 29.3% 19.4% 24.5% 12.1% - - 13.2% 8.2% 28.6% 18.9% -
4 (4) 9 3 - 1 3 2 3 3 4 2 7 224.5% 26.4% - 28.3% 39.3% 50.0% 36.9% 23.8% 33.7% 16.9% 20.9% 51.9%
5 Very important (5) 11 4 4 1 2 1 2 5 5 2 10 130.1% 29.6% 40.9% 23.1% 24.1% 25.0% 23.6% 34.1% 40.7% 15.8% 31.4% 20.1%
N/A 2 1 - - - - 1 - - 2 2 -5.2% 7.6% - - - - 12.5% - - 15.9% 5.9% -
NETS
Net: Not important 9 1 4 1 2 1 2 4 2 3 8 123.5% 7.0% 39.7% 24.2% 24.6% 25.0% 27.0% 28.8% 17.4% 22.8% 22.9% 28.0%
Net: Important 21 7 4 2 5 3 5 8 8 4 17 354.6% 56.0% 40.9% 51.4% 63.4% 75.0% 60.5% 58.0% 74.4% 32.6% 52.3% 72.0%
Mean score 3.6 3.9 3.2 3.5 3.6 3.8 3.7 3.6 4.0 3.2 3.6 3.6
Columns Tested: a,b,c,d,e,f - g,h,i - j,k
CATI Fieldwork: 27th September - 19th October 2017 Prepared by ComRes Page 108

Table 98/1
Jobs Outlook - Wave 19Q17_6. How important or otherwise are each of the following factors to you when it comes to choosing and using a recruitment agency to source temporary agency workers? Please rate each factor on a scale from 1 to 5, where 1 means not at all important and 5 means very important. Membership of a trade of professional organisationBase: All who recruit temporary agency workers
REGION SIZE SECTOR
Total North MidlandsSouth excluding
LondonSouth including
London London Other 0-49 50-249 250+ Private PublicSignificance Level: 95% *a *b *c *d *e *f *g *h *i j *k
Unweighted Total 39 13 10 4 8 4 8 14 12 13 35 4
Weighted Total 38 12 10 4 8 4 8 14 11 12 33 4100.0% 100.0% 100.0% 100.0% 100.0% 100.0% 100.0% 100.0% 100.0% 100.0% 100.0% 100.0%
1 Not at all important (1) 5 1 3 - - - 1 3 1 1 5 -12.5% 7.1% 29.3% - - - 12.0% 20.7% 7.6% 7.5% 14.1% -
2 (2) 6 1 2 2 3 1 - 4 2 - 5 116.5% 10.7% 20.4% 52.4% 38.5% 25.0% - 29.9% 17.4% - 14.8% 29.4%
3 (3) 12 4 1 2 4 2 3 2 4 6 10 231.0% 30.3% 10.6% 47.6% 48.8% 50.0% 39.5% 14.8% 34.6% 46.6% 28.8% 48.1%
4 (4) 7 3 2 - - - 2 1 3 3 6 117.4% 21.7% 19.9% - - - 24.1% 6.9% 24.5% 23.2% 16.7% 22.4%
5 Very important (5) 8 3 2 - 1 1 2 4 2 2 8 -20.2% 22.5% 19.8% - 12.7% 25.0% 24.3% 27.7% 15.9% 15.4% 22.9% -
N/A 1 1 - - - - - - - 1 1 -2.4% 7.6% - - - - - - - 7.4% 2.7% -
NETS
Net: Not important 11 2 5 2 3 1 1 7 3 1 10 129.0% 17.8% 49.7% 52.4% 38.5% 25.0% 12.0% 50.6% 25.0% 7.5% 28.9% 29.4%
Net: Important 14 5 4 - 1 1 4 5 4 5 13 137.6% 44.3% 39.7% - 12.7% 25.0% 48.4% 34.6% 40.4% 38.6% 39.6% 22.4%
Mean score 3.2 3.5 2.8 2.5 2.9 3.3 3.5 2.9 3.2 3.4 3.2 2.9
Columns Tested: a,b,c,d,e,f - g,h,i - j,k
CATI Fieldwork: 27th September - 19th October 2017 Prepared by ComRes Page 109

Table 99/1
Jobs Outlook - Wave 19Q17_7. How important or otherwise are each of the following factors to you when it comes to choosing and using a recruitment agency to source temporary agency workers? Please rate each factor on a scale from 1 to 5, where 1 means not at all important and 5 means very important. OtherBase: All who recruit temporary agency workers
REGION SIZE SECTOR
Total North MidlandsSouth excluding
LondonSouth including
London London Other 0-49 50-249 250+ Private PublicSignificance Level: 95% *a *b *c *d *e *f *g *h *i j *k
Unweighted Total 39 13 10 4 8 4 8 14 12 13 35 4
Weighted Total 38 12 10 4 8 4 8 14 11 12 33 4100.0% 100.0% 100.0% 100.0% 100.0% 100.0% 100.0% 100.0% 100.0% 100.0% 100.0% 100.0%
1 Not at all important (1) - - - - - - - - - - - -- - - - - - - - - - - -
2 (2) - - - - - - - - - - - -- - - - - - - - - - - -
3 (3) - - - - - - - - - - - -- - - - - - - - - - - -
4 (4) - - - - - - - - - - - -- - - - - - - - - - - -
5 Very important (5) - - - - - - - - - - - -- - - - - - - - - - - -
N/A 38 12 10 4 8 4 8 14 11 12 33 4100.0% 100.0% 100.0% 100.0% 100.0% 100.0% 100.0% 100.0% 100.0% 100.0% 100.0% 100.0%
NETS
Net: Not important - - - - - - - - - - - -- - - - - - - - - - - -
Net: Important - - - - - - - - - - - -- - - - - - - - - - - -
Mean score - - - - - - - - - - - -
Columns Tested: a,b,c,d,e,f - g,h,i - j,k
CATI Fieldwork: 27th September - 19th October 2017 Prepared by ComRes Page 110

Table 100/1
Jobs Outlook - Wave 19Q18_SUM. How important or otherwise would you say that temporary agency workers are for your organisation for each of the following? Rate on a scale from 1 to 5, where 1 means not at all important and 5 means very important. SUMMARY TABLEBase: All who recruit temporary agency workers
Total 1 Not at all important 2 3 4 5 Very important Net: Not important Net: Important Mean
Meeting peaks in demand at certain times ofyear (seasonality)
38 5 1 6 8 18 6 26 3.9100.0% 12.8% 2.4% 15.9% 20.1% 48.8% 15.2% 68.9%
Responding to growth, as new customers arewon
38 5 1 9 13 10 6 23 3.6100.0% 12.4% 2.6% 25.0% 33.4% 26.6% 15.0% 60.0%
Managing fast changing organisationalrequirements
38 3 5 12 10 8 8 18 3.4100.0% 7.7% 12.8% 30.6% 27.1% 21.8% 20.5% 48.9%
Covering short term staff leave or absences 38 3 - 11 11 13 3 24 3.8100.0% 7.8% - 28.9% 28.4% 34.9% 7.8% 63.3%
Helping to keep running costs down 38 9 5 8 9 8 14 16 3.0100.0% 23.0% 13.3% 20.3% 22.9% 20.5% 36.3% 43.4%
Managing uncertainty during economicdownturn or at other times
38 6 2 16 9 5 8 14 3.1100.0% 15.1% 5.2% 43.5% 23.9% 12.3% 20.2% 36.3%
Providing short term access to key strategicskills
38 6 4 10 13 6 10 18 3.2100.0% 15.2% 10.5% 26.0% 33.6% 14.6% 25.7% 48.3%
CATI Fieldwork: 27th September - 19th October 2017 Prepared by ComRes Page 111
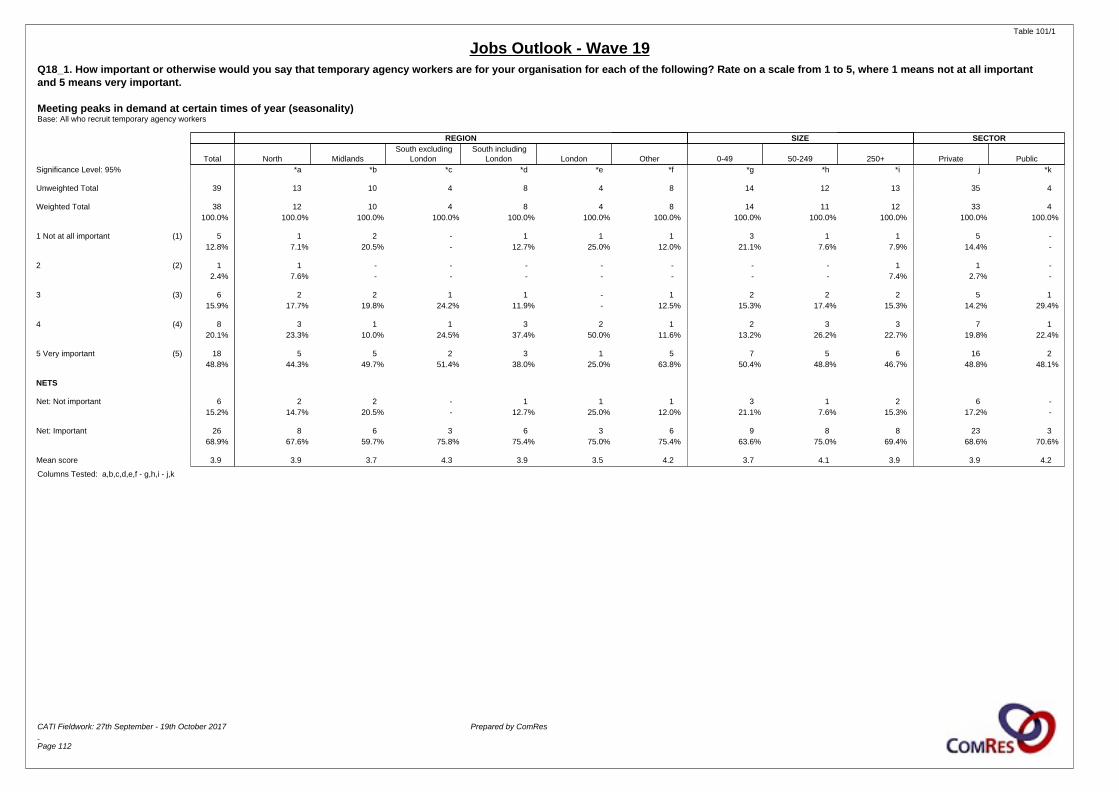
Table 101/1
Jobs Outlook - Wave 19Q18_1. How important or otherwise would you say that temporary agency workers are for your organisation for each of the following? Rate on a scale from 1 to 5, where 1 means not at all important and 5 means very important. Meeting peaks in demand at certain times of year (seasonality)Base: All who recruit temporary agency workers
REGION SIZE SECTOR
Total North MidlandsSouth excluding
LondonSouth including
London London Other 0-49 50-249 250+ Private PublicSignificance Level: 95% *a *b *c *d *e *f *g *h *i j *k
Unweighted Total 39 13 10 4 8 4 8 14 12 13 35 4
Weighted Total 38 12 10 4 8 4 8 14 11 12 33 4100.0% 100.0% 100.0% 100.0% 100.0% 100.0% 100.0% 100.0% 100.0% 100.0% 100.0% 100.0%
1 Not at all important (1) 5 1 2 - 1 1 1 3 1 1 5 -12.8% 7.1% 20.5% - 12.7% 25.0% 12.0% 21.1% 7.6% 7.9% 14.4% -
2 (2) 1 1 - - - - - - - 1 1 -2.4% 7.6% - - - - - - - 7.4% 2.7% -
3 (3) 6 2 2 1 1 - 1 2 2 2 5 115.9% 17.7% 19.8% 24.2% 11.9% - 12.5% 15.3% 17.4% 15.3% 14.2% 29.4%
4 (4) 8 3 1 1 3 2 1 2 3 3 7 120.1% 23.3% 10.0% 24.5% 37.4% 50.0% 11.6% 13.2% 26.2% 22.7% 19.8% 22.4%
5 Very important (5) 18 5 5 2 3 1 5 7 5 6 16 248.8% 44.3% 49.7% 51.4% 38.0% 25.0% 63.8% 50.4% 48.8% 46.7% 48.8% 48.1%
NETS
Net: Not important 6 2 2 - 1 1 1 3 1 2 6 -15.2% 14.7% 20.5% - 12.7% 25.0% 12.0% 21.1% 7.6% 15.3% 17.2% -
Net: Important 26 8 6 3 6 3 6 9 8 8 23 368.9% 67.6% 59.7% 75.8% 75.4% 75.0% 75.4% 63.6% 75.0% 69.4% 68.6% 70.6%
Mean score 3.9 3.9 3.7 4.3 3.9 3.5 4.2 3.7 4.1 3.9 3.9 4.2
Columns Tested: a,b,c,d,e,f - g,h,i - j,k
CATI Fieldwork: 27th September - 19th October 2017 Prepared by ComRes Page 112

Table 102/1
Jobs Outlook - Wave 19Q18_2. How important or otherwise would you say that temporary agency workers are for your organisation for each of the following? Rate on a scale from 1 to 5, where 1 means not at all important and 5 means very important. Responding to growth, as new customers are wonBase: All who recruit temporary agency workers
REGION SIZE SECTOR
Total North MidlandsSouth excluding
LondonSouth including
London London Other 0-49 50-249 250+ Private PublicSignificance Level: 95% *a *b *c *d *e *f *g *h *i j *k
Unweighted Total 39 13 10 4 8 4 8 14 12 13 35 4
Weighted Total 38 12 10 4 8 4 8 14 11 12 33 4100.0% 100.0% 100.0% 100.0% 100.0% 100.0% 100.0% 100.0% 100.0% 100.0% 100.0% 100.0%
1 Not at all important (1) 5 2 2 - - - 1 1 2 2 5 -12.4% 14.1% 20.3% - - - 12.0% 7.1% 16.8% 14.7% 14.0% -
2 (2) 1 - - - 1 1 - 1 - - 1 -2.6% - - - 12.7% 25.0% - 6.8% - - 2.9% -
3 (3) 9 3 2 1 2 1 3 4 1 5 9 -25.0% 22.3% 18.7% 24.5% 24.7% 25.0% 36.6% 25.8% 8.7% 38.9% 28.3% -
4 (4) 13 3 3 3 4 1 3 4 6 3 11 233.4% 22.3% 31.1% 75.5% 49.9% 25.0% 36.9% 29.0% 51.0% 22.8% 32.2% 42.6%
5 Very important (5) 10 5 3 - 1 1 1 4 3 3 8 226.6% 41.3% 29.8% - 12.7% 25.0% 14.5% 31.4% 23.5% 23.7% 22.6% 57.4%
NETS
Net: Not important 6 2 2 - 1 1 1 2 2 2 6 -15.0% 14.1% 20.3% - 12.7% 25.0% 12.0% 13.8% 16.8% 14.7% 16.9% -
Net: Important 23 8 6 3 5 2 4 9 8 6 18 460.0% 63.6% 60.9% 75.5% 62.6% 50.0% 51.4% 60.3% 74.5% 46.5% 54.8% 100.0%
Mean score 3.6 3.8 3.5 3.8 3.6 3.5 3.4 3.7 3.6 3.4 3.5 4.6
Columns Tested: a,b,c,d,e,f - g,h,i - j,k
CATI Fieldwork: 27th September - 19th October 2017 Prepared by ComRes Page 113

Table 103/1
Jobs Outlook - Wave 19Q18_3. How important or otherwise would you say that temporary agency workers are for your organisation for each of the following? Rate on a scale from 1 to 5, where 1 means not at all important and 5 means very important. Managing fast changing organisational requirementsBase: All who recruit temporary agency workers
REGION SIZE SECTOR
Total North MidlandsSouth excluding
LondonSouth including
London London Other 0-49 50-249 250+ Private PublicSignificance Level: 95% *a *b *c *d *e *f *g *h *i j *k
Unweighted Total 39 13 10 4 8 4 8 14 12 13 35 4
Weighted Total 38 12 10 4 8 4 8 14 11 12 33 4100.0% 100.0% 100.0% 100.0% 100.0% 100.0% 100.0% 100.0% 100.0% 100.0% 100.0% 100.0%
1 Not at all important (1) 3 1 1 - - - 1 2 1 - 3 -7.7% 7.1% 10.6% - - - 12.0% 14.3% 7.6% - 8.6% -
2 (2) 5 1 1 - 2 2 1 3 - 2 5 -12.8% 7.6% 9.4% - 25.4% 50.0% 12.8% 20.6% - 15.4% 14.5% -
3 (3) 12 3 4 2 3 1 2 4 4 4 12 -30.6% 22.3% 39.2% 52.4% 38.5% 25.0% 25.1% 27.1% 34.3% 31.4% 34.6% -
4 (4) 10 4 3 - 1 1 2 4 4 3 7 327.1% 33.9% 30.9% - 12.7% 25.0% 26.1% 24.5% 34.9% 23.0% 20.2% 79.9%
5 Very important (5) 8 3 1 2 2 - 2 2 3 4 7 121.8% 29.0% 9.9% 47.6% 23.4% - 24.1% 13.5% 23.2% 30.2% 22.0% 20.1%
NETS
Net: Not important 8 2 2 - 2 2 2 5 1 2 8 -20.5% 14.7% 20.0% - 25.4% 50.0% 24.8% 34.9% 7.6% 15.4% 23.1% -
Net: Important 18 7 4 2 3 1 4 5 6 7 14 448.9% 63.0% 40.8% 47.6% 36.1% 25.0% 50.1% 38.1% 58.1% 53.2% 42.3% 100.0%
Mean score 3.4 3.7 3.2 4.0 3.3 2.8 3.4 3.0 3.7 3.7 3.3 4.2
Columns Tested: a,b,c,d,e,f - g,h,i - j,k
CATI Fieldwork: 27th September - 19th October 2017 Prepared by ComRes Page 114

Table 104/1
Jobs Outlook - Wave 19Q18_4. How important or otherwise would you say that temporary agency workers are for your organisation for each of the following? Rate on a scale from 1 to 5, where 1 means not at all important and 5 means very important. Covering short term staff leave or absencesBase: All who recruit temporary agency workers
REGION SIZE SECTOR
Total North MidlandsSouth excluding
LondonSouth including
London London Other 0-49 50-249 250+ Private PublicSignificance Level: 95% *a *b *c *d *e *f *g *h *i j *k
Unweighted Total 39 13 10 4 8 4 8 14 12 13 35 4
Weighted Total 38 12 10 4 8 4 8 14 11 12 33 4100.0% 100.0% 100.0% 100.0% 100.0% 100.0% 100.0% 100.0% 100.0% 100.0% 100.0% 100.0%
1 Not at all important (1) 3 1 1 - - - 1 3 - - 3 -7.8% 7.6% 10.6% - - - 12.0% 20.6% - - 8.8% -
2 (2) - - - - - - - - - - - -- - - - - - - - - - - -
3 (3) 11 3 3 2 3 1 2 7 2 2 10 128.9% 25.4% 28.6% 52.4% 38.5% 25.0% 25.3% 50.1% 15.8% 16.0% 28.8% 29.4%
4 (4) 11 2 4 1 2 1 3 2 5 4 9 228.4% 15.7% 40.9% 23.1% 24.1% 25.0% 35.6% 13.9% 43.8% 31.2% 26.5% 42.6%
5 Very important (5) 13 6 2 1 3 2 2 2 4 6 12 134.9% 51.3% 19.9% 24.5% 37.4% 50.0% 27.0% 15.3% 40.4% 52.8% 35.8% 28.0%
NETS
Net: Not important 3 1 1 - - - 1 3 - - 3 -7.8% 7.6% 10.6% - - - 12.0% 20.6% - - 8.8% -
Net: Important 24 8 6 2 5 3 5 4 9 10 21 363.3% 66.9% 60.8% 47.6% 61.5% 75.0% 62.6% 29.2% 84.2% 84.0% 62.3% 70.6%
Mean score 3.8 4.0 3.6 3.7 4.0 4.3 3.7 3.0 4.2 4.4 3.8 4.0
Columns Tested: a,b,c,d,e,f - g,h,i - j,k
CATI Fieldwork: 27th September - 19th October 2017 Prepared by ComRes Page 115

Table 105/1
Jobs Outlook - Wave 19Q18_5. How important or otherwise would you say that temporary agency workers are for your organisation for each of the following? Rate on a scale from 1 to 5, where 1 means not at all important and 5 means very important. Helping to keep running costs downBase: All who recruit temporary agency workers
REGION SIZE SECTOR
Total North MidlandsSouth excluding
LondonSouth including
London London Other 0-49 50-249 250+ Private PublicSignificance Level: 95% *a *b *c *d *e *f *g *h *i j *k
Unweighted Total 39 13 10 4 8 4 8 14 12 13 35 4
Weighted Total 38 12 10 4 8 4 8 14 11 12 33 4100.0% 100.0% 100.0% 100.0% 100.0% 100.0% 100.0% 100.0% 100.0% 100.0% 100.0% 100.0%
1 Not at all important (1) 9 2 4 - - - 3 6 1 2 8 123.0% 14.6% 39.8% - - - 36.4% 41.7% 8.7% 14.3% 23.1% 22.4%
2 (2) 5 - 1 1 2 1 2 1 2 2 5 -13.3% - 10.6% 24.2% 24.6% 25.0% 25.1% 6.8% 17.5% 17.1% 15.0% -
3 (3) 8 3 3 - 1 1 1 2 4 2 8 -20.3% 22.3% 30.4% - 12.7% 25.0% 12.5% 13.6% 34.2% 15.3% 22.9% -
4 (4) 9 5 1 2 3 1 - 3 1 5 7 122.9% 40.1% 9.4% 52.7% 38.7% 25.0% - 22.7% 7.6% 37.1% 22.1% 29.4%
5 Very important (5) 8 3 1 1 2 1 2 2 4 2 6 220.5% 23.0% 9.9% 23.1% 24.1% 25.0% 26.0% 15.2% 31.9% 16.2% 16.9% 48.1%
NETS
Net: Not important 14 2 5 1 2 1 5 7 3 4 13 136.3% 14.6% 50.4% 24.2% 24.6% 25.0% 61.5% 48.5% 26.2% 31.4% 38.2% 22.4%
Net: Important 16 7 2 3 5 2 2 5 4 7 13 343.4% 63.1% 19.2% 75.8% 62.7% 50.0% 26.0% 37.9% 39.5% 53.3% 39.0% 77.6%
Mean score 3.0 3.6 2.4 3.7 3.6 3.5 2.5 2.6 3.4 3.2 2.9 3.8
Columns Tested: a,b,c,d,e,f - g,h,i - j,k
CATI Fieldwork: 27th September - 19th October 2017 Prepared by ComRes Page 116

Table 106/1
Jobs Outlook - Wave 19Q18_6. How important or otherwise would you say that temporary agency workers are for your organisation for each of the following? Rate on a scale from 1 to 5, where 1 means not at all important and 5 means very important. Managing uncertainty during economic downturn or at other timesBase: All who recruit temporary agency workers
REGION SIZE SECTOR
Total North MidlandsSouth excluding
LondonSouth including
London London Other 0-49 50-249 250+ Private PublicSignificance Level: 95% *a *b *c *d *e *f *g *h *i j *k
Unweighted Total 39 13 10 4 8 4 8 14 12 13 35 4
Weighted Total 38 12 10 4 8 4 8 14 11 12 33 4100.0% 100.0% 100.0% 100.0% 100.0% 100.0% 100.0% 100.0% 100.0% 100.0% 100.0% 100.0%
1 Not at all important (1) 6 1 2 - 1 1 2 2 2 2 5 115.1% 7.1% 19.2% - 12.7% 25.0% 23.6% 13.8% 16.3% 15.3% 14.1% 22.4%
2 (2) 2 1 - - - - 1 1 - 1 2 -5.2% 7.6% - - - - 12.5% 6.3% - 8.6% 5.9% -
3 (3) 16 5 5 1 3 2 3 5 4 8 16 -43.5% 45.2% 50.9% 24.5% 37.4% 50.0% 37.9% 34.3% 35.1% 61.8% 49.1% -
4 (4) 9 3 1 3 4 1 1 5 4 1 6 323.9% 25.4% 10.0% 75.5% 49.9% 25.0% 14.5% 31.7% 32.9% 6.8% 17.0% 77.6%
5 Very important (5) 5 2 2 - - - 1 2 2 1 5 -12.3% 14.7% 19.8% - - - 11.5% 13.9% 15.7% 7.5% 13.9% -
NETS
Net: Not important 8 2 2 - 1 1 3 3 2 3 7 120.2% 14.7% 19.2% - 12.7% 25.0% 36.2% 20.2% 16.3% 23.9% 20.0% 22.4%
Net: Important 14 5 3 3 4 1 2 7 5 2 10 336.3% 40.1% 29.9% 75.5% 49.9% 25.0% 26.0% 45.6% 48.6% 14.3% 30.9% 77.6%
Mean score 3.1 3.3 3.1 3.8 3.2 2.8 2.8 3.3 3.3 2.8 3.1 3.3
Columns Tested: a,b,c,d,e,f - g,h,i - j,k
CATI Fieldwork: 27th September - 19th October 2017 Prepared by ComRes Page 117

Table 107/1
Jobs Outlook - Wave 19Q18_7. How important or otherwise would you say that temporary agency workers are for your organisation for each of the following? Rate on a scale from 1 to 5, where 1 means not at all important and 5 means very important. Providing short term access to key strategic skillsBase: All who recruit temporary agency workers
REGION SIZE SECTOR
Total North MidlandsSouth excluding
LondonSouth including
London London Other 0-49 50-249 250+ Private PublicSignificance Level: 95% *a *b *c *d *e *f *g *h *i j *k
Unweighted Total 39 13 10 4 8 4 8 14 12 13 35 4
Weighted Total 38 12 10 4 8 4 8 14 11 12 33 4100.0% 100.0% 100.0% 100.0% 100.0% 100.0% 100.0% 100.0% 100.0% 100.0% 100.0% 100.0%
1 Not at all important (1) 6 2 3 - - - 1 4 1 1 6 -15.2% 14.7% 30.4% - - - 12.0% 27.8% 7.6% 7.5% 17.2% -
2 (2) 4 - 1 2 2 - 1 2 1 1 4 -10.5% - 9.4% 52.4% 25.8% - 12.8% 14.9% 8.2% 7.5% 11.9% -
3 (3) 10 3 3 1 3 2 1 3 4 3 8 226.0% 25.4% 29.7% 23.1% 36.8% 50.0% 12.5% 22.1% 34.5% 22.8% 22.9% 49.6%
4 (4) 13 4 2 1 1 - 5 4 3 6 10 233.6% 37.9% 20.6% 24.5% 12.1% - 62.6% 28.4% 26.2% 46.5% 31.5% 50.4%
5 Very important (5) 6 3 1 - 2 2 - 1 3 2 6 -14.6% 22.0% 9.9% - 25.4% 50.0% - 6.8% 23.5% 15.8% 16.5% -
NETS
Net: Not important 10 2 4 2 2 - 2 6 2 2 10 -25.7% 14.7% 39.8% 52.4% 25.8% - 24.8% 42.7% 15.8% 14.9% 29.1% -
Net: Important 18 7 3 1 3 2 5 5 6 8 16 248.3% 59.9% 30.5% 24.5% 37.4% 50.0% 62.6% 35.2% 49.7% 62.3% 48.0% 50.4%
Mean score 3.2 3.5 2.7 2.7 3.4 4.0 3.3 2.7 3.5 3.6 3.2 3.5
Columns Tested: a,b,c,d,e,f - g,h,i - j,k
CATI Fieldwork: 27th September - 19th October 2017 Prepared by ComRes Page 118

Table 108/1
Jobs Outlook - Wave 19Q19. In terms of temporary agency workers' pay rates, would you say that:Base: All who recruit temporary agency workers
REGION SIZE SECTOR
Total North MidlandsSouth excluding
LondonSouth including
London London Other 0-49 50-249 250+ Private PublicSignificance Level: 95% *a *b *c *d *e *f *g *h *i j *k
Unweighted Total 39 13 10 4 8 4 8 14 12 13 35 4
Weighted Total 38 12 10 4 8 4 8 14 11 12 33 4100.0% 100.0% 100.0% 100.0% 100.0% 100.0% 100.0% 100.0% 100.0% 100.0% 100.0% 100.0%
Temporary agency workers earn morethan they would if they were permanent
10 5 1 1 3 2 1 6 3 1 9 126.2% 40.9% 10.6% 28.3% 39.3% 50.0% 11.5% 43.0% 24.7% 7.9% 25.7% 29.4%
Temporary agency workers earn less thanthey would if they were permanent
4 1 - 1 2 1 1 2 2 - 3 110.4% 7.1% - 24.2% 24.6% 25.0% 14.5% 15.2% 15.8% - 8.2% 28.0%
Temporary agency workers earn aboutthe same as they would if they werepermanent
23 6 8 2 3 1 6 5 7 11 21 261.0% 52.0% 80.0% 47.6% 36.1% 25.0% 74.0% 35.3% 59.5% 92.1% 63.3% 42.6%
Not applicable/Don't know 1 - 1 - - - - 1 - - 1 -2.4% - 9.4% - - - - 6.4% - - 2.7% -
Columns Tested: a,b,c,d,e,f - g,h,i - j,k
CATI Fieldwork: 27th September - 19th October 2017 Prepared by ComRes Page 119

Table 109/1
Jobs Outlook - Wave 19Q20. Approximately what percentage of the temporary workers you use go on to become permanent members of your staff each year?Base: All who recruit temporary workers
REGION SIZE SECTOR
Total North MidlandsSouth excluding
LondonSouth including
London London Other 0-49 50-249 250+ Private PublicSignificance Level: 95% *a *b *c d *e *f g *h i j *k
Unweighted Total 100 22 28 22 34 12 16 43 27 30 84 16
Weighted Total 98 20 27 22 34 12 16 43 26 28 80 17100.0% 100.0% 100.0% 100.0% 100.0% 100.0% 100.0% 100.0% 100.0% 100.0% 100.0% 100.0%
0 27 8 8 5 7 2 4 18 5 4 24 327.3% 40.3% 29.4% 21.4% 19.5% 15.9% 24.0% 42.6% 17.8% 12.4% 29.8% 15.7%
i
1-9 12 3 5 2 3 1 1 4 5 3 9 311.9% 15.4% 17.8% 8.2% 8.3% 8.4% 5.4% 9.9% 17.4% 9.9% 10.6% 18.0%
10-19 10 1 2 2 4 2 3 2 3 5 9 110.3% 4.2% 7.2% 9.0% 11.6% 16.5% 20.4% 5.2% 10.6% 17.8% 11.0% 6.9%
20-49 15 2 4 6 8 2 2 8 4 4 11 515.6% 8.7% 14.1% 24.9% 22.3% 17.2% 12.4% 17.9% 14.5% 13.0% 13.2% 26.7%
50 10 1 3 2 5 3 1 2 5 3 8 210.0% 4.2% 10.7% 8.1% 14.1% 25.5% 7.5% 4.6% 17.9% 11.1% 9.6% 12.0%
51+ 8 2 1 2 3 1 2 2 2 4 7 17.9% 9.6% 3.8% 8.1% 8.1% 8.2% 12.5% 4.7% 7.6% 13.2% 8.6% 5.0%
Don't know 17 4 5 5 5 1 3 7 4 6 14 317.0% 17.6% 17.1% 20.3% 16.2% 8.2% 17.8% 15.1% 14.1% 22.6% 17.3% 15.7%
NETS
Net: At least 1% 54 8 15 13 22 9 9 18 18 18 42 1255.7% 42.1% 53.6% 58.3% 64.4% 75.9% 58.1% 42.3% 68.1% 65.0% 52.9% 68.6%
Net: At least 50% 18 3 4 4 8 4 3 4 7 7 15 317.9% 13.8% 14.5% 16.2% 22.2% 33.8% 20.0% 9.3% 25.6% 24.3% 18.1% 17.0%
Total 1612 261 358 385 684 298 308 452 545 615 1295 317Mean score 19.9 15.9 15.7 21.8 24.0 27.7 23.2 12.3 24.3 28.2 19.5 21.6
Columns Tested: a,b,c,d,e,f - g,h,i - j,k
CATI Fieldwork: 27th September - 19th October 2017 Prepared by ComRes Page 120

Table 110/1
Jobs Outlook - Wave 19T1. The government is due to announce the budget in November of this year. If the Chancellor introduces new measures which may add payroll costs to your business (for example, like whenPension Auto Enrolment was introduced), which of the following actions, if any, would your business take?Base: Wave 20
REGION SIZE SECTOR
Total North MidlandsSouth excluding
LondonSouth including
London London Other 0-49 50-249 250+ Private PublicSignificance Level: 95% a b c d e *f g h i j k
Unweighted Total 200 43 49 45 79 34 29 114 40 46 165 35
Weighted Total 200 44 48 45 78 34 30 116 40 44 165 35100.0% 100.0% 100.0% 100.0% 100.0% 100.0% 100.0% 100.0% 100.0% 100.0% 100.0% 100.0%
Increase the prices of our products orservices
60 9 18 13 24 11 9 43 9 8 50 1030.0% 19.7% 37.3% 29.8% 31.0% 32.5% 30.6% 36.9% 21.5% 19.2% 30.1% 29.2%
i
Unplanned freeze to salaries 27 6 9 7 10 3 2 14 8 5 22 513.6% 14.1% 18.5% 16.5% 13.1% 8.7% 6.1% 11.6% 20.7% 12.3% 13.3% 14.9%
Unplanned headcount freeze 25 4 10 6 7 2 3 10 7 8 20 412.4% 10.1% 20.5% 12.4% 9.5% 5.5% 10.2% 8.4% 18.4% 17.4% 12.4% 12.5%
Unplanned redundancies 20 4 6 4 7 3 3 6 7 7 19 19.8% 8.3% 12.6% 8.5% 8.5% 8.6% 10.9% 5.5% 16.5% 15.2% 11.4% 2.5%
g g
Increase the use of contractors oroutsourcing
19 5 4 7 9 2 1 13 5 1 15 49.4% 11.4% 8.3% 14.9% 11.3% 6.4% 3.3% 11.5% 11.4% 2.2% 9.0% 11.4%
Other 25 5 7 7 10 3 3 10 4 10 21 412.3% 11.9% 14.0% 14.7% 12.1% 8.7% 10.3% 9.0% 9.8% 23.0% 12.6% 10.5%
g
We would not need to take any action tomitigate the effects
94 23 19 24 39 15 14 57 19 19 75 2047.2% 52.0% 38.6% 53.6% 49.6% 44.1% 48.2% 48.8% 48.1% 42.4% 45.4% 55.7%
Columns Tested: a,b,c,d,e,f - g,h,i - j,k
CATI Fieldwork: 27th September - 19th October 2017 Prepared by ComRes Page 121