rec-erc-71-31 - bureau of reclamationfloodeen of bechtel corporation viewed the progress of studies...
TRANSCRIPT
REC-ERC-71-31
T.J. Rhone Engineering and Research Center
Bureau of Reclamation
August 1971
MS-230 (8-70) Bureau of Reclamation
1. REPORT NO. REC-ERC-71-31
4. TITLE AND SUBTITLE
Hydraulic Model Studies of the Intake-Outlet Structure for the Pump-Generation Facility at Mormon Flat Dam, Salt River Project, Arizona
7. AUTHOR(S)
T. J. Rhone
9. PERFORMING ORGANIZATION NAME AND ADDRESS
Engineering and Research Center Bureau of Reclamation Denver, Colorado 80225
12. SPONSORING AGENCY NAME AND ADDRESS
Same
15. SUPPLEMENTARY NOTES
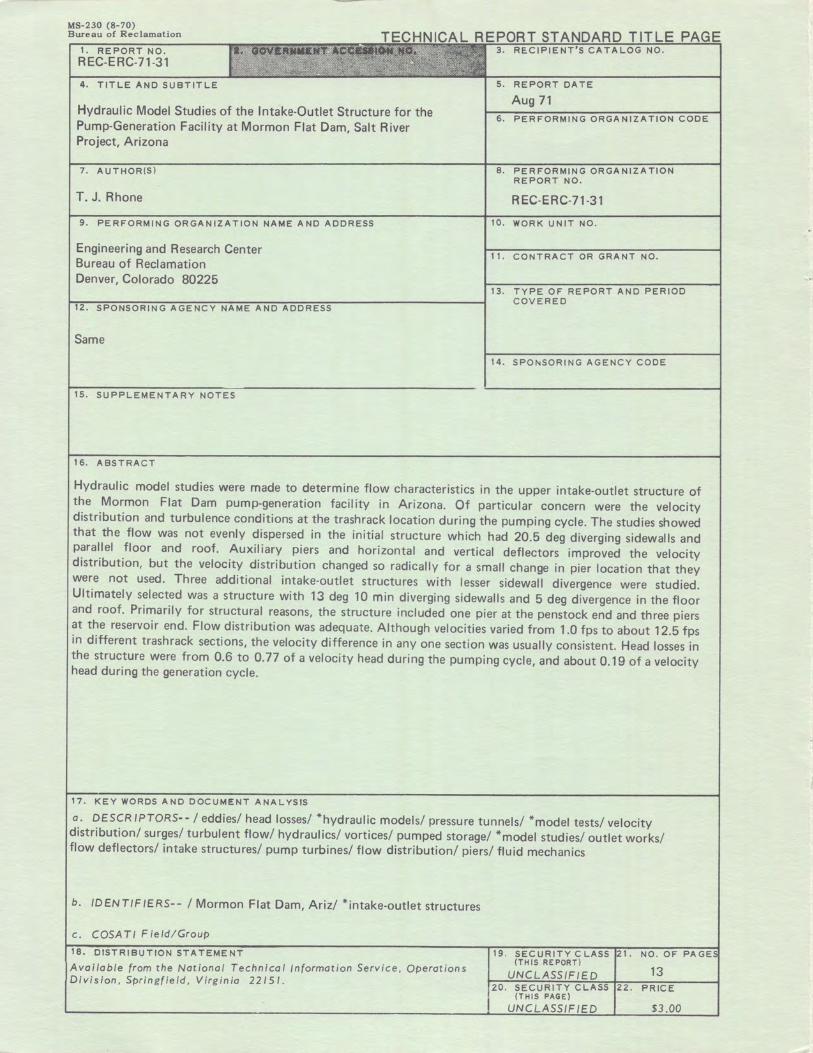
16. ABSTRACT
5. REPORT DATE
Aug 71 6. PERFORMING ORGANIZATION CODE
8. PERFORMING ORGANIZATION REPORT NO.
REC-ERC-71-31
10. WORK UNIT NO .
11. CONTRACT OR GRANT NO.
13. TYPE OF REPORT AND PERIOD COVERED
14. SPONSORING AGENCY CODE
Hydraulic model studies were made to determine flow characteristics in the upper intake-outlet structure of the Mormon Flat Dam pump-generation facility in Arizona. Of particular concern were the velocity distribution and turbulence conditions at the trashrack location during the pumping cycle. The studies showed that the flow was not evenly dispersed in the initial structure which had 20.5 deg diverging sidewalls and parallel floor and roof. Au xii iary piers and horizontal and vertical deflectors improved the velocity distribution, but the velocity distribution changed so radically for a small change in pier location that they were not used. Three additional intake-outlet structures with lesser sidewall divergence were studied. Ultimately selected was a structure with 13 deg 10 min diverging sidewalls and 5 deg divergence in the floor and roof. Primarily for structural reasons, the structure included one pier at the penstock end and three piers at the reservoir end. Flow distribution was adequate. Although velocities varied from 1.0 fps to about 12.5 fps in different trashrack sections, the velocity difference in any one section was usually consistent. Head losses in the structure were from 0.6 to 0.77 of a velocity head during the pumping cycle, and about 0.19 of a velocity head during the generation cycle.
17. KEY WORDS AND DOCUMENT ANALYSIS
a. DESCRIPTORS-- I eddies/ head losses/ *hydraulic models/ pressure tunnels/ *model tests/ velocity distribution/ surges/ turbulent flow/ hydraulics/ vortices/ pumped storage/ *model studies/ outlet works/ flow deflectors/ intake structures/ pump turbines/ flow distribution/ piers/ fluid mechanics
b. IDENTIFIERS-- I Mormon Flat Dam, Ariz/ *intake-outlet structures
c. COSATI Field/Group
18. DISTRIBUTION STATEMENT
Available from the National Technical Information Service, Operations Division, Springfield, Virginia 22/51 .
19. SECURITY CLASS (THIS REPORT)
UNCLASSIFIED 20. SECURITY CLASS
(THIS PAGE)
UNCLASSIFIED
21. NO. OF
13 22 . PRICE
$3.00
PAGE
REC-ERC-71-31
HYDRAULIC MODEL STUDIES OF THE INTAKE-OUTLET STRUCTURE
FOR THE PUMP-GENERATION
FACILITY AT MORMON FLAT DAM SALT RIVER PROJECT, ARIZONA
by T. J. Rhone
August 1971
Hydraulics Branch Division of General Research Engineering and Research Center Denver, Colorado
UNITED STATES DEPARTMENT OF THE INTERIOR Rogers C. B. Morton Secretary
* BUREAU OF RECLAMATION Ellis L. Armstrong Commissioner

ACKNOWLEDGMENT
These studies were conducted under the supervision of W. E. Wagner, Chief, Hydraulics Branch, Division of General Research. During the course of the studies C. E. Whalin of the Salt River Project and E. R. Floodeen of Bechtel Corporation viewed the progress of the studies and offered many helpful suggestions.
Purpose Results Application Introduction The Model The Investigation
Test Procedure
CONTENTS
Velocity Distribution in Penstock and Gate Section Preliminary Structure First Modification Second Modification Third Modification Fourth Modification Center Pier Alterations
Wedges on sides of original pier Modified pier nose
Intermediate Piers Scheme B-1 Scheme 8-2 Scheme B-3 Head Loss Generating Cycle
Table
Flow Distribution Vortex Characteristics
LIST OF TABLES
Velocity distribution in intake structure
LIST OF FIGURES
Figure
1 Location map 2 1: 18.78 scale model layout 3 Looking into trashrack end of initial intake-outlet structure 4 Velocity distribution in penstock between intake structure
and upper elbow-pumping flow 5 Velocity distribution in gate section between penstock and
intake structure-pumping flow 6 Preliminary intake-outlet structure 7 Alternative Schemes B-1, B-2, and 8-3
BA Scheme B-3 with full length center wall-velocity distribution in intake structure
88 Scheme 8-3 with 10-foot (3.0-m) long center pier-velocity distribution in intake structure
9 Velocity distribution in penstock for generating flow
Page
1 1 1 1 2 3
3 3 3 5 5 5 5 5
5 6
6 6 7 8 8
11
11 11
13
1 2 3
4
4 4 7
9
10 12
PURPOSE
These studies were made to verify the hydraulic design of the intake structure and to determine the head loss coefficients of the entrance structure and the penstock. Of primary concern were the velocity distribution and turbulence at the portal of the intake structure during the pumping cycle. The studies were directed toward finding a configuration that would have as nearly even velocity distribution as possible and minimum turbulence at the trashracks.
RESULTS
( 1) During the pumping cycle, flow entered the intake-outlet structure symmetrically.
(2) However, at the end of the intial structure, flow distribution was poor. Flow velocity varied from as low as 1.6 feet per second (fps) (0.5 meters per second) (mps) on the left side to 14.7 fps (4.5 mps) near the right side. Vertical distribution was also poor, and the magnitude of the velocity variations changed with a change in reservoir level.
(3) Deflectors on the sides of the center pier failed to significantly improve flow distribution.
(4) Auxiliary piers in the bays on each side of the center pier improved the lateral flow distribution, but it was necessary to add either floor deflectors or horizontal piers to obtain good vertical distribution.
(5) Flow distribution was very sensitive to minor adjustments in the auxiliary pier placement. Because of this sensitivity, the intake-outlet structure selected for the prototype did not contain auxiliary piers or deflectors.
(6) The intake-outlet structure ultimately selected had 13° sic'?wall divergence and 5° floor and roof divergence. A 10-foot (3.0-m) long pier on the centerline at the penstock end of the structure, and three 6-foot ( 1.8-m) long piers at the reservoir end were included primarily for structural reasons.
(7) Flow distribution in the selected structure (B-3) was considered adequate. Although during the pumping cycle the flow velocity varied from about 1 fps (0.3 mps) to about 12.5 pfs (3.8 mps) in different bays, the difference between maximum and minimum velocity during a measurement was usually less than 2 fps (0.6 mps). This indicated favorable turbulence conditions.
(8) Head losses in the selected intake-outlet structure for the pumping cycle were about 0.61 of a velocity head with the minimum reservoir and 0.77 of a velocity head with the maximum reservoir. For the generating cycle, losses were about 0.19 of a velocity head for all reservoir levels. The velocity head was based on the average velocity in the 18-foot (5.5-m) diameter penstock.
(9) Model observations indicated that no air-entraining vortices should form during normal operation.
APPLICATION
Generally, the results of this study can be applied as a guide in the hydraulic design of an intake-outlet structure for a pumped storage facility.
INTRODUCTION
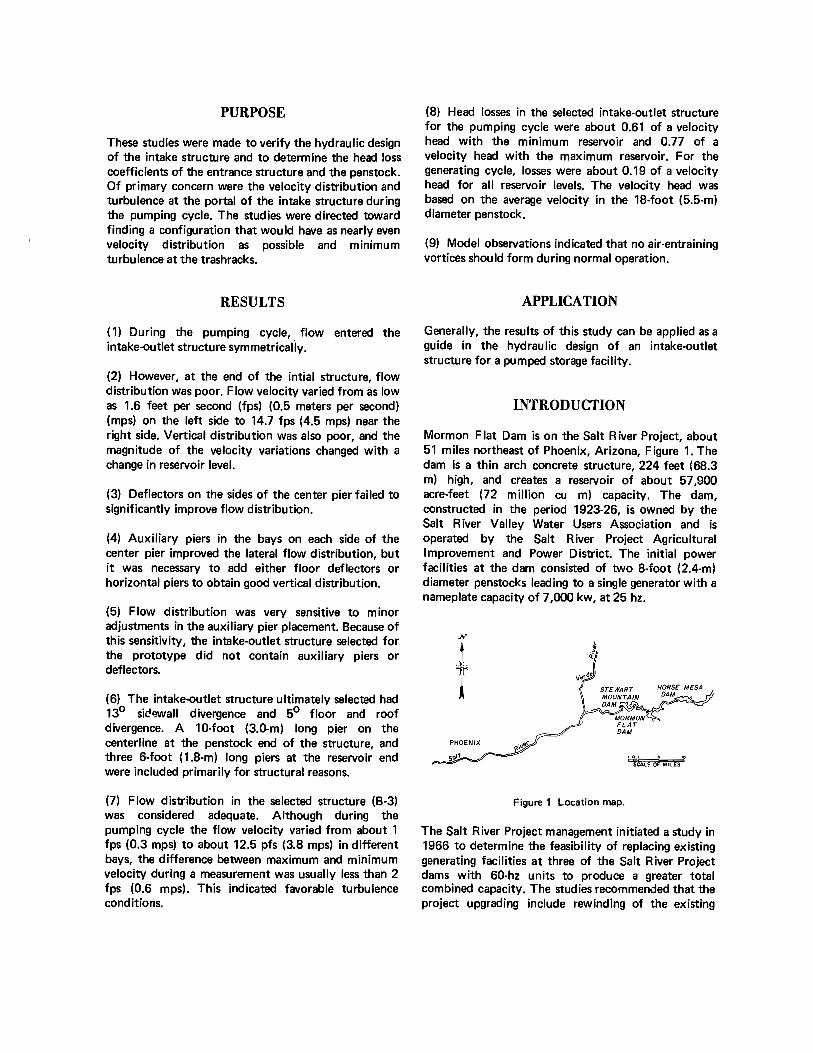
Mormon Flat Dam is on the Salt River Project, about 51 miles northeast of Phoenix, Arizona, Figure 1. The dam is a thin arch concrete structure, 224 feet (68.3 m) high, and creates a reservoir of about 57,900 acre-feet (72 million cu m) capacity. The dam, constructed in the period 1923-26, is owned by the Salt River Valley Water Users Association and is operated by the Salt River Project Agricultural Improvement and Power District. The initial power facilities at the dam consisted of two 8-foot (2.4-m) diameter penstocks leading to a single generator with a nameplate capacity of 7,000 kw, at 25 hz.
.N"
t r
PHOENIX
Figure 1 Location map.
The Salt River Project management initiated a study in 1966 to determine the feasibility of replacing existing generating facilities at three of the Salt River Project dams with 60-hz units to produce a greater total combined capacity. The studies recommended that the project upgrading include rewinding of the existing

generator at Mormon Flat Powerplant and the construction of a new 47-mw reversible-pump turbine unit.
To supply flow to the new generator/motor unit, an 18-foot (5.5-m) diameter penstoc:k through the existing dam will be tied to a new powerhouse a short distance downstream from the existing powerplant. An intake structure for the penstock will be constructed on the upstream side of the dam. Thi~ designs for the new structure were prepared by Biechtel, Incorporated. Bechtel, through Salt River Proj,~ct officials, requested the Bureau of Reclamation to pe1rform hydraulic model studies of the intake-outlet structure and penstock. Studies were conducted at the Bureau's Engineering and Research Center, Denver, Colorado.
THE MODEL
The model, constructed to a scale ratio of 1 : 18. 78, included the entrance structure and the penstock down to the spiral case, Figure 2. The spiral case and
.~WotersuDtly fcrqenerotmqcycle-()uflet ' during pumping cycle
-o 0
generator/motor were not modelod. The entrance and gate structure on the reservoir side of the dam were constructed of wood and styrofoam. The transition from the gate structure to th,~ penstock and the penstock were constructed of clear plastic. Both mitered elbows of the penstock were represented to scale. The model was installed in a 12-foot (3.7-m) square by 14-foot (4.3-m) high tank. Water was supplied to the tank from the permanent laboratory system for the generating cycle tests and from a portable pump at the downstream end of the penstock for the pumping cycle tests.
Water surface elevations and prei;sures were measured by water manometers and by electronic pressure cells through a carrier-amplifier, digiti.:ed by an integrating digital voltmeter. Velocities were measured with a pygmy Price current meter and a miniature propeller meter. The miniature propeller meter has a 1-centimeter-diameter, 5-blade propeller made of plastic suspended in jewel bearin{1s on a stainless steel support. A gold electrode in the same support is mounted near the passing tip 1:>f the propeller. A
~-.:..~" (Wot,,r supply for pum~ing cycle
4,;",f,'fr. Transition I
AL 2--~- - - G,3--I--_::-~=-·-· =""=-· '_"_'_''=''====-'-/==''_'_'_' __ '_"_'_''="-'_'='"'=-"-'_'=-=-=-=-=-=-=-=-=-~=-=-=-=-=--:::s'•~>l7~.E:Vol,es _jA Intake~
'-....J.Pressureondvelocity / Outletdurinq meosurinq stations generotinq cycle
-;Outhneoft2°•12'•14 tonk----
PLAN
/
I
/
·:/Rockbofflef
I
Mnw.s. El~
"~-'--d-~-SECTION A-A
MORMON FLAT DAM PUMP·GENERATION FACILITY
1: 18.78 SCALE MODEL LAYOUT FIGURE 2
Figure 2. 1:18.78 scale model layout.
2
resistance change caused by the short water path between the electrode and tip produces a voltage pulse in a counting unit. The counting unit counts the voltage changes for a period of time. The output from the computing unit is transferred to a counter-timer and displayed on a 6-digit in-line indicator panel or to a tape printer for a digital printout.
THE INVESTIGATION
Test Procedure
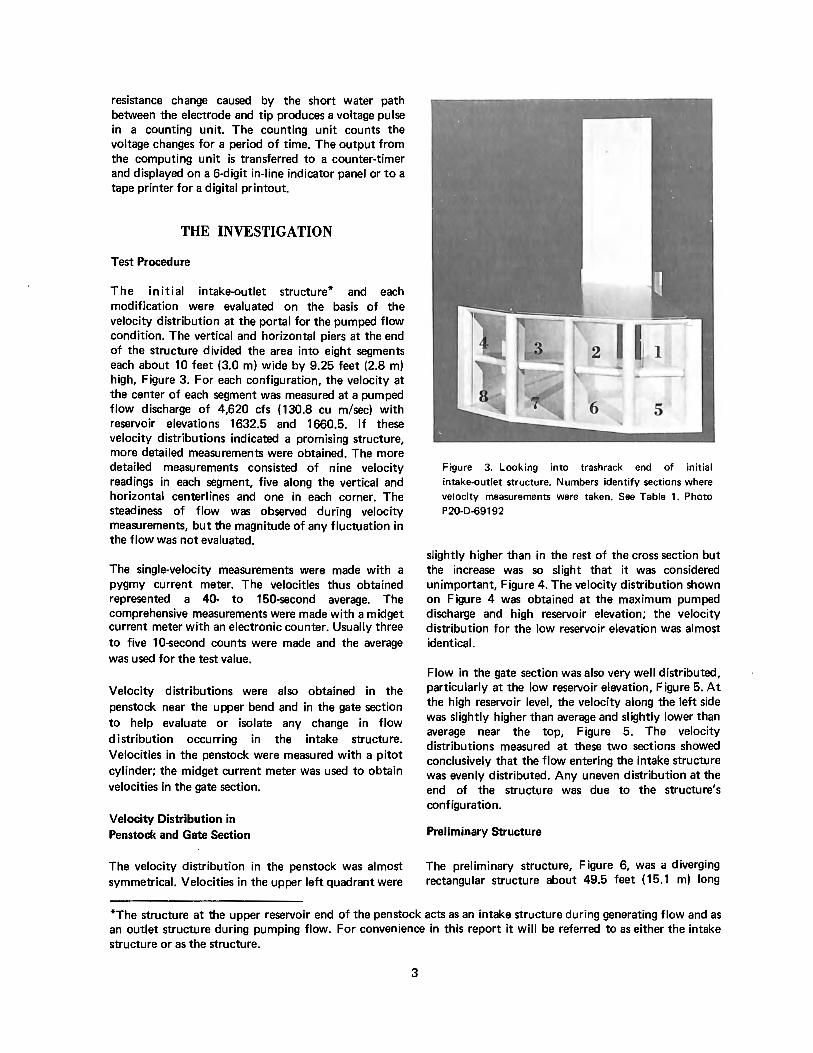
The initial intake-outlet structure* and each modification were evaluated on the basis of the velocity distribution at the portal for the pumped flow condition. The vertical and horizontal piers at the end of the structure divided the area into eight segments each about 10 feet (3.0 m) wide by 9.25 feet (2.8 m) high, Figure 3. For each configuration, the velocity at the center of each segment was measured at a pumped flow discharge of 4,620 cfs (130.8 cu m/sec) with reservoir elevations 1632.5 and 1660.5. If these velocity distributions indicated a promising structure, more detailed measurements were obtained. The more detailed measurements consisted of nine velocity readings in each segment, five along the vertical and horizontal centerlines and one in each corner. The steadiness of flow was observed during velocity measurements, but the magnitude of any fluctuation in the flow was not evaluated.
The single-velocity measurements were made with a pygmy current meter. The velocities thus obtained represented a 40- to 150-second average. The comprehensive measurements were made with a midget current meter with an electronic counter. Usually three to five 10-second counts were made and the average was used for the test value.
Velocity distributions were also obtained in the penstock near the upper bend and in the gate section to help evaluate or isolate any change in flow distribution occurring in the intake structure. Velocities in the penstock were measured with a pitot cylinder; the midget current meter was used to obtain velocities in the gate section.
Velocity Distribution in Penstock and Gate Section
The velocity d istribution in the penstock was almost symmetrical. Velocities in the upper left quadrant were
Figure 3. Looking into trashrack end of initial
intake-outlet structure. Numbers identify sections where
velocity measurements were taken. See Table 1. Photo
P20-D-69192
slightly higher than in the rest of the cross section but the increase was so slight that it was considered unimportant, Figure 4. The velocity distribution shown on Figure 4 was obtained at the maximum pumped discharge and high reservoir elevation; the velocity distribution for the low reservoir elevation was almost identical.
Flow in the gate section was also very well distributed, particularly at the low reservoir elevation, Figure 5. At the high reservoir level, the velocity along the left side was slightly higher than average and slightly lower than average near the top, Figure 5. The velocity distributions measured at these two sections showed conclusively that the flow entering the intake structure was evenly distributed. Any uneven distribution at the end of the structure was due to the structure's configuration.
Preliminary Structure
The preliminary structure, Figure 6, was a diverging rectangular structure about 49.5 feet ( 15.1 m) long
*The structure at the upper reservoir end of the penstock acts as an intake structure during generating flow and as an outlet structure during pumping flow. For convenience in this report it will be referred to as either the intake structure or as the structure.
3
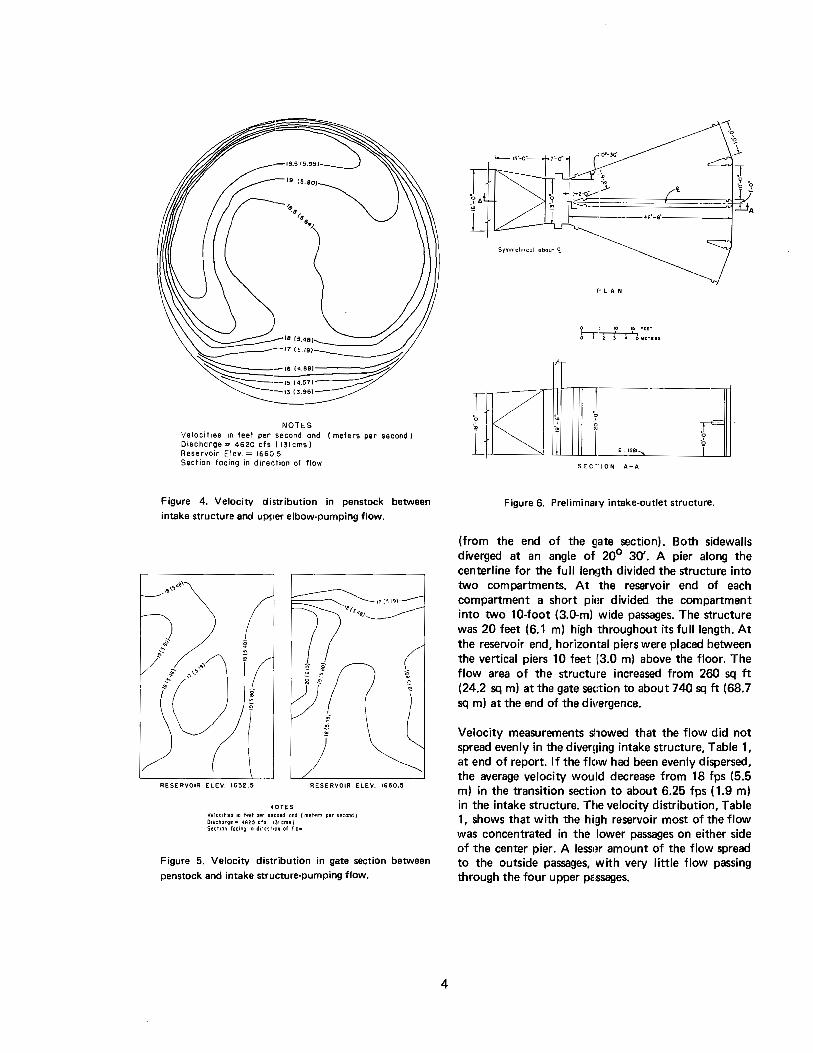
NOTES Velocities in feet per second and ( meters per second J Discharge= 4620 cfs ( 131 ems) Reservoir Elev.= 166C•.5 Section facing in direction of flow
Figure 4. Velocity distribution in penstock between intake structure and upper elbow-pumping flow.
RESERVOIR ELEV. 1632.5 RESERVOIR ELEV, 1660,5
10TES Velocities in feet per second ond ( meters per second 1 Discharge .. 4620 cfs 131 ems) Section facing in direction of fl:,w
Figure 5. Velocity distribution in gate section between penstock and intake structure-pumping flow.
4
Symmetrical about ft.
PLAN
0 I 10 15 FEET f-"-r--~ 0 I I :S 4 '!I METERS
SECl'ION A·A
Figure 6. Preliminal'y intake-outlet structure.
(from the end of the gate section). Both sidewalls diverged at an angle of 20° 30'. A pier along the centerline for the full len,Jth divided the structure into two compartments. At the reservoir end of each compartment a short pior divided the compartment into two 10-foot (3.0-m) wide passages. The structure was 20 feet (6.1 m) high throughout its full length. At the reservoir end, horizontal piers were placed between the vertical piers 10 feet [3.0 m) above the floor. The flow area of the structure increased from 260 sq ft (24.2 sq m) at the gate se<:tion to about 740 sq ft (68.7 sq m) at the end of the divergence.
Velocity measurements showed that the flow did not spread evenly in the diveruing intake structure, Table 1, at end of report. If the flc1w had been evenly dispersed, the average velocity would decrease from 18 fps (5.5 m) in the transition secti1>n to about 6.25 fps ( 1.9 m) in the intake structure. The velocity distribution, Table 1, shows that with the high reservoir most of the flow was concentrated in the lower passages on either side of the center pier. A lessor amount of the flow spread to the outside passages, with very little flow passing through the four upper pi;,ssages.

Similar flow distribution was present at the low reservoir elevation. The major difference was that there was very little flow in the_ lower left side passage; the flow through the upper passage just to the left of the center increased. There was no apparent explanation for this shift in flow pattern but it was repeated in successive tests and was not a random occurrence.
First Modification
Since the flow was concentrated on either side of the center pier, wedge-shaped deflectors were installed on each side of the center pier to deflect the flow toward the outside. The four deflectors tested had s0 , 9-1/2°, 12°, and 14° deflection angles. The 12° and 14° deflectors provided good vertical distribution but forced too much flow toward the outside. The 6° deflector provided good lateral distribution. The best distribution was obtained with the 9-1/2° deflector, but this distribution was not very even on the right side where the upper section adjacent to the pier carried a very small amount of flow and the lower right section carried an excessive amount of flow. The velocity distributions for the various wedge arrangements are shown in Table 1.
Second Modification
In a further attempt to deflect the flow toward the outside, s0 wedges were placed on either side of the center wall and the outside walls were moved toward the center so as to form a 6.5-foot (2.0-m) wide passage about 24 feet (7.3 m) long. At the end of the 24 feet, the outside walls and center pier diverged to the original width at the end of the structure. This arrangement did not improve the velocity distribution over the original design and, actually, was not as effective as the wedges on the center pier without the sidewall change.
Third Modification
Intermediate piers in the passages on each side of the center pier were installed next. The initial piers were 1 foot (0.3 m) wide, 10 feet (3.0 m) long and the full height of the structure. The upstream ends of the piers were in line with the stoplog slot of the center pier and sidewalls. Spacing of the piers for the first trial was based on the flow distribution in the original structure. The upstream ends of the piers were 2.35 feet (0.7 m) away from the center pier and the downstream ends were on the centerline of each bay.
Th is arrangement improved the lateral flow distribution, particularly in the lower passages, Table 1.
5
However, the vertical distribution was inadequate; there was some instability in the flow; and the flow distribution changed between the high and low reservoir elevations. Moving the intermediate piers 0.4 foot (0.1 m) closer to the center pier improved the lateral, but not the vertical, distribution.
Fourth Modification
An upward sloping floor was installed to improve the vertical distribution. The intermediate piers of the second trial of the third modification remained in place. The floor sloped upward 3.8 feet ( 1.2 m) in a distance of 19.5 feet (5.9 m), followed by a 3.4-foot ( 1.0-m) long horizontal section and then a downslope to the original floor elevation at the end of the structure. This arrangement improved the vertical and horizontal distribution, as shown in Table 1, but there was still less flow in the outside lower left section and in both upper right sections.
Increasing the height of the upward slope to 4.3 feet (1.3 m) improved the vertical distribution and provided nearly equal distribution in all sections except in the bottom section on the left side of the center pier, Table 1.
Without the intermediate piers the vertical distribution was adequate but the horizontal distribution was very poor. The upward sloping floor seemed to provide the most promising arrangement for good vertical flow distribution. Many modifications to improve the lateral distribution were studied. In all tests in this series the 4.3-foot (1.3 m) high upward sloping floor was used. The modifications, in addition to the sloping floor, fall into two categories:
( 1) Center pier alterations.
(2) Intermediate piers.
No studies were made on the effect of sidewall additions.
Center Pier Alterations
Wedges on sides of original pier.-Wedges were placed on each side of the center pier starting at the stoplog slot. The wedges diverged 2.32 feet (0.7 m) in a distance of 14.25 feet (4.3 m), or approximately 9-1/4°. Downstream from the widest point the wedges sloped back to the original pier width 6 feet (1.8 m) from the end of the structure. This arrangement improved the lateral dispersion only to a small degree on the left side of the center pier, Table 1. Flow
distribution in the right side was changed considerably. At the high reservoir elevation, flow was concentrated in the bottom section adjacent to the center pier with very I ittle flow in the top outside section. For the low reservoir elevation, most of the flow was deflected to both outside sections with very little flow in the bottom section adjacent to the pier.
Increasing the angle of the cent1~r pier deflectors to 10.75° did not materially change the flow distribution at either reservoir elevation.
It was noted that with the center pier deflectors the average measured velocity in the structure was about 40 percent higher than a Q/A computation would indicate. This was an indication that the single-velocity measurement taken in the center of some of the sections was in a high-velocity area and that much lower velocities would be found in other areas of the section. Since unequal flow distribution in a section was as undesirable as unequal flow distribution between sections, no further tests were made with deflectors on the sides of the original center pier.
Modified pier nose.-The nose of the center pier was replaced with a 3-foot (0.9-ml radius semicircle. Downstream from the spring point of the semicircle the nose sloped back to the original pier in a length of 4.5 feet (1.4 ml. Flow distribution was still not adequate, Table 1. It was also noted that the flow was very unstable at the exit; surges of high-velocity flow were followed by periods o'f almost stagnant conditions.
The 6-foot (1.8-ml width of the s1~micircular pier nose was extended downstream about 21.5 feet (6.6 ml and then tapered back to the original pier at the end of the structure. The wider pier slightly improved the lateral distribution but there was still not adequate flow in the outside bays, Table 1. Extending the 6-foot (1.8-ml width to the end of the structure did not change the flow distribution.
Diverging the pier to a 10-foot (3.0-m) width 24 feet (7.3 ml downstream from the 3 .. foot (0.9-ml radius semicircular nose then tapering back to the 6-foot (1.8-ml width also failed to improve the flow distribution
All efforts to improve the lateral distribution with additions and modifications to the center pier met with limited success. Initial tests with the sloped floor had shown that the best lateral distribution was obtained with an intermediate pier in each bay. The next series of tests was made to determine ain intermediate pier
6
placement that, combined with the sloped floor, would provide adequate flow distribution at the end of the structure.
Intermediate Piers
The original center pier and the intermediate piers of the fourth modification were reim.talled, except that the upstream ends of the intermediate piers were set 2.35 feet (0.7 ml away from the center pier and the intermediate pier width was increasud to 14 inches (0.3 ml. Flow distribution with this arra.ngement was good, Table 1, but was still slightly less in the two upper right sections and the outside lower left :;ection. There were also some differences in the flow concentrations between the high and low reservoir.
Many minor modifications in location of the upstream end of the piers and elevation of the high portion of the floor were tried without materially aiding the distribution. Also tried were longer piers, up to the full length of the structure, placed along the centerline of each bay. These resulted in extremely poor distribution and very unsteady flow.
Some concern was expressed about how sensitive the flow distribution was to minor variations in pier placement. It was felt that if the model did not truly represent prototype flow entering the intake structure during the pumping cycle, pier plac:ement determined from the model might be ineffectiv,~ in the prototype.
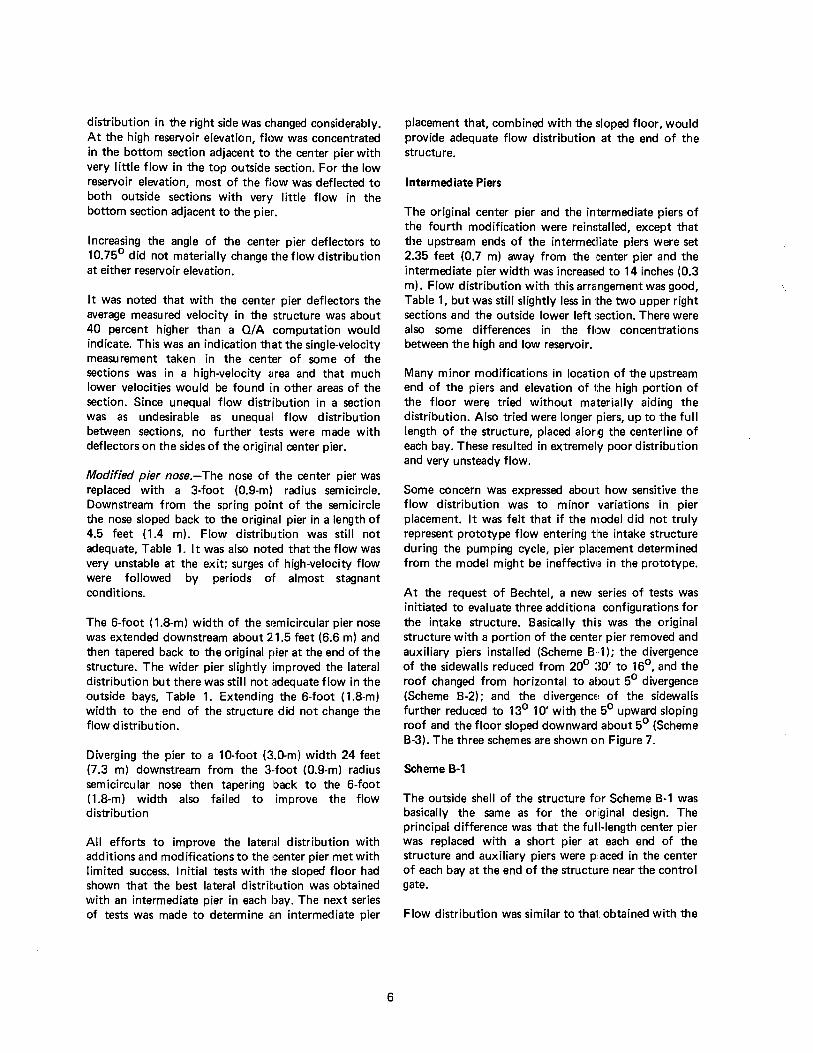
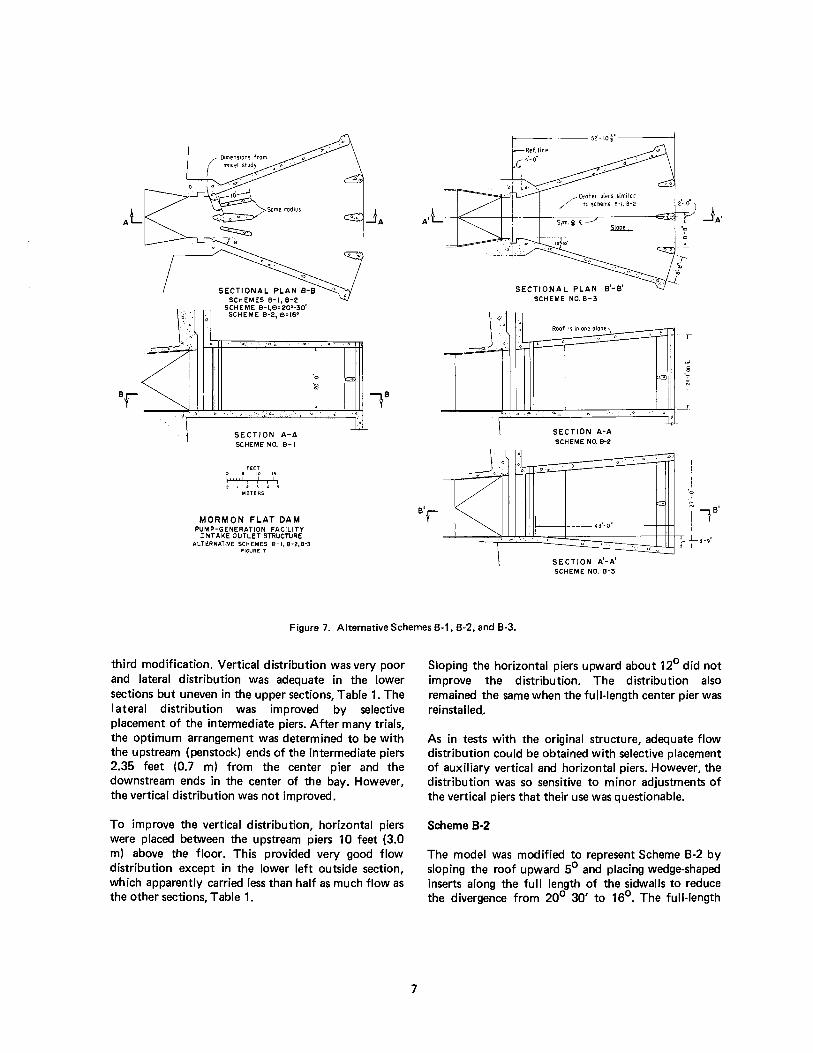
At the request of Bechtel, a new series of tests was initiated to evaluate three additiona, configurations for the intake structure. Basically this was the original structure with a portion of the center pier removed and auxiliary piers installed (Scheme B .. 1 l; the divergence of the sidewalls reduced from 20° :30' to 16°, and the roof changed from horizontal to about 5° divergence (Scheme B-21; and the divergence, of the sidewalls further reduced to 13° 1 0' with the 5° upward sloping roof and the floor sloped downward about 5° (Scheme B-3). The three schemes are shown on Figure 7.
Scheme B-1
The outside shell of the structure for Scheme B-1 was basically the same as for the original design. The principal difference was that the full-length center pier was replaced with a short pier at each end of the structure and auxiliary piers were p:aced in the center of each bay at the end of the structure near the control gate.
Flow distribution was similar to that obtained with the
SECTIONAL PLAN B·B SCHEMES B·l,8·2
SCHEME B-11 0=2O°-3O1
SCHEME B-2, e=l6°
SECTION A-A SCHEME NO. B-1
FEET 5 10 15 I I I
METERS
MORMON FLAT DAM PUMP-GENERATION FACILITY
INTAKE OUTLET STRUCTURE ALTERNATIVE SCHEMES B-1, B-2,8-3
FIGURE 7
.l -~
B' r
SECTIONAL PLAN SCHEME NO. B-3
r
" -~ ·;c
_JA,
~-+1·-'-'J~.l.-.J..,!-1~--...,,.-~~~oc-=-.-c-=-.--~,C---_L-'-'--,--;;-'-'-l-4 l SECTION A·A
_J,Q SCHEME NO. 8·2
L---- 43·-o·--1
SECTION A'·A' SCHEME NO. 8·3
-~ B'
!7 3'-9"
Figure 7. Alternative Schemes B-1, B-2, and B-3.
third modification. Vertical distribution was very poor and lateral distribution was adequate in the lower sections but uneven in the upper sections, Table 1. The lateral distribution was improved by selective placement of the intermediate piers. After many trials, the optimum arrangement was determined to be with the upstream (penstock) ends of the intermediate piers 2.35 feet (0.7 m) from the center pier and the downstream ends in the center of the bay. However, the vertical distribution was not improved.
To improve the vertical distribution, horizontal piers were placed between the upstream piers 10 feet (3.0 m) above the floor. This provided very good flow distribution except in the lower left outside section, which apparently carried less than half as much flow as the other sections, Table 1.
7
Sloping the horizontal piers upward about 12° did not improve the distribution. The distribution also remained the same when the full-length center pier was reinstalled.
As in tests with the original structure, adequate flow distribution could be obtained with selective placement of auxiliary vertical and horizontal piers. However, the distribution was so sensitive to minor adjustments of the vertical piers that their use was questionable.
Scheme 8-2
The model was modified to represent Scheme B-2 by sloping the roof upward 5° and placing wedge-shaped inserts along the full length of the sidwalls to reduce the divergence from 20° 30' to 16°. The full-length
center pier was replaced with short piers at each end, Figure 7. The piers in the center of each bay at the downstream end were not moved, which resulted in narrow outside bays. No auxiliary piers at the upstream (penstock) end were installed for the initial tests.
Lateral flow distribution was poor in the lower bays but good in the upper bays; however, the vertical distribution was very poor except for the left outside bays, Table 1.
To improve the distribution, modifications to the structure were made based on the results of previous tests. Horizontal and vertical auxiliary piers were installed and the optimum placement was determined, after several trials, to provide good flow distribution at the outlet of the structure, Table 1.
Scheme B-3
The intake structure was rebuilt to incorporate the features shown as Scheme 8-3 on Figure 7. The sidewalls diverged 13° 10' on each side and the floor and roof diverged about 5°. A short-center pier was located at each end of the structure and an additional pier was placed in the center of each bay at the reservoir end.
Velocity measurements taken at the center of each bay did not indicate good distribution, Table 1, although the distribution was not as uneven as had been found in earlier versions. Several modifications were made in an attempt to improve the flow distribution. These included reinstalling the full-length center pier and many combinations of vertical and horizontal piers with and without the full .. length center pier. The flow distribution was improved with some of the modifications but usually the improved distribution was accompanied by an increase in the flow instability, such as a large variation in velocity during a measurement or a radical change in flow distribution between high and low reservoir levels. Another condition prevalent with this structure was the extreme sensitivity to minor adjustments in the auxiliary piers. A change in location of the upstream end of a pier equivalent to only 1 or 2 inches (3 to 5 cm) would often change the location of a high-velocity area from the lower inside corner of a bay to the upper outside corner.
After reviewing the flow distribution in the various structures and the effects of various modifications, it was determined that Scheme B-3 provided adequate dispersion with a minimum amount of flow instability and change in flow concentrations between high and
8
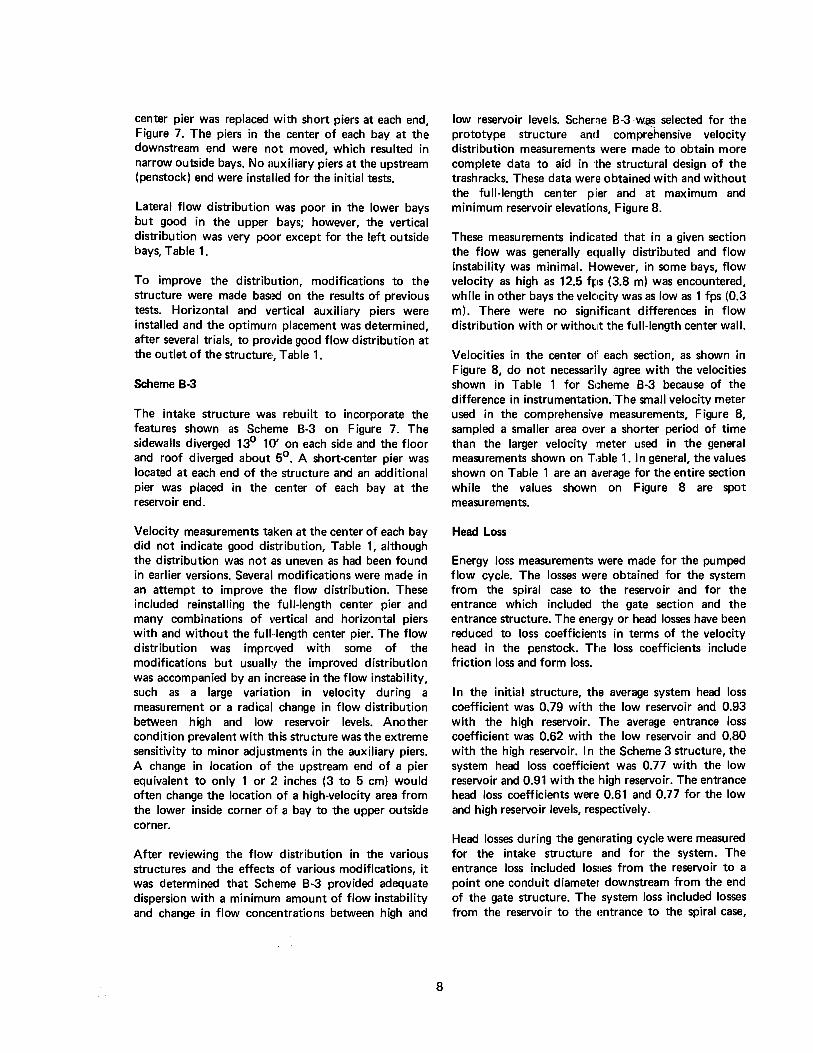
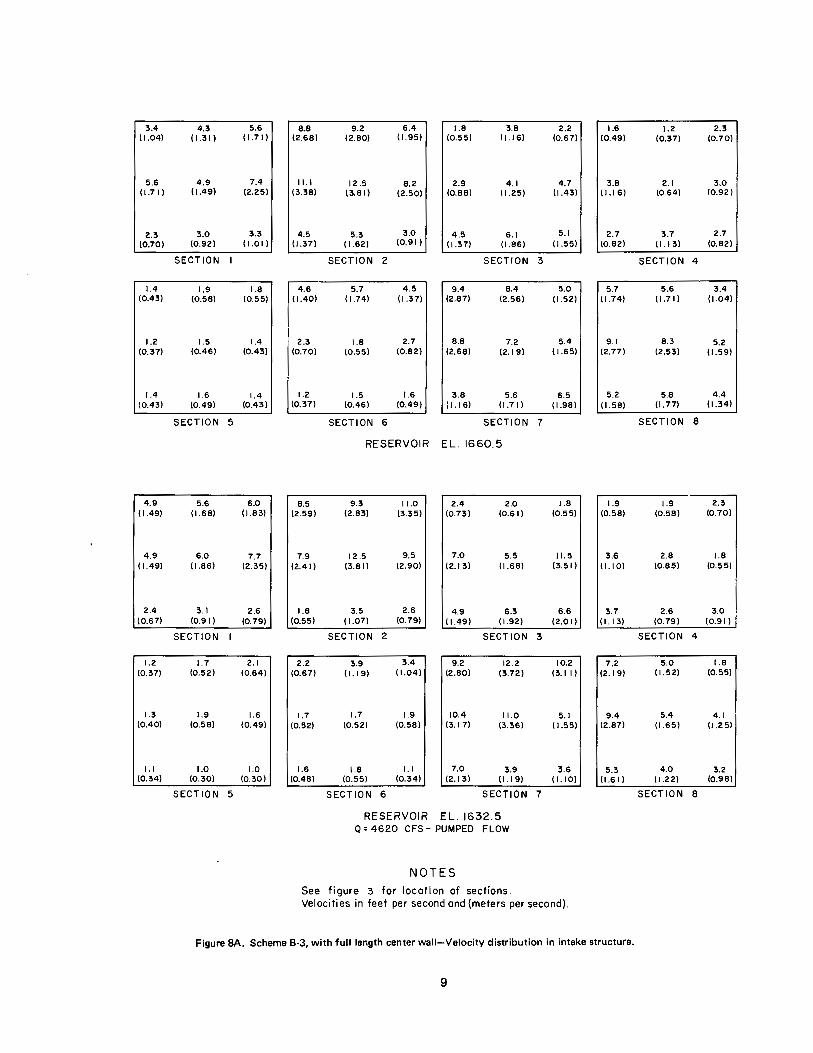
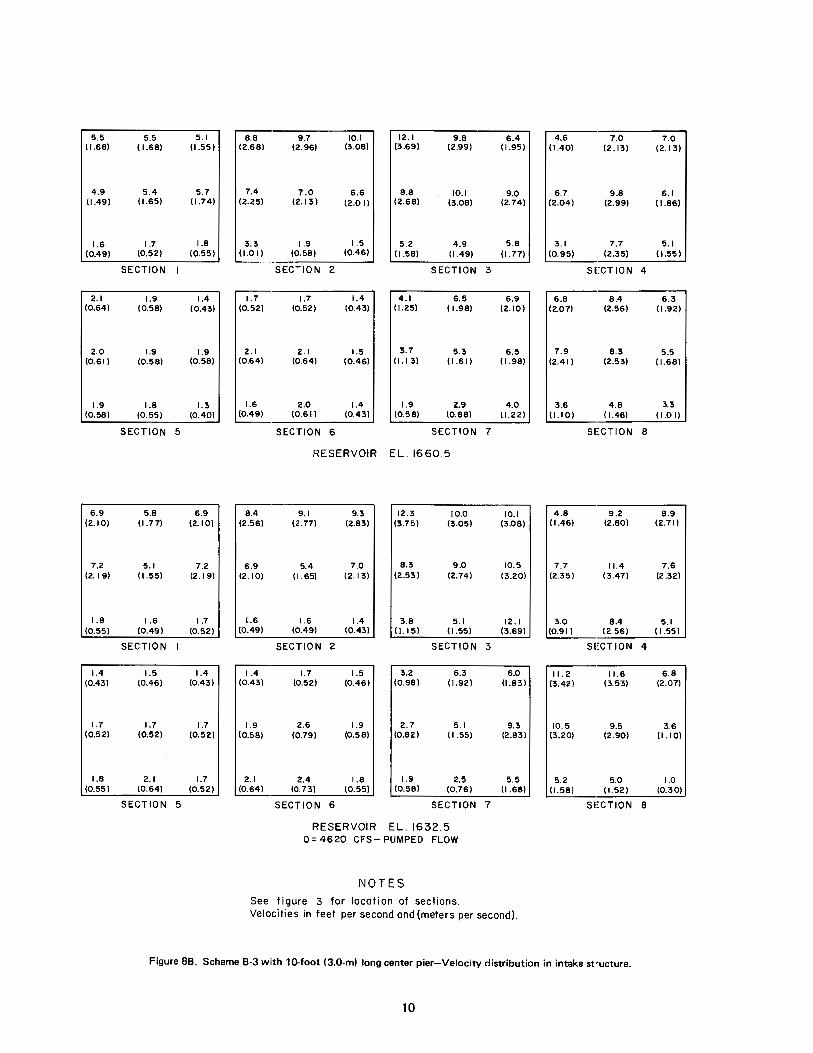
low reservoir levels. Scheme B-3 ·W.Q.S selected for the prototype structure and comprehensive velocity distribution measurements were made to obtain more complete data to aid in the structural design of the trashracks. These data were obtained with and without the full-length center pier and at maximum and minimum reservoir elevations, Figure 8.
These measurements indicated that in a given section the flow was generally equally distributed and flow instability was minimal. However, in some bays, flow velocity as high as 12.5 fps (3.8 m) was encountered, while in other bays the veletcity was as low as 1 fps (0.3 m). There were no significant differences in flow distribution with or without the full-length center wall.
Velocities in the center o1' each section, as shown in Figure 8, do not necessarily agree with the velocities shown in Table 1 for S1:heme B-3 because of the difference in instrumentatic,n.The small velocity meter used in the comprehensive measurements, Figure 8, sampled a smaller area ov,!r a shorter period of time than the larger velocity meter used in the general measurements shown on T;able 1. In general, the values shown on Table 1 are an average for the entire section while the values shown on Figure 8 are spot measurements.
Head Loss
Energy loss measurements were made for the pumped flow cycle. The losses were obtained for the system from the spiral case to the reservoir and for the entrance which included the gate section and the entrance structure. The energy or head losses have been reduced to loss coefficients in terms of the velocity head in the penstock. The loss coefficients include friction loss and form loss.
In the initial structure, the average system head loss coefficient was 0.79 with the low reservoir and 0.93 with the high reservoir. The average entrance loss coefficient was 0.62 with the low reservoir and 0.80 with the high reservoir. In the Scheme 3 structure, the system head loss coefficient was 0.77 with the low reservoir and 0.91 with the high reservoir. The entrance head loss coefficients were 0.61 and 0.77 for the low and high reservoir levels, respectively.
Head losses during the gem1rating cycle were measured for the intake structure and for the system. The entrance loss included losi;es from the reservoir to a point one conduit diameter downstream from the end of the gate structure. The system loss included losses from the reservoir to the 1mtrance to the spiral case,
3.4 4.3 5.6 8.8 9.2 6.4 1.8 3.8 2.2 1.6 1.2 2.3 (1.04) ( 1.31) ( 1.7 I) (2.68) (2.80) (1.95) (0.55) (1.16) (0.67) (0.49) (0.37) (0.70)
5.6 4.9 7.4 II.I 12 .5 8.2 2.9 4.1 4.7 3.8 2.1 3.0 ( 1.7 I) (1.49) (2.25) (3.38) (3.81) (2.50) (0.88) (1.25) (1.43) (1.16) (064) (0.92)
2.3 3.0 3.3 4.5 5.3 3.0 4.5 6.1 5.1 2.7 3.7 2.7 (0.70) (0.92) (1.01) (1.37) (1.62) (0.91 l (1.37) (1.86) (1.55) (0.82) (I.I 3) (0.82)
SECTION SECTION 2 SECTION 3 SECTION 4
1.4 1.9 1.8 4.6 5.7 4.5 9.4 8.4 5,0 5.7 5.6 3.4 (0.43) (0.58) (0.55) (1.40) (1.74) ( 1.3 7) (2.87) (2.56} (1.52} (1.74) (1.71} (1.04}
1.2 1.5 1.4 2.3 1.8 2.7 8.8 7.2 5.4 9.1 8.3 5.2 (0.37) (0.46) (0.43) (0.70) (0.55) (0.82) (2.68) (2.19) ( 1.65) (2.17) (2.53) (1.59)
1.4 1.6 1.4 1.2 1.5 1.6 3.8 5.6 6.5 5.2 5.8 4.4 (0.43) (0.49) (0.43) (0.37) (0.46) (0.49) (1.16) (1.7 I} (1.98) (1.58} (1.17} (1.34)
SECTION 5 SECTION 6 SECTION 7 SECTION 8
RESERVOIR EL. 1660.5
4.9 5.6 6.0 8.5 9.3 11.0 2.4 2.0 1.8 1.9 1.9 2.3 (1.49) (1.68) (1.83) (2.59) (2.83) (3.35) (0.73) (0.61) (0.55) (0.58) (0.58) (0.70)
4.9 6.0 7.7 7.9 12 .5 9.5 7.0 5.5 11.5 3.6 2.8 1.8 (1.49} (1.86) (2.35} (2.41) (3.81) (2.90) (2.13} (1.68) (3.51) (1.10} (0.85) (0.55)
2.4 3.1 2.6 1.8 3.5 2.6 4.9 6.3 6.6 3.7 2.6 3,0 (0.67) (0.91) (0.79) (0.55) (1.07) (0.79) (1.49} (1.92) (2.01} ( 1.13) (0.79) (0.91}
SECTION SECTION 2 SECTION 3 SECTION 4
1.2 1.7 2. I 2.2 3.9 3.4 9.2 12.2 10.2 7.2 5.0 I .8 (0.37) (0.52) (0.64) (0.67) (I.I 9) (1.04) (2.80) (3.72) (3.1 I) (2.19) ( 1.52) (0.55)
1.3 1.9 1.6 1.7 1.7 1.9 10.4 11.0 5.1 9.4 5.4 4.1 (0.40) (0.58) (0.49) (0.52) (0.52) (0.58) (3.17} (3.36} ( 1.55) (2.87) (1.65) (1.25)
I.I 1.0 1.0 1.6 1.8 I.I 7.0 3.9 3.6 5.3 4.0 3.2 (0.34) (0.30) (0.30) (0.48) (0.55) (0.34) (2.13) (I. I 9) (1.10) (1.61) ( 1.22} (0.98)
SECTION 5 SECTION 6 SECTION 7 SECTION 8
RESERVOIR EL. 1632.5 Q= 4620 CFS- PUMPED FLOW
NOTES
See figure 3 tor location of sections. Velocities in feet per second and (meters per second).
Figure BA. Scheme B-3, with full length center wall-Velocity distribution in intake structure.
9
5.5 5.5 5.1 8.8 9.7 IQ.I 12.1 9.8 6.4 4.6 7.0 7.0 (1.68) ( 1.68) (1.55) (2.68) (2.96) (3.08) (3.69) (2.99) ( 1.95) (1.40) (2.13) (2.13)
4.9 5.4 5.7 7.4 7.0 6.6 8.8 10.I 9.0 6.7 9.8 6.1 (1.49) (1.65) (1.74) (2.25) (2.13) (2.0 I) (2.68) (3.08) (2.74) (2.04) (2.99) (1.86)
1.6 1.7 1.8 3.3 1.9 1.5 5.2 4.9 5.8 3.1 7.7 5.1 (0.49) (0.52) (0.55) (1.01) (0.58) (0.46) (1.58) (1.49) (I. 77) (0.95) (2.35) ( 1.55 l
SECTION SECTION 2 SECTION 3 SECTION 4
2.1 1.9 1.4 I. 7 1.7 1.4 4.1 6.5 6.9 6.8 8.4 6.3 (0.64) (0.58) (0.43) (0.52) (0.52) (0.43) (1.25) (1.98) (2.10) (2.07) (2.56) (1.92)
2.0 1.9 1.9 2.1 2.1 1.5 3.7 5.3 6.5 7.9 8.3 5.5 (0.61) (0.58) (0.58) (0.64) (0.64) (0.46) (I. I 3) (1.61) (1.98) (2.41) (2.53) (1.68)
1.9 1.8 1.3 1.6 2.0 1.4 1.9 2.9 4.0 3.6 4.8 3.3 (0.58) (0.55) (0.40) (0.49) (0.61) (0.43) (0.58) (0.88) (1.22) (1.10) (1.46) (1.0 I)
SECT ION 5 SECTION 6 SECTION 7 SECTION 8
RESERVOIR EL. 1660.5
6.9 5.8 6.9 8.4 9.1 9.3 12.3 10.0 10.1 4.8 9.2 8.9 (2.10) (1.77) (2.10) (2.56) (2.77) (2.83) (3.75) (3.05) (3.08) (1.46) (2.80) (2.71)
7.2 5.1 7.2 6.9 5.4 7.0 8.3 9.0 10.5 7.7 I 1.4 7.6 (2.19) ( 1.55) (2.19) (2.10) (1.65) (2.13) (2.53) (2.74) (3.20) (2.35) (3.47) (2.32)
1.8 1.6 1.7 1.6 1.6 1.4 3.8 5.1 12.1 3.0 8.4 5.1 (0.55) (0.49) (0.52) (0.49) (0.49) (0.43) ( I. 15) (1.55) (3.69) (0.91) (2.56) ( 1.55)
SECTION SECTION 2 SECTION 3 SECTION 4
1.4 1.5 1.4 1.4 1.7 I. 5 3.2 6.3 6.0 11.2 11.6 6.8 (0.43) (0.46) (0.43) (0.43) (0.52) (0.46) (0.98) (1.92) U.831 (3.42) (3.53) (2.07)
I. 7 1.7 1.7 1.9 2.6 1.9 2.7 5. I 9.3 10.5 9.5 3.6 (0.52) (0.52) (0.52) (0.58) (0.79) (0.58) (0.82) (1.55) (2.83) (3.20) (2.90) (1.10)
1.8 2.1 1.7 2.1 2.4 1.8 1.9 2.5 5.5 5.2 5.0 1.0 (0.55) (0.64) (0.52) (0.64) (0.73) (0.55) (0.58) (0.76) (1.68) (1.58) (1.52) (0.30)
SECTION 5 SECTION 6 SECTION 7 SECTION 8
RESERVOIR EL. 1632.5 Q=4620 CFS- PUMPED FLOW
NOTES
See figure 3 for location of sections. Velocities in feet per second and (meters per second).
Figure 8B. Scheme B-3 with 10-foot (3.0-m) long center pier-Velocity distribution in intake st"ucture.
10
appxoximately 9.5 feet (2.9 m) downstream from the end of the lower bend. In both cases the losses included friction loss and form loss.
The loss coefficients, in terms of the velocity head in the 18-foot (5.5 m) conduit were 0.19 for the entrance structure and 0.32 for the system.
Generating Cycle
Studies of flow characteristics during the generating cycle were made with the Scheme B-3 structure. Conditions investigated included flow distribution in the penstock, head losses through the entrance and through the system, and vortex characteristics in the reservoir over the entrance.
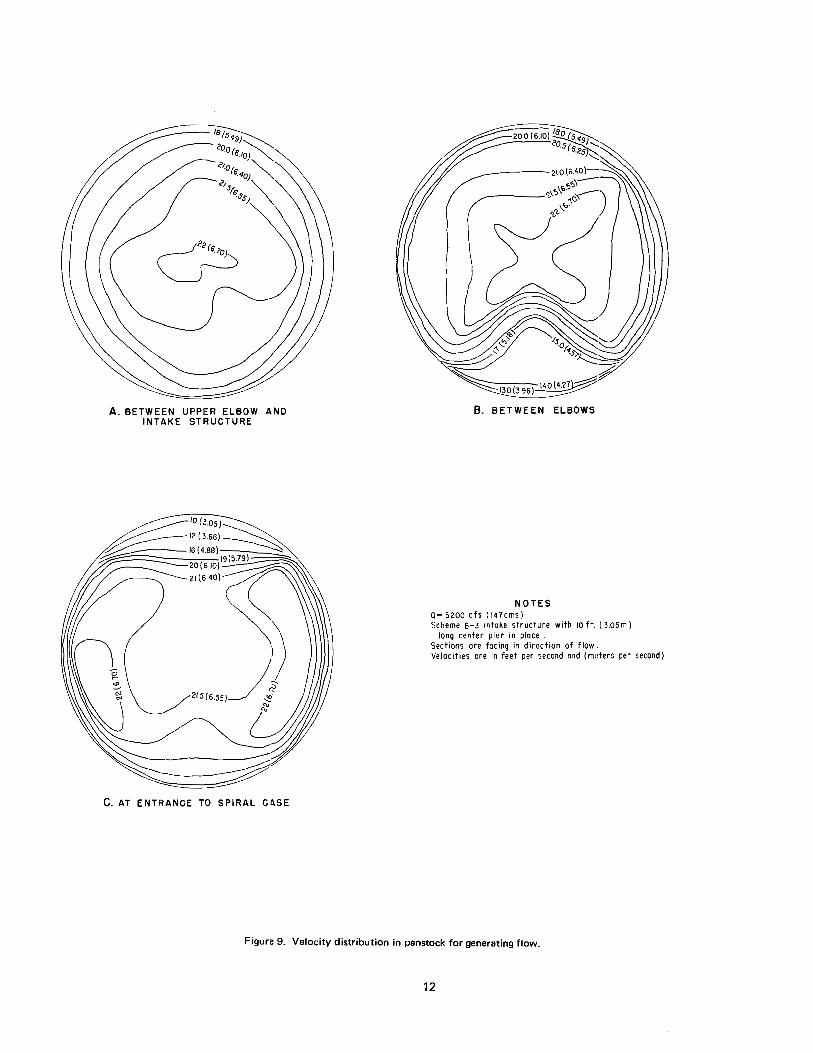
Flow distribution.-Flow distribution in the conduit between the entrance and the first bend was very symmetrical, indicating smooth convergence from the reservoir to the conduit, Figure 9A. A second velocity distribution in the straight section midway between the two elbows showed the effect of the flow passing around the upper elbow. Although the velocity distribution on either side of the vertical centerline was symmetrical, the velocity near the crown increased while the velocity near the invert was lower, Figure 98. Velocity distribution at the approximate location of the entrance to the spiral case showed a redistribution of flow near the invert and crown caused by the lower elbow. At this location the velocity near the crown was
11
lower than average and near the invert was higher than average, Figure 9C. Flow distribution was symmetrical on either side of the vertical centerline.
Vortex characteristics.-Observations were made to determine if vortices would form over the entrance. The tests were made using the scaled penstock velocity of 4.73 fps ( 1.4 mps) and minimum reservoir elevation, representing 20.5 fps (6.2 mps) and elevation 1632.5 in the prototype. With these model conditions there was no detectable vortex action.
In some model investigations, where a very small model is used to represent a prototype structure, an "equal velocity" test procedure is used to determine if air-entraining vortices might occur in the prototype. This procedure requires that the velocity in the model conduit be the same as the velocity in the prototype. For the Mormon Flat model, the discharge would have to be increased to about 14.8 cfs (0.4 cum/sec) instead of the 3.4 cfs (0.1 cu m/sec) used in the rest of the study. It was not possible to increase the discharge this much in the existing model facility. However, tests were made in which the model velocity was 12.5 fps (3.8 mps), corresponding to about 54 fps (16.5 mps) in the prototype. There was considerable turbulence over the entrance with this test but no air-entraining vortices formed. It should be mentioned that the water depth over the entrance with this test was about double the depth used in the regular tests.
A. BETWEEN UPPER ELBOW AND INTAKE STRUCTURE
C. AT ENTRANCE TO SPIRAL C.tlSE
8. BETWEEN ELBOWS
NOTES 0= 5200 cfs ( 147cms) Scheme B-3 intake structure with 10 ft. ( 3.05 m)
long center pier in place . Sections are facing in direction of flow. Velocities ore in feet per second and (mders per second)
Figure 9. Velocity distribution in penstock for generating flow.
12
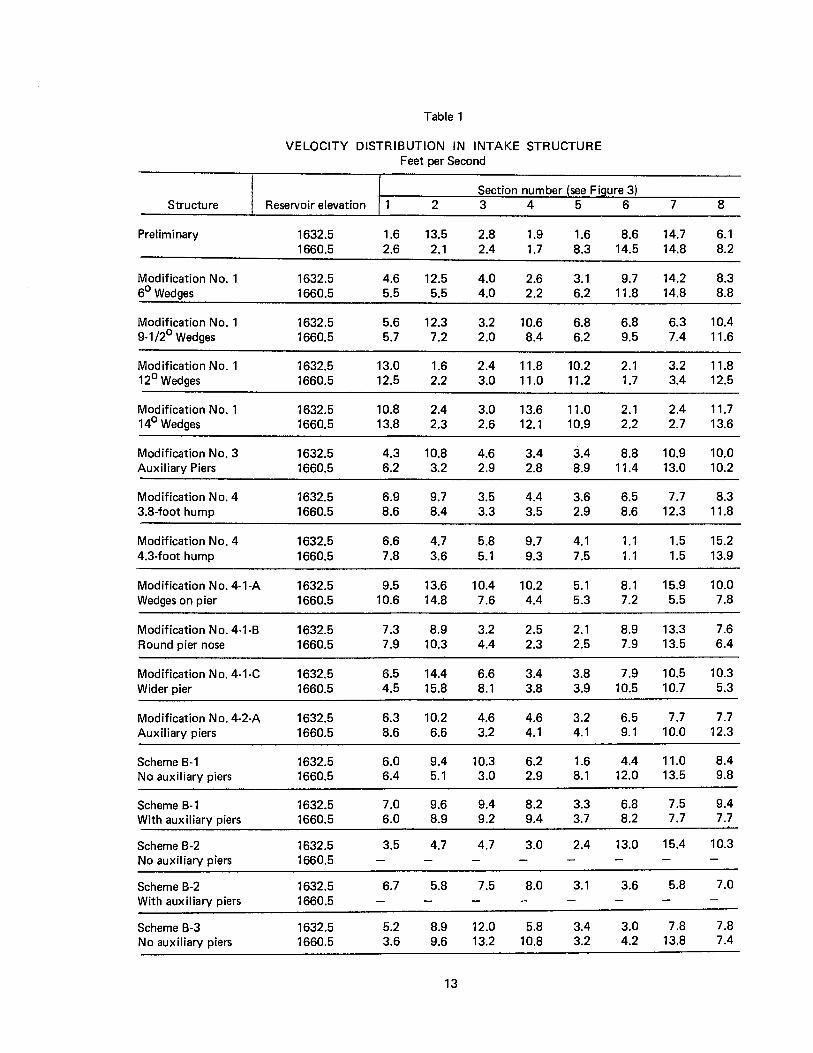
Table 1
VELOCITY DISTRIBUTION IN INTAKE STRUCTURE Feet per Second
Section number (see Fiaure 3) Structure Reservoir elevation 2 3 4 5 6 7 8
Preliminary 1632.5 1.6 13.5 2.8 1.9 1.6 8.6 14.7 6.1 1660.5 2.6 2.1 2.4 1.7 8.3 14.5 14.8 8.2
Modification No. 1 1632.5 4.6 12.5 4.0 2.6 3.1 9.7 14.2 8.3 6°Wedges 1660.5 5.5 5.5 4.0 2.2 6.2 11.8 14.8 8.8
Modification No. 1 1632.5 5.6 12.3 3.2 10.6 6.8 6.8 6.3 10.4 9-1 /2° Wedges 1660.5 5.7 7.2 2.0 8.4 6.2 9.5 7.4 11.6
Modification No. 1 1632.5 13.0 1.6 2.4 11.8 10.2 2.1 3.2 11.8 12°Wedges 1660.5 12.5 2.2 3.0 11.0 11.2 1.7 3.4 12.5
Modification No. 1 1632.5 10.8 2.4 3.0 13.6 11.0 2.1 2.4 11.7 14° Wedges 1660.5 13.8 2.3 2.6 12.1 10.9 2.2 2.7 13.6
Modification No. 3 1632.5 4.3 10.8 4.6 3.4 3.4 8.8 10.9 10.0 Auxiliary Piers 1660.5 6.2 3.2 2.9 2.8 8.9 11.4 13.0 10.2
Modification No. 4 1632.5 6.9 9.7 3.5 4.4 3.6 6.5 7.7 8.3 3.8-foot hump 1660.5 8.6 8.4 3.3 3.5 2.9 8.6 12.3 11.8
Modification No. 4 1632.5 6.6 4.7 5.8 9.7 4.1 1.1 1.5 15.2 4.3-foot hump 1660.5 7.8 3.6 5.1 9.3 7.5 1.1 1.5 13.9
Modification No. 4-1-A 1632.5 9.5 13.6 10.4 10.2 5.1 8.1 15.9 10.0 Wedges on pier 1660.5 10.6 14.8 7.6 4.4 5.3 7.2 5.5 7.8
Modification No. 4-1-B 1632.5 7.3 8.9 3.2 2.5 2.1 8.9 13.3 7.6 Round pier nose 1660.5 7.9 10.3 4.4 2.3 2.5 7.9 13.5 6.4
Modification No. 4-1-C 1632.5 6.5 14.4 6.6 3.4 3.8 7.9 10.5 10.3 Wider pier 1660.5 4.5 15.8 8.1 3.8 3.9 10.5 10.7 5.3
Modification No. 4-2-A 1632.5 6.3 10.2 4.6 4.6 3.2 6.5 7.7 7.7 Auxiliary piers 1660.5 8.6 6.6 3.2 4.1 4.1 9.1 10.0 12.3
Scheme B-1 1632.5 6.0 9.4 10.3 6.2 1.6 4.4 11.0 8.4 No auxiliary piers 1660.5 6.4 5.1 3.0 2.9 8.1 12.0 13.5 9.8
Scheme B-1 1632.5 7.0 9.6 9.4 8.2 3.3 6.8 7.5 9.4 With auxiliary piers 1660.5 6.0 8.9 9.2 9.4 3.7 8.2 7.7 7.7
Scheme B-2 1632.5 3.5 4.7 4.7 3.0 2.4 13.0 15.4 10.3 No auxiliary piers 1660.5
Scheme B-2 1632.5 6.7 5.8 7.5 8.0 3.1 3.6 5.8 7.0 With auxiliary piers 1660.5
Scheme B-3 1632.5 5.2 8.9 12.0 5.8 3.4 3.0 7.8 7.8 No auxiliary piers 1660.5 3.6 9.6 13.2 10.8 3.2 4.2 13.8 7.4
13
7-1750(3•71) Bureau of Reclamation
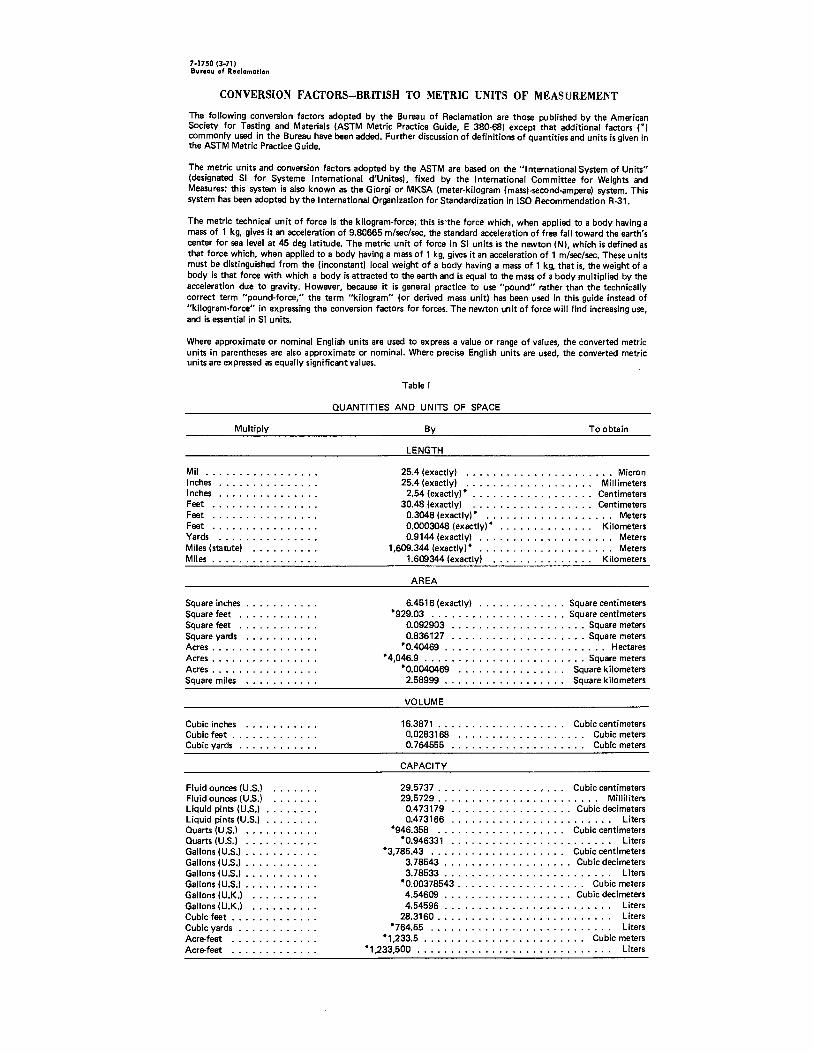
CONVERSION FACTORS-BRITISH TO METRIC UNITS OF MEASUREMENT
The following conversion factors adopted by the Bureau of Reclamation are those published by the American Society for Testing and Materials (ASTM Metric Practice Guide, E 380-68) except that additional factors (*) commonly used in the Bureau have been added. Further discussion of definitions of quantities and units is given in the ASTM Metric Practice Guide.
The metric units and conversion factors adopted by the ASTM are based on the "International System of Units" (designated SI for Systeme International d'Unites), fixed by the International Committee for Weights and Measures; this system is also known as the Giorgi or MKSA (meter-kilogram (mass)-second-ampere) system. This system has been adopted by the International Organization for Standardization in ISO Recommendation R-31.
The metric technical unit of force is the kilogram-force; this is'the force which, when applied to a body having a mass of 1 kg, gives it an acceleration of 9.80665 m/sec/sec, the standard acceleration of free fall toward the earth's center for sea level at 45 deg latitude. The metric unit of force in SI units is the newton (N), which is defined as that force which, when applied to a body having a mass of 1 kg, gives it an acceleration of 1 m/sec/sec. These units must be distinguished from the (inconstant) local weight of a body having a mass of 1 kg, that is, the weight of a body is that force with which a body is attracted to the earth and is equal to the mass of a body multiplied by the acceleration due to gravity. However, because it is general practice to use "pound" rather than the technically correct term "pound-force," the term "kilogram" (or derived mass unit) has been used in this guide instead of "kilogram-force" in expressing the conversion factors for forces. The newton unit of force will find increasing use, and is essential in SI units.
Where approximate or nominal English units are used to express a value or range of values, the converted metric units in parentheses are also approximate or nominal. Where precise English units are used, the converted metric units are expressed as equally significant values.
Multiply
Mil .......•......... Inches .............. . Inches .••............ Feet ............... . Feet ............... . Feet ............... . Yards ...........•... Miles (statute) . • . . . . . . . . Miles ............... .
Square inches . . . . . . . . . . . Square feet ........... . Square feet . . . . . . . . . . . . Square yards . . . . . . . . . . . Acres ............... . Acres ............... . Acres ............... . Square miles . . . . . . . . . . .
Cubic inches . . . . . . . . . . . Cubic feet ............ . Cubic yards . . . . . . . . . . . .
Fluid ounces (U.S.) ...... . Fluid ounces (U.S.) ...... . Liquid pints (U.S.) •....... Liquid pints (U.S.) ....... . Quarts (U.S.) .......•... Quarts (U.S.) ...... . Gallons (U.S.) •.......... Gallons (U.S.) ••......... Gallons (U.S.) •.......... Gallons (U.S.) ..•.•..•... Gallons (U.K.) ......... . Gallons (U.K.) ......... . Cubic feet ............ . Cubic yards . . . . . . . . . . . . Acre-feet ...•..•..•... Acre-feet ............ .
Table I
QUANTITIES AND UNITS OF SPACE
By To obtain
LENGTH
25.4 (exactly) . . . . . . . . . . . . . . . . . . . . . . Micron 25.4 (exactly) . . . • . . . . . . . . . . . . . . . Millimeters
2.54 (exactly)* . . . . . . . . . . . . . . . . . . Centimeters 30.48 (exactly) . . . . . . . . . . . . . . . . . . Centimeters
0.3048 (exactly)* . . . . . . . . . . . . . . . . . . . Meters 0.0003048 (exactly)* . . . . . . . . . . . . . . Kilometers 0.9144 (exactly) . . . . . . . . . . . . . . . . . . . . Meters
1,609.344 (exactly)* .............•...... Meters 1.609344 (exactly) . . . . . . . . . . . . . . . Kilometers
AREA
6.4516 (exactly) . . . . . . . . . • . . . Square centimeters "929.03 ...•..•............. Square centimeters
0.092903 . . . . . . . . . . . . . . . . . . . . Square meters 0.836127 . . . . . . . . . • . . . . . . . . . . Square meters
*0.40469 . . . . . . . . . . . . . . . . . . . . . . . . Hectares • 4,046.9 . . . . . . . . . . . . . . . . . . . . . . . . Square meters
*0.0040469 . . . . . . . . . . . . . . . . Square kilometers 2.58999 . . . . . . . . . . . . . . . . . . Square kilometers
VOLUME
16.3871 . . . . . . . . . . . . . . . . . . . Cubic centimeters 0.0283168 . . . . . . . . . . . . . . . . . . . Cubic meters 0. 764555 . . . . . . . . . . . . . . . . . . . . Cubic meters
CAPACITY
29.5737 ............... , . . . Cubic centimeters 29.5729 . . . . . . . . . . . . . . . . . . . . . . . . Milliliters
0.473179 .................. Cubic decimeters 0.4 73166 . . . . . . . . . . . . . . . . . . . . . . . . Liters
*946.358 . . . . . . . . . . . . . . . . . . . Cubic centimeters • 0.946331 . . . . . . . . . . . . . . . . . . . . . . . . Liters
*3,785.43 . . . . . . . . . . . . . . . . . . . . Cubic centimeters 3. 78543 . . . . . . . . . . . . . . . . . . . Cubic decimeters 3. 78533 . . . . . . . . . . . . . . . . . . . . . . . . . Liters
*0.00378543 . . . . . . . . . . . . . . . . . . . Cubic meters 4.54609 . . . . . . . . . . . . . . . . . . . Cubic decimeters 4.54596 . . . . . . . . . . . . . . . . . . . . . . . . . Liters
28.3160 . • . . . . . . . . . . . . . . . . . . . . . . . . Liters *764.55 . . . . . . . . . . . . . . . . . . . . . . . . . . . Liters
• 1,233.5 . . . . . . . . . . . . . . . . . . . . . . . • Cubic meters • 1,233,500 . . . . . . . . . . . . . . . . . . . . . . . . . . . . . Liters
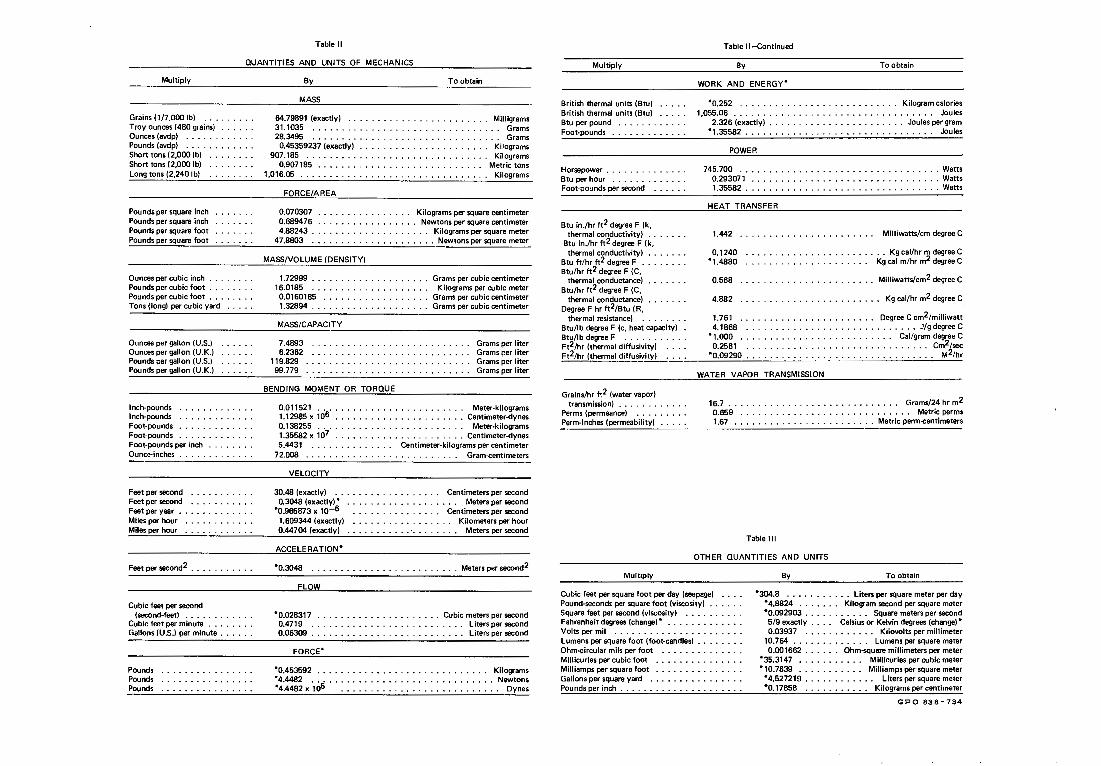
Table II
QUANTITIES AND UNITS OF MECHANICS
Multiply
Grains (1/7,000 lb) .... Troy ounces (480 grains) ....•. Ounces (avdp) ...... . Pounds (avdp) ........... . Short tons (2,000 lb) .......• Short tons (2,000 lb) ....... . Long tons (2,240 lb) ....... .
Pounds per square inch Pounds per square inch Pounds per square foot Pounds per square foot
Ounces per cubic inch ....... . Pounds per cubic foot ....... . Pounds per cubic foot ...... . Tons (long} per cubic yard .... .
Ounces per gallon (U.S.) Ounces per gallon (U.K.) Pounds per gallon (U.S.) Pounds per gallon (U.K.)
Inch-pounds . • . . . . . . . . . . . Inch-pounds ..•..•....... Foot-pounds .. , ......... . Foot-pounds .......•••... Foot-pounds per inch ...... . Ounce-inches . . . . . . . . . . . .
Feet per second . . • • . . . . . Feet per second ..•.•.... Feet per year ...••.•.... Miles per hour ........... . Miles per hour ........... .
Feet per second 2 ........•.•
Cubic feet per second (second-feet) ........... .
Cubic feet per minute ....... . Gallons (U.S.) per minute ..... .
Pounds Pounds Pounds
By To obtain
MASS
64.79891 (exactly) ..........•............. Milligrams 31.1035 ................................ Grams 28.3495 . • . . . . . . . . . . . . . . . . . . . . . . . . . . . . . . Grams
0.45359237 (exactly) . . . . . . . . . . . . . . . . • . . . . . Kilograms 907.185 ............................... Kilograms
0.907185 . . . . . . . . . . . . . . • • • . . . . . . Metric tons 1,016.05 ....................•..•........ Kilograms
FORCE/AREA
0.070307 0.689476 4.88243
47.8803 .
. . . . . . . . . . . . Kilograms per square centimeter . . . . . . . . . . . . . . . . . Newtons per square centimeter . . . • • . . • • . . . . . . • . . . Kilograms per square meter . . . . . . . . . . . . . . . . Newtons per square meter
MASS/VOLUME (DENSITY)
1.72999 ...•.... 16.0185 ....... . 0.0160185 .•.... 1.32894 ......... .
MASS/CAPACITY
7.4893 ....... . 6.2362 .•......
119.829 ........ . 99.779
BENDING MOMENT OR TORQUE
Grams per cubic centimeter Kilograms per cubic meter
Grams per cubic centimeter Grams per cubic centimeter
Grams per I iter Grams per liter Grams per liter Grams per liter
0.011521 • . . . . . . . . . . . . . . . • . . . . • . . . Meter-kilograms 1.12985 x 10⁶ ...................... Centimeter-dynes 0.138255 . . . . . . . . . . . . . . . . . . . . . . . . . Meter-kilograms 1.35582 x 10⁷ ••.•.•••.••.•••••.•••. Centimeter-dynes 5.4431 ....... , . . . . . . Centimeter-kilograms per centimeter
72.008 . . . . . . . . . . . . . . . . . . . . . . . . Gram-centimeters
VELOCITY
30.48 (exactly) .......•..•.. 0.3048 (exactly)• ...•.•...•.
*0.965873 X 10⁻⁶ •.......••
, . . . . Centimeters per second . . . . . Meters per second . . Centimeters per second . . . . Kilometers per hour 1.609344 (exactly) •..•...•..
0.44704 (exactly) •.....•..•• · ... . . . Meters per second
ACCELERATION*
•o.3048 ... ...•...... Meters per second2
FLOW
*0.028317 . . . . . . . . . . . . . . . . . . . . . Cubic meters per second 0.4719 . . . . . . . . . . . . . . . . . . . . . . . . . . Liters per second 0.06309 . . . . . . . . . . . . . . . . . . . . . . . . . . Liters per second
FORCE*
*0.453592 .....•...•...•••.. *4.4482 ..•.•••..•.•....•..... *4.4482 X 10⁵ .••........•.....
. Kilograms Newtons
. . . Dynes
Multiply
British thermal units (Btu) ..••• British thermal units (Btu) .... . Btu per pound ........... . Foot-pounds ............ .
Horsepower . . . . . . . . . Btu per hour .....•.. Foot-pounds per second .
Btu in./hr ft2 degree F (k, thermal conductivity) ..•....
Btu in./hr ft2 degree F (k, thermal conductivity) ...... .
Btu ft/hr h 2 degree F ....... . Btu/hr ft2 degree F (C,
thermal conductance) Btu/hr ft2 degree F (C,
thermal conductance) Degree F hr ft2/Btu ( R,
thermal resistance) ....... . Btu/lb degree F (c, heat capacity) . Btu/lb degree F .......... . Ft2 /hr (thermal diffusivity) Ft2/hr (thermal diffusivity)
Grains/hr ft2 (water vapor) transmission} ........... .
Perms (permeance) ........ . Perm-inches (permeability) .... .
Multiply
Table II-Continued
By To obtain
WORK AND ENERGY*
•o.252 .......•......•............ Kilogram calories 1,055.06 . . . • . . • . . . . . . . . . . . . . • . . • . . . . . . . . • . Joules
2.326 (exactly) ....................... Joules per gram *1.35582 .•..•..........•................ Joules
POWER
745. 700 . . . . . . . . . . . . . . . . . . . . . . . .......... Watts 0.293071 .....•..•.•..................••. Watts 1.35582 ..........•....•................. Watts
HEAT TRANSFER
1.442 . . . . . . . . . . . . . • . • . . . . . . . Milliwatts/cm degree C
0.1240 •1.4880
. . . . . . . . . . . . . . . . . . . . . Kg cal/hr m degree C Kg cal m/hr m2 degree C
0.568 . . . . . . . . . . . . • . . . . . . . . . . Milliwatts/cm2 degree C
4.882 . . . . . . . . . . . . . . . . . . . . Kg cal/hr m2 degree C
1.761 .....•............. Degree C cm2/milliwatt 4.1868 •....••..••.................• J/g degree C
• 1.000 .. . . . . • • . . • . . . . . . . . . .. .. . • Cal/gram degree C
.g:~:~!o : : : : : : : : : : : : : : : : : : : : : : : : : : : : : : : _c~~;~ WATER VAPOR TRANSMISSION
16.7 . . . . . . . . . . . . . . . . . . . . . . . . . . . . . Grams/24 hr m2 0.659 . . . . . . . . . . . . . . . . . . . . . • • . . . . . . Metric perms 1.67 .•..••.................. Metric perm-centimeters
Table Ill
OTHER QUANTITIES AND UNITS
By To obtain
Cubic feet per square foot per day (seepage) Pound-seconds per square foot (viscosity) ..
*304.8 . . . . . . . . . . . Liters per square meter per day • 4.8824 . . . . . . . Kilogram second per square meter *0.092903 . . . . . . . . . . • Square meters per second 5/9 exactly . . . . Celsius or Kelvin degrees (change)• 0.03937 . . . . . . . . . . • . Kilovolts per millimeter
10.764 . . . . . . . • . . . . . Lumens per square meter
Square feet per second (viscosity) ..... . Fahrenheit degrees (change)• ............• Volts per mil .....................• Lumens per square foot (foot-candles) ....... . Ohmacircular mils per foot ............. . Millicuries per cubic foot .............. . Milliamps per square foot •.......... Gallons per square yard .•. Pounds per inch ......•. , ....... .
0.001662 ...... Ohm-square millimeters per meter *35.3147 . . . • . . • . . . . Millicuries per cubic meter • 10.7639 . . . • . • • . . • • Milliamps per square meter
*4.527219 . . . . . . • • • • . . Liters per square meter •o.17858 . . . . • • . . . . . Kilograms per centimeter
GPO 838•734
........................................................................................................................................................................
ABSTRACT
Hydraulic model studies were made to determine flow characteristics in the upper intake-outlet structure of the Mormon Flat Dam pump-generation facility in Arizona. Of particular concern were the velocity distribution and turbulence conditions at the trashrack location during the pumping cycle. The studies showed that the flow was not evenly dispersed in the initial structure which had 20.5 deg diverging sidewalls and parallel floor and roof. Auxiliary piers and horizontal and vertical deflectors improved the velocity distribution, but the velocity distribution changed so radically for a small change in pier location that they were not used. Three additional intake-outlet structures with lesser sidewall divergence were studied. Ultimately selected was a structure with 13 deg 10 min diverging sidewalls and 5 deg divergence in the floor and roof. Primarily for structural reasons, the structure included one pier at the penstock end and three piers at the reservoir end. Flow distribution was adequate. Although velocities varied from 1.0 fps to about 12.5 fps in different trashrack sections, the velocity difference in any one section was usually consistent. Head losses in the structure were from 0.6 to 0.77 of a velocity head during the pumping cycle, and about 0.19 of a velocity head during the generation cycle.
ABSTRACT
Hydraulic model studies were made to determine flow characteristics in the upper intake-outlet structure of the Mormon Flat Dam pump-generation facility in Arizona. Of particular concern were the velocity distribution and turbulence conditions at the trashrack location during the pumping cycle. The studies showed that the flow was not evenly dispersed in the initial structure which had 20.5 deg diverging sidewalls and parallel floor and roof. Auxiliary piers and horizontal and vertical deflectors improved the velocity distribution, but the velocity distribution changed so radically for a small change in pier location that they were not used. Three additional intake-outlet structures with lesser sidewall divergence were studied. Ultimately selected was a structure with 13 deg 10 min diverging sidewalls and 5 deg divergence in the floor and roof. Primarily for structural reasons, the structure included one pier at the penstock end and three piers at the reservoir end. Flow distribution was adequate. Although velocities varied from 1.0 fps to about 12.5 fps in different trashrack sections, the velocity difference in any one section was usually consistent. Head losses in the structure were from 0.6 to 0.77 of a velocity head during the pumping cycle, and about 0.19 of a velocity head during the generation cycle .
. . . . . . . . . . . . . . . . . . . . . . . . . . . . . . . . . . . . . . . . . . . . . . . . . . . . . . . . . . . . . . . . . . . . . . . . . . . . . . . . . . . . : ................................................................................... '
ABSTRACT
Hydraulic model studies were made to determine flow characteristics in the upper intake-outlet structure of the Mormon Flat Dam pump-generation facility in Arizona. Of particular concern were the velocity distribution and turbulence conditions at the trashrack location during the pumping cycle. The studies showed that the flow was not evenly dispersed in the initial structure which had 20.5 deg diverging sidewalls and parallel floor and roof. Auxiliary piers and horizontal and vertical deflectors improved the velocity distribution, but the velocity distribution cl:anged so radically for a small change in pier location that they were not used. Three additional intake-outlet structures with lesser sidewall divergence were studied. Ultimately selected was a structure with 13 deg 10 min diverging sidewalls and 5 deg divergence in the floor and roof. Primarily for structural reasons, the structure included one pier at the penstock end and three piers at the reservoir end. Flow distribution was adequate. Although velocities varied from 1.0 fps to about 12.5 fps in different trashrack sections, the velocity difference in any one section was usually consistent. Head losses in the structure were from 0.6 to 0.77 of a velocity head during the pumping cycle, and about 0.19 of a velocity head during the generation cycle.
ABSTRACT
Hydraulic model studies were made to determine flow characteristics in the upper intake-outlet structure of the Mormon Flat Dam pump-generation facility in Arizona. Of particular concern were the velocity distribution and turbulence conditions at the trashrack location during the pumping cycle. The studies showed that the flow was not evenly dispersed in the initial structure which had 20.5 deg diverging sidewalls and parallel floor and roof. Auxiliary piers and horizontal and vertical deflectors improved the velocity distribution, but the velocity distribution changed so radically -for a small change in pier location that they were not used. Three additional intake-outlet structures with lesser sidewall divergence were studied. Ultimately selected was a structure with 13 deg 10 min diverging sidewalls and 5 deg divergence in the floor and roof. Primarily for structural reasons, the structure included one pier at the penstock end and three piers at the reservoir end. Flow distribution was adequate. Although velocities varied from 1.0 fps to about 12.5 fps in different trashrack sections, the velocity difference in any one section was usually consistent. Head losses in the structure were from 0.6 to 0.77 of a velocity head during the pumping cycle, and about 0.19 of a velocity head during the generation cycle.
REC-ERC-71-31 Rhone, T J HYDRAULIC MODEL STUDIES OF THE INTAKE-OUTLET STRUCTURE FOR THE PUMP-GENERATION FACILITY AT MORMON FLAT DAM, SALT RIVER PROJECT,
.ARIZONA. Bur Reclam Rep REC-ERC-71-31, Div Gen Res, Aug 1971. Bureau of Reclamation, Denver, 13 p, 10 fig, 4 tab
DESCRIPTORS-/ eddies/ head losses/ *hydraulic models/ pressure tunnels/ *model tests/ velocity distribution/ surges/ turbulent flow/ hydraulics/ vortices/ pumped storage/ *model studies/ outlet works/ flow deflectors/ intake structures/ pump turbines/ flow distribution/ piers/ fluid mechanics IDENTIFIERS-/ Mormon Flat Dam, Ariz/ *intake-outlet structures
REC-ERC-71-31 Rhone, T J HYDRAULIC MODEL STUDIES OF THE INTAKE-OUTLET STRUCTURE FOR THE PUMP-GENERATION FACILITY AT MORMON FLAT DAM, SALT RIVER PROJECT, ARIZONA. Bur Reclam Rep REC-ERC-71-31, .Div Gen Res, Aug 1971. Bureau of Reclamation, Denver, 13 p, 10 fig, 4 tab
DESCRIPTORS-/ eddies/ head losses/ *hydraulic models/ pressure tunnels/ *model tests/ velocity distribution/ surges/ turbulent flow/ hydraulics/ vortices/ pumped storage/ *model studies/ outlet works/ flow deflectors/ intake structures/ pump turbines/ flow distribution/ piers/ fluid mechanics IDENTI Fl ERS-/ Mormon Flat Dam, Ariz/ *intake-outlet structures
REC-ERC-71-31 Rhone, T J HYDRAULIC MODEL STUDIES OF THE INTAKE-OUTLET STRUCTURE FOR THE PUMP-GENERATION FACILITY AT MORMON FLAT DAM, SALT RIVER PROJECT, ARIZONA. Bur Reclam Rep REC-ERC-71-31, Div Gen Res, Aug 1971. Bureau of Reclamation, Denver, 13 p, 10 fig, 4 tab
DESCRIPTORS-/ eddies/ head losses/ *hydraulic models/ pressure tunnels/ *model tests/ velocity distribution/ surges/ turbulent flow/ hydraulics/ vortices/ pumped storage/ *model studies/ outlet works/ flow deflectors/ intake structures/ pump turbines/ flow distribution/ piers/ fluid mechanics IDENTIFIERS-/ Mormon Flat Dam, Ariz/ *intake-outlet structures