rebgv stats package october 2010
TRANSCRIPT

8/8/2019 REBGV Stats Package October 2010
http://slidepdf.com/reader/full/rebgv-stats-package-october-2010 1/7
News ReleaseFOR IMMEDIATE RELEASE
For more information please contact:Craig Munn, Assistant Manager, CommunicationsReal Estate Board of Greater VancouverPhone: (604) 730-3146 Fax: (604) 730-3102E-mail: [email protected] also available at www.realtylink.org
Home sales remain steady in Greater Vancouver
VANCOUVER, B.C. – November 2, 2010 – Greater Vancouver home sales have remained steady over the past four
months, indicating stability in the residential housing market. With the MLS® sales to active listing inventory ratio
indicating a buyers’ market, properties appropriately priced are selling.
According to the MLSLink® Housing Price Index (HPI), the benchmark price for all residential properties in
Greater Vancouver over the last 12 months has increased 4.6 per cent to $579,349 in October 2010 from $553,702
in October 2009. Since June, however, residential home prices in Greater Vancouver have remained relatively un-
changed, declining 0.2 per cent.
“We’ve seen a lot more consistency and less volatility in recent months when it comes to both number of sales and
pricing, although it’s important to remember that conditions often vary between communities and neighbourhoods,”
Jake Moldowan, Real Estate Board of Greater Vancouver (REBGV) president said.
Looking at transactions, the number of residential property sales in Greater Vancouver totalled 2,337 in October
2010. This represents a 5.3 per cent increase compared to September 2010 and a 36.9 per cent decline from the 3,704sales in October 2009.
More broadly, last month’s residential sales represent a 71.3 per cent increase over the 1,364 residential sales in
October 2008, a 22.8 per cent decline compared to October 2007’s 3,028 sales, and a 14.1 per cent decline compared
to the 2,722 sales in October 2006.
“As we enter the nal two months of the year, buyer demand is in closer alignment with supply than we’ve seen for
most of 2010,” Moldowan said. “Those buying today recognize that they still have a chance to enter the market with
near-record low interest rates, while gradual reductions in inventory have eased downward pressure on prices.”
Total active listings on the Multiple Listing Service® (MLS®) in Greater Vancouver currently sit at 14,075, an 8.6
per cent decline from last month and a 16.4 per cent increase from October 2009. New listings for detached, attached
and apartment properties declined 25.7 per cent to 3,698 in October 2010 compared to October 2009 when 4,977 new
units were listed.
Sales of detached properties in October 2010 reached 976, a decrease of 34.4 per cent from the 1,487 detached salesrecorded in October 2009, and a 98 per cent increase from the 493 units sold in October 2008. The benchmark price
for detached properties increased 6.3 per cent from October 2009 to $796,883.
Sales of apartment properties reached 984 in October 2010, a decline of 38.8 per cent compared to the 1,607 sales in
October 2009, and an increase of 52.1 per cent compared to the 647 sales in October 2008.The benchmark price of an
apartment property increased 2.4 per cent from October 2009 to $390,074.
Attached property sales in October 2010 totalled 377, a decline of 38.2 per cent compared to the 610 sales in Octo-
ber 2009, and a 68.3 per cent increase from the 224 attached properties sold in October 2008. The benchmark price of
an attached unit increased 4 per cent between October 2009 and 2010 to $487,530.
-30-
The real estate industry is a key economic driver in British Columbia. In 2009, 35,669 homes changed hands in the Board'sarea, generating $1.49 billion in spin-off activity. The total dollar volume of residential sales transacted through the MLS®system in Greater Vancouver totalled $21.19 billion in 2009. The Real Estate Board of Greater Vancouver is an associationrepresenting more than 10,000 REALTORS® and their companies. The Board provides a variety of member services, includ-ing the Multiple Listing Service®. For more information on real estate, statistics, and buying or selling a home, contact a localREALTOR® or visit www.rebgv.org.
8/8/2019 REBGV Stats Package October 2010
http://slidepdf.com/reader/full/rebgv-stats-package-october-2010 2/7
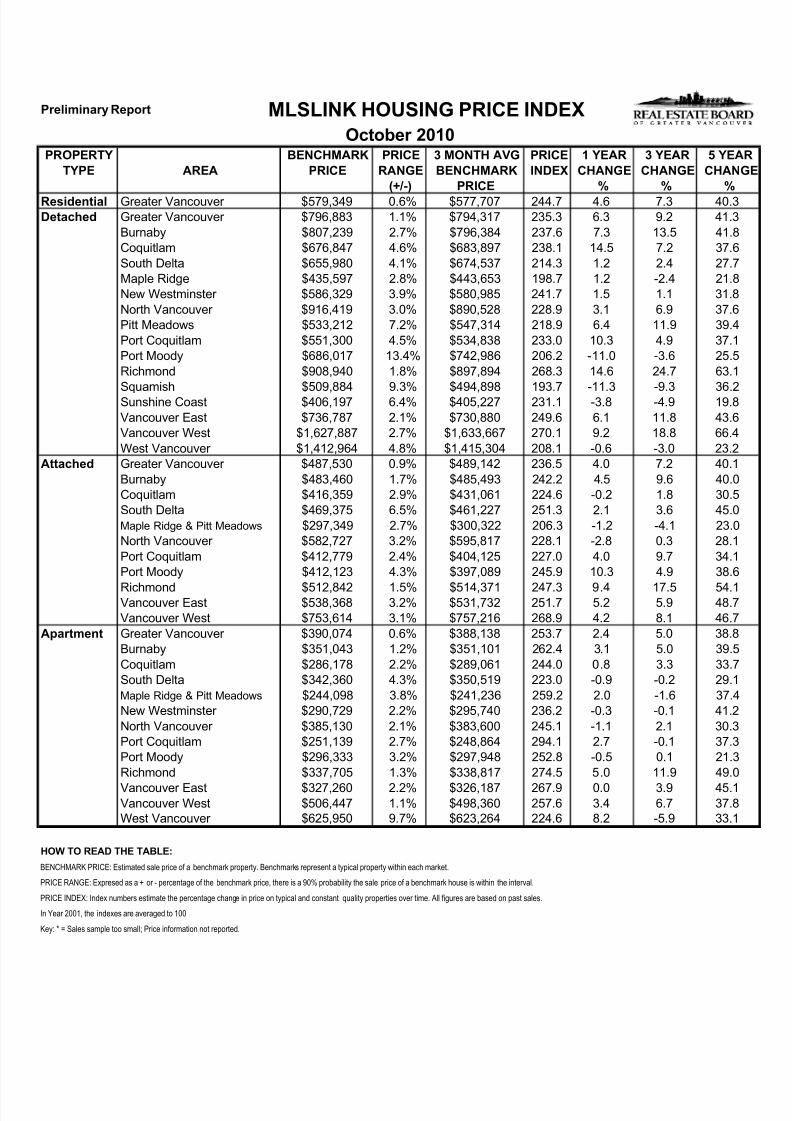
Preliminary Report MLSLINK HOUSING PRICE INDEX
October 2010PROPERTY BENCHMARK PRICE 3 MONTH AVG PRICE 1 YEAR 3 YEAR 5 YEA
TYPE AREA PRICE RANGE BENCHMARK INDEX CHANGE CHANGE CHAN
(+/-) PRICE % % %
Residential Greater Vancouver $579,349 0.6% $577,707 244.7 4.6 7.3 40.3Detached Greater Vancouver $796,883 1.1% $794,317 235.3 6.3 9.2 41.3
Burnaby $807,239 2.7% $796,384 237.6 7.3 13.5 41.8Coquitlam $676,847 4.6% $683,897 238.1 14.5 7.2 37.6
South Delta $655,980 4.1% $674,537 214.3 1.2 2.4 27.7Maple Ridge $435,597 2.8% $443,653 198.7 1.2 -2.4 21.8New Westminster $586,329 3.9% $580,985 241.7 1.5 1.1 31.8
North Vancouver $916,419 3.0% $890,528 228.9 3.1 6.9 37.6Pitt Meadows $533,212 7.2% $547,314 218.9 6.4 11.9 39.4
Port Coquitlam $551,300 4.5% $534,838 233.0 10.3 4.9 37.1Port Moody $686,017 13.4% $742,986 206.2 -11.0 -3.6 25.5
Richmond $908,940 1.8% $897,894 268.3 14.6 24.7 63.1
Squamish $509,884 9.3% $494,898 193.7 -11.3 -9.3 36.2Sunshine Coast $406,197 6.4% $405,227 231.1 -3.8 -4.9 19.8
Vancouver East $736,787 2.1% $730,880 249.6 6.1 11.8 43.6Vancouver West $1,627,887 2.7% $1,633,667 270.1 9.2 18.8 66.4
West Vancouver $1,412,964 4.8% $1,415,304 208.1 -0.6 -3.0 23.2Attached Greater Vancouver $487,530 0.9% $489,142 236.5 4.0 7.2 40.1
Burnaby $483,460 1.7% $485,493 242.2 4.5 9.6 40.0Coquitlam $416,359 2.9% $431,061 224.6 -0.2 1.8 30.5South Delta $469,375 6.5% $461,227 251.3 2.1 3.6 45.0Maple Ridge & Pitt Meadows $297,349 2.7% $300,322 206.3 -1.2 -4.1 23.0North Vancouver $582,727 3.2% $595,817 228.1 -2.8 0.3 28.1
Port Coquitlam $412,779 2.4% $404,125 227.0 4.0 9.7 34.1Port Moody $412,123 4.3% $397,089 245.9 10.3 4.9 38.6
Richmond $512,842 1.5% $514,371 247.3 9.4 17.5 54.1Vancouver East $538,368 3.2% $531,732 251.7 5.2 5.9 48.7Vancouver West $753,614 3.1% $757,216 268.9 4.2 8.1 46.7
Apartment Greater Vancouver $390,074 0.6% $388,138 253.7 2.4 5.0 38.8Burnaby $351,043 1.2% $351,101 262.4 3.1 5.0 39.5
Coquitlam $286,178 2.2% $289,061 244.0 0.8 3.3 33.7South Delta $342,360 4.3% $350,519 223.0 -0.9 -0.2 29.1Maple Ridge & Pitt Meadows $244,098 3.8% $241,236 259.2 2.0 -1.6 37.4New Westminster $290,729 2.2% $295,740 236.2 -0.3 -0.1 41.2
North Vancouver $385,130 2.1% $383,600 245.1 -1.1 2.1 30.3Port Coquitlam $251,139 2.7% $248,864 294.1 2.7 -0.1 37.3Port Moody $296,333 3.2% $297,948 252.8 -0.5 0.1 21.3
Richmond $337,705 1.3% $338,817 274.5 5.0 11.9 49.0
Vancouver East $327,260 2.2% $326,187 267.9 0.0 3.9 45.1Vancouver West $506,447 1.1% $498,360 257.6 3.4 6.7 37.8West Vancouver $625,950 9.7% $623,264 224.6 8.2 -5.9 33.1
HOW TO READ THE TABLE:
BENCHMARK PRICE: Estimated sale price of a benchmark property. Benchmarks represent a typical property within each market.
PRICE RANGE: Expresed as a + or - percentage of the benchmark price, there is a 90% probability the sale price of a benchmark house is within the interval.
PRICE INDEX: Index numbers estimate the percentage change in price on typical and constant quality properties over time. All figures are based on past sales.
In Year 2001, the indexes are averaged to 100
Key: * = Sales sample too small; Price information not reported.

8/8/2019 REBGV Stats Package October 2010
http://slidepdf.com/reader/full/rebgv-stats-package-october-2010 3/7
C : \ D A T A \ M o n t h E n d \ H p i \ e x p o r t \ h i_ r e s \ g v - h p i 2 . t i f
M L S ®
H o u s i n g
P r i c e I n d e x - G r e a t e r V a n c o u v e r
1 0 Y e a r T r e n d
8 0
1 0 0
1 2 0
1 4 0
1 6 0
1 8 0
2 0 0
2 2 0
2 4 0
2 6 0
2 8 0
Oct 2000
Feb 2001
Jun 2001
Oct 2001
Feb 2002
Jun 2002
Oct 2002
Feb 2003
Jun 2003
Oct 2003
Feb 2004
Jun 2004
Oct 2004
Feb 2005
Jun 2005
Oct 2005
Feb 2006
Jun 2006
Oct 2006
Feb 2007
Jun 2007
Oct 2007
Feb 2008
Jun 2008
Oct 2008
Feb 2009
Jun 2009
Oct 2009
Feb 2010
Jun 2010
Oct 2010
P r i c e I n d e x
D e t a c h e
d
A t t a c h e d
A p a r t m e n t
Y e a r 2 0 0 1 a v e r a g e = 1 0 0

8/8/2019 REBGV Stats Package October 2010
http://slidepdf.com/reader/full/rebgv-stats-package-october-2010 4/7
8/8/2019 REBGV Stats Package October 2010
http://slidepdf.com/reader/full/rebgv-stats-package-october-2010 5/7
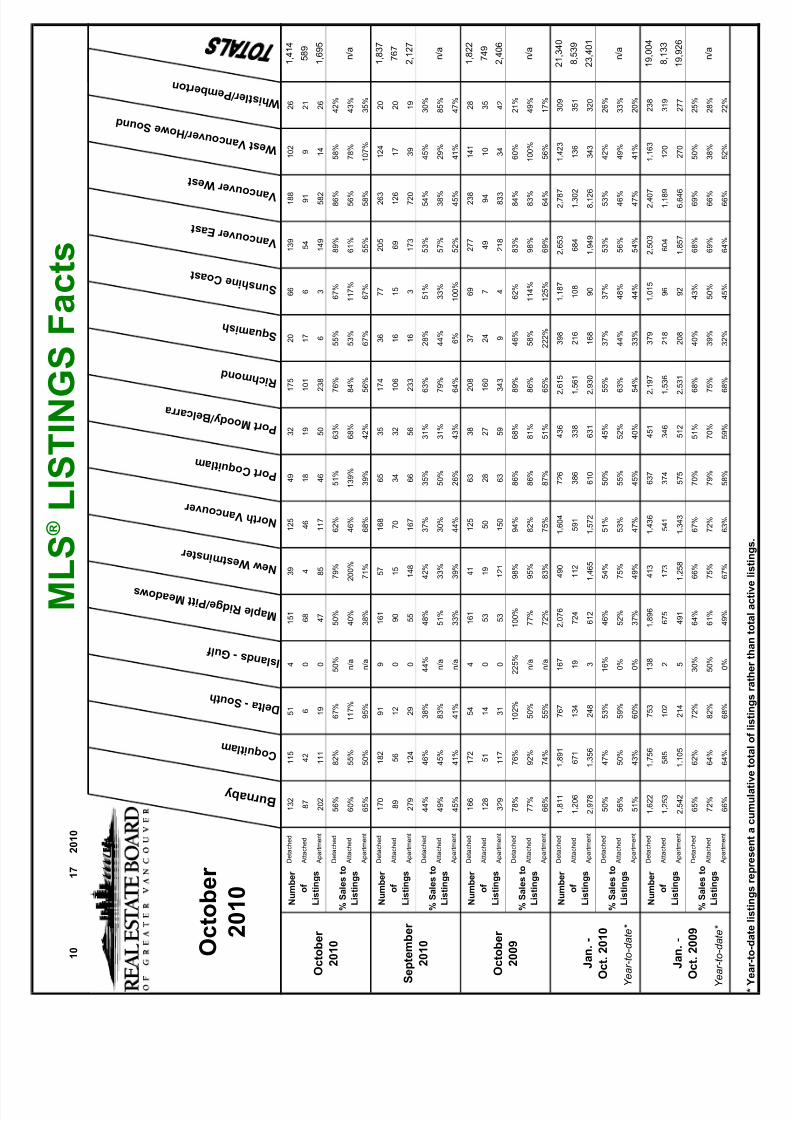
1 0
1 7
2 0 1 0
M
L S ® L I S T I N G
S F a c t s
B u r n a b y
C o q u i t l a m
D e l t a - S o u t h
I s l a n d s - G u l f
M a p l e R i d g e / P i t t M e a d o w s
N e w W e s t m i n s t e r
N o r t h V a n c o u v e r
P o r t C o q u i t l a m
P o r t M o o d y / B e l c a r r a
R i c h m o n d
S q u a m i s h
S u n s h i n e C o a s t
V a n c o u v e r E a s t
V a n c o u v e r W e s t
W e s t V a n c o u v e r / H o w e S o u n d
W h i s t l e r / P e m b e r t o n
D e t a c h e d
1 3 2
1 1 5
5 1
4
1 5 1
3 9
1 2 5
4 9
3 2
1 7 5
2 0
6 6
1 3 9
1 8 8
1 0 2
2 6
1 , 4
1 4
A t t a c h e d
8 7
4 2
6
0
6 8
4
4 6
1 8
1 9
1 0 1
1 7
6
5 4
9 1
9
2 1
5 8 9
A p a r t m e n t
2 0 2
1 1 1
1 9
0
4 7
8 5
1 1 7
4 6
5 0
2 3 8
6
3
1 4 9
5 8 2
1 4
2 6
1 , 6
9 5
D e t a c h e d
5 6 %
8 2 %
6 7 %
5 0 %
5 0 %
7 9 %
6 2 %
5 1 %
6 3 %
7 6 %
5 5 %
6 7 %
8 9 %
8 6 %
5 8 %
4 2 %
A t t a c h e d
6 0 %
5 5 %
1 1 7 %
n / a
4 0 %
2 0 0 %
4 6 %
1 3 9 %
6 8 %
8 4 %
5 3 %
1 1 7 %
6 1 %
5 6 %
7 8 %
4 3 %
n / a
A p a r t m e n t
6 5 %
5 0 %
9 5 %
n / a
3 8 %
7 1 %
6 8 %
3 9 %
4 2 %
5 6 %
6 7 %
6 7 %
5 5 %
5 8 %
1 0 7 %
3 5 %
D e t a c h e d
1 7 0
1 8 2
9 1
9
1 6 1
5 7
1 6 8
6 5
3 5
1 7 4
3 6
7 7
2 0 5
2 6 3
1 2 4
2 0
1 , 8
3 7
A t t a c h e d
8 9
5 6
1 2
0
9 0
1 5
7 0
3 4
3 2
1 0 6
1 6
1 5
6 9
1 2 6
1 7
2 0
7 6 7
A p a r t m e n t
2 7 9
1 2 4
2 9
0
5 5
1 4 8
1 6 7
6 6
5 6
2 3 3
1 6
3
1 7 3
7 2 0
3 9
1 9
2 , 1
2 7
D e t a c h e d
4 4 %
4 6 %
3 8 %
4 4 %
4 8 %
4 2 %
3 7 %
3 5 %
3 1 %
6 3 %
2 8 %
5 1 %
5 3 %
5 4 %
4 5 %
3 0 %
A t t a c h e d
4 9 %
4 5 %
8 3 %
n / a
5 1 %
3 3 %
3 0 %
5 0 %
3 1 %
7 9 %
4 4 %
3 3 %
5 7 %
3 8 %
2 9 %
8 5 %
n / a
A p a r t m e n t
4 5 %
4 1 %
4 1 %
n / a
3 3 %
3 9 %
4 4 %
2 6 %
4 3 %
6 4 %
6 %
1 0 0 %
5 2 %
4 5 %
4 1 %
4 7 %
D e t a c h e d
1 6 6
1 7 2
5 4
4
1 6 1
4 1
1 2 5
6 3
3 8
2 0 8
3 7
6 9
2 7 7
2 3 8
1 4 1
2 8
1 , 8
2 2
A t t a c h e d
1 2 8
5 1
1 4
0
5 3
1 9
5 0
2 8
2 7
1 6 0
2 4
7
4 9
9 4
1 0
3 5
7 4 9
A p a r t m e n t
3 2 9
1 1 7
3 1
0
5 3
1 2 1
1 5 0
6 3
5 9
3 4 3
9
4
2 1 8
8 3 3
3 4
4 2
2 , 4
0 6
D e t a c h e d
7 8 %
7 6 %
1 0 2 %
2 2 5 %
1 0 0 %
9 8 %
9 4 %
8 6 %
6 8 %
8 9 %
4 6 %
6 2 %
8 3 %
8 4 %
6 0 %
2 1 %
A t t a c h e d
7 7 %
9 2 %
5 0 %
n / a
7 7 %
9 5 %
8 2 %
8 6 %
8 1 %
8 6 %
5 8 %
1 1 4 %
9 8 %
8 3 %
1 0 0 %
4 9 %
n / a
A p a r t m e n t
6 6 %
7 4 %
5 5 %
n / a
7 2 %
8 3 %
7 5 %
8 7 %
5 1 %
6 5 %
2 2 2 %
1 2 5 %
6 9 %
6 4 %
5 6 %
1 7 %
D e t a c h e d
1 , 8
1 1
1 , 8
9 1
7 6 7
1 6 7
2 , 0
7 6
4 9 0
1 , 6
0 4
7 2 6
4 3 6
2
, 6 1 5
3 9 8
1 , 1
8 7
2 , 6
5 3
2 , 7 8
7
1 , 4
2 3
3 0 9
2 1 , 3
4 0
A t t a c h e d
1 , 2
0 6
6 7 1
1 3 4
1 9
7 2 4
1 1 2
5 9 1
3 8 6
3 3 8
1
, 5 6 1
2 1 6
1 0 8
6 8 4
1 , 3 0
2
1 3 6
3 5 1
8 , 5
3 9
A p a r t m e n t
2 , 9
7 8
1 , 3
5 6
2 4 8
3
6 1 2
1 , 4
6 5
1 , 5
7 2
6 1 0
6 3 1
2
, 9 3 0
1 6 8
9 0
1 , 9
4 9
8 , 1 2
6
3 4 3
3 2 0
2 3 , 4
0 1
D e t a c h e d
5 0 %
4 7 %
5 3 %
1 6 %
4 6 %
5 4 %
5 1 %
5 0 %
4 5 %
5 5 %
3 7 %
3 7 %
5 3 %
5 3 %
4 2 %
2 6 %
A t t a c h e d
5 6 %
5 0 %
5 9 %
0 %
5 2 %
7 5 %
5 3 %
5 5 %
5 2 %
6 3 %
4 4 %
4 8 %
5 6 %
4 6 %
4 9 %
3 3 %
n / a
A p a r t m e n t
5 1 %
4 3 %
6 0 %
0 %
3 7 %
4 9 %
4 7 %
4 5 %
4 0 %
5 4 %
3 3 %
4 4 %
5 4 %
4 7 %
4 1 %
2 0 %
D e t a c h e d
1 , 6
2 2
1 , 7
5 6
7 5 3
1 3 8
1 , 8
9 6
4 1 3
1 , 4
3 6
6 3 7
4 5 1
2
, 1 9 7
3 7 9
1 , 0
1 5
2 , 5
0 3
2 , 4 0
7
1 , 1
6 3
2 3 8
1 9 , 0
0 4
A t t a c h e d
1 , 2
5 3
5 8 5
1 0 2
2
6 7 5
1 7 3
5 4 1
3 7 4
3 4 6
1
, 5 3 6
2 1 8
9 6
6 0 4
1 , 1 8
9
1 2 0
3 1 9
8 , 1
3 3
A p a r t m e n t
2 , 5
4 2
1 , 1
0 5
2 1 4
5
4 9 1
1 , 2
5 8
1 , 3
4 3
5 7 5
5 1 2
2
, 5 3 1
2 0 8
9 2
1 , 8
5 7
6 , 6 4
6
2 7 0
2 7 7
1 9 , 9
2 6
D e t a c h e d
6 5 %
6 2 %
7 2 %
3 0 %
6 4 %
6 6 %
6 7 %
7 0 %
5 1 %
6 8 %
4 0 %
4 3 %
6 8 %
6 9 %
5 0 %
2 5 %
A t t a c h e d
7 2 %
6 4 %
8 2 %
5 0 %
6 1 %
7 5 %
7 2 %
7 9 %
7 0 %
7 5 %
3 9 %
5 0 %
6 9 %
6 6 %
3 8 %
2 8 %
n / a
A p a r t m e n t
6 6 %
6 4 %
6 8 %
0 %
4 9 %
6 7 %
6 3 %
5 8 %
5 9 %
6 8 %
3 2 %
4 5 %
6 4 %
6 6 %
5 2 %
2 2 %
N u m b e r
o f
L i s t i n g s
O c t o b e r
2 0 1 0
N u m b e r
o f
L i s t i n g s
% S a l e s t o
L i s t i n g s
N u m b e r
o f
L i s t i n g s
% S a l e s t o
L i s t i n g s
N u m b e r
o f
L i s t i n g s
% S a l e s t o
L i s t i n g s
S
e p t e m b e r
2 0 1 0
O c t o b e r
2 0 0 9
J a n . -
O c t . 2 0 1 0
J a n . -
O c t . 2 0 0 9
% S a l e s t o
L i s t i n g s
N u m b e r
o f
L i s t i n g s
% S a l e s t o
L i s t i n g s
O c t o b e r
2 0 1 0
Y
e a r - t o - d a t e *
Y e a r - t o - d a t e *

8/8/2019 REBGV Stats Package October 2010
http://slidepdf.com/reader/full/rebgv-stats-package-october-2010 6/7
Real Estate Board of Greater Vancouver Listing & Sales Activity Summary
Listings Sales1 2 3 Col. 2 & 3 5 6 7 Col. 6 & 7 9 10 Col. 9 & 1
Oct Sep Oct Percentage Oct Sep Oct Percentage Aug 2009 - Aug 2010 - Percenta
2009 2010 2010 Variance 2009 2010 2010 Variance Oct 2009 Oct 2010 Variance
BURNABY % % %
DETACHED 166 170 132 -22.4 129 75 74 -1.3 370 238 -35.7
ATTACHED 128 89 87 -2.2 98 44 52 18.2 318 149 -53.1
APARTMENTS 329 279 202 -27.6 216 126 132 4.8 598 409 -31.6
COQUITLAM
DETACHED 172 182 115 -36.8 130 83 94 13.3 398 234 -41.2
ATTACHED 51 56 42 -25.0 47 25 23 -8.0 131 72 -45.0
APARTMENTS 117 124 111 -10.5 86 51 56 9.8 286 155 -45.8
DELTA
DETACHED 54 91 51 -44.0 55 35 34 -2.9 162 106 -34.6
ATTACHED 14 12 6 -50.0 7 10 7 -30.0 28 23 -17.9
APARTMENTS 31 29 19 -34.5 17 12 18 50.0 48 44 -8.3
MAPLE RIDGE/PITT MEADOWS
DETACHED 161 161 151 -6.2 161 77 76 -1.3 433 237 -45.3
ATTACHED 53 90 68 -24.4 41 46 27 -41.3 144 105 -27.1
APARTMENTS 53 55 47 -14.5 38 18 18 0.0 98 46 -53.1
NORTH VANCOUVER
DETACHED 125 168 125 -25.6 117 62 77 24.2 317 197 -37.9
ATTACHED 50 70 46 -34.3 41 21 21 0.0 115 69 -40.0APARTMENTS 150 167 117 -29.9 112 73 79 8.2 310 209 -32.6
NEW WESTMINSTER
DETACHED 41 57 39 -31.6 40 24 31 29.2 98 81 -17.3
ATTACHED 19 15 4 -73.3 18 5 8 60.0 51 18 -64.7
APARTMENTS 121 148 85 -42.6 100 58 60 3.4 286 171 -40.2
PORT MOODY/BELCARRA
DETACHED 38 35 32 -8.6 26 11 20 81.8 86 45 -47.7
ATTACHED 27 32 19 -40.6 22 10 13 30.0 72 39 -45.8
APARTMENTS 59 56 50 -10.7 30 24 21 -12.5 95 67 -29.5
PORT COQUITLAM
DETACHED 63 65 49 -24.6 54 23 25 8.7 159 74 -53.5
ATTACHED 28 34 18 -47.1 24 17 25 47.1 89 55 -38.2
APARTMENTS 63 66 46 -30.3 55 17 18 5.9 127 54 -57.5
RICHMOND
DETACHED 208 174 175 0.6 185 110 133 20.9 547 367 -32.9
ATTACHED 160 106 101 -4.7 137 84 85 1.2 411 253 -38.4
APARTMENTS 343 233 238 2.1 222 148 133 -10.1 635 408 -35.7
SUNSHINE COAST
DETACHED 69 77 66 -14.3 43 39 44 12.8 159 126 -20.8
ATTACHED 7 15 6 -60.0 8 5 7 40.0 21 16 -23.8
APARTMENTS 4 3 3 0.0 5 3 2 -33.3 19 9 -52.6
SQUAMISH
DETACHED 37 36 20 -44.4 17 10 11 10.0 61 31 -49.2
ATTACHED 24 16 17 6.3 14 7 9 28.6 39 31 -20.5
APARTMENTS 9 16 6 -62.5 20 1 4 300.0 34 11 -67.6
VANCOUVER EAST
DETACHED 277 205 139 -32.2 231 108 124 14.8 659 363 -44.9
ATTACHED 49 69 54 -21.7 48 39 33 -15.4 143 94 -34.3
APARTMENTS 218 173 149 -13.9 151 90 82 -8.9 447 247 -44.7
VANCOUVER WEST
DETACHED 238 263 188 -28.5 200 143 161 12.6 577 438 -24.1
ATTACHED 94 126 91 -27.8 78 48 51 6.3 243 152 -37.4
APARTMENTS 833 720 582 -19.2 529 325 337 3.7 1515 986 -34.9
WHISTLER
DETACHED 28 20 26 30.0 6 6 11 83.3 23 27 17.4
ATTACHED 35 20 21 5.0 17 17 9 -47.1 36 42 16.7
APARTMENTS 42 19 26 36.8 7 9 9 0.0 17 33 94.1
WEST VANCOUVER/HOWE SOUND
DETACHED 141 124 102 -17.7 84 56 59 5.4 208 161 -22.6
ATTACHED 10 17 9 -47.1 10 5 7 40.0 26 16 -38.5
APARTMENTS 34 39 14 -64.1 19 16 15 -6.3 45 41 -8.9
GRAND TOTALS
DETACHED 1818 1828 1410 -22.9 1478 862 974 13.0 4257 2725 -36.0
ATTACHED 749 767 589 -23.2 610 383 377 -1.6 1867 1134 -39.3APARTMENTS 2406 2127 1695 -20.3 1607 971 984 1.3 4560 2890 -36.6

8/8/2019 REBGV Stats Package October 2010
http://slidepdf.com/reader/full/rebgv-stats-package-october-2010 7/7
R e a l E s t a t e B o a r d o f G r e a t e r V a n c o u v e r A v e r a g
e P r i c e G r a p h
J a n u
a r y 1 9 7 7 t o O c t o b e r 2 0 1 0
0
2 0 0
4 0 0
6 0 0
8 0 0
1 0 0 0
1 2 0 0
1 9 7 7
1 9 7 8
1 9 7 9
1 9 8 0
1 9 8 1
1 9 8 2
1 9 8 3
1 9 8 4
1 9 8 5
1 9 8 6
1 9 8 7
1 9 8 8
1 9 8 9
1 9 9 0
1 9 9 1
1 9 9 2
1 9 9 3
1 9 9 4
1 9 9 5
1 9 9 6
1 9 9 7
1 9 9 8
1 9 9 9
2 0 0 0
2 0 0 1
2 0 0 2
2 0 0 3
2 0 0 4
2 0 0 5
2 0 0 6
2 0 0 7
2 0 0 8
2 0 0 9
2 0 1 0
D E T A C H E D
C O N D O M I N I U M
A T T A C H E
D
A P A R T M E N T S
I N
T H O U S A N D S ( $ )
N O T E : F r o m 1
9 7 7 - 1 9 8 4 c o n d o m i n i u m a v e r a g e s w e r e n o t s e p a r a t e d i n t o a t t a c h e d & a p a r t m e n t .
$ 5 1 9 , 1 8 7
$ 4 4 1 , 6 9 7
$ 1 , 0 5 8 , 5 7 9