reassessment of st francis dam failure
DESCRIPTION
geology notesTRANSCRIPT

THE ST. FRANCIS DAM
FAILURE worst American civil engineering
disaster of the 20th Century
J. David Rogers, Ph.D., P.E., P.G., C.E.G., C.HG. Karl F. Hasselmann Chair in Geological Engineering
Missouri University of Science & Technology for the
Shlemon Specialty Conference
Dam Foundations Failures and Incidents
Denver, Colorado May 16-17, 2013

• St. Francis Dam was a 205-ft high concrete gravity-arch dam constructed by the City of Los Angeles between 1924-26
• It failed catastrophically on March 12-13, 1928, killing at least 432 people, making it the worst American civil engineering failure of the 20th Century

William Mulholland 1855-1935
• Mulholland was Chief
Engineer of the Los Angeles
Water Co. from 1886-1902
• Chief Engineer & General
Manager of the Los Angeles
Bureau of Waterworks &
Supply from 1902-1928
• Principal visionary and
architect of the first Los
Angeles Aqueduct and the
LA Bureau of Power & Light

The Water Crisis of 1918-26
• While the aqueduct was under construction, the City’s population grew from 284,000 to 425,000 people
• Near record-low rainfall beset the LA area, beginning in the winter of 1918-19, lasting till 1924-25
• Cultivation of the San Fernando Valley increased 567% from 1914-1923
• More water storage was needed in the Los Angeles vicinity for drought periods.
• St. Francis was the largest of 9 reservoirs built or enlarged between 1920-26
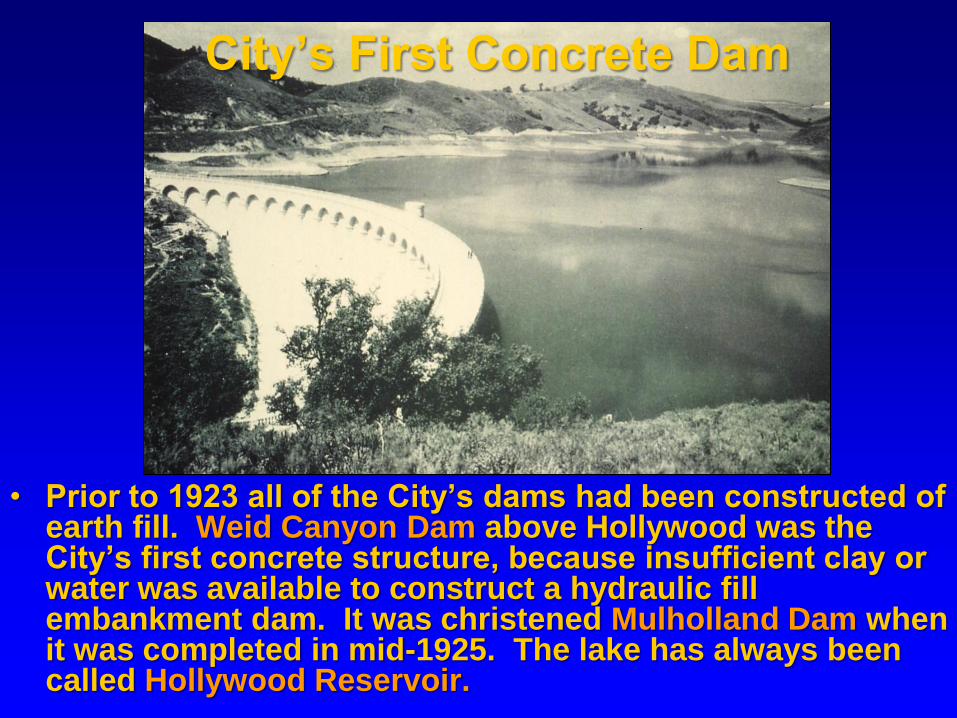
City’s First Concrete Dam
• Prior to 1923 all of the City’s dams had been constructed of earth fill. Weid Canyon Dam above Hollywood was the City’s first concrete structure, because insufficient clay or water was available to construct a hydraulic fill embankment dam. It was christened Mulholland Dam when it was completed in mid-1925. The lake has always been called Hollywood Reservoir.

Dam Site in San Francisquito Canyon
• A construction camp had been established in San Francisquito Canyon in 1911 during excavation of n 6.5 miles of tunnels in the Pelona Schist, between the future locations of Powerhouses 1 and 2
• Mulholland believed that the natural constriction of the canyon was an ideal location for a dam

• Construction of the St. Francis Dam began in July 1924 with the construction of a 8-feet high cutoff wall at the upstream heel. This view shows the placement of Outlet #1 and the two steps lying beneath it’s point of discharge.

• View looking upstream at the first forms being placed for
the upstream heel of the dam, against the 8 ft high
cofferdam wall. Note pillows of mass concrete and
absence of contraction joints.
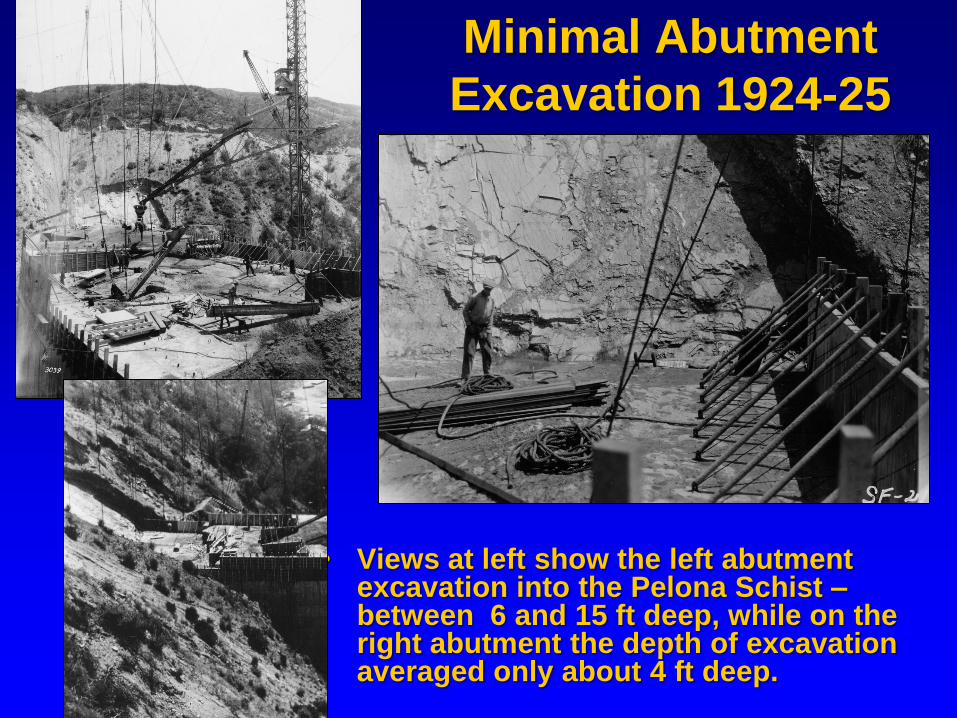
Minimal Abutment
Excavation 1924-25
• Views at left show the left abutment excavation into the Pelona Schist – between 6 and 15 ft deep, while on the right abutment the depth of excavation averaged only about 4 ft deep.
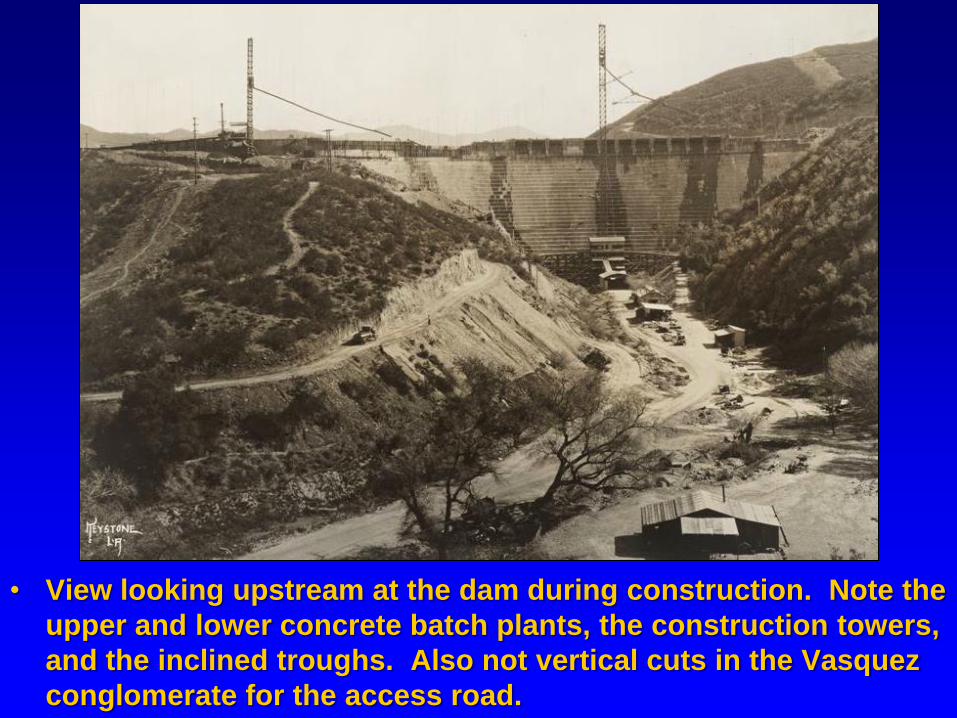
• View looking upstream at the dam during construction. Note the
upper and lower concrete batch plants, the construction towers,
and the inclined troughs. Also not vertical cuts in the Vasquez
conglomerate for the access road.

Dam had a stepped downstream face
• A unique aspect of both
the Mulholland and St.
Francis Dams was their
stepped downstream
faces
• The width of each step
was unique to its
respective elevation,
varying between 5.5 feet at
elevation 1645 and 1.45
feet at elevation 1815
• This figured prominently
in subsequent forensic
evaluations
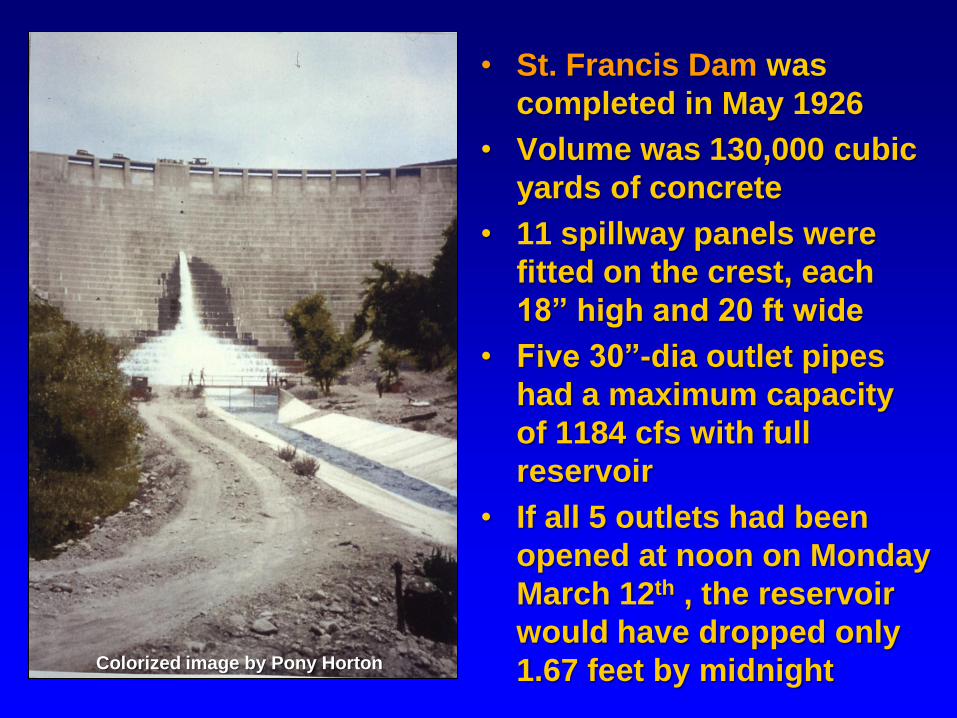
• St. Francis Dam was
completed in May 1926
• Volume was 130,000 cubic
yards of concrete
• 11 spillway panels were
fitted on the crest, each
18” high and 20 ft wide
• Five 30”-dia outlet pipes
had a maximum capacity
of 1184 cfs with full
reservoir
• If all 5 outlets had been
opened at noon on Monday
March 12th , the reservoir
would have dropped only
1.67 feet by midnight Colorized image by Pony Horton

• The reservoir was brought up to within 3 inches of spillway crest for the first time on Wed., March 7, 1928. All city reservoirs were full by the following Sunday, March 11th.
• Damkeeper Tony Harnischfeger called Mulholland on the morning of the 12th to report spillage of “dirty water” from the right abutment area. That morning about 2 cfs spillage was coming over the spillway panels from wind-whipped waves, shown here above around noon on March 12th.

Before and After
• Comparative views taken of the dam’s upstream face looking at the right abutment 12 hours before the failure (at left) and the day after (right)
• Note exposed keyway beneath right abutment dike

• The dam burst open at 11:57-1/2 PM on Monday evening March 12, 1928, sweeping everything in its path. The damkeeper, his wife and 6-year old son lived ¼ mile downstream. They became the flood’s first victims. One passerby noted lights down in the canyon below the dam within an hour of the failure. There were no lights on the dam.

• The dam went out in the middle of the night…and the
first 62 victims were employees and their families living
at Powerhouse No 2, 7300 feet downstream of the dam.
Lots and lots of dead children, such as the little boy
shown here, who was never identified.

Tidal wave of destruction
• Just downstream of the dam the maximum depth of the flood was about 125 feet, shown at left.
• Almost a mile downstream the floodwaters spilled over a natural saddle 120 feet above the channel
• The average velocity in this reach was about 26 feet per second, or 18 miles per hour.

• The initial flooding reached a maximum depth of 140 feet filling all of San Francisquito Canyon. In the map shown here the reservoir is indicated in dark blue and the flood limits in light blue.

64 victims at Powerhouse 2
• 7300 feet downstream, the wave drowned 64 of the
67 city employees and their dependents, who lived
at Powerhouse No. 2, shown here.

PATH OF DESTRUCTION
• The flood swept down San Francisquito Canyon and inundated the SoCal Edison Saugus substation, collapsing highway bridges at Castaic Junction, then swamped the SoCal Edison construction camp a few miles downstream at Kemp, drowning 84 of the 140 workers camped there.

INTO THE SEA
• The flood reached the Pacific Ocean below Montalvo around 5:30 AM. By this time the wave was only moving about 5 miles per hour, but was two miles wide. Both the railroad and highway bridges were washed out. A number of bodies were recovered from the ocean, as far south as the Mexican border.
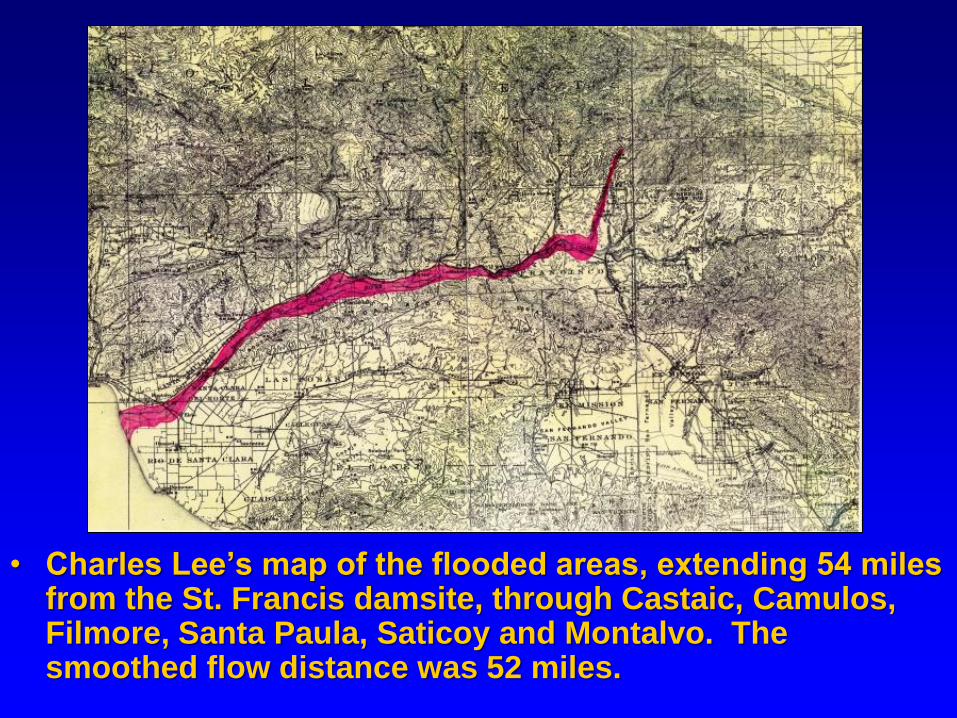
• Charles Lee’s map of the flooded areas, extending 54 miles from the St. Francis damsite, through Castaic, Camulos, Filmore, Santa Paula, Saticoy and Montalvo. The smoothed flow distance was 52 miles.

• Aerial oblique view of the dam site the morning after the failure, taken by Spence Aerial Surveys.
• Note the enormous landslide on the dam’s left abutment, truncating San Francisquito Canyon Road, at extreme right
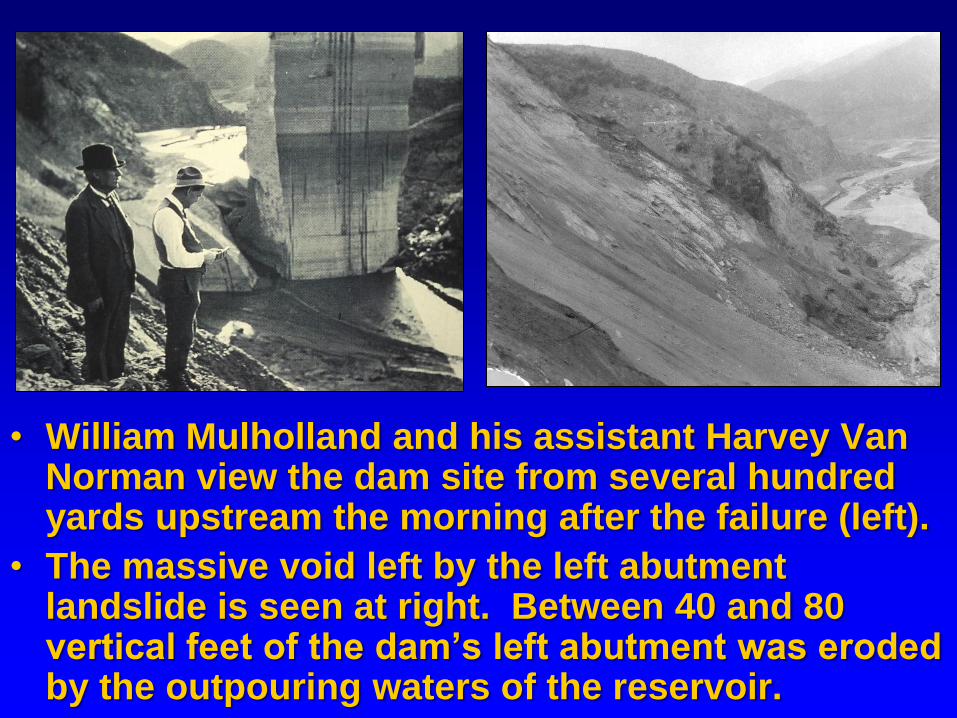
• William Mulholland and his assistant Harvey Van Norman view the dam site from several hundred yards upstream the morning after the failure (left).
• The massive void left by the left abutment landslide is seen at right. Between 40 and 80 vertical feet of the dam’s left abutment was eroded by the outpouring waters of the reservoir.

• Governor C.C. Young appointed a 6-man panel to investigate the failure, which included two geology professors. They made a single visit to the site on Tuesday, March 20th and depended entirely on the information collected by others and transmitted to them. Plane table survey of dam pieces by surveyor H. Wildy shown at right.

• The geologists were impressed by the sharp contact
between the Pelona Schist and Vasquez formation
(misnamed the Sespe formation in 1928), along the old San
Francisquito fault (an inactive feature)
• The panel suspected that hydraulic piping may have
occurred along the fault because the Vasquez beds were
subject to disintegration (slaking) when submersed in
water

• A colorized image of the St. Francis failure by Pony
Horton, showing the color contrast between the red beds
of the Vasquez [Sespe] conglomerate (at left) and the
grey colored Pelona Schist (at right)

Post-failure survey
of displaced blocks
State Division of Highways surveyor Horace Wildy
identified 11 of 20 concrete monoliths displaced by the
outbreak flood. The panel focused on Block 16 because it
was found further downstream than Blocks 11, 12, or 14.

The “Missing Section”
• The portion of the dam between Blocks 2/3/4
and 5/6/7 (shown in yellow) was not identified in
the debris field until months later.
• This was referred to as the “missing section”

FIXING BLAME
• The Commission met
on March 19th and
issued their report 5
days later
• They concluded that the
red conglomerate
underling the dam’s
right abutment was
unsuitable for a dam
foundation, and that the
failure began in that
area, along the old San
Francisquito fault

• One of the shortcomings of the plane table map of the displaced blocks was that it did not include the relative elevations of the objects. Blocks 12 and 14 from the base of the left abutment were located 26 feet higher than Block 16 and well off the right side of the channel. Block 11 may have helped form a dam with Blocks 12 and 13 that deflected subsequent flows off to the left, where Block 16 was found, further downstream.
A chopped downstream toe
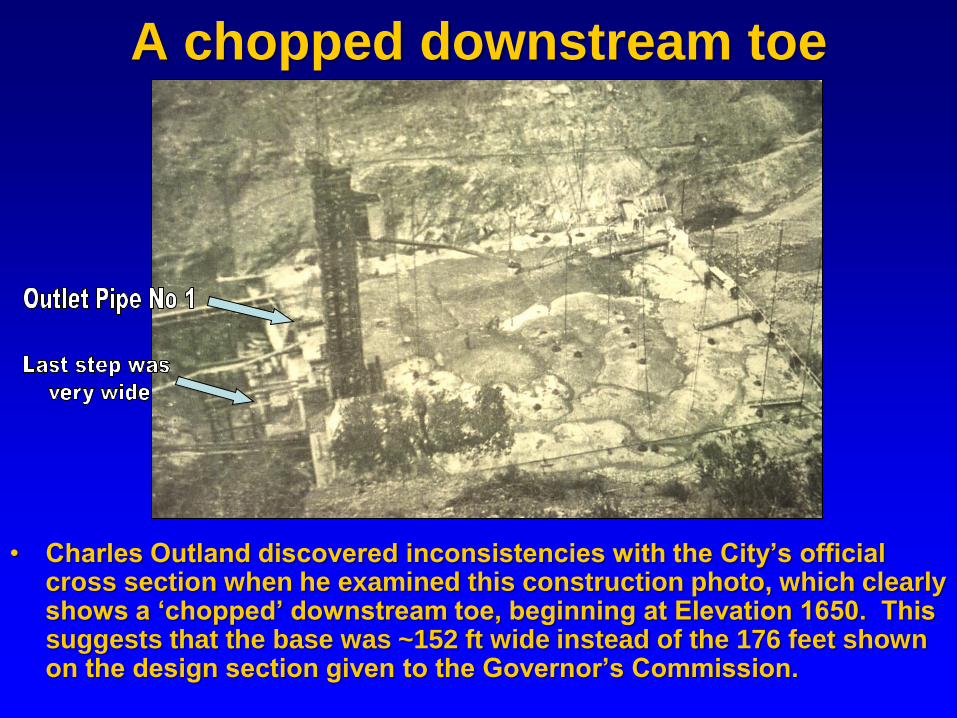
• Charles Outland discovered inconsistencies with the City’s official cross section when he examined this construction photo, which clearly shows a ‘chopped’ downstream toe, beginning at Elevation 1650. This suggests that the base was ~152 ft wide instead of the 176 feet shown on the design section given to the Governor’s Commission.
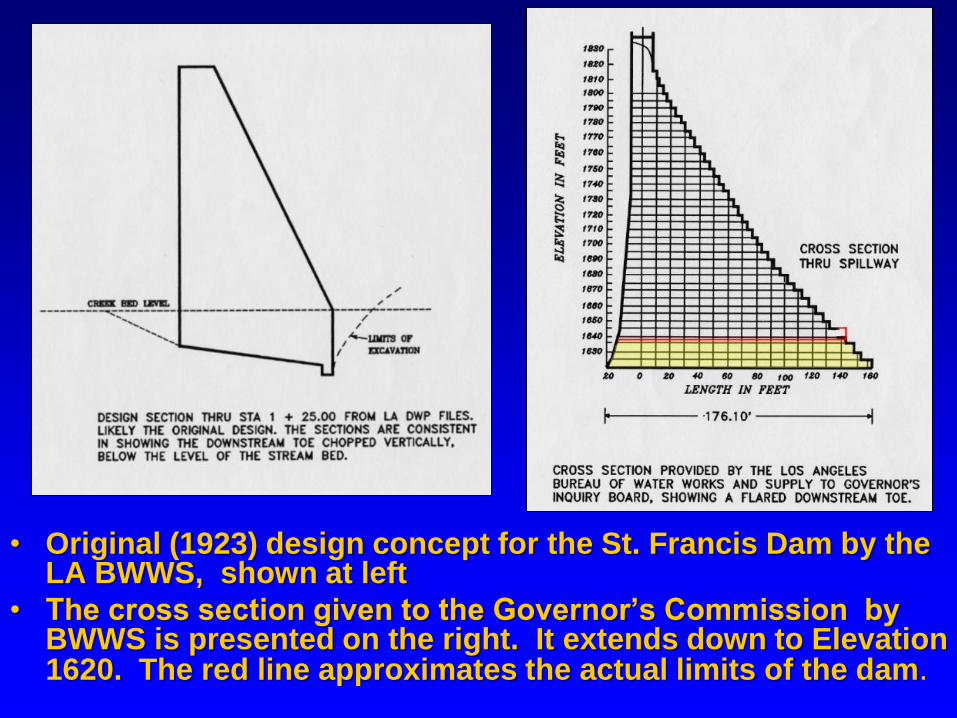
• Original (1923) design concept for the St. Francis Dam by the LA BWWS, shown at left
• The cross section given to the Governor’s Commission by BWWS is presented on the right. It extends down to Elevation 1620. The red line approximates the actual limits of the dam.

Battered upstream face ?
• The St. Francis Dam appears to have been constructed with a 1:27 and 1:10 batter of the upstream face.
• To date, no evidence has been found to show that the upstream batter was increased to 3.5:10 below Elevation 1645, as shown on the design section given to the Governor’s Commission, dated November 1924.

Political promises
• In June 1922 Mulholland promised the City’s Board of Public Service Commissioners that one of his proposed reservoirs would store a “entire year’s supply of water” for the City of Los Angeles south of the San Andreas fault
• Originally intended to be 180 feet high in May 1923, it was decided to raise the dam 10 feet in July 1924, shortly after construction began.
• Another 10 feet of height was added in July 1925
• These changes raised the height of the dam by 11% without increasing its base width, reducing the factor of safety against overturning

The Stevens Stage Record
• A Stevens reservoir level recorder was mounted on the crest of Block 1 (left view). It recorded a slight drop of the reservoir beginning around 8 PM, then an increasingly sharp drop beginning around 12 Midnight. The timing mechanism may have been slightly ahead of schedule.
Grunsky’s Ladder
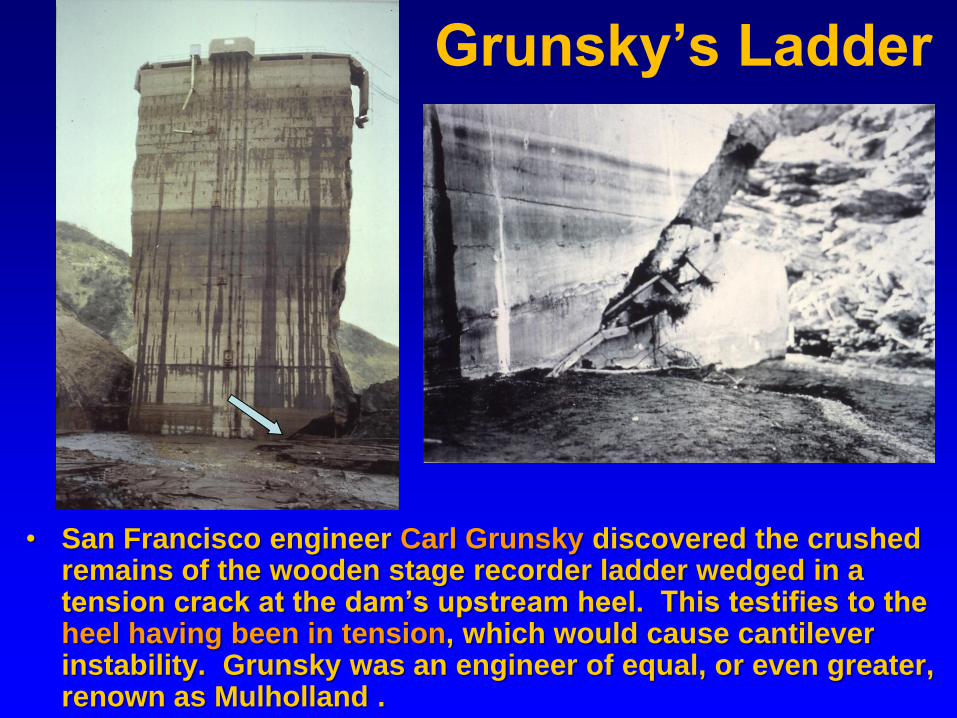
• San Francisco engineer Carl Grunsky discovered the crushed remains of the wooden stage recorder ladder wedged in a tension crack at the dam’s upstream heel. This testifies to the heel having been in tension, which would cause cantilever instability. Grunsky was an engineer of equal, or even greater, renown as Mulholland .
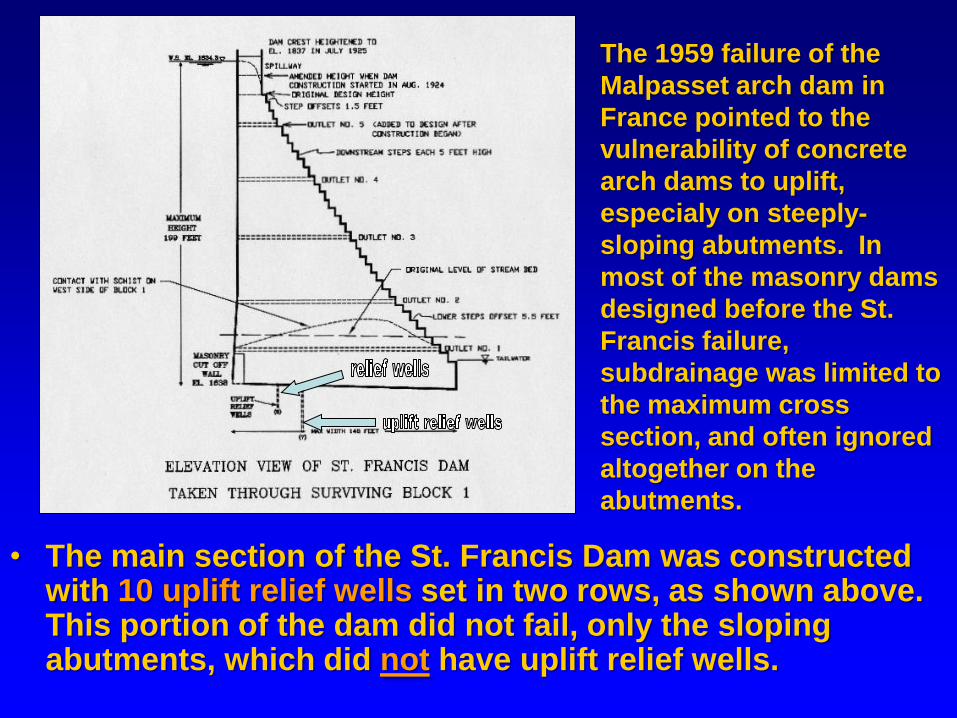
• The main section of the St. Francis Dam was constructed with 10 uplift relief wells set in two rows, as shown above. This portion of the dam did not fail, only the sloping abutments, which did not have uplift relief wells.
The 1959 failure of the
Malpasset arch dam in
France pointed to the
vulnerability of concrete
arch dams to uplift,
especialy on steeply-
sloping abutments. In
most of the masonry dams
designed before the St.
Francis failure,
subdrainage was limited to
the maximum cross
section, and often ignored
altogether on the
abutments.
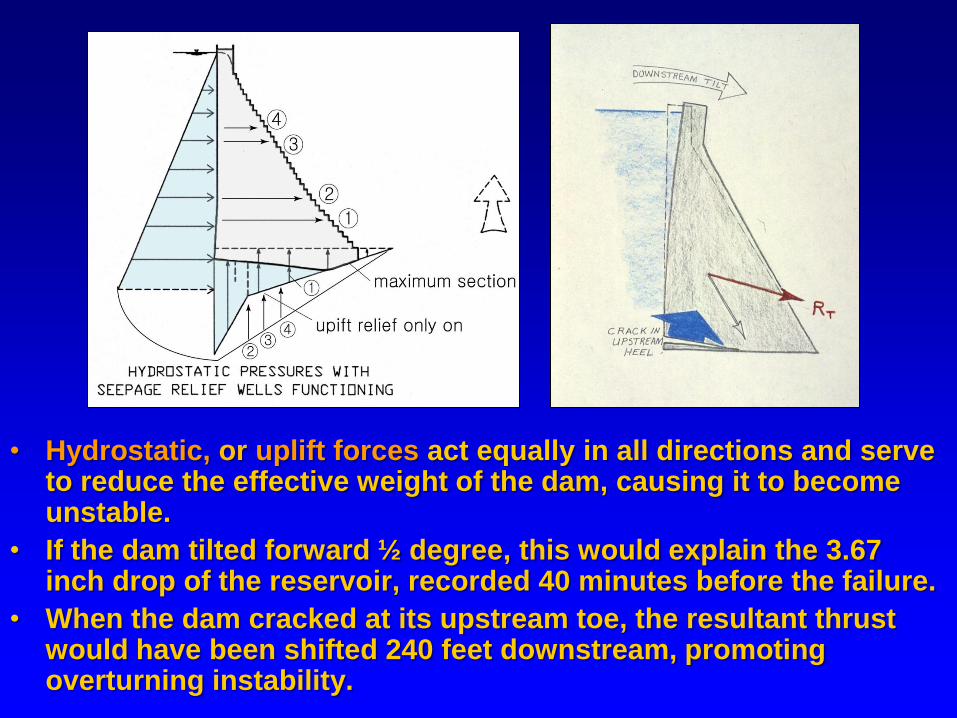
• Hydrostatic, or uplift forces act equally in all directions and serve to reduce the effective weight of the dam, causing it to become unstable.
• If the dam tilted forward ½ degree, this would explain the 3.67 inch drop of the reservoir, recorded 40 minutes before the failure.
• When the dam cracked at its upstream toe, the resultant thrust would have been shifted 240 feet downstream, promoting overturning instability.

The development of full hydrostatic uplift was a controversial subject,
before and, especially, after the St. Francis Dam failure
• Prior to 1928, engineering texts did not specify how to account for, or mitigate uplift, in their design examples for masonry gravity dams. These examples are from Smith’s Construction of Masonry Dams (1915) and Wegmann’s The Design and Construction of Dams (1917, 1922, 1927).

Design Methodology in early 1920s
• Prior to 1928, the example designs presented in textbooks summed the gravity forces as a line of thrust without reservoir pressure and another line of thrust with full reservoir pressure.
• Until 1945 most engineers assumed that concrete was sufficiently impervious to resist complete saturation, and that dams founded on relatively impervious strata, such as granite or gneiss, would not be subject to hydraulic uplift.
The example is from
Folwell’s Water Supply
Engineering, 3rd Ed
(1926)

• Prior to 1928, most concrete gravity dams were analyzed assuming the concrete to be perfectly dry. The dead weight of the concrete was then compared to the hydrostatic force of the water and see if the resultant thrust, RT, fell within the middle third of the dam’s base.

• In 1945 Karl Terzaghi published an article which demonstrated that water pressure could infiltrate mass concrete, saturating it.
• A conventional analysis of cantilever stresses in St. Francis Dam assuming full uplift reveals that the dam becomes unstable in overturning when the reservoir rose to within 7 feet of its crest! Full uplift may have developed beneath the sloping abutments, which were not afforded uplift relief wells.

• The arch stresses on the St. Francis Dam became very high when the reservoir was raised to within 11 feet of spillway crest.
• The dam was designed before the Trial Load Theory of Arch Stress Distribution was developed, so it was not designed to incorporate the contribution of arching to its stability.

• Reservoir Stage Curve for St. Francis Reservoir
between March 1, 1926 and March 13, 1928

In 1926 the reservoir was filled 110 feet, up to elevation
1780 feet between June 1st and September 1st, then
drawn down about 20 feet through the fall and winter
months, when demand was lowest.

From January 5 to May 8,1927 the
reservoir was raised another 52 feet,
to elevation 1832, within three feet of
the spillway sills, and held there for 3
weeks, then drawn down to
elevations 1813 to 1819 ft, until
November 10th.

During the first year of operation several large tension
cracks formed transverse to the dam’s axis. These were
likely in response to the cement heat of hydration, which
would have been considerable for 130,000 yds3 of mass
concrete.

Four prominent contraction joints leaked noticeable volumes of
water in the main dam and required grouting

Several tension cracks formed in the concrete dike section
during the second year of operation, in 1927-28. These
began leaking noticeably in early March 1928.

During the high water stand of 1927 seepage increased
markedly through the downstream face of the dam.
Mulholland ordered the four prominent cracks to be caulked
with oakum, to prevent loss of cement grout injected into
these cracks.

The reservoir was raised to within three inches of the
spillway sill elevation of 1835 feet on March 2, 1928

This allowed full hydrostatic pressures
and uplift to develop in the
foundations.

Prominent
shrinkage
crack
observed
cutting
through
Block 5 after
the failure
The oakum caulking can be
discerned on the post-failure
images as dark lines across
the dam’s downstream face

70 Kv Power line went down at 11:57-1/2 PM
• Southern California Edison’s 70 Kv Borel Power Line shorted out 2-1/2 minutes before Midnight. The tandem poles supporting the power line were situated well above the high water line, downstream of the dam’s right abutment (shown, above right).
• The Governor’s Commission missed seeing the disposition of the downed lines because they visited the site 7 days later, after the downed lines had been clipped and restored by SCE crews.

The tandem 70 Kv Power line poles
were high above the dam’s left abutment
• The tandem power poles were situated well above the maximum reservoir level, shown by arrow at left
• It would appear that the power line was severed by the left abutment landslide

The East Abutment Landslide
• The east abutment landslide involved about
700,000 cubic yards of Pelona Schist, removed
in a short period of time. The landslide scar
extended 130 feet above the reservoir water
surface.

Map of the East Abutment Landslide
• The reservoir water was only in direct contact with about 25% of the landslide material that was removed during the outbreak flood
• The dam’s left abutment thrust against the center of the landslide area, shown in brown

• The landslide of March 12,1928 was only a portion of a much larger paleolandslide developed deep within the Pelona Schist.

• Stanford Geology Professor Bailey Willis recognized the significance of en-echelon tensile scarps that cut across the Bee High Line Road, 200 feet above the reservoir’s high water line (see photo at right).
• He drew the sketch at left showing relation of the 1928 landslide to a much deeper-seated paleolandslide complex, developed in the Pelona Schist

• The prominent topographic benches developed on the Sierra Pelona are relicts of enormous landslide grabens. At various intervals these massive slides must have blocked San Francisquito Creek, creating temporary landslide dams, which promoted the development of the tree-filled glen on fluvial and lacustrine sediments that underlie the old reservoir floor.

Landslides mapped along canyon
• The areas outlined in red are paleolandslides developed within the Pelona Schist during the past 100 ka.
• The blue area is the outline of the St. Francis Reservoir when it failed. Note how the toes of many of the paleolandslides were inundated by the 1926 reservoir
Ancient Landslide Dam
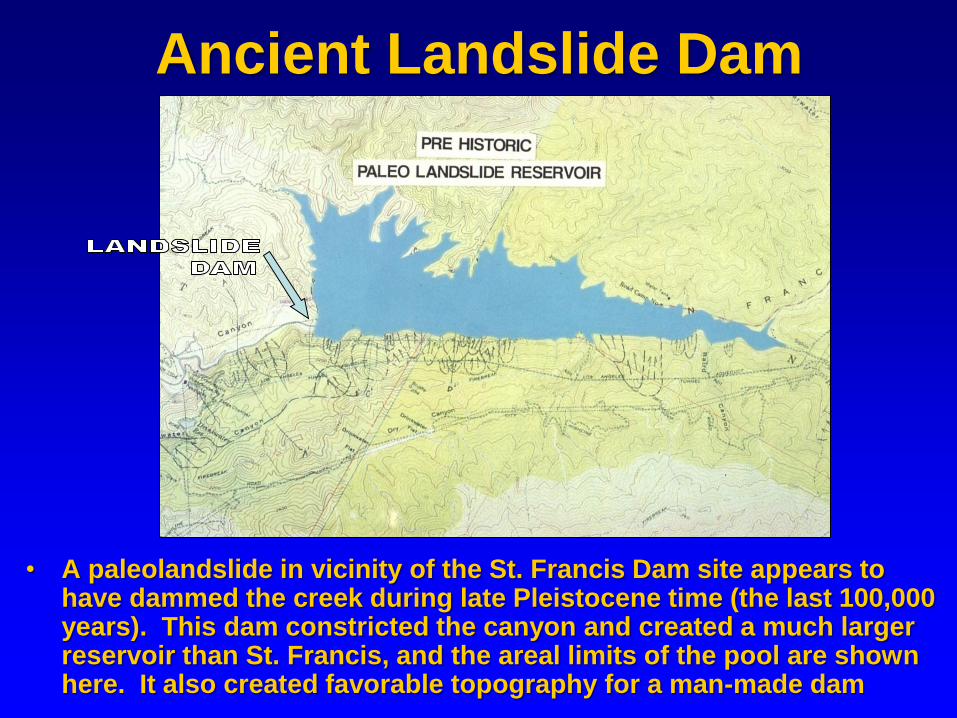
• A paleolandslide in vicinity of the St. Francis Dam site appears to have dammed the creek during late Pleistocene time (the last 100,000 years). This dam constricted the canyon and created a much larger reservoir than St. Francis, and the areal limits of the pool are shown here. It also created favorable topography for a man-made dam

City’s block map • City engineers Ralph R.
Proctor, H.C. Gardett, and A.R. Arledge made careful surveys of the flood aftermath
• Proctor had been BWWS resident engineer on St Francis, while Gardett and Arledge were BPL engineers supervising reconstruction of Powerhouse 2
• They identified the source locations of 17 of the dam’s displaced blocks
• Two candidates for Block 35 were identified, one of which was located the furthest distance downstream

Block 35 found furthest downstream
• Proctor, Gardett and Arledge identified two candidates for Block 35. The one located furthest downstream is shown at right. Block 35 came from the base of the dam’s “missing section,” at the bottom of the dam’s left abutment. Blocks 27, 28 and 35 were identified by adhesions of schist on their base relative to original horizontality of the concrete cold pour joints (pillows), which are easily discerned.

Like a Giant Jigsaw Puzzle
• Many of the dam’s concrete blocks were located
downstream on the basis of their step widths and the
foundation material adhering to them (channel alluvium,
schist or conglomerate).
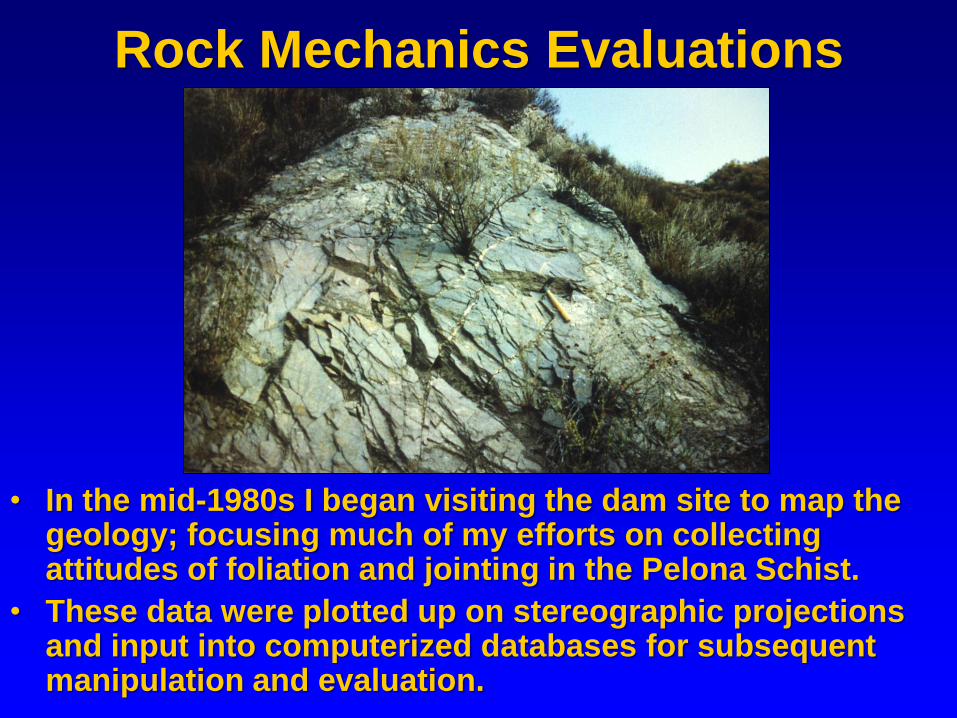
Rock Mechanics Evaluations
• In the mid-1980s I began visiting the dam site to map the geology; focusing much of my efforts on collecting attitudes of foliation and jointing in the Pelona Schist.
• These data were plotted up on stereographic projections and input into computerized databases for subsequent manipulation and evaluation.

Keyblock Theory
• The Keyblock computer program sorts out the
combinations of discontinuity intersections which could
form complex blocks of varying form. In this area, three
interesting types of blocks were identified at the base of
the dam’s left abutment
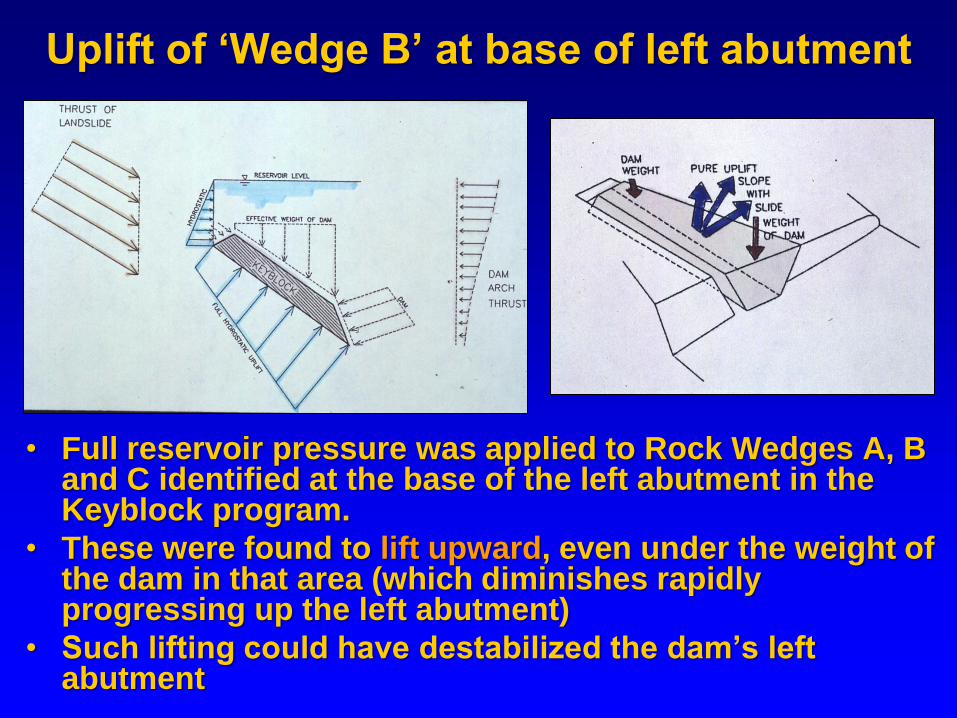
Uplift of ‘Wedge B’ at base of left abutment
• Full reservoir pressure was applied to Rock Wedges A, B and C identified at the base of the left abutment in the Keyblock program.
• These were found to lift upward, even under the weight of the dam in that area (which diminishes rapidly progressing up the left abutment)
• Such lifting could have destabilized the dam’s left abutment

Discontinuous Deformation Analyses
• A joint-bordered element mesh was constructed of the
dam’s lower left abutment area, assuming rock
wedges A, B and C; in vicinity of Block 35. The dam is
represented by the rectangular block shown above.
The reservoir pool (water) is to the left of this block.

Results of the DDA Evaluations
• The DDA simulations suggest that wedges A, B and C
would all lift significantly if subjected to pressure head
percolating beneath the dam’s sloping abutment. This
lifting could cause a catastrophic failure of the abutment
section, very similar to the mode of failure that
subsequently occurred at Malpasset Dam in 1959.

Malpasset Dam • The Malpasset arch dam
in France failed on its initial filling in 1959
• The dam was designed by Dr. Andre Coyne, the world’s foremost expert in arch dam engineering
• Dr. Pierre Londe spent
8 years unraveling the failure mechanism
• It was caused by hydraulic uplift of a large rock wedge lying beneath the dam’s left abutment

Modeling a high pressure leak
• The possible impact of high pressure orifice flow
emanating from the base of the left abutment was also
modeled, using Discontinuous Deformation Analysis.
• This model predicted slope instability resulting from flow
emanating from the base of the “missing section”

Evaluation of
East Abutment Slide
• Discontinuous Deformation Analysis was used to evaluate the East Abutment Landslide
• This illustrates the destabilizing effects of lateral loss of restraint that may have triggered upward migration of the slide mass
• Large pore pressures may have developed along the basal detachment surface due to entrapment in the mica schist, greatly reducing inter-particle friction
• The reservoir extended about halfway up the slope shown here

Dead Fish and the Sabotage Theory
• After the failure thousands of dead fish were observed floating in deep plunge pools excavated downstream of the failed dam. Some suggested they must have been ‘killed by dynamite’
• Autopsies of the dead fish revealed that they succumbed to silt ingestion of their gills; suggesting a very turbid outflow
• Based on later tests performed during the Second World War, it would have taken more than 12,000 lbs of dynamite beneath 30 feet of water on the dam’s upstream side to sabotage the structure

Back-analysis of the outbreak flood
• The dam site could not be used for a back-analysis of
the outbreak flood hydrograph (quantity of flow versus
time), because the cross-sectional area was varying
with each passing minute of the failure; beginning
with a small area and concluding with the maximum
area, shown here.

• We know from eye witness accounts that the reservoir was essentially empty by 1:09 AM, as shown above
• We know that the SCE’s Lancaster power line went down at 11:57-1/2 PM in vicinity of the dam site
• Exactly five minutes later, we know that Powerhouse 2, located 7300 feet downstream, went offline at 12:02-1/2 AM
Establishing constraining data points

Establishing constraining data points
• We know the maximum depth of the outflow from the measurements made at the time and used terrestrial photogrammetry to fill in the gaps
• The depth of flood water was about 140 feet just downstream of the dam and had diminished to about 110 feet at Powerhouse 2, 1.4 miles downstream
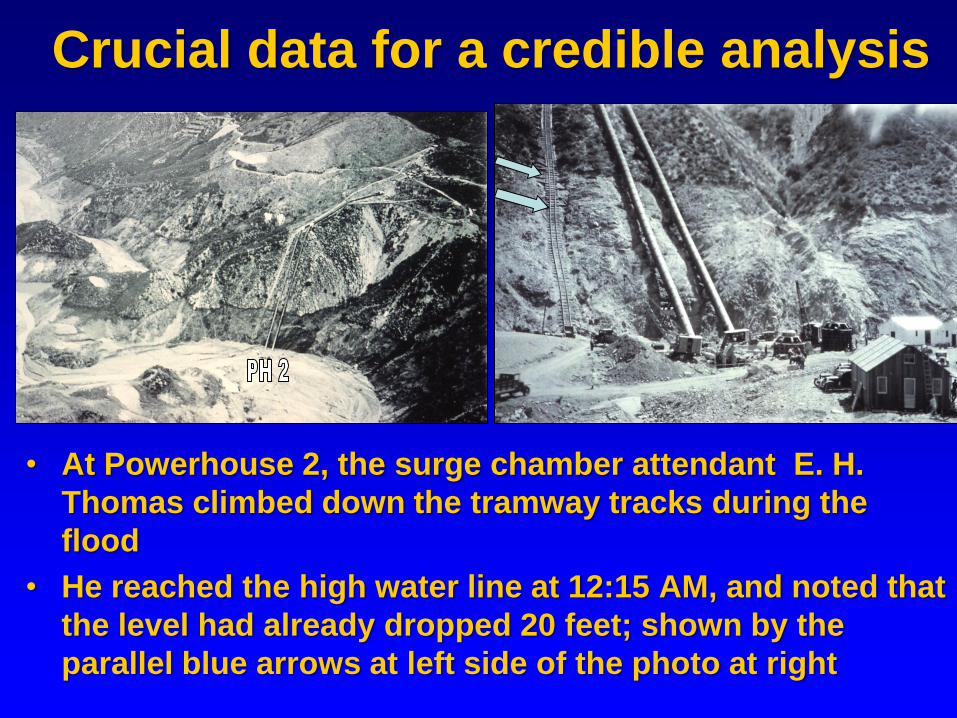
Crucial data for a credible analysis
• At Powerhouse 2, the surge chamber attendant E. H.
Thomas climbed down the tramway tracks during the
flood
• He reached the high water line at 12:15 AM, and noted that
the level had already dropped 20 feet; shown by the
parallel blue arrows at left side of the photo at right

Reconstructed hydrograph at Powerhouse 2
• A peak flow of 1.3 million cfs was calculated for
Powerhouse Two; 7,400 ft downstream of the dam
• The peak flow at the damsite was likely close to 1.7
million cfs

Freighting of massive blocks
• How were such massive blocks of concrete, weighing as much as 10,000 tons, moved as much as a half mile downstream?

Evidence of hydraulic sorting
• Flood outwash particles are typically sorted in inverse
fashion; with coarse material on the bottom and
progressively finer material upward, because the stream
power of the flood subsides with decreasing flow.
• Medium grained sand overlies coarse schist detritus (at
left)
• The average particle size was 12” in photo at right

• The coincident excavation of 700,000 yards of schist with the outpouring flood waters created an extremely turbid mixture.
• As the percentage of entrained solids in the flood water increases, the effective weight of the concrete blocks diminishes to a fraction of their dry weight. This is how large blocks were rolled so far downstream.
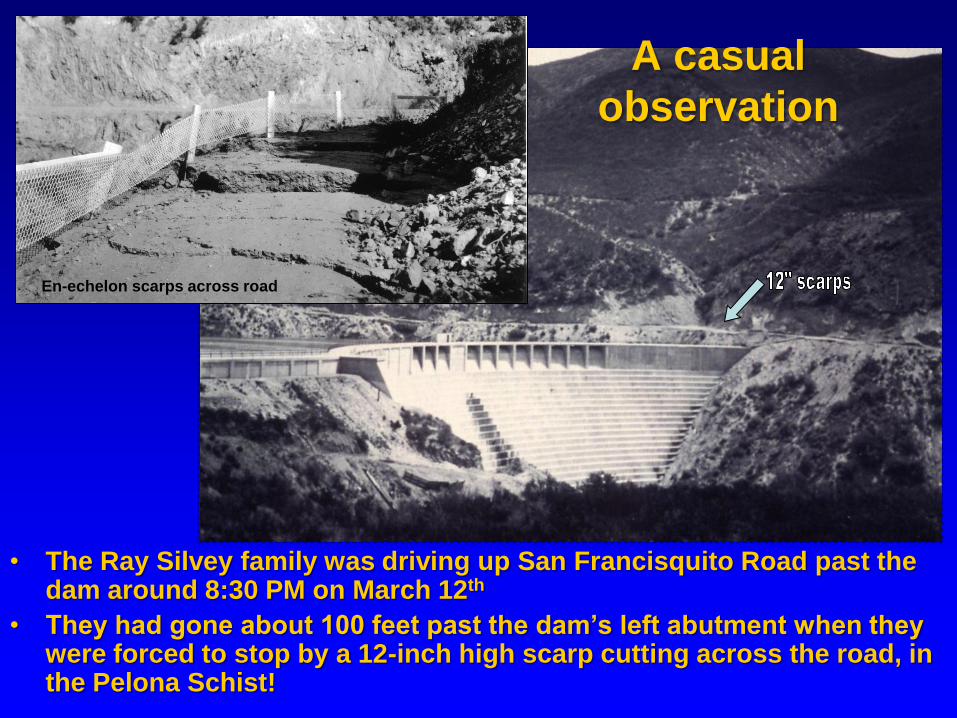
A casual
observation
• The Ray Silvey family was driving up San Francisquito Road past the dam around 8:30 PM on March 12th
• They had gone about 100 feet past the dam’s left abutment when they were forced to stop by a 12-inch high scarp cutting across the road, in the Pelona Schist!
En-echelon scarps across road

Likely Failure Sequence
• Several transverse cracks appeared in the dam during the previous year, as sketched here
• The entire left abutment (right side of this elevation view) dropped 12 inches, at least 3-1/2 hrs before the failure
• Some new leaks may have developed at the base of the left abutment, out of view of the road above.

• High velocity orifice flow may have sprung from the base of the right abutment, shortly before the failure.
• A light was observed in the canyon below the dam by passersby in the 45 minutes preceding the failure.
• The damkeeper wife’s body was found fully clothed, wedged between two blocks near the base of the structure, ¼ mile upstream from where she lived. This suggests the couple was up at the dam looking at something.

• Around 11:57-1/2 PM a massive landslide of the dam’s eastern abutment initiated, severing the SCE 70 Kv Lancaster power lines.
• The entirety of the dam’s left abutment was carried across the downstream face of the main dam.
• A landslide-driven displacement wave washed flotsam 4 ft above the reservoir high water line, 3/4 mile to the north
Landslide-
induced seich

• As the slide carried the dam’s left abutment section across the canyon, the heavy blocks sheared off 10 to 20 feet of the dam’s stepped concrete face.

• The sheer size of Blocks 5 and 6 can be appreciated in this
photograph, with a person for scale (arrow)
• Note the 5 to 10 feet cover of schist detritus preserved in
the steps of the block, 35 feet above the creek level.

• Another photo, showing the detachment of Block 6 from
Block 5. Note the four men for relative scale.

• Profile view taken
from left abutment
looking at the
massive cleavage of
the dam’s stepped
downstream face.
• Note the angle of the
cleavage is tilted
downstream
• Note the position of
Block 5, which slid all
the way to the right
abutment, then fell
about 35 feet (arrows)

Sheared face
of Block 1
• Another photo,
showing the final
position of Block 7,
wedged between
Blocks 1 and 5.
• Block 7 came from
the dam’s upper left
abutment, which slid
in behind Block 5.
• Note the man at
bottom left for scale.

• The landslide debris dam is eroded by the outpouring water over a period of probably less than five minutes
• The out-rushing flow bent the cylindrical stilling well of the Stevens Gage towards the left abutment
• Block 5 originally turned upward, against the right abutment

Rotation of Block 1 during outbreak flood
• Five benchmarks were set in the crest of the dam
• After the failure, the surviving stations were re-occupied and it was determined that Block 1 rotated clockwise, with the south edge shifting 8.4 inches towards the southwest, as shown here
• This rotation of Block 1 was likely caused by the outpouring flood waters passing around the left side of the dam, undercutting Block 2/3/4, before it toppled backward

• As the left side of the main dam was undercut, the dam tilted slightly and rotated to that side, allowing water to enter the shrinkage crack on the west side of Block 1
• This triggered a chain-reaction failure of the right abutment , but only after the reservoir had dropped between 70 to 80 feet.

• Man standing on ‘intact ground’ which was not inundated by outpouring flood waters, at elevation 1765, 70 feet below the reservoir water surface, along the construction access road that traversed the dam’s right abutment.
• The loose detritus in foreground suggest that the high water mark may have been 5 to 10 ft lower.

• Looking towards remnant of the main dam from the downstream right abutment, after the failure
• No erosion can be observed to a depth of at least 70 to 80 feet below crest, suggesting that the flooding did not initiate on this side of the dam

• Loose sidecast fill from construction access road begins about 75 feet below crest (arrow)
• Note schist detritus lying atop Block 5, 30 to 40 feet above the channel. This was left from the landslide that Block 5 rode down, into the canyon.

• Towards the end of emptying of the reservoir, the left half of the main dam topped backward at an angle of 54 degrees after being undercut by the outbreak flood waters. The depth of this downcutting was about 35 vertical feet!
• Patches of schist detritus were left upon Blocks 5 and 7 (shown in yellow)

• Photograph taken after the failure showing the disposition of Blocks 1 thru 7. The left half of the main dam fell into an enormous hole cut beneath its left side, between Elevation 1660 and 1615 ft, a depth of 45 feet!
• Note position of Block 5, well below chatter line on downstream face (arrows). Water pouring out of the right abutment breach likely carried off the schist detritus beneath Block 5.

• The elevation of the
drained reservoir pool at the time Blocks 2/3/4 topped backward (about 16 ft) was estimated by studying the scour marks left on the tilted blocks and comparing this measurement with the five-feet high concrete lifts, bracketed by the blue arrows

The Final Configuration
• The following morning this is how the dam site appeared.
• Note the tandem SCE power poles well above the high
water line downstream of the right abutment (arrow)

• A sorrowful Mulholland told the Coroner’s Inquest that he “only envied those who were killed”
• He went on to say “Don’t blame anyone else, you just fasten it on me. If there was an error in human judgment, I was the human.”

• The LA Co Coroner’s Inquest found that “… the construction and operation of a great dam should never be left to the sole judgment of one man, no matter how eminent…”

So, who actually ‘designed’ the dam? • Mulholland Dam was “laid
out” by BWWS office engineer Edgar A. Bayley (1877-1943)
• No cores or tests of the foundation rock were undertaken
• No formal calculations were made
• The design method used followed the examples presented in Smith’s Construction of Masonry Dams (1915), Fowler’s Water Supply Engineering (1926) and Wegmann’s The Design and Construction of Dams (1918, 1922, 1927)
The design for Mulholland Dam was simply
‘transferred’ to the St. Francis site, with a
number of minor changes; nobody actually
claiming credit for having “designed” the
structure. This is the dam’s maximum section
in October 1925, after being raised the first 10
ft.

• Fixing blame: The Wednesday March 28, 1928 edition of the Los Angeles TIMES ran headlines “Foundation blamed in Dam Disaster” and “Mulholland Takes Blame for Mistakes”

DESIGN DEFICIENCIES #1
• The dam was unknowingly built against a
paleolandslide
• Hydraulic uplift ignored in the design, leading to a
lower factor of safety than designers realized
• Hydraulic uplift not relieved on sloping abutments (a
common problem until the 1960s)
• Rather scant system of seepage interception
• Cement heat of hydration effects ignored
• Low strength laitance layer between successive
concrete lifts, creating low tensile strength horizons
• Aggregate separation using trough placement

DESIGN DEFICIENCIES #2
• The upstream heel of dam not battered 3.5:10 below elevation 1645 ft
• Dam heightened 20 feet without increasing base width
• Downstream face chopped off at elevation 1650 ft, giving a thinner cross section than it actually required, to overcome the effects of uplift
• Absence of grouted contraction joints
• Plugging the dam’s expansion cracks with oakum on the downstream face was the absolute WORST thing they could have done to destabilize the dam
• Gypsiferous Vasquez conglomerate subject to slaking under submersion
• No instruments placed within the dam structure to monitor its actual performance

CONCLUSION No. 1 • “For every complex problem, there is a solution
that is simple, neat, and wrong”
H. L. Menken
• #1) A calculated Factor of Safety less than 1.0
does not, in of itself, mean that a structure
failed via the precise mechanism analyzed.
Various failure mechanisms “compete” with
one another, simultaneously. All manner of
failure mechanisms should be evaluated
without prejudice. This is difficult to do, for
we are all prejudiced by our life’s experiences

CONCLUSION No. 2
• #2) We will not identify those
geologic features or structures for
which we are not specifically looking for. We have to have in
mind what we are seeking,
realizing that we will seldom be
able to recognize those features
with which we’ve had little prior
experience…

CONCLUSION No. 3
• Engineering geology, by its nature, is a
very subjective science, built upon
each person’s unique pedigree of
experience. The simple inclusion of a
geologist on a project, will not, in of
itself, insulate such projects from
disaster. Consider the fact that we now
know there are over 153 dams currently
existing in the United States which
were unknowingly built against ancient
landslides.
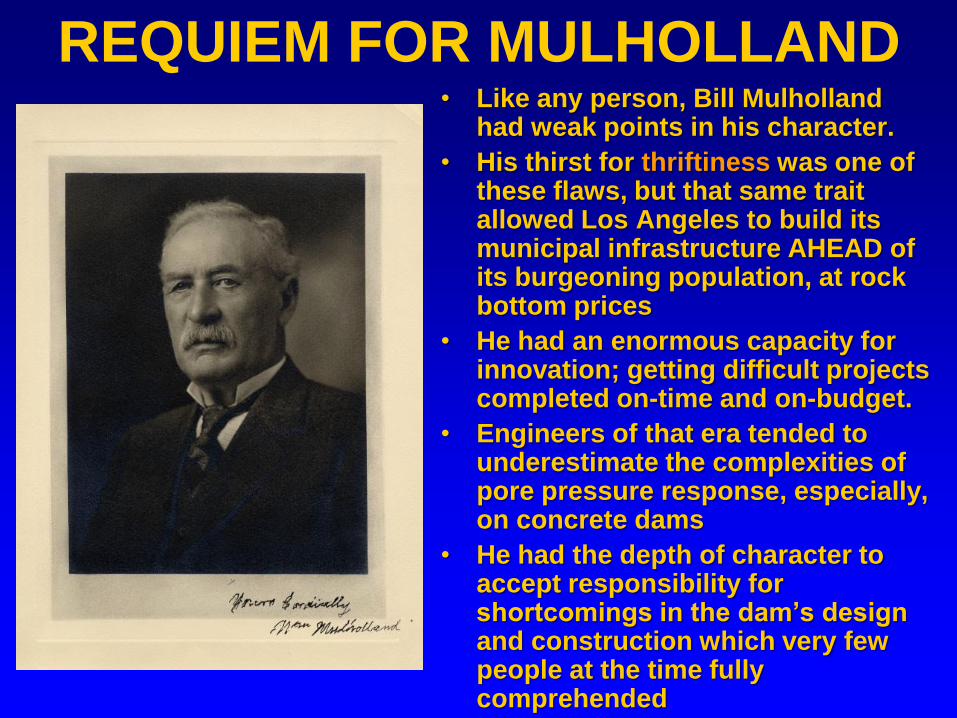
REQUIEM FOR MULHOLLAND • Like any person, Bill Mulholland
had weak points in his character.
• His thirst for thriftiness was one of these flaws, but that same trait allowed Los Angeles to build its municipal infrastructure AHEAD of its burgeoning population, at rock bottom prices
• He had an enormous capacity for innovation; getting difficult projects completed on-time and on-budget.
• Engineers of that era tended to underestimate the complexities of pore pressure response, especially, on concrete dams
• He had the depth of character to accept responsibility for shortcomings in the dam’s design and construction which very few people at the time fully comprehended