reasons for the decline in mortality in sri lanka …htc.anu.edu.au/pdfs/langf2_1.pdfhealth...
TRANSCRIPT

Health Transition Review 6, 1996, 3–23
Reasons for the decline in mortality inSri Lanka immediately after the SecondWorld War: a re-examination of theevidence*
C.M. Langford
Department of Social Policy and Administration, London School of Economics
AbstractNewman estimated that 42 per cent of the decline in mortality in Sri Lanka between 1930-1945and 1946-1960 was attributable to DDT-spraying; Molineaux estimated 27 per cent; Gray judgedthat 23 per cent of the decline between 1936-1945 and 1946-1960 was due to DDT. Here theNewman-Gray-Molineaux approach is criticized, the main point being that they ignored asignificant improvement in mortality in the early 1940s, before DDT-spraying. Bearing this, andcertain other complexities of the situation, in mind, an attempt is made to assess the impact ofDDT on mortality.
Immediately after the Second World War Sri Lanka (then Ceylon) embarked on a program ofDDT-spraying designed at least to suppress, and if possible even to eliminate, malaria, bykilling the adult mosquitoes responsible for spreading the disease. Until then malaria hadfigured very prominently in Sri Lankan morbidity and mortality. Death rates then improvedconsiderably in the late 1940s, prompting the suggestion by some that DDT-spraying hadbeen largely responsible. However, others disagreed and a debate ensued about the relativeimportance of the DDT campaign, on the one hand, and improved provision of healthservices or a variety of social and economic factors, on the other. The population of SriLanka, according to the 1946 census, was 6.7 million.
DDT-spraying had begun in earnest in November 1945, after a few small-scaleexperiments earlier that year utilizing supplies provided by the military authorities, andcovered all malarial areas by 1947 (Rajendram and Jayewickreme 1951:22; Visvalingam1961:64). According to Cullumbine the effect was dramatic: noting a marked drop in thecrude death rate in Sri Lanka from 20.3 deaths per 1000 population in 1946 to 14.3 in 1947,and 13.2 in 1948, he observed: ‘This sudden drop in the rate can be attributed almost entirelyto the near-eradication of malaria following the successful use of D.D.T. as a control measurefor mosquitoes’ (Cullumbine 1950:120). Sarkar, however, disagreed, arguing that mortalitywas already following a long-run downward trend in Sri Lanka from well before the SecondWorld War, and that the postwar decline might well be largely a continuation of this (Sarkar1957:121-125). Sarkar was
...inclined to believe that the low death rate of today has been the result of a number offactors of which D.D.T. spraying is one, which have been operating with a cumulativeeffect ... The operation of this process has probably been accelerated recently by theimprovement in curative and preventive medicine, in the political status of the country andin the economic situation generally (Sarkar 1957:124-125).
* This article is based upon work carried out with the support of a grant from the Economics and SocialResearch Council (ESRC Award R-000-23-2579).

4 C.M. Langford
Health Transition Review
Coale and Hoover (1958:62-67) concluded that DDT-spraying was responsible for‘something less than half’ (p.66, footnote 13) of the decline in mortality in Sri Lanka betweenthe period 1936-1945 and the period 1950-1952. Newman estimated that 42 per cent of thefall in the average annual crude death rate in Sri Lanka between the periods 1930-1945 and1946-1960 was attributable to DDT-spraying, though possibly aided by quinine use(Newman 1965:3,48-49; 1970:157, note 17; Newman and Meegama 1969:285).
Meegama (1967) believed that Newman's analysis overstated the significance of theDDT campaign. He argued that Newman had overlooked a very important point: that in theimmediate postwar period the malarial areas of Sri Lanka had profited not only from DDT-spraying but also from a disproportionate improvement in health services, as well as possiblyin nutrition. Meegama also expressed the view, though this point was put less strongly andnot pressed by him in the subsequent debate, that mortality in Sri Lanka was already clearlyfalling in the late 1930s and the early part of the war, so that the postwar decline in mortalityshould in part be seen as the resumption of an earlier trend which had then been interruptedby various difficulties in the latter part of the war.
Meade (1968) did not accept this second point of Meegama's and found it difficult tomake a judgement in the case of the first. He concluded that although health measures of onekind or another were responsible for the fall in mortality in Sri Lanka (and some othercountries) after the war ‘the relative importance of malaria eradication by residual spraying asagainst other general and less specific health measures is to some extent an open question’(p.109). Very similar views to Meade's were expressed in a leading article in The Lancet atthe time (1968, 1:899-900).
Frederiksen (1970) believed, like Meegama, that Newman had overestimated the impactof DDT in Sri Lanka. He saw the postwar improvement in mortality as largely the resumptionof a long-run downward trend after an interruption in the latter part of the war; and felt thatfluctuations in standard of living and especially in food availability might well be animportant element in the situation (Frederiksen 1960, 1961, 1962, 1966). He thought that nomore than 19 per cent of the decline in the crude death rate in Sri Lanka between 1944, thelast year before spraying began, and 1954, which he considered the appropriate comparisonto make, could have been due to DDT-spraying (Frederiksen 1970).
Gray (1974) estimated that 23 per cent1 of the postwar decline in the crude death rate inSri Lanka was attributable to DDT-spraying. His approach followed that of Newman (1965)but with two modifications. Newman's estimation depended on a linear regression equationlinking the absolute fall in the average annual crude death rate between the periods 1930-1945 and 1946-1960 in the 21 districts of Sri Lanka, as dependent variable, to the average so-called ‘spleen rate’ in the districts for the period 1938-1941. The ‘spleen rate’, the proportionof school children found in surveys to have an enlarged spleen, was taken as an indication ofthe level of malaria in a district, an enlarged spleen being one of the possible symptoms ofmalaria; the years 1938-1941 were the last for which this information was available before tothe DDT campaign. Since spleen rates effectively became zero throughout Sri Lanka notmany years after the Second World War (Newman 1965:91-92) the rates for 1938-1941 alsorepresent the improvement in spleen rates that took place over this period. Gray modifiedNewman's approach, first, by using as dependent variable in the linear regression theproportional rather than absolute decline in the crude death rate, which he argued was moreappropriate, and secondly, by considering changes not between 1930-1945 and 1946-1960but between 1936-1945 and 1946-1960: this latter change was because there was a veryserious malaria epidemic in Sri Lanka in 1934-1935 which Gray believed might distort theanalysis.
1According to Newman (1977:260), given Gray's approach, this figure should have been 22 per cent.

Decline in mortality in Sri Lanka after World War II 5
Health Transition Review
Newman subsequently seemed implicitly to accept this second point of Gray's in that hetoo compared the periods 1936-1945 and 1946-1960 when he re-examined this questionusing a Box-Cox approach; however his ‘best’ estimate of the contribution of the DDT-campaign to the fall in the crude death rate in Sri Lanka between these two periods, using thisapproach, was still 44 per cent; with his original regression approach but the periodssuggested by Gray, Newman's estimate would have been 48 per cent (Newman 1977).Molineaux, on the other hand, felt that Gray's regression approach, relating the proportionaldecline in the district crude death rates to the 1938-1941 spleen rates, was the more realistic,though he preferred the periods of time employed originally by Newman; on this basis hecalculated that 27 per cent of the reduction in the crude death rate in Sri Lanka between 1930-1945 and 1946-60 was attributable to DDT-spraying (Molineaux 1985).
Both Gray (1974) and Newman (1977) specifically rejected Meegama's assertion that inthe immediate postwar period malarial areas in Sri Lanka enjoyed a disproportionateimprovement in health services and possibly in nutrition. Neither of them seriously dealt withMeegama's other point, that there was a noticeable drop in mortality just before and in theearly part of the Second World War, and that this must be taken into account in consideringthe possible reasons for the postwar mortality decline. Gray's analysis simply did not point tosuch a dip in mortality (Gray 1974). Newman, responding to observations made byFrederiksen about a mortality decline in that period, spoke of the ‘well-known dangers inbasing trends in a fluctuating series on such a short time series’ (Newman 1970:153).
In what follows, the whole question of the possible reasons for the decline in mortality inSri Lanka after the Second World War is re-examined. Possibly the most important point toemerge is that Meegama was right that there was a noticeable fall in mortality in the late1930s and early 1940s which must be taken into account in judging subsequentdevelopments. This is demonstrated by a more detailed analysis of year-by-year changes inmortality in Sri Lanka than has hitherto been attempted, involving the consideration of infantand maternal as well as overall mortality, and the examination of changes in different parts ofthe country, supported by some completely new analysis of a whole range of data relating topublic health activities in Sri Lanka. A number of other significant points, overlooked inprevious work, are also brought out. It should be emphasized that this matter does not justhave historical significance, though that would make it important enough. Views about whathappened in Sri Lanka may well inform and therefore influence present-day approaches tomalaria control (see, for example, the recent review by Bradley 1993).
Malaria and malaria control in Sri Lanka before DDT-sprayingSri Lanka is an island not far north of the equator (5o55’ - 9o50’N), just off the south-east tipof India. It is about 140 miles across at its widest point and 270 miles from north to south.The south-central part of the island is mountainous, ranging from about 1000 feet to morethan 7000 feet above sea level; this is the so-called hill country where most of Sri Lanka's teais grown. The south-western coastal districts of the island together with this adjoining hillcountry are well watered and make up the ‘wet zone’ of Sri Lanka; the remainder of theisland, which has much less rainfall, constitutes the ‘dry zone’ (see map presented as Figure1). Some accounts refer also to an ‘intermediate zone’ on the fringes of the other two zones.Whereas the wet zone of Sri Lanka tends to experience rainfall both during the south-westmonsoon, which typically blows from May to September, and the north-east monsoon, whichtypically blows from November to March, the dry zone usually experiences rainfall only inconnection with the north-east monsoon; moreover, the south-west monsoon is generallymore reliable and associated with heavier rainfall than the north-east monsoon. Both zonestend to experience thunderstorms in the inter-monsoon periods.

6 C.M. Langford
Health Transition Review
Figure 1Districts of Sri Lanka subdivided into wet zone and dry zone districts

Decline in mortality in Sri Lanka after World War II 7
Health Transition Review
Malaria is spread by female anopheline mosquitoes: a person becomes infected whenbitten by a mosquito which has itself taken in malaria parasites some time before by biting aninfected person. The particularities of malaria transmission in Sri Lanka were established byCarter in the 1920s and early 1930s. He was a medical entomologist appointed by theGovernment of Ceylon in 1921 to study the problem. Carter discovered that although therewere 15 or more species of anopheline mosquitoes in Sri Lanka, several of which were,moreover, known to be implicated in malaria transmission elsewhere, only one species wasinvolved in malaria transmission in Sri Lanka: Anopheles culicifacies2 (Carter 1927; Gill1935; Visvalingam 1961). This was essentially a dry zone species, though in particularcircumstances it proliferated in parts of the wet zone.
The dry zone of Sri Lanka had (indeed has) a very large number of water storage ‘tanks’with associated irrigation systems. This, and some other features of the dry zone, meant thatthe kinds of pools, and puddles, and slow-moving streams in which A. culicifacies couldbreed were fairly common. Hence malaria was endemic in the dry zone, though with seasonalupsurges in the aftermath of rain. In the wet zone, on the other hand, in the ordinary course ofevents there were few opportunities for A. culicifacies to breed, though it was always present,hence little malaria. However, if there was a prolonged drought in the wet zone, pools wouldform in river beds, because of the fall in water levels, which provided ideal breeding sites forA. culicifacies, and a malaria epidemic would ensue; the impact of such an epidemic wouldbe the greater because of the relative lack of previous exposure and therefore immunity of thepopulation to the disease. There tended to be such epidemics of malaria in the wet, andespecially the ‘intermediate’, zone of Sri Lanka about every five years; the worst of thesecame as a result of the complete failure of the usually relatively reliable south-west monsoon.Since the breeding capability of A. culicifacies is markedly reduced at altitudes over 2500feet, the more elevated parts of the hill country were, however, completely free of the disease,or at least of locally-generated cases of it (see Carter 1927; Briercliffe 1935; Gill 1935;Rajendram and Jayewickreme 1951; Visvalingam 1961).
According to Rajendram and Jayewickreme (1951:2) there were malaria epidemics in SriLanka in 1906, 1911, 1914, 1919, 1923, 1928-1929, 1934-1935, 1939-1940, 1943 and 1945-1946.
The fact that malaria is transmitted by mosquitoes had been known since the very end ofthe nineteenth century following work by Ross. In Sri Lanka, from the beginning of thetwentieth century, attempts were made to control malaria by eliminating mosquitoes'breeding places: through drainage of wet areas, through in-filling of depressions, throughrepair and proper maintenance of water channels, through thorough and regular removal ofrefuse, which might otherwise provide receptacles for water, etc. Later, in addition, mosquitobreeding sites were sprayed with oil, or various other compounds, in order to kill mosquitolarvae; larvivorous fish were introduced. There was also some use of insecticides. Beginningin a small way but increasingly as time went on, quinine was distributed, both for malariatreatment and for use prophylactically (see Rajendram and Jayewickreme 1951; Visvalingam1961; see also the annual Reports of the Principal Civil Medical Officer of Ceylon and thelater Reports of the Director of Medical and Sanitary Services of Ceylon).
The extent of such anti-malarial activity in Sri Lanka was relatively limited initially butincreased during the 1920s and into the 1930s. The particularly severe malaria epidemic of1934-1935 undoubtedly came as a shock and even an affront to Sri Lanka's Department ofMedical and Sanitary Services. Following reports on this outbreak by Briercliffe (1935) andGill (1935) the Malaria Control and Health Scheme was brought into operation in late 1936.This expressly provided for not only a whole battery of direct anti-malarial activities,
2A. culicifacies is still the only proved malaria vector in Sri Lanka.

8 C.M. Langford
Health Transition Review
including precautionary larvicidal spraying in areas judged to be showing pre-epidemic signs,but also a range of more general health measures: it embodied the notion that malaria couldnot be seen in isolation from more general health problems and that tackling these problemswould also reduce the impact of malaria; the scheme was seen as having particular relevancefor rural areas. In the words of the Director of Medical and Sanitary Services for Ceylon inhis report for 1937,
Malaria in rural areas cannot be dealt with in the same way as in urban areas. In the latter... it is possible for intensive anti-larval work to be undertaken on a reasonably economicalbasis; but this is not possible in wide areas with scattered population and where ricecultivation depends generally on artificial irrigation. The work that is being carried outconsists of direct and indirect methods for the amelioration of existing conditions in regardto malaria. The direct method is chiefly the treating of the disease and the control of theinsect vector as far as possible and the indirect method deals with conditions the existenceof which aggravate the incidence of malaria[,] by caring for the mother and child throughmaternity and child welfare work, by caring for the school child through school healthwork, by giving mass hookworm treatment, by treatment for parangi [yaws], by control ofcommunicable diseases, general sanitary work, and by health education (Ceylon 1938:Part 4, C38).
The Malaria Control and Health Scheme continued in operation through the late 1930sand throughout the Second World War, though with varying activity, and was still in place atthe time of the postwar DDT-spraying campaign. Beginning in 1943, and especially from1944 onwards, in addition to larvicidal spraying of mosquito breeding sites, there was fairlyextensive spraying of pyrethrum insecticide inside houses to kill adult mosquitoes.3 Thisactivity was superseded as the DDT-spraying campaign got under way. DDT was also usedas an insecticide, in the domestic setting. However it was longer-lasting in its effect, beingsprayed on walls and other surfaces and continuing to kill mosquitoes which landed there forsome time, i.e. it was a ‘residual’ insecticide, so that much less frequent spraying wasrequired than with pyrethrum (see Rajendram and Jayewickreme 1951; Visvalingam 1961;also the annual reports of the Principal Civil Medical Officer and the Director of Medical andSanitary Services).
Trends and fluctuations in mortality in Sri Lanka, 1900-1954
All of the measures presented here have been calculated from Sri Lankan census andregistration data. Census data were taken from the census reports: there were censuses of SriLanka in 1901, 1911, 1921, 1931, 1946 and 1953. Registration data were obtained from theannual Reports of the Registrar General of Ceylon on Vital Statistics.
Material is presented for the whole of Sri Lanka and for five areal subdivisions of thecountry, each subdivision comprising one or more of the (then) 21 administrative districts ofthe island. Sri Lanka was split first into ‘wet’ and ‘dry’ zones; the wet zone was then furthersubdivided into three areas and the dry zone into two areas (see Table 1 and map presented asFigure 1). The grouping of districts into wet and dry zones has been taken from UnitedNations (1976:35).
3In fact, there had been some, intermittent and small-scale, spraying of insecticide inside houses in SriLanka since 1934.
Decline in mortality in Sri Lanka after World War II 9
Health Transition Review
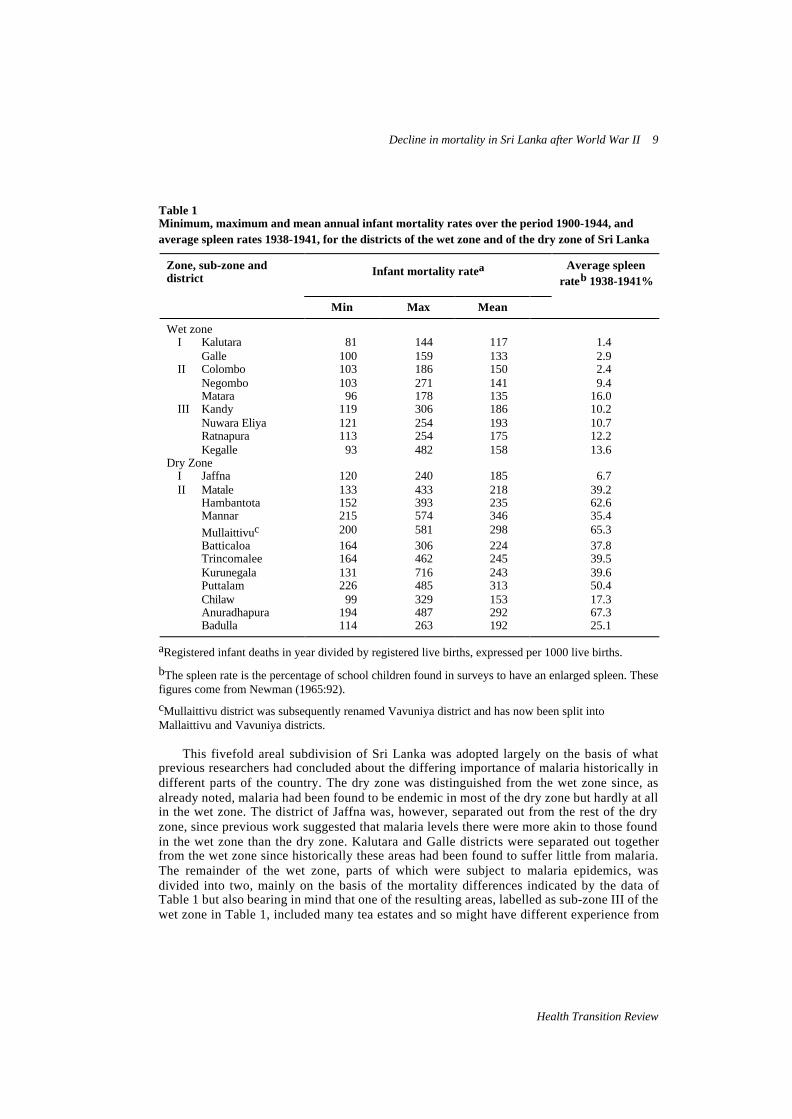
Table 1Minimum, maximum and mean annual infant mortality rates over the period 1900-1944, andaverage spleen rates 1938-1941, for the districts of the wet zone and of the dry zone of Sri Lanka
Zone, sub-zone anddistrict Infant mortality ratea Average spleen
rateb 1938-1941%
Min Max Mean
Wet zoneI Kalutara 81 144 117 1.4
Galle 100 159 133 2.9II Colombo 103 186 150 2.4
Negombo 103 271 141 9.4Matara 96 178 135 16.0
III Kandy 119 306 186 10.2Nuwara Eliya 121 254 193 10.7Ratnapura 113 254 175 12.2Kegalle 93 482 158 13.6
Dry ZoneI Jaffna 120 240 185 6.7II Matale 133 433 218 39.2
Hambantota 152 393 235 62.6Mannar 215 574 346 35.4
Mullaittivuc 200 581 298 65.3Batticaloa 164 306 224 37.8Trincomalee 164 462 245 39.5Kurunegala 131 716 243 39.6Puttalam 226 485 313 50.4Chilaw 99 329 153 17.3Anuradhapura 194 487 292 67.3Badulla 114 263 192 25.1
aRegistered infant deaths in year divided by registered live births, expressed per 1000 live births.
bThe spleen rate is the percentage of school children found in surveys to have an enlarged spleen. Thesefigures come from Newman (1965:92).
cMullaittivu district was subsequently renamed Vavuniya district and has now been split intoMallaittivu and Vavuniya districts.
This fivefold areal subdivision of Sri Lanka was adopted largely on the basis of whatprevious researchers had concluded about the differing importance of malaria historically indifferent parts of the country. The dry zone was distinguished from the wet zone since, asalready noted, malaria had been found to be endemic in most of the dry zone but hardly at allin the wet zone. The district of Jaffna was, however, separated out from the rest of the dryzone, since previous work suggested that malaria levels there were more akin to those foundin the wet zone than the dry zone. Kalutara and Galle districts were separated out togetherfrom the wet zone since historically these areas had been found to suffer little from malaria.The remainder of the wet zone, parts of which were subject to malaria epidemics, wasdivided into two, mainly on the basis of the mortality differences indicated by the data ofTable 1 but also bearing in mind that one of the resulting areas, labelled as sub-zone III of thewet zone in Table 1, included many tea estates and so might have different experience from

10 C.M. Langford
Health Transition Review
other areas (see Carter 1927; Briercliffe 1935; Gill 1935, 1940; Abhayaratne 1950;Rajendram and Jayewickreme 1951; Visvalingam 1961; Newman 1965; Gray 1974).
The data shown in Table 1 by and large confirm the appropriateness of this subdivisionof Sri Lanka. In general, dry zone districts had higher infant mortality than wet zone districtsand higher spleen rates, suggesting more malaria. Jaffna, on the other hand, was more similarto some wet zone districts in these respects than to other dry zone districts. Kalutara andGalle were the most favoured districts in the island; even Colombo district, which like themhad an extremely low 1938-1941 spleen rate, nevertheless had somewhat higher averageinfant mortality and higher peak mortality, the latter feature probably indicating a greatersusceptibility to epidemic malaria. On the figures of Table 1, both Chilaw district andBadulla district might possibly have been dealt with separately from other dry zone districts.This would have complicated the analysis quite considerably, however, without any verygreat benefit; so this approach was not adopted.
The graphs presented in Figure 2 show changes in the crude death rate, infant mortalityrate and maternal death rate for Sri Lanka over the period 1900-1954. The data on whichthese graphs are based are presented in an appendix; this is so for all graphs shown. Crudedeath rates were calculated by dividing the registered deaths in a year by the total populationand expressing the result per 1000 total population; populations in non-census years wereestimated by assuming a constant rate of growth between censuses. This method ofestimating denominators was obviously not exact; however, the fact that, as may be seenfrom Figure 2, the resulting crude death rates correspond almost exactly with those producedfor 1930 and later years by Newman (1965:89) using denominators estimated in a much moreelaborate fashion, suggests that these data are, nevertheless, reasonable. Infant mortality rateswere calculated by dividing the infant deaths registered in a year by the registered live births,and maternal death rates by dividing the maternal deaths, that is, deaths associated withpregnancy or childbirth, registered in a year by the registered live births, in each caseexpressing the result per 1000 live births.
It may be seen from Figure 2 that mortality in Sri Lanka fluctuated a great deal. Most ofthe upsurges in mortality were associated with outbreaks of malaria, though in 1918-1919there was a very serious influenza epidemic, which was itself then further added to by amalaria outbreak (Langford and Storey 1993a). From 1900 until about 1920—attempting toset aside short-run fluctuations—the data seem to suggest a slight upward trend in mortality:this may be genuine but is more likely to be a reflection of improvements in data quality.From about 1920 onwards—again, disregarding short-run fluctuations—there was a generaldownward trend in mortality, though in the case of maternal mortality this might not havebegun until the late 1930s. Marked fluctuations continued, however, the most notable beingthe terrible rise in mortality associated with the malaria epidemic of 1934-1935, until theimmediate post-World War II period, when they apparently disappeared.
All of the data presented in Figure 2 indicate that there was a remarkable improvement inmortality in Sri Lanka after the Second World War. Mortality dropped in 1947 to lowerlevels than seen previously (since 1900) and there was further improvement subsequently. Insome degree, however, the fall in 1947 is made to seem more precipitate than it truly was bythe fact that mortality rose in Sri Lanka in the later years of the war and just afterwards.Moreover, before this rise, mortality in Sri Lanka had actually already been falling quitesharply, albeit only for a short period, to what were then unprecedentedly low levels, thecrude death rate and infant mortality rate dropping to a low-point in 1942 and the maternaldeath rate in 1943. There had been a previous dip in the crude death rate, though apparentlynot noticeably in infant and maternal mortality, in the early 1930s.

Decline in mortality in Sri Lanka after World War II 11
Health Transition Review
Figure 2Crude death rate, infant mortality rate and maternal death rate for Sri Lanka, 1900-1954
Figure 3 shows changes in the crude death rate over the period 1900-1954 for each of thefive areal subdivisions of Sri Lanka; Figure 4 shows changes in the infant mortality rate. Itmay be seen that all these areas shared in the general downward trend in mortality after about1920 in Sri Lanka. Areas differed, however, until the late 1940s, anyway, in terms of both thetypical level of mortality and the extent of mortality fluctuations. In the wet zone, sub-zone II(see Table 1 for the districts this included) after about 1920 tended to have similar or slightlyhigher mortality than sub-zone I in ‘good’ years but a larger gap opened between the twoareas when malaria struck, reflecting the greater susceptibility of sub-zone II to epidemicmalaria; in sub-zone III of the wet zone mortality tended to be somewhat higher still and thefluctuations due to epidemic malaria even more marked. In the dry zone, Jaffna district hadhigher mortality, in general, than sub-zones I to III of the wet zone but fluctuations inmortality were not especially marked; this area seems to have been completely unscathed inthe 1934-1935 malaria outbreak. The remainder of the dry zone had higher mortalitygenerally than other areas of the island as well as marked fluctuations in mortality. In all partsof Sri Lanka, however, from 1947 onwards, fluctuations in mortality were small anddifferences between areas relatively slight.
Of special interest in the present connection is whether the fall in mortality in 1947 in SriLanka as a whole occurred also in much the same way in these different areas of the country.Considering the period from 1920 on, it may be seen from Figure 3 that, so far as the crudedeath rate is concerned, there is no real sign of a noticeable discontinuity of trend in 1947 insub-zone I of the wet zone; moreover, if temporary upsurges in mortality are ignored, thesame can be said in relation to sub-zones II and III of the wet zone. In the case of Jaffna

12 C.M. Langford
Health Transition Review
Figure 3Crude death rate per 1000 population for the sub-zones of the wet zone and the dry zone of SriLanka, 1900-1954

Decline in mortality in Sri Lanka after World War II 13
Health Transition Review
Figure 4Infant mortality rate per 1000 live births for the sub-zones of the wet zone and the dry zone of SriLanka, 1900-1954

14 C.M. Langford
Health Transition Review
district there was apparently some acceleration in the decline of the crude death rate in thepost-World War II period, though if the improvement in the rate over the period 1934-1940 isused as a basis for judging likely future developments rather than the whole period from 1920on, the postwar dip below trend seems rather slight. In the remainder of the dry zone therewas, on the face of it, a clear downward shift in the crude death rate in 1947; however, evenin this case, there is the question of whether the very short-lived, but quite marked,improvement in the rate in the early 1940s, to what was then the lowest level ever (since1900), should be regarded as signalling the impending postwar improvement. There were, itmay be noted, new low-points in the crude death rate in all the sub-zones of Sri Lanka exceptsub-zone I of the wet zone in the early 1940s.
The data on infant mortality presented in Figure 4 point even more strongly to thequestion of whether the downward trend in mortality in Sri Lanka might not have taken on anew impetus in the late 1930s or early 1940s, thus in some sense anticipating the postwardecline. There was apparently quite a noticeable fall in the infant mortality rate in the early1940s, albeit very short-lived and rapidly reversed, in all parts of Sri Lanka except sub-zone Iof the wet zone; even in that area there seems to have been some acceleration of the pre-existing downward trend in the late 1930s and early 1940s.
Changes in the intensity of public health activities in Sri Lanka, 1930-1954
A variety of data relating to public health activities in Sri Lanka over the period 1930 to 1954is presented in Tables 2 and 3. These data have been compiled from material provided in theannual Reports of the Director of Medical and Sanitary Services of Ceylon , and theEducation reports, together with some information from the census and from vitalregistration. Even at the very beginning of this period there was clearly a great deal going on:most infants seem to have undergone at least primary vaccination against smallpox4; a verylarge number of individuals were treated for hookworm infestation each year, that is, wormed(for an account of the debilitating effects of this disease in Sri Lanka see Langford and Storey1993b); and the School Medical Service carried out a large number of medical examinationseach year among children in schools. In the early 1930s government expenditure on healthwas cut, as part of a general response to the economic difficulties of that period, and thereseems to have been a reduction in the number of primary smallpox vaccinations and in thenumber of medical examinations in schools; the anti-hookworm campaign, on the other hand,apparently increased its coverage during this time. In 1935 there was a considerable increasein government spending on health (strictly, this was in the 12-month period beginning on 1October 1934). However, this was obviously largely, and possibly entirely, simply a responseto the appalling malaria outbreak at that time. The number of malaria cases treated asinpatients in hospitals or, overwhelmingly, as outpatients in hospitals or dispensaries in 1935(5,454,781) amounted to 97 per cent of the population of Sri Lanka at that time.5 By contrast,
4 Only data on primary vaccinations against smallpox have been shown in Table 2 even though numbersof secondary vaccinations are also provided in the official reports. It was felt that numbers of primaryvaccinations give a better indication of the general level of vaccination activity, whereas numbers ofsecondary vaccinations tend to fluctuate more in response to actual or feared smallpox outbreaks.5See Administration Report of the Acting Director of Medical and Sanitary Services for 1935, page
C28. The number of cases reported is extremely high (though clearly labelled as such) and it isconceivable that the same individual could have been treated more than once in the same year, or even(as suggested by an anonymous reviewer) that the number of visits rather than cases has been reported.Even so, the number of malaria cases treated in 1935, and the expense of providing this treatment, musthave been very high indeed.
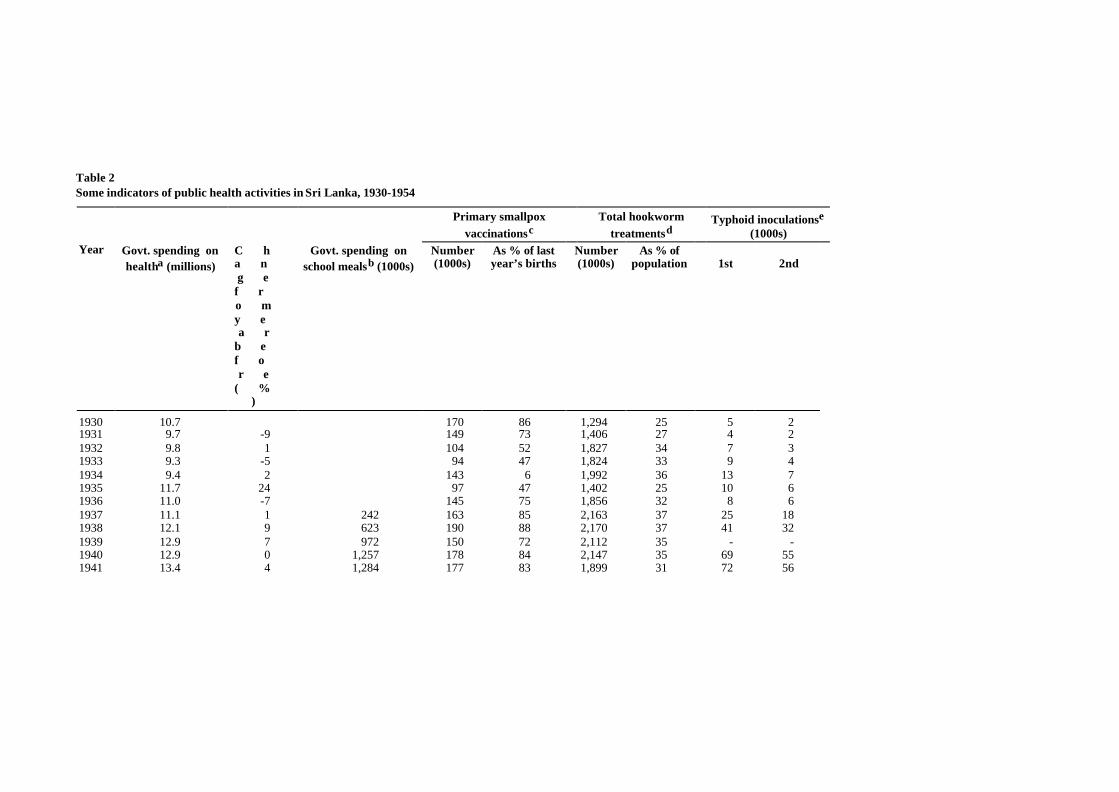
Table 2Some indicators of public health activities in Sri Lanka, 1930-1954
Primary smallpoxvaccinationsc
Total hookwormtreatmentsd
Typhoid inoculationse
(1000s)Year Govt. spending on
healtha (millions)C ha ng ef ro my ea r
b ef or e
( %)
Govt. spending onschool mealsb (1000s)
Number(1000s)
As % of lastyear’s births
Number(1000s)
As % ofpopulation 1st 2nd
1930 10.7 170 86 1,294 25 5 21931 9.7 -9 149 73 1,406 27 4 21932 9.8 1 104 52 1,827 34 7 31933 9.3 -5 94 47 1,824 33 9 41934 9.4 2 143 6 1,992 36 13 71935 11.7 24 97 47 1,402 25 10 61936 11.0 -7 145 75 1,856 32 8 61937 11.1 1 242 163 85 2,163 37 25 181938 12.1 9 623 190 88 2,170 37 41 321939 12.9 7 972 150 72 2,112 35 - -1940 12.9 0 1,257 178 84 2,147 35 69 551941 13.4 4 1,284 177 83 1,899 31 72 56

1942 14.3 7 1,506 176 80 890 14 101 771943 15.7 9 1,674 196 89 813 13 122 941944 18.2 16 3,764 168 68 1,420 22 128 961945 21.6 19 5,229 153 66 1,332 20 54 391946 28.7 33 5,863 193 81 1,376 21 55 411947 37.2 30 7,049 192 75 1,806 26 87 591948 51.7 39 7,338 217 80 1,898 27 160 1161949 57.0 10 8.785 225 78 1,902 26 82 611950 62.4 9 9,591 214 73 1,861 25 88 801951 67.6 8 9,492 233 77 1,880 25 77 561952 82.5 22 10,136 228 73 1,810 23 68 551953 87.0 6 10,126 237 76 1,728 21 90 661954 90.1 4 8 223 69 1,850 83 59
aMillions of rupees. Expenditure is in fact for year ending 30 September of year shown. Figures exclude cost of new buildings as well as improvement and maintenance of old buildings.
bThousands of rupees. This expenditure is from education budget, not health budget. Probably for years ending 30 September rather than calendar years.
cFigures for 1932 and 1933 officially reported to be too low since primary vaccinations carried out as part of vaccination campaign then in response to smallpox outbreak omitted. 1941 figures may besimilarly affected.
dThese are largely what were terms ‘first’ but include subsequent treatments; hence treatments may exceed individuals treated in year.
eThe figures for 1938 relate to inoculations carried out in schools only; no all-Sri Lanka figures were provided for that year. In the case of 1937 (first and second doses) and 1936 (second doses),disquietingly, though the figures are supposed to be for all-Sri Lanka, slightly higher numbers of inoculations were actually reported as occurring in schools alone.

16 C.M. Langford
Health Transition Review
the smallpox vaccination program, the anti-hookworm campaign and the activities of theSchool Medical Service all seem to have been curtailed in 1935. This was unquestionably duein part to the direct impact of the malaria epidemic itself, since many health workers werediverted from their usual tasks to help cope with the epidemic, and many others would nodoubt have themselves suffered from malaria at that time, but it may well also have reflectedcontinuing financial stringency.
Table 3Number of government health centres providing maternity and child welfare services in SriLanka, clinics held there, and attendance at clinics by mothers and children, and number ofmedical examinations in schools carried out by School Medical Service, 1930-1954
Visits to clinicsa by
YearNumber of
health centresClinics
heldExpectantmothers(1000s)
Infants(1000s)
Pre-schoolchildren(1000s)
School childrenmedically
examined (1000s)
1930 40 1,547 1 14 7 811931 59 2,089 3 18 17 741932 54 2,493 3 21 12 641933 73 3,199 5 30 16 611934 78 3,952 8 28 18 451935 86 4,702 10 28 17 361936 77 4,543 17 30 19 531937 207 8,395 40 88 40 851938 311 9,485 76 158 75 951939 408 16,354 101 224 98 691940 - - 119 246 96 771941 - - 155 259 88 721942 437 18,695 - - - 641943 444 15,655 - - - 781944 461 18,122 - - - 611945 503 17,227 - - - 551946 533 19,144 - - - 621947 572 16,591 324 173 67 901948 602 20,488 277 237 73 1071949 662 23,971 296 330 97 1021950 701 24,890 313 382 109 841951 714 25,509 413 361 168 871952 771 27,143 412 385 122 981953 755 26,151 333 370 105 1281954 744 24,556 307 330 107 129
aThe figure for visits to clinics by pre-school children in 1935 is that reported for the whole island;however, disquietingly, about 3,000 more such visits, almost 20,000, were separately reported for‘health unit areas’ alone. The 1947 figures are those that appear in the 1947 Report of the Director ofMedical and Sanitary Service of Ceylon; the 1948 report, without explanation, presents different figuresfor 1947: 289 instead of 324; 199 instead of 173; and 76 instead of 67.
In the years following the 1934-1935 malaria outbreak there was a general upsurge inpublic health activities in Sri Lanka (see Tables 2 and 3). Government spending on health in1936, though somewhat lower than in the epidemic year 1935, was considerably higher thanin the pre-epidemic period; moreover, this level of expenditure was maintained in 1937 andthere were further increases in 1938 and 1939. The coverage of the smallpox vaccination

Decline in mortality in Sri Lanka after World War II 17
Health Transition Review
program improved during this period as did that of the anti-hookworm campaign. From 1937onwards there was a noticeable increase in the numbers of anti-typhoid inoculationsadministered. So far as maternity and child welfare services were concerned, while there hadbeen a steady increase in both provision and use of services between 1930 and 1936, in 1937there was a considerable increase in activity, no doubt associated with the Malaria Controland Health Scheme, already referred to, which came into operation in late 1936. In 1937there was a dramatic increase in the number of health centres at which maternity and childwelfare services were provided, from 77 such centres in 1936 to 207 in 1937, and aconsiderable increase also in the number of clinics held at these centres; moreover, thenumbers of visits to these clinics by expectant mothers more than doubled between 1936 and1937, as did the number of visits by infants and by pre-school children. The extent of use ofthese facilities continued to grow quite strongly until at least 1941, after which there isunfortunately a gap in the data of some years. Beginning in 1937 (in fact, late 1936) thegovernment made funds available to enable midday meals to be provided for children inschools.6 According to the Director of Education for Ceylon in his report for 1937 this was toinclude (from February 1937) ‘all the children in schools in distressed areas’ (Ceylon 1938:Part 4, A10). This expenditure on midday meals for school children grew rapidly in the late1930s and early 1940s.
During the early years of the Second World War public health activities in Sri Lankawere in most respects maintained or even extended; even later on, many activities continuedat reasonable levels (see Tables 2 and 3). However, the coverage of the anti-hookwormcampaign was drastically curtailed in 1942 and 1943 because of the lack of necessarysupplies. The anti-malaria program was probably also constrained by shortage of supplies, atleast before 1944. To some extent, moreover, the health of the population would undoubtedlyhave been undermined by the food shortages that developed following the Japanese invasion,in December 1941, of Burma, which had previously been an important source of rice importsfor Sri Lanka. Unfortunately, there is no information on the very important matter of theextent of use of maternity and child welfare services during the period from 1942 to 1946.
At the end of and immediately after the Second World War, as regards most of thespecific public health measures for which information is provided in Tables 2 and 3, therewas apparently little or no sign of increased activity. The coverage of the smallpoxvaccination program and of the anti-hookworm campaign, as well as the extent of inoculationagainst typhoid, were well below their earlier peak levels. In one very important respectwhere maternity and child welfare services are concerned there were signs of greater activity:the number of visits to clinics at health centres by expectant mothers in 1947 wassubstantially higher than in 1941, unfortunately the last year before 1947 for which thisinformation is available, but having the highest recorded figure for any year up to that time.The numbers of visits to clinics by infants and by pre-school children, though, were stillapparently somewhat lower in 1947 than their peak recorded levels early in the SecondWorld War, and it was not until two or three years after 1947 that these earlier peak levelswere surpassed.
It seems extremely likely, nevertheless, that there was an upsurge in public healthactivities in Sri Lanka towards the end of the Second World War and afterwards. The specificactivities referred to in Tables 2 and 3 are only part of the picture; no data have beenpresented on the provision of inpatient and outpatient facilities at hospitals or dispensaries,
6 Even before this time there were some local schemes for the provision of midday meals in schools,funded by municipalities or individuals; and post-1936 there was some local supplementation ofgovernment expenditure on school meals, as well as encouragement of school gardens to provideadditional supplies.
18 C.M. Langford
Health Transition Review
for example, or the availability of trained public health nurses and midwives, or theinvolvement of these in visiting people in their homes, all areas where there mightconceivably have been improvements in this period. Some data relating to these matters areavailable but problems of coverage and discontinuities of definition, as well as gaps in thematerial, make them difficult to interpret. The figures relating to government expenditure onhealth presented in Table 2 certainly do suggest very strongly that there were improvementsin health provision towards the end of the Second World War and afterwards: it may be seenthat spending grew especially rapidly in the period from 1944 (in fact, late 1943) until 1948.This does not seem to have been merely a reflection of increased expenditure on malariaeradication during this period: stripping out the costs of the anti-malaria campaign from totalgovernment spending on health affects the figures on annual percentage growth inexpenditure only slightly.7 It may also be seen from Table 2 that government spending onmidday meals for children in schools, which had increased in successive years from theoutset, then more than doubled between 1943 and 1944, and continued to grow quite stronglyafter that.
The effect of DDT-spraying on mortality in Sri LankaThe Newman-Gray-Molineaux approach to the assessment of the effect of DDT-spraying onmortality in Sri Lanka is unsatisfactory for a number of reasons. This approach overlooks thefact that, as has been pointed out, over and above the general longer-run downward trend inmortality after about 1920 in Sri Lanka, there was also a fairly dramatic, albeit rather short-lived, fall in mortality in the early 1940s. This fall followed an upsurge in public healthactivities in Sri Lanka which came about as a result of the introduction of the Malaria Controland Health Scheme: this both attests to the likely genuineness of the fall and draws attentionto the possible impact on mortality of such public health measures; moreover the fact that thefall occurred in every part of Sri Lanka, except perhaps sub-zone I of the wet zone, thehealthiest part, strongly suggests that these measures could be effective even in the face ofendemic malaria. Comparing a longish pre-DDT period of time with the post-DDT situation,which was the Newman-Gray-Molineaux approach—and Coale and Hoover's, for thatmatter—thus has the effect of concealing an important change in the pre-DDT period whichis relevant to the interpretation of the post-DDT changes in mortality.
Another shortcoming of the Newman-Gray-Molineaux analysis is its reliance on thespleen rate as an indicator of the level of malaria in an area. A high spleen rate in an area willundoubtedly be a reflection of a high malaria prevalence in that area, but the latter willdepend not only on the risk of malaria infection but also on the likelihood of an attack beingserious and prolonged; this in turn will depend partly on the nutritional status and generalstate of health of the population, so that, in the words of Carter, ‘The social status andeconomic conditions of ... communities ... also influence the rates’; Carter went on to observethat ‘Malnutrition ... exerts an important effect in many parts of Ceylon upon ... themaintenance of high spleen rates’ (Carter 1927:14). A corollary is that in some degreeimprovements in nutrition and general state of health would be expected to reduce spleenrates, and malaria morbidity, and malaria mortality, even if exposure to the risk of malariaremained unchanged.
7 Visvalingam (1961:82) provides figures on the ‘expenditure on anti-malaria campaign’ from 1934onwards. No source is given but he was Superintendent of the Anti-Malaria Campaign at the time hewas writing. Removing these amounts from the total expenditures on health shown in Table 2 results inannual percentage changes in the remainder which are essentially the same as the percentage changes intotal expenditure shown in Table 2.

Decline in mortality in Sri Lanka after World War II 19
Health Transition Review
A further weakness of the Newman-Gray-Molineaux approach is that, expressly orimplicitly, it assumes that attempts at malaria control before DDT-spraying were ineffective.Gray simply states (1974:210): ‘Before 1945 malaria control was limited to ineffectuallarvacidal [sic] methods’. This judgement may well be incorrect. Particularly after theintroduction of the Malaria Control and Health Scheme in late 1936, armed with the detailedknowledge of the habits and significance for malaria of A. culicifacies provided by Carter, anelaborate system of monitoring potential danger areas and of responding where necessarywith larvicidal, and increasingly insecticidal, spraying was established; this was in addition toall the usual activities designed to avoid the formation of bodies of stagnant water, large andsmall. Those involved certainly did believe that these measures made a difference and in theview of Rajendram and Jayewickreme (1951:21), referring to the malaria outbreaks of 1939-1940, 1943 and 1945-1946, there was ‘little doubt that if it were not for the control measuresadopted in these years these epidemics might have assumed much larger proportions’.According to Visvalingam (1961:64) ‘There is little doubt that the control measures adoptedunder the new scheme had reduced the problem of malaria and the severity of epidemicsduring these years’. If pre-DDT control measures did indeed have some effect, which seemsvery likely, this needs to be borne in mind in thinking about any possible impact that DDTmight have had: first, in some degree DDT was merely supplanting earlier measures, so ifthese were effective then any impact of DDT would have been in some degree a replacementeffect; secondly, had DDT not been available, there would undoubtedly have been a greatupsurge in antimalarial activity of the pre-DDT type after the Second World War, which ifsuch measures were indeed effective would itself have reduced mortality in some degree inany case.
Given this complexity, can any assessment be made of the impact of DDT-spraying onmortality in Sri Lanka? Consider first only the fall in mortality in the year 1947. It seemsreasonable to suppose that, even in the absence of DDT-spraying, the crude death rate in SriLanka in 1947 would have fallen back at least to its previous minimum level, reached in1942. The year 1947 was a favoured year in a number of respects: climatic conditions werenot conducive to epidemic malaria8 and there was a falling-back of mortality following thefairly serious malaria outbreak of 1945-1946, which may well also have ‘brought forward’some deaths; in addition, by 1947 food and other wartime shortages had ended and, as notedpreviously, public health expenditure had noticeably increased. By contrast, the earlier low-point in the crude death rate in 1942 had been achieved despite wartime difficulties.
As may be seen from Table 4 the Sri Lankan crude death rate in 1947 was 14.4 per 1000population whereas the previous minimum figure, reached in 1942, was 17.9. Thus, assumingthat given the conditions in Sri Lanka in 1947 the crude death rate would have fallen at leastto the 1942 level, even without DDT-spraying, the maximum possible reduction in the 1947crude death rate attributable to DDT-spraying is 20 per cent. However, there was no sprayingat all in sub-zone I of the wet zone at any stage; moreover, although spraying was carried outin parts of sub-zones II and III of the wet zone, this would have had little or no impact in1947 since this was not a year with epidemic conditions. Taking account of the reduction in
8 Rajendram and Jayewickreme (1951) might be thought to have suggested otherwise by stating that(p.46) ‘in 1947 both south-west and north-east monsoons were failures’. However, elsewhere in thesame article (p.31) they confined themselves to the expression ‘partial failure’ in relation to the south-west monsoon in 1947 by which they clearly meant that rainfall was considerably below average (theirfigures referred to the epidemic zone) in April and May (p.57). Since rainfall was well above averagein January and in March of 1947 and reasonable, or in the case of August extremely heavy, from June toOctober, there would have been no real reason to expect epidemic malaria in 1947. Nor did Rajendramand Jayewickreme suggest that there were epidemic conditions in 1947; their argument was that thefailure of the north-east monsoon in 1947 would have led to epidemic conditions in 1948.

20 C.M. Langford
Health Transition Review
mortality that occurred anyway in sub-zone I of the wet zone, which could not have been due

Table 4The minimum crude death rate (CDR) during the period 1936-1944, the crude death rate in each year 1942-1947, and the average crude death rate over the periods 1948-1951 and 1947-1951, for Sri Lanka and the sub-zones of the wet and the dry zone of Sri Lankaa
Year(s)
Zone and sub-zoneb Min CDR CDR Average CDR
1936-1944c 1 94 2
1943 1944 1945 1946 1947 1948-1951 1947-1951
Wet zoneI 16.5 16.7 16.9 17.7 17.7 16.2 13.6 12.8 13.0II 15.7 15.7 17.8 19.4 19.7 18.1 13.7 13.6 13.6III 15.2 15.2 17.6 18.4 20.2 18.1 13.2 13.1 13.1
Dry ZoneJaffna 20.6 20.8 24.5 21.5 22.2 17.1 15.5 12.7 13.3Rest 22.5 22.5 27.1 25.7 27.4 27.7 16.2 12.4 13.1
Sri Lanka 17.9 17.9 20.6 20.8 21.8 20.4 14.4 13.0 13.3
aSee appendix for complete data.
bSee Table 1 for the districts comprising the different sub-zones.
cThis is also the lowest rate recorded up to that time (since 1900) except in sub-zone I of the wet zone where the CDR in 1932 was 16.4.

22 C.M. Langford
Health Transition Review
to DDT-spraying, the maximum possible reduction in the all-island 1947 crude death rateattributable to DDT-spraying falls to 18 per cent; assuming further that no part of the wetzone was affected by DDT in 1947 this figure falls to only 13 per cent. Moreover, even thislow figure is very likely to be an overestimate since it assumes that all of the reduction inmortality occurring in the dry zone between 1942 and 1947 is attributable to DDT-spraying,which is clearly highly improbable.
All in all, then, it seems very unlikely that the striking fall in mortality in Sri Lanka in1947 itself had very much to do with DDT-spraying. However, what of the periodimmediately following 1947? So far as the wet zone is concerned, it may be seen from Table4 that mortality fell only a little further in the next four years, so on the face of it hardlyrequiring a radical explanation. However, this is to presume that the absence of conditionsconducive to epidemic malaria characteristic of 1947 continued, whereas, at least accordingto Rajendram and Jayewickreme (1951:12, 22, 47, 49), both 1948 and 1950 were years inwhich epidemics would very probably have occurred historically, given the climaticconditions. This being so, it could obviously be argued that DDT-spraying had preventedthese epidemics and hence the mortality they would have caused. However, making ajudgement on this would require not only an assessment of the likelihood of a malariaepidemic in these years in the absence of any control measures but an assessment of thatlikelihood given only pre-DDT control measures, though possibly on a considerable scale;moreover, a judgement would also be required on the possible extent to which mortality inany epidemic which did occur might have been reduced, perhaps considerably, by theimprovements in nutrition and in the availability of health services which very probablyoccurred in this period. So far as the dry zone is concerned, it may be seen from Table 4 thatin the few years immediately following 1947 mortality fell distinctly further, below 1947levels. Thus two questions arise in connection with the dry zone: first, what part did DDTplay in reducing mortality to these new low levels? Secondly, rather as in the case of the wetzone, what part did DDT play in preventing any periodic malaria outbreaks, and consequentmortality, that would otherwise have occurred?
Suppose that, as argued previously, DDT-spraying did not affect mortality at all in thewet zone in 1947; and suppose further that one-half of the reduction in the crude death rate inthe sub-zones of the dry zone between 1942 and 1947 was attributable to DDT-spraying,which seems unlikely to be an underestimate; then the crude death rate for Sri Lanka in 1947,in the absence of DDT-spraying, would have been 15.4 per 1000 population, rather than theobserved rate of 14.4 per 1000. If, without DDT-spraying, the average crude death rate for SriLanka over the four years following 1947 would have exceeded 15.4 by the same proportionas the average crude death rate over 1943 to 1946 exceeded that for 1942, the average crudedeath rate for Sri Lanka over the period 1948 to 1951 would have been 18 per 1000, meaningthat the average observed crude death rate for the five-year period 1947-1951 was 24 per centbelow the average expected rate in the absence of DDT-spraying. However, this is likely tobe a considerable overestimate of the impact of DDT-spraying in this period: as alreadysuggested, there is every reason to believe that in the absence of DDT, pre-DDT antimalarialmeasures would have been deployed on a massive scale as epidemic conditions developed;moreover, for the very many reasons already given, mortality would almost certainly havebeen very much lower in any malaria outbreak that had occurred than during the wartimeperiod. If the potential proportional rise in mortality in Sri Lanka during the period 1948-1951, over 1947, were judged to be half that which occurred during 1943-1946, over 1942,then the average observed crude death rate for 1947-1951 would have been 19 per cent belowthe average expected rate; if the potential rise were judged to be a quarter of the 1943-1946rise, this would fall to 16 per cent. Even these figures will tend to be overestimates in thatthey overlook the fact that there were further noticeable improvements in mortality after 1947

Decline in mortality in Sri Lanka after World War II 23
Health Transition Review
in the dry zone, some part of which would undoubtedly have occurred, assuming favourableclimatic conditions, even in the absence of DDT-spraying; meaning that, effectively, thebaseline crude death rate of 15.4 per 1000 used in the calculations and hence also theestimates of the potential mortality in outbreaks of malaria are somewhat too high.
Conclusion
It is clearly no easy task to estimate the impact of DDT-spraying on mortality in Sri Lankaafter the Second World War. The problem is not so much with the apparently dramatic fall inmortality in the year 1947 itself: it is very unlikely that DDT-spraying played much part inthis. The problem is to assess its impact in the years that followed. This requires a wholerange of judgements in relation to events which did not occur: the likelihood of a malariaoutbreak given certain meteorological circumstances; the extent to which the probablemortality associated with such an outbreak would have been moderated by improvements innutrition or health services; the extent and impact of the antimalarial measures that wouldhave been adopted had DDT not been available; and so on. The results of illustrativecalculations, on various assumptions, have been presented above; for what it is worth Ipersonally suspect that the effect of DDT-spraying on the 1947-1951 crude death rate maywell have been at or below the lowest assessment provided, that is, a reduction of 16 per cent;however, the hard truth is, regrettably, that there does not seem to be an adequate empiricalbasis for arriving at a reliable conclusion.
A number of comments should be added, finally, about analyses that were attemptedwithout success or could not be attempted because of lack of data. Despite considerableeffort, it has proved possible neither to verify nor refute Meegama's assertion that formerlymalarial districts enjoyed a disproportionate improvement in health services after the war; itwas concluded that there were simply too few data available on a district basis to permit this.Another potential area of analysis to which a great deal of attention has been given withoutsuccess is causes of death. Although a large quantity of material on causes of death isavailable for Sri Lanka, it was concluded, very reluctantly, that it is not of sufficient qualityto be helpful in this case; the main problem is the very large ‘pyrexia’ category (meaning,simply, fever); it was felt that whilst this might well often conceal largely malaria therelationship between malaria and ‘pyrexia’ could not be taken as fixed, indeed probably wasnot, over time and space. An area, lastly, where analysis which might have been importanthas not proved possible because of the complete absence of data, is that concerned with thetiming of DDT-spraying in different parts of Sri Lanka. If information had been available,which does not seem to be the case, on the dates at which spraying began in different areas ofthe country, it might well have been possible to examine the relationship of this timing tochanges in mortality, and so throw light on the question of a possible connection betweenDDT-spraying and mortality decline.
References
Abhayaratne, O.E.R. 1950. The influence of malaria on infant mortality in Ceylon. Ceylon Journal ofMedical Science 7,2:33-54.
Bradley, D.J. 1993. Malaria: old infections, changing epidemiology. Pp. 137-153 in HistoricalEpidemiology and the Health Transition, ed. J. Landers. Supplement to Health Transition Review2. Canberra: Australian National University.
Briercliffe, R. 1935. The Ceylon Malaria Epidemic, 1934-35. 1935 Sessional Paper 22. Colombo:Ceylon Government Press.
Carter, H.F. 1927. Report on Malaria and Anopheline Mosquitoes in Ceylon. 1927 Sessional Paper 7.Colombo: Government Printer.

24 C.M. Langford
Health Transition Review
Ceylon. 1938. Administration Reports, 1937. Colombo: Ceylon Government Press.
Coale, A.J. and E.M. Hoover. 1958. Population Growth and Economic Development in Low-IncomeCountries. Princeton: Princeton University Press.
Cullumbine, H. 1950. An analysis of the vital statistics of Ceylon. Ceylon Journal of Medical Science 7:91-272.
Frederiksen, H. 1960. Malaria control and population pressure in Ceylon. Public Health Reports75,10:865-868.
Frederiksen, H. 1961. Determinants and consequences of mortality trends in Ceylon. Public HealthReports 76,8:659-663.
Frederiksen, H. 1962. Economic and demographic consequences of malaria control in Ceylon. IndianJournal of Malariology 16,4:379-391.
Frederiksen, H. 1966. Malaria eradication and population growth (review article). American Journal ofTropical Medicine and Hygiene 15,2:262-264.
Frederiksen, H. 1970. Malaria eradication and its effect on mortality decline: a note. Population Studies24,1:111-113.
Gill, C.A. 1935. Report on the Malaria Epidemic in Ceylon in 1934-35. 1935 Sessional Paper 23.Colombo: Ceylon Government Press.
Gill, C.A. 1940. The influence of malaria on natality with special reference to Ceylon. Journal of theMalaria Institute of India 3:201-252.
Gray, R.H. 1974. The decline of mortality in Ceylon and the demographic effects of malaria control.Population Studies 28,2:205-229.
Langford, C.M. and P. Storey. 1993a. Influenza in Sri Lanka, 1918-1919: the impact of a new disease ina pre-modern Third World setting. Pp. 97-123 in Historical Epidemiology and the HealthTransition, ed. J. Landers. Supplement to Health Transition Review 2. Canberra: AustralianNational University.
Langford, C. and P. Storey. 1993b. Sex differentials in mortality early in the twentieth century: SriLanka and India compared. Population and Development Review 19,2:263-282.
Meade, T.W. 1968. Medicine and population. Public Health 82,3:100-110.
Meegama, S.A. 1967. Malaria eradication and its effect on mortality levels. Population Studies21,3:207-237.
Molineaux, L. 1985. La lutte contre les maladies parasitaires: le probl•me du paludisme, notamment enAfrique. Pp.11-40 in La Lutte contre la Mort, ed. J. Vallin and A. Lopez. Travaux et Documentsno.108. Paris: Presses Universitaires de France.
Newman, P. 1965. Malaria Eradication and Population Growth. Ann Arbor: School of Public Health,University of Michigan.
Newman, P. 1970. Malaria control and population growth. Journal of Development Studies 6,2:133-158.
Newman, P. 1977. Malaria and mortality. Journal of the American Statistical Association 72,358:257-263.
Newman, P. and S.A. Meegama. 1969. Malaria eradication and its effect on mortality decline: adiscussion. Population Studies 23,2:285-306.
Rajendram, S. and S.H. Jayewickreme. 1951. Malaria in Ceylon, part I. Indian Journal of Malariology5,1:1-73.
Sarkar, N.K. 1957. The Demography of Ceylon. Colombo: Ceylon Government Press.
United Nations. 1976. Population of Sri Lanka. Bangkok: Economic and Social Commission for Asiaand the Pacific.
Visvalingam, T. 1961. A review of the problem and control of malaria in Ceylon. Journal of the CeylonPublic Health Association 2 (New Series):43-99.

Decline in mortality in Sri Lanka after World War II 25
Health Transition Review