realizing the potential of migrant “earn, learn, and … the potential of migrant “earn, learn,...
TRANSCRIPT
Realizing the Potential of Migrant “Earn, Learn, and Return” Strategies: Does Policy Matter?
By Elizabeth Grieco, PhD and Kimberly A. Hamilton, PhD Migration Policy Institute
1400 16th Street, NW Suite 300 Washington, DC 20036
202-266-1940
Prepared for the Center for Global Development’s 2004 Commitment to Development Index.
February 20, 2004
The Migration Policy Institute is an independent, nonpartisan, nonprofit think tank dedicated to thestudy of the movement of people worldwide. The Institute provides knowledge-based analysis, development, and evaluation of migration and refugee policies at the local, national, and international levels. Additional information on migration and development can be found on the Migration Information Source, MPI’s web-based resource for current and accurate migration and refugee data and analysis at www.migrationinformation.org.1
Introduction1 There are high hopes these days that international migrants are hard at work paving golden roads between rich and poor countries, and why not? The development potential of international migration is extraordinary. In 2002, remittances are estimated to have totaled $80 billion, providing a critical lifeline for poor families and countries alike. Remittances remain an important source of foreign exchange and provide steady income in unpredictable times. For some countries, they far outstrip other kinds of foreign aid. While remittances are the most visible, efficient, and tangible link between migrants and economic and social development in their regions of origin, there are other forms of development assistance that flow from rich to poor countries. Formal associations of immigrants have sprung up around the world to bundle and channel remittances toward productive ends in home countries. Such demonstrations of civic participation, risk management, and transparent decision-making are key dimensions of good governance. Beyond this, the transfer of skills, education, and training as migrants move back and forth between economies and societies has the possibility to make real changes in the lives of unskilled foreign workers who are increasingly critical to rich country economies. Many believe that what we call “earn, learn, and return” strategies can reinvigorate a flagging commitment to poor country development.2 At the same time, there is concern that remittances may deepen inequalities in sending communities or be used for non-peaceful ends in many conflict-ridden countries. Migration may also rob communities and countries of their most important talent and radically alter household dynamics and parenting strategies. For a long time, the complex sets of relationships that migrants maintain between their homes by birth and their home by choice and necessity have been under intense scrutiny. Analysts over the decades have done a yeoman’s job of attempting to track remittances, understanding the 1 The authors would like to thank the following people for their comments, assistance and advice in obtaining and explaining the data included in this report: Demetri Papademetriou, Kathleen Newland, and Kevin O’Neil, MPI; Rainer Muenz; B. Lindsay Lowell, Georgetown University; David Roodman and Lant Pritchett, CGD; Dilip Ratha, World Bank; Lars Ostby and Benedicte Lie, Statistics Norway; Albert Kraler, ICPMD Austria; Anita Lange, Statistics Denmark; Ana Franco and Jose Macek, EUROSTAT; Jennifer Cavounidi, PAEP Greece; Patrick Collier, Home Office, United Kingdom; Constanza Giovannelli, ISTAT, Italy; Emma Quinn, Government of Ireland; Enrico Bisogno, UNECE; Anna Eriksson and Ake Nilsson, Statistics Sweden; Georges LeMaitre, OECD; Heaven Crawley, Institute for Public Policy and Research, United Kingdom; Marie Hesselberg, Government of Norway; Pirjo Hrvonen, Anna Karjalainen, and Kirsti Kaasinen, Government of Finland; Graeme Hugo and Janet Wall, University of Adelaide, Australia; Juan Jose Buitrago, Government of Spain; Joaquin Arango, University of Madrid; Jonathan Chaloff, Government of Italy; Kelly Tran, Statistics Canada; Martin Baldwin Edwards, Mediterranean Migration Observatory, Greece; Marco Martinello, University of Liege, Belgium; Alain Schmitz, Serge Wauthier, and Benedikt Vulsteka, Government of Belgium; Maria Ioannis Baganha, University of Coimbra, Portugal; Marilyn Little and Stephan Dunstan, New Zealand Immigration Service; Marion Weichelt, Government of Switzerland; Martin Ruhs, Oxford University; Matsuoka Satoko, Government of Japan; Mette Brix-Riisager, Government of Denmark; Houria Ouali, Universite Libre de Bruxelles, Belgium; Patrick Simon, INED, France; Patrick Weil, University of Paris; Philip Muus, Malmo University, Sweden; Richard Bedford, University of Waikato, New Zealand; Devid Reisenzein, IOM, Austria; Nancy Rytina, Government of the United States; Mary Shanes, CIC Canada,; Daiju Takahashi, Government of Japan; Veyzel Oezcan, University of Berlin; Louisa Visser and Andre Westerink,, Government of the Netherlands; William Sheppit, Government of Canada; Yasuchi Iguchi, Kwansei Gakuin University, Japan; and Adamadia Klotsa, Embassy of Greece. 2 For an overview of the issues, see, for example, Newland (2004), Hamilton (2003), and Kapur and McHale (2003), Adelman (2003), and Ratha (2003).
2
sociology of transnational communities, describing the flow of money through formal and informal channels, and understanding the role of banking access, dual citizenship, and corruption in the migration and development process.3 Much less understood and explored, however, are the policy options for rich and poor countries that could leverage these relationships to multiply the returns on migrants’ investments. The role of governments in transferring resources and skills has remained inside the proverbial black box. For rich countries, the policy challenges are politically charged and sometimes indirect. The public reaction to US President George W. Bush’s recent announcement, for example, to embark upon a new temporary worker program through which nine or more million unauthorized immigrants in the US could legalize their status, highlights the polarity in the public debate at the moment. The President’s proposal would have migrants return home after a defined period of time and would allow migrants to circulate across borders during the interim. Critics argue that any such policy should include pathways to permanent residency. How would either approach affect remitting or banking behavior? As in many industrialized countries, the undocumented population in the United States is sizeable and growing. How would a program to legalize undocumented workers affect their earning potential or that of future inflows of undocumented migrants? From an economic development perspective, what will this mean for countries such as Mexico and the Philippines? These are the kinds of fault lines that crisscross the current migration and development discussion and go to the heart of policy coherence. Can the governments of rich countries promote critically needed, development-friendly migration policies and, at the same time, maintain their domestic legitimacy for the next round of elections? And, just what would these policies be?4 While there is an enormous policy terrain still to be explored, it is possible to sketch out the impact that current immigration policies of rich countries may have on poor countries’ development. This paper builds on the first year of the Center for Global Development’s Commitment to Development Index and provides additional insight into how 21 prosperous DAC countries are stacking up against one another on the migration component. There is one important caveat: international migration data are still in their infancy and continue to thwart efforts to look beyond individual country experiences toward comparative analysis. There are differing conventions on fundamental definitions and concepts. Many countries, even rich ones, have not invested in the kinds of technological infrastructure and cross-government information sharing needed to track immigration data with confidence. Beyond this, migrants 3 Unfortunately, data on the amount of remittances sent from individual DAC countries to non-DAC countries is not available. Remittance data collected and published by international agencies such as the IMF and World Bank only include the amount received by each country. They do not include the amount of remittances sent by each country or that amount divided among the individual remittance-receiving countries. 4 There is another twist to the migration and development debate that the authors raised in last year’s Commitment to Development Index background paper. Specifically, “…policies by rich countries that have a negative impact on poor country development may have a positive effect on the livelihoods of individual migrants and their families….This raises basic questions about what we mean by development and where and to whom that development accrues over time” (Hamilton and Grieco 2002:1). See also Black (2003).
3
themselves, with their complex reasons for moving, the intricate channels through which they move, and their changes in legal status across their lives make even simple accounting exercises fraught with uncertainty. Temporary and permanent, trafficked or undocumented, reunified with families or highly skilled, immigrant characteristics confound efforts to measure flows well. The technical notes at the end of this paper explore these challenges in detail. Purpose of paper In this paper, we present and briefly discuss six measures that, together, can begin to capture the impact of rich country immigration policy on poor country development. Given the deficiencies of the migration data in general, these six variables attempt to measure – in a broad and often indirect way – four components of migration policy that have an impact on poor-country development. These include:
1. Access by immigrants from developing countries to developed countries; 2. Labor market performance by immigrants compared to natives; 3. Educational and training opportunities in rich countries; and 4. “Burden-sharing” through humanitarian admissions.
These measures are suggested for two pragmatic reasons. First, they are based on data that are publicly available, generally updated annually, and conceptually comparable (at least reasonably so) across countries. Second, and more importantly, they provide governments with baseline measures to track improvements, both in comparison with other countries and within their own countries across time. The spirit of the Commitment to Development Index is not simply to criticize the policies of DAC countries but to encourage them to do better. One of the “built-in” weaknesses, however, of the migration component is that it is extremely difficult for smaller DAC to compete with larger traditional countries of immigration. For example, it is unlikely that from one year to the next Finland will suddenly score higher on the migration component than Canada or the United States, regardless of profound changes in Finland’s migration policy. This is not to say that Finland’s performance can’t improve dramatically from one year to the next, but this improvement may or may not be evident when compared with other countries. This is why we also emphasize the importance of measures that can be used both internally and internationally to mark improvements. The Migration Component of the Commitment to Development Index Considering the problems associated with the international migration data available in the 21 DAC countries (see the technical notes at the end of this paper), finding measures to include in the migration component of the Commitment to Development Index that are theoretically anchored, measurable, and relatively statistically comparable is, to say the least, an imperfect exercise. These constraints place notable limits on what can and cannot be included in the Index. In addition to the measurement problems associated with poor data comparability, many of the DAC countries lack an explicit, well-defined, and published immigration policy, which makes it difficult to assess and compare those policies per se. Rather, policies – which are too often implicit – must be assessed indirectly through outcomes, such as the number of immigrants and
4
those numbers in relation to other important factors. This, unfortunately, adds yet another step between the measures included in the Index and the migration and development process we are attempting to quantify. Finally, this paper does not address unauthorized immigration. While clearly not a policy, per se, it is a result of the mismatch between market needs and legal immigration opportunities. (Some would argue, too, that tolerating illegal immigration is a de facto policy.) In some European countries, rolling regularization programs have become the norm. Programs in Italy, Spain, and Greece have legalized thousands of non-DAC immigrants, increasing their labor market protections and remitting power. There is some evidence, however, that over time, some of these regularized immigrants may lapse back into illegal status. Absent reliable estimates on the unauthorized population (and more specifically on the origin countries of the unauthorized population) for many of the DAC countries, it is not possible to address the enormous impact that unauthorized immigrants may play in development. In light of these constraints, we propose the inclusion of the following six measures that reflect, in different ways, government policy impact on the migration and development relationship. Component One: Access by immigrants from developing countries to developed countries A. Non-DAC Immigrants as a percentage of the total population At the most fundamental level, access to DAC countries provides non-DAC immigrants with jobs, income, and knowledge that become the source of remittances sent back home. Beyond this, access to the labor market allows immigrants to establish and participate in migrant networks, which can be used by immigrants to encourage continuous and expanding economic relations between sending and receiving countries. Just “being” in the country increases important cultural knowledge, including language acquisition, an important skill for employment. In the long run, returning migrants may contribute to the further development of their home countries by contributing the knowledge, training, and skills they gained through their participation in DAC economies. Ideally, labor market access by non-DAC immigrants would have been best measured by looking at the total immigrant inflow by visa or permit type, dividing all migrants into three broad categories: permanent, temporary, and humanitarian. These classifications could then be further refined to determine, for example, the number of “highly skilled” immigrants from non-DAC countries or the number of immigrants from developing countries on visas with limited access to the labor market. We contacted government representatives as well as independent researchers in the 21 DAC countries regarding data availability. For many countries, the data were not available, were only partially available, were available but not by country of origin, or excluded relevant sub-populations (e.g., EU nationals) from the total migrant population. Without comparable visa/permit data for all 21 DAC countries, it is difficult to directly measure the kinds of access non-DAC immigrants have to DAC labor markets. Instead, the number of
5
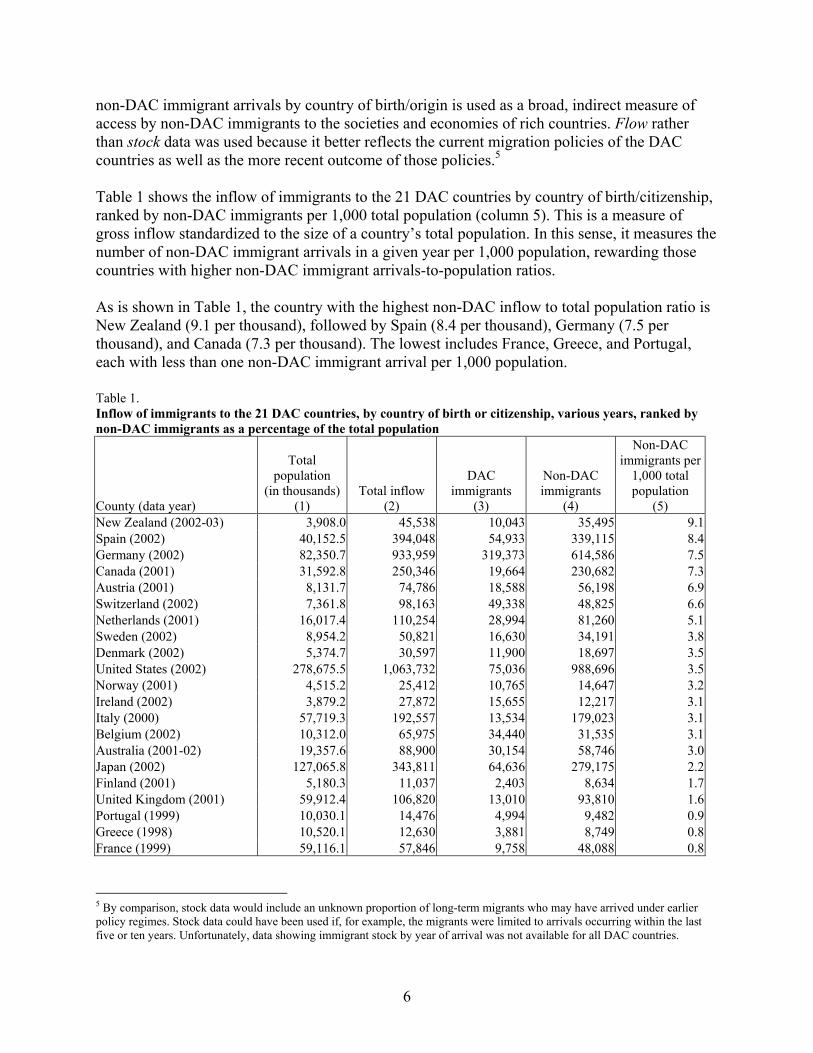
non-DAC immigrant arrivals by country of birth/origin is used as a broad, indirect measure of access by non-DAC immigrants to the societies and economies of rich countries. Flow rather than stock data was used because it better reflects the current migration policies of the DAC countries as well as the more recent outcome of those policies.5 Table 1 shows the inflow of immigrants to the 21 DAC countries by country of birth/citizenship, ranked by non-DAC immigrants per 1,000 total population (column 5). This is a measure of gross inflow standardized to the size of a country’s total population. In this sense, it measures the number of non-DAC immigrant arrivals in a given year per 1,000 population, rewarding those countries with higher non-DAC immigrant arrivals-to-population ratios. As is shown in Table 1, the country with the highest non-DAC inflow to total population ratio is New Zealand (9.1 per thousand), followed by Spain (8.4 per thousand), Germany (7.5 per thousand), and Canada (7.3 per thousand). The lowest includes France, Greece, and Portugal, each with less than one non-DAC immigrant arrival per 1,000 population. Table 1. Inflow of immigrants to the 21 DAC countries, by country of birth or citizenship, various years, ranked by non-DAC immigrants as a percentage of the total population
County (data year)
Total population
(in thousands) (1)
Total inflow (2)
DAC immigrants
(3)
Non-DAC immigrants
(4)
Non-DAC immigrants per
1,000 total population
(5) New Zealand (2002-03) 3,908.0 45,538 10,043 35,495 9.1Spain (2002) 40,152.5 394,048 54,933 339,115 8.4Germany (2002) 82,350.7 933,959 319,373 614,586 7.5Canada (2001) 31,592.8 250,346 19,664 230,682 7.3Austria (2001) 8,131.7 74,786 18,588 56,198 6.9Switzerland (2002) 7,361.8 98,163 49,338 48,825 6.6Netherlands (2001) 16,017.4 110,254 28,994 81,260 5.1Sweden (2002) 8,954.2 50,821 16,630 34,191 3.8Denmark (2002) 5,374.7 30,597 11,900 18,697 3.5United States (2002) 278,675.5 1,063,732 75,036 988,696 3.5Norway (2001) 4,515.2 25,412 10,765 14,647 3.2Ireland (2002) 3,879.2 27,872 15,655 12,217 3.1Italy (2000) 57,719.3 192,557 13,534 179,023 3.1Belgium (2002) 10,312.0 65,975 34,440 31,535 3.1Australia (2001-02) 19,357.6 88,900 30,154 58,746 3.0Japan (2002) 127,065.8 343,811 64,636 279,175 2.2Finland (2001) 5,180.3 11,037 2,403 8,634 1.7United Kingdom (2001) 59,912.4 106,820 13,010 93,810 1.6Portugal (1999) 10,030.1 14,476 4,994 9,482 0.9Greece (1998) 10,520.1 12,630 3,881 8,749 0.8France (1999) 59,116.1 57,846 9,758 48,088 0.8
5 By comparison, stock data would include an unknown proportion of long-term migrants who may have arrived under earlier policy regimes. Stock data could have been used if, for example, the migrants were limited to arrivals occurring within the last five or ten years. Unfortunately, data showing immigrant stock by year of arrival was not available for all DAC countries.
6
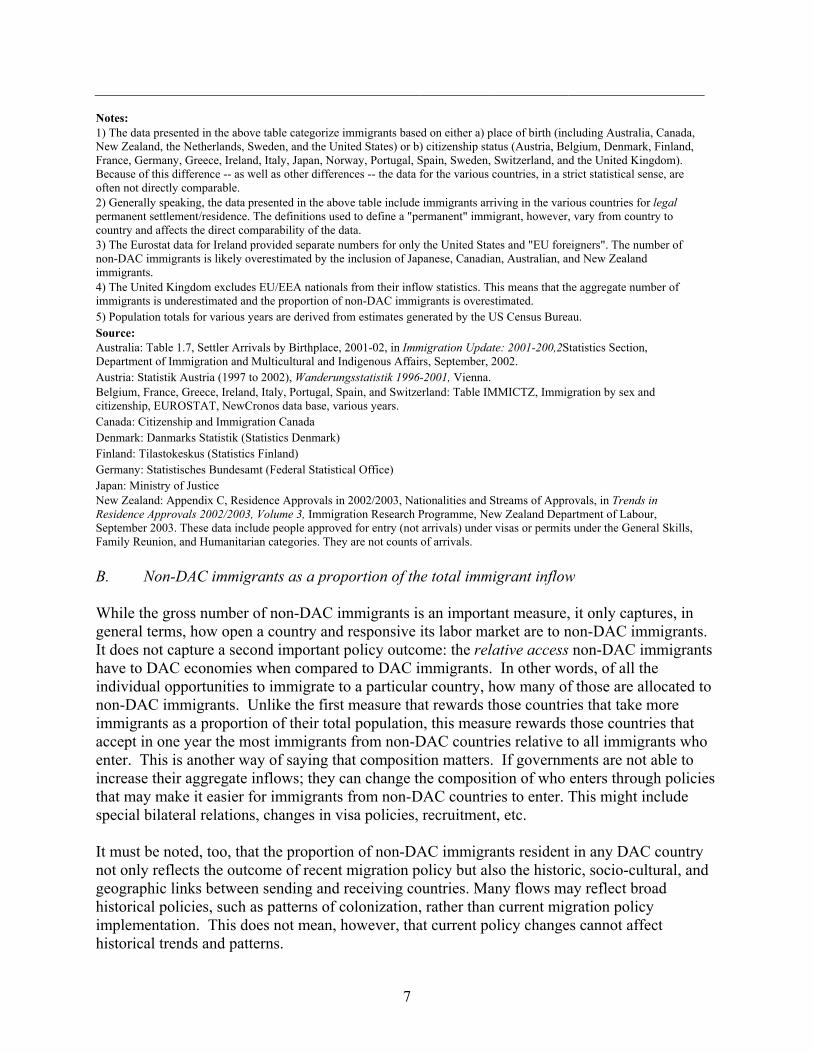
Notes: 1) The data presented in the above table categorize immigrants based on either a) place of birth (including Australia, Canada, New Zealand, the Netherlands, Sweden, and the United States) or b) citizenship status (Austria, Belgium, Denmark, Finland, France, Germany, Greece, Ireland, Italy, Japan, Norway, Portugal, Spain, Sweden, Switzerland, and the United Kingdom). Because of this difference -- as well as other differences -- the data for the various countries, in a strict statistical sense, are often not directly comparable. 2) Generally speaking, the data presented in the above table include immigrants arriving in the various countries for legal permanent settlement/residence. The definitions used to define a "permanent" immigrant, however, vary from country to country and affects the direct comparability of the data. 3) The Eurostat data for Ireland provided separate numbers for only the United States and "EU foreigners". The number of non-DAC immigrants is likely overestimated by the inclusion of Japanese, Canadian, Australian, and New Zealand immigrants. 4) The United Kingdom excludes EU/EEA nationals from their inflow statistics. This means that the aggregate number of immigrants is underestimated and the proportion of non-DAC immigrants is overestimated. 5) Population totals for various years are derived from estimates generated by the US Census Bureau. Source: Australia: Table 1.7, Settler Arrivals by Birthplace, 2001-02, in Immigration Update: 2001-200,2Statistics Section, Department of Immigration and Multicultural and Indigenous Affairs, September, 2002. Austria: Statistik Austria (1997 to 2002), Wanderungsstatistik 1996-2001, Vienna. Belgium, France, Greece, Ireland, Italy, Portugal, Spain, and Switzerland: Table IMMICTZ, Immigration by sex and citizenship, EUROSTAT, NewCronos data base, various years. Canada: Citizenship and Immigration Canada Denmark: Danmarks Statistik (Statistics Denmark) Finland: Tilastokeskus (Statistics Finland) Germany: Statistisches Bundesamt (Federal Statistical Office) Japan: Ministry of Justice New Zealand: Appendix C, Residence Approvals in 2002/2003, Nationalities and Streams of Approvals, in Trends in Residence Approvals 2002/2003, Volume 3, Immigration Research Programme, New Zealand Department of Labour, September 2003. These data include people approved for entry (not arrivals) under visas or permits under the General Skills, Family Reunion, and Humanitarian categories. They are not counts of arrivals. B. Non-DAC immigrants as a proportion of the total immigrant inflow While the gross number of non-DAC immigrants is an important measure, it only captures, in general terms, how open a country and responsive its labor market are to non-DAC immigrants. It does not capture a second important policy outcome: the relative access non-DAC immigrants have to DAC economies when compared to DAC immigrants. In other words, of all the individual opportunities to immigrate to a particular country, how many of those are allocated to non-DAC immigrants. Unlike the first measure that rewards those countries that take more immigrants as a proportion of their total population, this measure rewards those countries that accept in one year the most immigrants from non-DAC countries relative to all immigrants who enter. This is another way of saying that composition matters. If governments are not able to increase their aggregate inflows; they can change the composition of who enters through policies that may make it easier for immigrants from non-DAC countries to enter. This might include special bilateral relations, changes in visa policies, recruitment, etc. It must be noted, too, that the proportion of non-DAC immigrants resident in any DAC country not only reflects the outcome of recent migration policy but also the historic, socio-cultural, and geographic links between sending and receiving countries. Many flows may reflect broad historical policies, such as patterns of colonization, rather than current migration policy implementation. This does not mean, however, that current policy changes cannot affect historical trends and patterns.
7
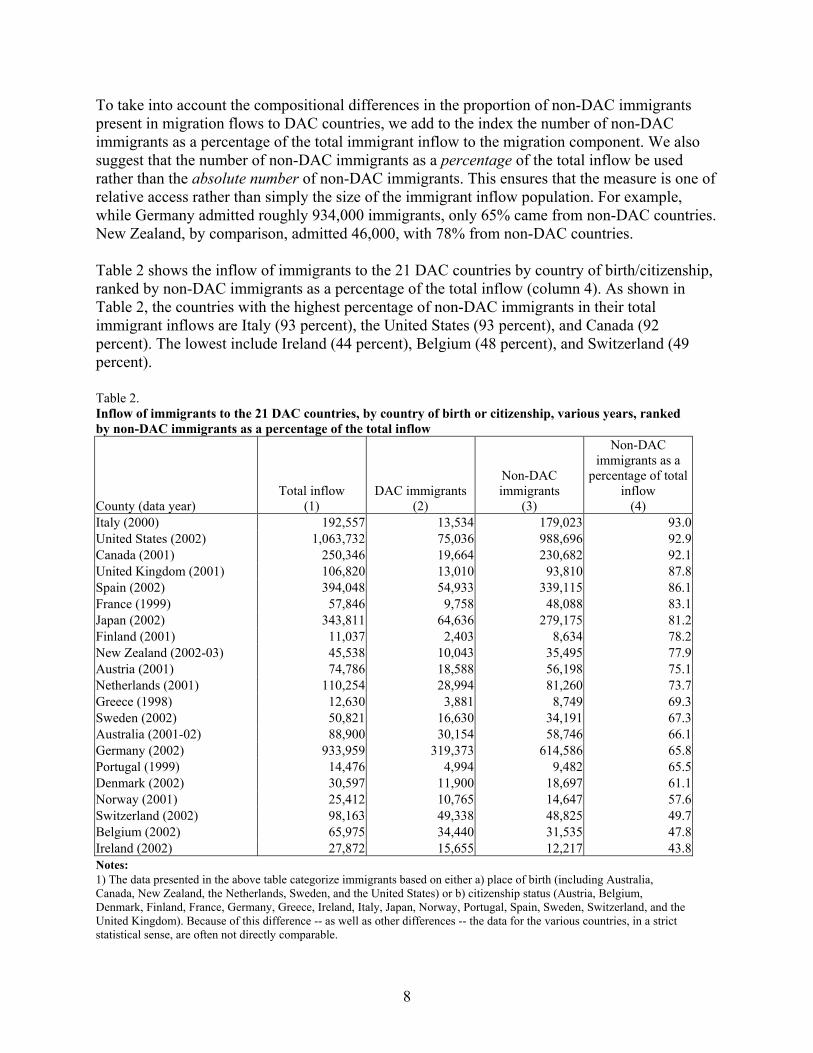
To take into account the compositional differences in the proportion of non-DAC immigrants present in migration flows to DAC countries, we add to the index the number of non-DAC immigrants as a percentage of the total immigrant inflow to the migration component. We also suggest that the number of non-DAC immigrants as a percentage of the total inflow be used rather than the absolute number of non-DAC immigrants. This ensures that the measure is one of relative access rather than simply the size of the immigrant inflow population. For example, while Germany admitted roughly 934,000 immigrants, only 65% came from non-DAC countries. New Zealand, by comparison, admitted 46,000, with 78% from non-DAC countries. Table 2 shows the inflow of immigrants to the 21 DAC countries by country of birth/citizenship, ranked by non-DAC immigrants as a percentage of the total inflow (column 4). As shown in Table 2, the countries with the highest percentage of non-DAC immigrants in their total immigrant inflows are Italy (93 percent), the United States (93 percent), and Canada (92 percent). The lowest include Ireland (44 percent), Belgium (48 percent), and Switzerland (49 percent). Table 2. Inflow of immigrants to the 21 DAC countries, by country of birth or citizenship, various years, ranked by non-DAC immigrants as a percentage of the total inflow
County (data year) Total inflow
(1) DAC immigrants
(2)
Non-DAC immigrants
(3)
Non-DAC immigrants as a
percentage of total inflow
(4) Italy (2000) 192,557 13,534 179,023 93.0United States (2002) 1,063,732 75,036 988,696 92.9Canada (2001) 250,346 19,664 230,682 92.1United Kingdom (2001) 106,820 13,010 93,810 87.8Spain (2002) 394,048 54,933 339,115 86.1France (1999) 57,846 9,758 48,088 83.1Japan (2002) 343,811 64,636 279,175 81.2Finland (2001) 11,037 2,403 8,634 78.2New Zealand (2002-03) 45,538 10,043 35,495 77.9Austria (2001) 74,786 18,588 56,198 75.1Netherlands (2001) 110,254 28,994 81,260 73.7Greece (1998) 12,630 3,881 8,749 69.3Sweden (2002) 50,821 16,630 34,191 67.3Australia (2001-02) 88,900 30,154 58,746 66.1Germany (2002) 933,959 319,373 614,586 65.8Portugal (1999) 14,476 4,994 9,482 65.5Denmark (2002) 30,597 11,900 18,697 61.1Norway (2001) 25,412 10,765 14,647 57.6Switzerland (2002) 98,163 49,338 48,825 49.7Belgium (2002) 65,975 34,440 31,535 47.8Ireland (2002) 27,872 15,655 12,217 43.8Notes: 1) The data presented in the above table categorize immigrants based on either a) place of birth (including Australia, Canada, New Zealand, the Netherlands, Sweden, and the United States) or b) citizenship status (Austria, Belgium, Denmark, Finland, France, Germany, Greece, Ireland, Italy, Japan, Norway, Portugal, Spain, Sweden, Switzerland, and the United Kingdom). Because of this difference -- as well as other differences -- the data for the various countries, in a strict statistical sense, are often not directly comparable.
8
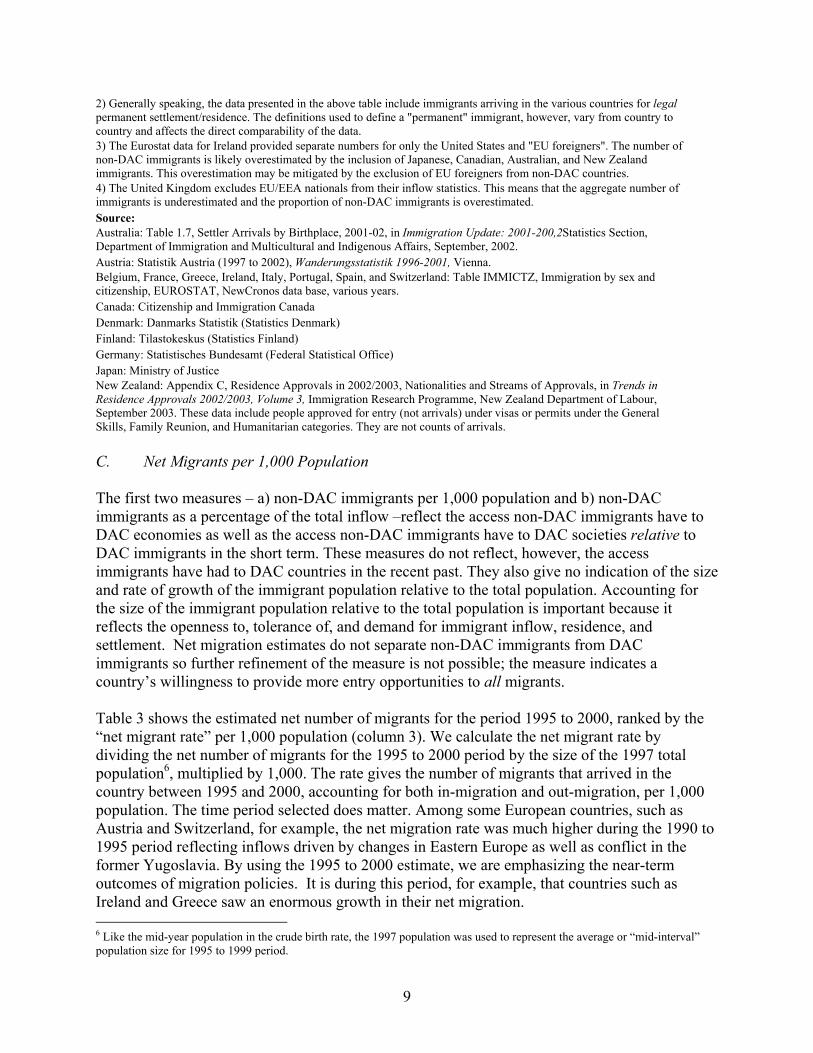
2) Generally speaking, the data presented in the above table include immigrants arriving in the various countries for legal permanent settlement/residence. The definitions used to define a "permanent" immigrant, however, vary from country to country and affects the direct comparability of the data. 3) The Eurostat data for Ireland provided separate numbers for only the United States and "EU foreigners". The number of non-DAC immigrants is likely overestimated by the inclusion of Japanese, Canadian, Australian, and New Zealand immigrants. This overestimation may be mitigated by the exclusion of EU foreigners from non-DAC countries. 4) The United Kingdom excludes EU/EEA nationals from their inflow statistics. This means that the aggregate number of immigrants is underestimated and the proportion of non-DAC immigrants is overestimated. Source: Australia: Table 1.7, Settler Arrivals by Birthplace, 2001-02, in Immigration Update: 2001-200,2Statistics Section, Department of Immigration and Multicultural and Indigenous Affairs, September, 2002. Austria: Statistik Austria (1997 to 2002), Wanderungsstatistik 1996-2001, Vienna. Belgium, France, Greece, Ireland, Italy, Portugal, Spain, and Switzerland: Table IMMICTZ, Immigration by sex and citizenship, EUROSTAT, NewCronos data base, various years. Canada: Citizenship and Immigration Canada Denmark: Danmarks Statistik (Statistics Denmark) Finland: Tilastokeskus (Statistics Finland) Germany: Statistisches Bundesamt (Federal Statistical Office) Japan: Ministry of Justice New Zealand: Appendix C, Residence Approvals in 2002/2003, Nationalities and Streams of Approvals, in Trends in Residence Approvals 2002/2003, Volume 3, Immigration Research Programme, New Zealand Department of Labour, September 2003. These data include people approved for entry (not arrivals) under visas or permits under the General Skills, Family Reunion, and Humanitarian categories. They are not counts of arrivals. C. Net Migrants per 1,000 Population The first two measures – a) non-DAC immigrants per 1,000 population and b) non-DAC immigrants as a percentage of the total inflow –reflect the access non-DAC immigrants have to DAC economies as well as the access non-DAC immigrants have to DAC societies relative to DAC immigrants in the short term. These measures do not reflect, however, the access immigrants have had to DAC countries in the recent past. They also give no indication of the size and rate of growth of the immigrant population relative to the total population. Accounting for the size of the immigrant population relative to the total population is important because it reflects the openness to, tolerance of, and demand for immigrant inflow, residence, and settlement. Net migration estimates do not separate non-DAC immigrants from DAC immigrants so further refinement of the measure is not possible; the measure indicates a country’s willingness to provide more entry opportunities to all migrants. Table 3 shows the estimated net number of migrants for the period 1995 to 2000, ranked by the “net migrant rate” per 1,000 population (column 3). We calculate the net migrant rate by dividing the net number of migrants for the 1995 to 2000 period by the size of the 1997 total population6, multiplied by 1,000. The rate gives the number of migrants that arrived in the country between 1995 and 2000, accounting for both in-migration and out-migration, per 1,000 population. The time period selected does matter. Among some European countries, such as Austria and Switzerland, for example, the net migration rate was much higher during the 1990 to 1995 period reflecting inflows driven by changes in Eastern Europe as well as conflict in the former Yugoslavia. By using the 1995 to 2000 estimate, we are emphasizing the near-term outcomes of migration policies. It is during this period, for example, that countries such as Ireland and Greece saw an enormous growth in their net migration. 6 Like the mid-year population in the crude birth rate, the 1997 population was used to represent the average or “mid-interval” population size for 1995 to 1999 period.
9
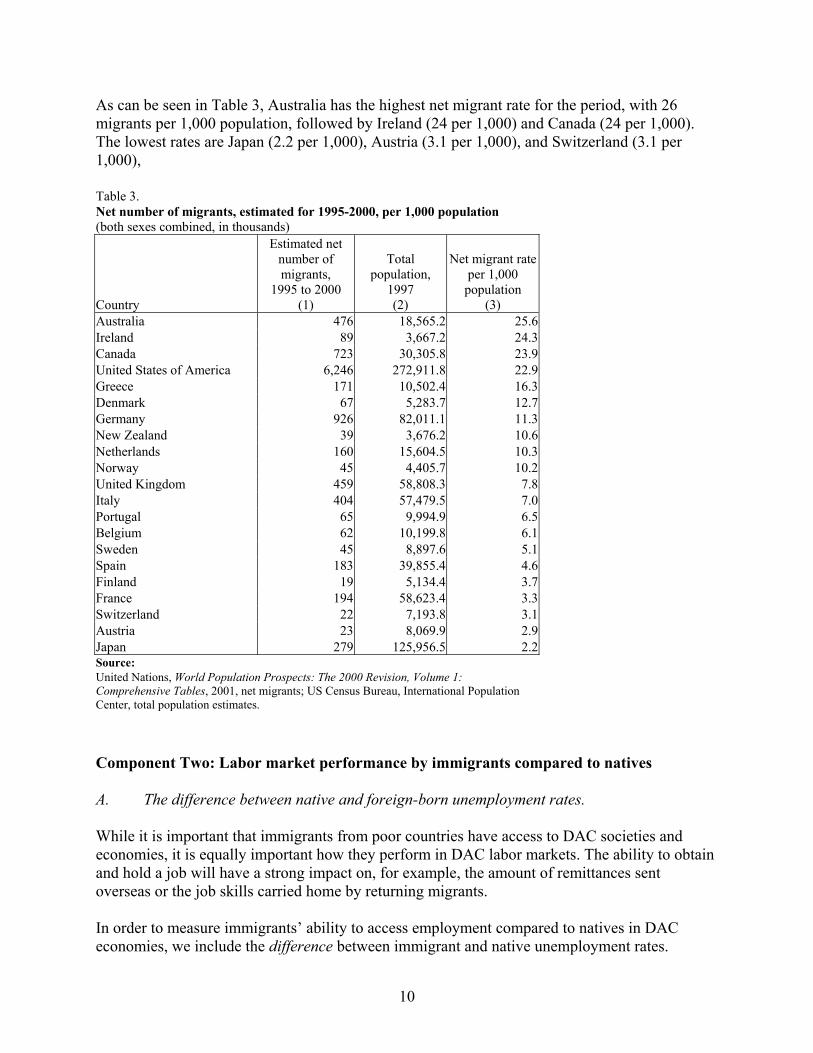
As can be seen in Table 3, Australia has the highest net migrant rate for the period, with 26 migrants per 1,000 population, followed by Ireland (24 per 1,000) and Canada (24 per 1,000). The lowest rates are Japan (2.2 per 1,000), Austria (3.1 per 1,000), and Switzerland (3.1 per 1,000), Table 3. Net number of migrants, estimated for 1995-2000, per 1,000 population (both sexes combined, in thousands)
Country
Estimated net number of migrants,
1995 to 2000 (1)
Total population,
1997 (2)
Net migrant rate per 1,000
population (3)
Australia 476 18,565.2 25.6Ireland 89 3,667.2 24.3Canada 723 30,305.8 23.9United States of America 6,246 272,911.8 22.9Greece 171 10,502.4 16.3Denmark 67 5,283.7 12.7Germany 926 82,011.1 11.3New Zealand 39 3,676.2 10.6Netherlands 160 15,604.5 10.3Norway 45 4,405.7 10.2United Kingdom 459 58,808.3 7.8Italy 404 57,479.5 7.0Portugal 65 9,994.9 6.5Belgium 62 10,199.8 6.1Sweden 45 8,897.6 5.1Spain 183 39,855.4 4.6Finland 19 5,134.4 3.7France 194 58,623.4 3.3Switzerland 22 7,193.8 3.1Austria 23 8,069.9 2.9Japan 279 125,956.5 2.2Source: United Nations, World Population Prospects: The 2000 Revision, Volume 1: Comprehensive Tables, 2001, net migrants; US Census Bureau, International Population Center, total population estimates.
Component Two: Labor market performance by immigrants compared to natives A. The difference between native and foreign-born unemployment rates. While it is important that immigrants from poor countries have access to DAC societies and economies, it is equally important how they perform in DAC labor markets. The ability to obtain and hold a job will have a strong impact on, for example, the amount of remittances sent overseas or the job skills carried home by returning migrants. In order to measure immigrants’ ability to access employment compared to natives in DAC economies, we include the difference between immigrant and native unemployment rates.
10
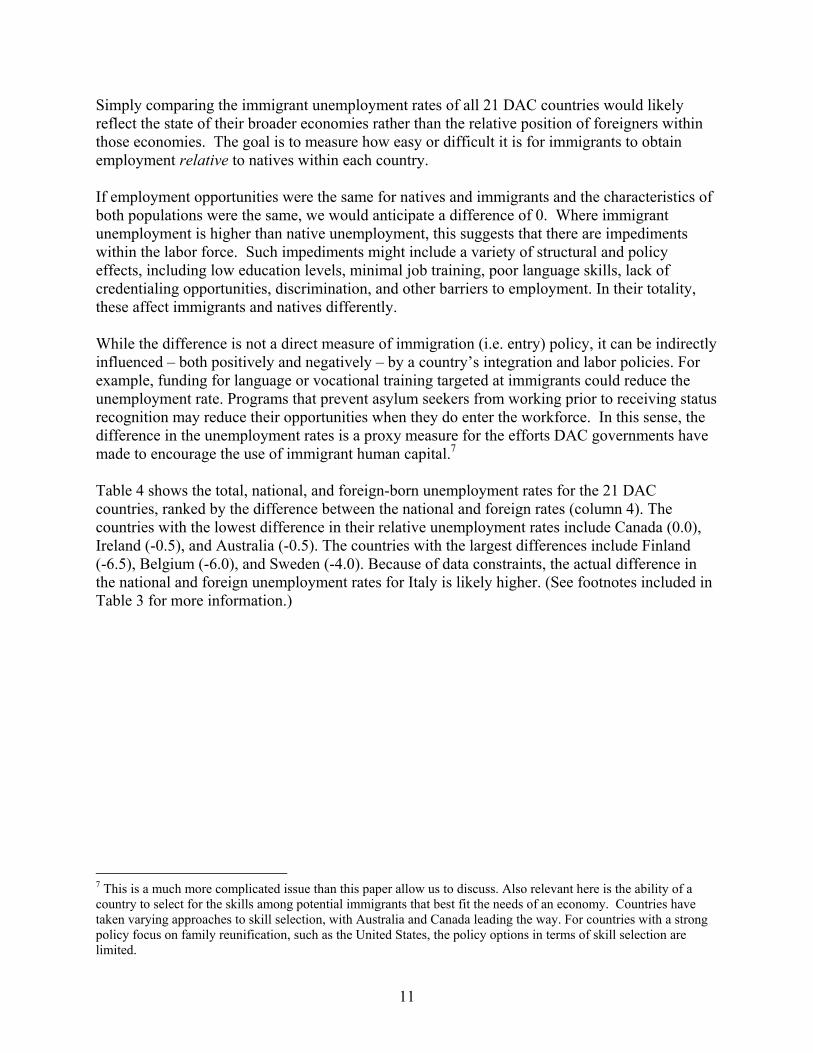
Simply comparing the immigrant unemployment rates of all 21 DAC countries would likely reflect the state of their broader economies rather than the relative position of foreigners within those economies. The goal is to measure how easy or difficult it is for immigrants to obtain employment relative to natives within each country. If employment opportunities were the same for natives and immigrants and the characteristics of both populations were the same, we would anticipate a difference of 0. Where immigrant unemployment is higher than native unemployment, this suggests that there are impediments within the labor force. Such impediments might include a variety of structural and policy effects, including low education levels, minimal job training, poor language skills, lack of credentialing opportunities, discrimination, and other barriers to employment. In their totality, these affect immigrants and natives differently. While the difference is not a direct measure of immigration (i.e. entry) policy, it can be indirectly influenced – both positively and negatively – by a country’s integration and labor policies. For example, funding for language or vocational training targeted at immigrants could reduce the unemployment rate. Programs that prevent asylum seekers from working prior to receiving status recognition may reduce their opportunities when they do enter the workforce. In this sense, the difference in the unemployment rates is a proxy measure for the efforts DAC governments have made to encourage the use of immigrant human capital.7 Table 4 shows the total, national, and foreign-born unemployment rates for the 21 DAC countries, ranked by the difference between the national and foreign rates (column 4). The countries with the lowest difference in their relative unemployment rates include Canada (0.0), Ireland (-0.5), and Australia (-0.5). The countries with the largest differences include Finland (-6.5), Belgium (-6.0), and Sweden (-4.0). Because of data constraints, the actual difference in the national and foreign unemployment rates for Italy is likely higher. (See footnotes included in Table 3 for more information.)
7 This is a much more complicated issue than this paper allow us to discuss. Also relevant here is the ability of a country to select for the skills among potential immigrants that best fit the needs of an economy. Countries have taken varying approaches to skill selection, with Australia and Canada leading the way. For countries with a strong policy focus on family reunification, such as the United States, the policy options in terms of skill selection are limited.
11
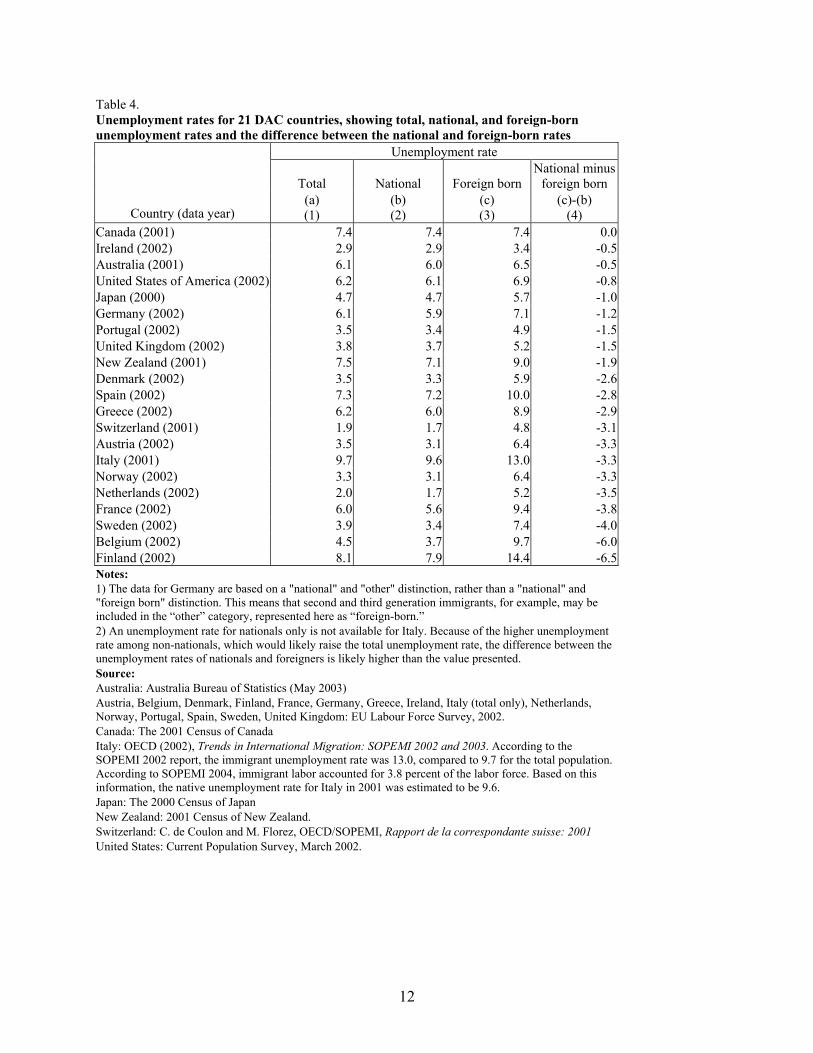
Table 4. Unemployment rates for 21 DAC countries, showing total, national, and foreign-born unemployment rates and the difference between the national and foreign-born rates
Unemployment rate
Total National Foreign born National minus
foreign born
Country (data year) (a) (1)
(b) (2)
(c) (3)
(c)-(b) (4)
Canada (2001) 7.4 7.4 7.4 0.0 Ireland (2002) 2.9 2.9 3.4 -0.5 Australia (2001) 6.1 6.0 6.5 -0.5 United States of America (2002) 6.2 6.1 6.9 -0.8 Japan (2000) 4.7 4.7 5.7 -1.0 Germany (2002) 6.1 5.9 7.1 -1.2 Portugal (2002) 3.5 3.4 4.9 -1.5 United Kingdom (2002) 3.8 3.7 5.2 -1.5 New Zealand (2001) 7.5 7.1 9.0 -1.9 Denmark (2002) 3.5 3.3 5.9 -2.6 Spain (2002) 7.3 7.2 10.0 -2.8 Greece (2002) 6.2 6.0 8.9 -2.9 Switzerland (2001) 1.9 1.7 4.8 -3.1 Austria (2002) 3.5 3.1 6.4 -3.3 Italy (2001) 9.7 9.6 13.0 -3.3 Norway (2002) 3.3 3.1 6.4 -3.3 Netherlands (2002) 2.0 1.7 5.2 -3.5 France (2002) 6.0 5.6 9.4 -3.8 Sweden (2002) 3.9 3.4 7.4 -4.0 Belgium (2002) 4.5 3.7 9.7 -6.0 Finland (2002) 8.1 7.9 14.4 -6.5 Notes: 1) The data for Germany are based on a "national" and "other" distinction, rather than a "national" and "foreign born" distinction. This means that second and third generation immigrants, for example, may be included in the “other” category, represented here as “foreign-born.” 2) An unemployment rate for nationals only is not available for Italy. Because of the higher unemployment rate among non-nationals, which would likely raise the total unemployment rate, the difference between the unemployment rates of nationals and foreigners is likely higher than the value presented. Source: Australia: Australia Bureau of Statistics (May 2003) Austria, Belgium, Denmark, Finland, France, Germany, Greece, Ireland, Italy (total only), Netherlands, Norway, Portugal, Spain, Sweden, United Kingdom: EU Labour Force Survey, 2002. Canada: The 2001 Census of Canada Italy: OECD (2002), Trends in International Migration: SOPEMI 2002 and 2003. According to the SOPEMI 2002 report, the immigrant unemployment rate was 13.0, compared to 9.7 for the total population. According to SOPEMI 2004, immigrant labor accounted for 3.8 percent of the labor force. Based on this information, the native unemployment rate for Italy in 2001 was estimated to be 9.6. Japan: The 2000 Census of Japan New Zealand: 2001 Census of New Zealand. Switzerland: C. de Coulon and M. Florez, OECD/SOPEMI, Rapport de la correspondante suisse: 2001 United States: Current Population Survey, March 2002.
12
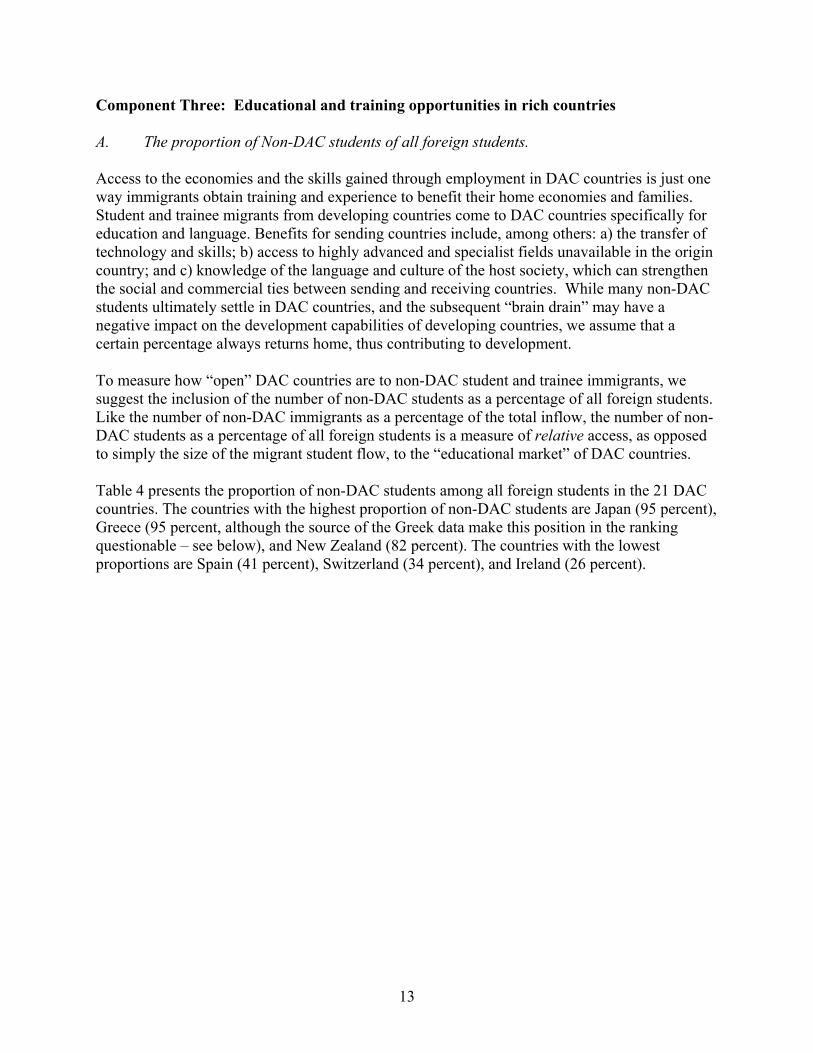
Component Three: Educational and training opportunities in rich countries A. The proportion of Non-DAC students of all foreign students. Access to the economies and the skills gained through employment in DAC countries is just one way immigrants obtain training and experience to benefit their home economies and families. Student and trainee migrants from developing countries come to DAC countries specifically for education and language. Benefits for sending countries include, among others: a) the transfer of technology and skills; b) access to highly advanced and specialist fields unavailable in the origin country; and c) knowledge of the language and culture of the host society, which can strengthen the social and commercial ties between sending and receiving countries. While many non-DAC students ultimately settle in DAC countries, and the subsequent “brain drain” may have a negative impact on the development capabilities of developing countries, we assume that a certain percentage always returns home, thus contributing to development. To measure how “open” DAC countries are to non-DAC student and trainee immigrants, we suggest the inclusion of the number of non-DAC students as a percentage of all foreign students. Like the number of non-DAC immigrants as a percentage of the total inflow, the number of non-DAC students as a percentage of all foreign students is a measure of relative access, as opposed to simply the size of the migrant student flow, to the “educational market” of DAC countries. Table 4 presents the proportion of non-DAC students among all foreign students in the 21 DAC countries. The countries with the highest proportion of non-DAC students are Japan (95 percent), Greece (95 percent, although the source of the Greek data make this position in the ranking questionable – see below), and New Zealand (82 percent). The countries with the lowest proportions are Spain (41 percent), Switzerland (34 percent), and Ireland (26 percent).
13
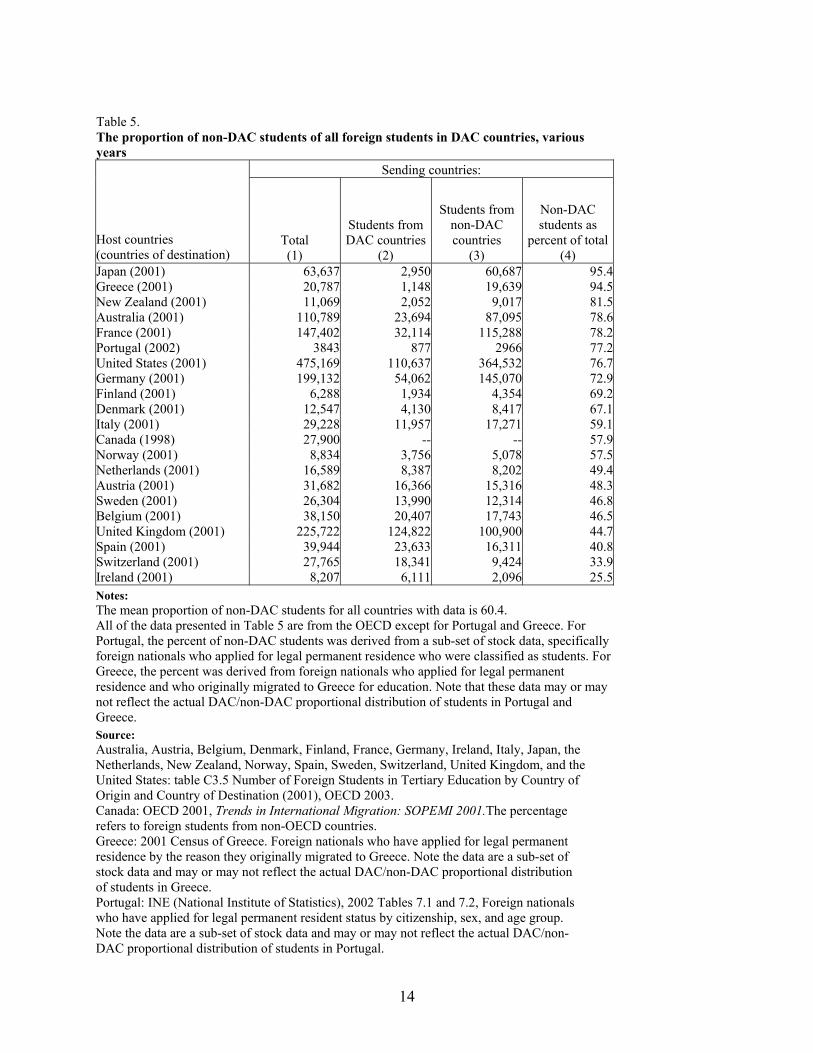
Table 5. The proportion of non-DAC students of all foreign students in DAC countries, various years
Sending countries:
Host countries (countries of destination)
Total (1)
Students from DAC countries
(2)
Students from non-DAC countries
(3)
Non-DAC students as
percent of total (4)
Japan (2001) 63,637 2,950 60,687 95.4Greece (2001) 20,787 1,148 19,639 94.5New Zealand (2001) 11,069 2,052 9,017 81.5Australia (2001) 110,789 23,694 87,095 78.6France (2001) 147,402 32,114 115,288 78.2Portugal (2002) 3843 877 2966 77.2United States (2001) 475,169 110,637 364,532 76.7Germany (2001) 199,132 54,062 145,070 72.9Finland (2001) 6,288 1,934 4,354 69.2Denmark (2001) 12,547 4,130 8,417 67.1Italy (2001) 29,228 11,957 17,271 59.1Canada (1998) 27,900 -- -- 57.9Norway (2001) 8,834 3,756 5,078 57.5Netherlands (2001) 16,589 8,387 8,202 49.4Austria (2001) 31,682 16,366 15,316 48.3Sweden (2001) 26,304 13,990 12,314 46.8Belgium (2001) 38,150 20,407 17,743 46.5United Kingdom (2001) 225,722 124,822 100,900 44.7Spain (2001) 39,944 23,633 16,311 40.8Switzerland (2001) 27,765 18,341 9,424 33.9Ireland (2001) 8,207 6,111 2,096 25.5Notes: The mean proportion of non-DAC students for all countries with data is 60.4. All of the data presented in Table 5 are from the OECD except for Portugal and Greece. For Portugal, the percent of non-DAC students was derived from a sub-set of stock data, specifically foreign nationals who applied for legal permanent residence who were classified as students. For Greece, the percent was derived from foreign nationals who applied for legal permanent residence and who originally migrated to Greece for education. Note that these data may or may not reflect the actual DAC/non-DAC proportional distribution of students in Portugal and Greece. Source: Australia, Austria, Belgium, Denmark, Finland, France, Germany, Ireland, Italy, Japan, the Netherlands, New Zealand, Norway, Spain, Sweden, Switzerland, United Kingdom, and the United States: table C3.5 Number of Foreign Students in Tertiary Education by Country of Origin and Country of Destination (2001), OECD 2003. Canada: OECD 2001, Trends in International Migration: SOPEMI 2001.The percentage refers to foreign students from non-OECD countries. Greece: 2001 Census of Greece. Foreign nationals who have applied for legal permanent residence by the reason they originally migrated to Greece. Note the data are a sub-set of stock data and may or may not reflect the actual DAC/non-DAC proportional distribution of students in Greece. Portugal: INE (National Institute of Statistics), 2002 Tables 7.1 and 7.2, Foreign nationals who have applied for legal permanent resident status by citizenship, sex, and age group. Note the data are a sub-set of stock data and may or may not reflect the actual DAC/non- DAC proportional distribution of students in Portugal.
14
Component Four: “Burden-sharing” through humanitarian admissions A. Combined ranking of UNHCR data compared to per capita GDP Humanitarian admissions form yet another important component in total admissions. Humanitarian admissions preserve human capital during crisis and conflict and can help to maintain a remittance stream to those left behind. Bosnia and Central America, for example, have benefited greatly from remittances sent post-conflict. On the other hand, external communities may organize to fund conflict in their home countries (i.e. Eritreans, Tamils) and may foster continued conflict. On balance, though, we argue that supporting humanitarian admissions is ultimately good for development. While the bulk of support for refugee flows is shared by developing countries, rich countries do share in bearing the costs of humanitarian disasters and the responsibility of protecting those in need. The UNHCR has developed an index that measures the burden shouldered by host countries caring for refugees, asylum seekers, and other populations of concern (such as internally displaced persons and returning refugees) within their borders. Beginning in 2002, the index will be released annually. The 2002 report is based on 2000 data and includes over 140 countries. The index adds the total estimated refugee population, the estimated size of the population of concern, and the number of asylum applications lodged within a year and divides this sum by per capita GDP. By using the per capita GDP, the index compares the host countries’ relative financial capacity to support refugee and asylum seekers. Table 5 shows the ranking of the DAC countries based on the UNHCR index, in relation to all 163 countries. As is shown, the DAC countries that ranked highest include Germany (50th), United States (67th), and the United Kingdom (75). The countries ranked lowest include New Zealand (121st), Japan (132nd), and Portugal (137th).
15
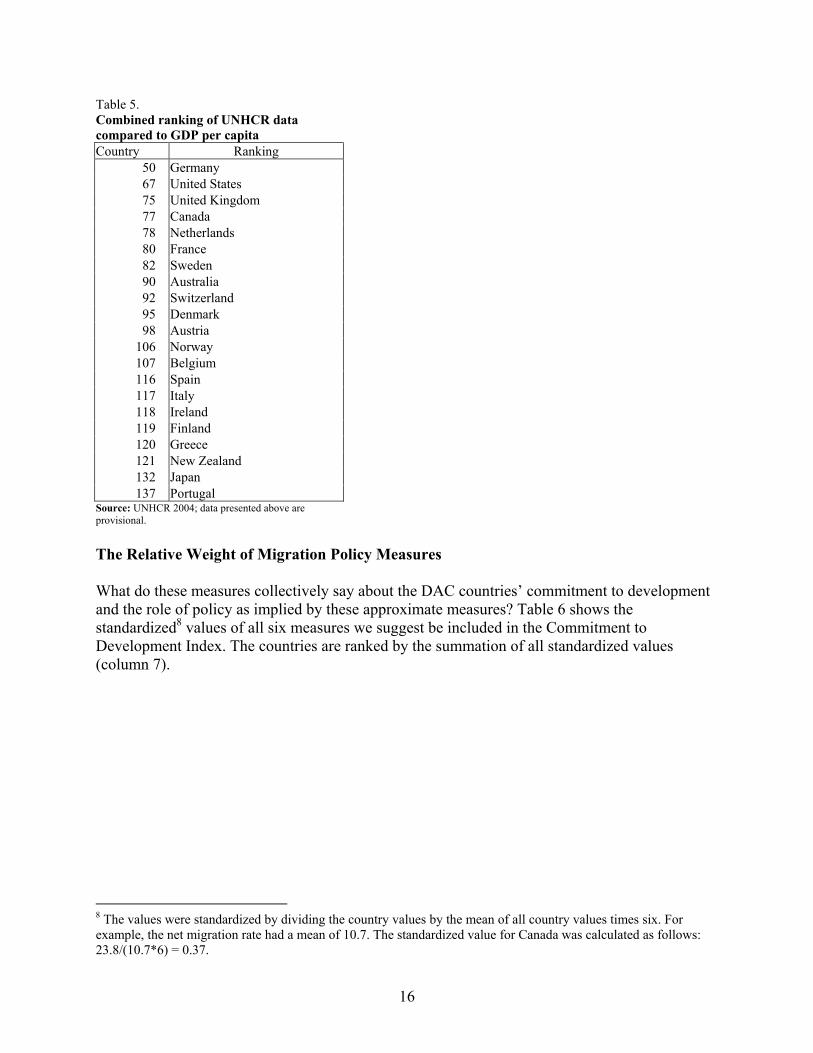
Table 5. Combined ranking of UNHCR data compared to GDP per capita Country Ranking 50 Germany 67 United States 75 United Kingdom 77 Canada 78 Netherlands 80 France 82 Sweden 90 Australia 92 Switzerland 95 Denmark 98 Austria 106 Norway 107 Belgium 116 Spain 117 Italy 118 Ireland 119 Finland 120 Greece 121 New Zealand 132 Japan 137 Portugal Source: UNHCR 2004; data presented above are provisional. The Relative Weight of Migration Policy Measures What do these measures collectively say about the DAC countries’ commitment to development and the role of policy as implied by these approximate measures? Table 6 shows the standardized8 values of all six measures we suggest be included in the Commitment to Development Index. The countries are ranked by the summation of all standardized values (column 7).
8 The values were standardized by dividing the country values by the mean of all country values times six. For example, the net migration rate had a mean of 10.7. The standardized value for Canada was calculated as follows: 23.8/(10.7*6) = 0.37.
16
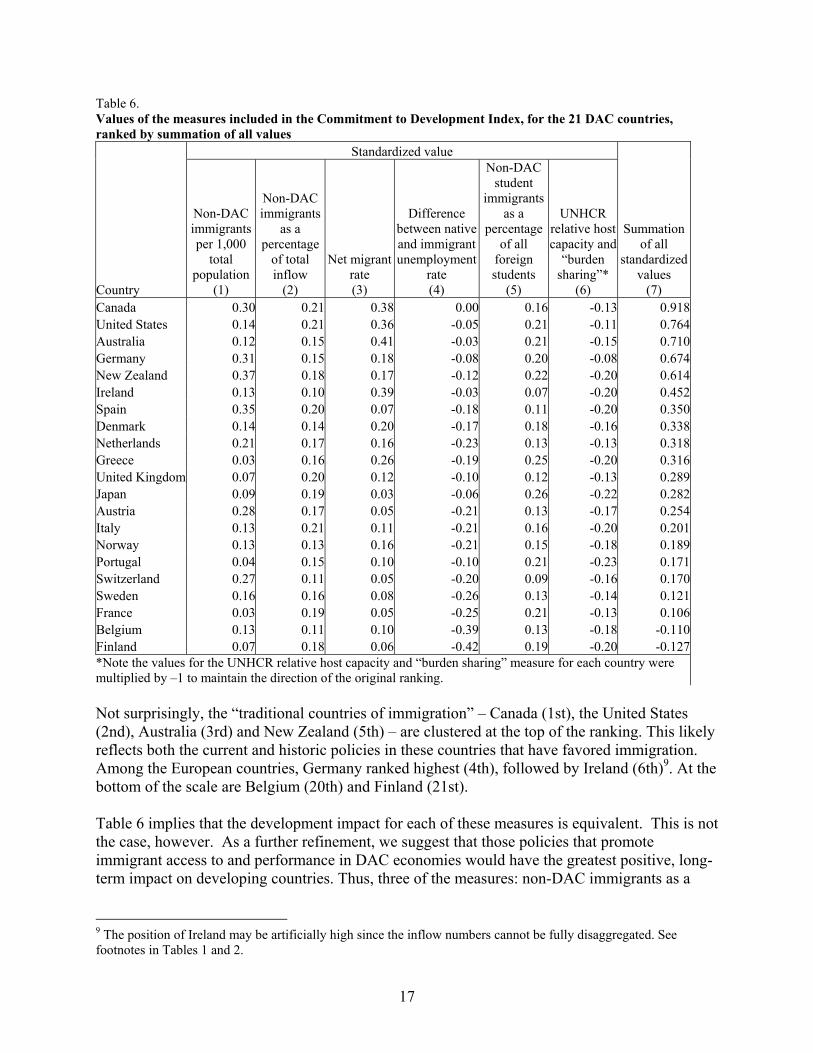
Table 6. Values of the measures included in the Commitment to Development Index, for the 21 DAC countries, ranked by summation of all values Standardized value
Country
Non-DAC immigrants per 1,000
total population
(1)
Non-DAC immigrants
as a percentage
of total inflow
(2)
Net migrant rate (3)
Difference between native and immigrant unemployment
rate (4)
Non-DAC student
immigrants as a
percentage of all
foreign students
(5)
UNHCR relative host capacity and
“burden sharing”*
(6)
Summation of all
standardized values
(7) Canada 0.30 0.21 0.38 0.00 0.16 -0.13 0.918United States 0.14 0.21 0.36 -0.05 0.21 -0.11 0.764Australia 0.12 0.15 0.41 -0.03 0.21 -0.15 0.710Germany 0.31 0.15 0.18 -0.08 0.20 -0.08 0.674New Zealand 0.37 0.18 0.17 -0.12 0.22 -0.20 0.614Ireland 0.13 0.10 0.39 -0.03 0.07 -0.20 0.452Spain 0.35 0.20 0.07 -0.18 0.11 -0.20 0.350Denmark 0.14 0.14 0.20 -0.17 0.18 -0.16 0.338Netherlands 0.21 0.17 0.16 -0.23 0.13 -0.13 0.318Greece 0.03 0.16 0.26 -0.19 0.25 -0.20 0.316United Kingdom 0.07 0.20 0.12 -0.10 0.12 -0.13 0.289Japan 0.09 0.19 0.03 -0.06 0.26 -0.22 0.282Austria 0.28 0.17 0.05 -0.21 0.13 -0.17 0.254Italy 0.13 0.21 0.11 -0.21 0.16 -0.20 0.201Norway 0.13 0.13 0.16 -0.21 0.15 -0.18 0.189Portugal 0.04 0.15 0.10 -0.10 0.21 -0.23 0.171Switzerland 0.27 0.11 0.05 -0.20 0.09 -0.16 0.170Sweden 0.16 0.16 0.08 -0.26 0.13 -0.14 0.121France 0.03 0.19 0.05 -0.25 0.21 -0.13 0.106Belgium 0.13 0.11 0.10 -0.39 0.13 -0.18 -0.110Finland 0.07 0.18 0.06 -0.42 0.19 -0.20 -0.127*Note the values for the UNHCR relative host capacity and “burden sharing” measure for each country were multiplied by –1 to maintain the direction of the original ranking. Not surprisingly, the “traditional countries of immigration” – Canada (1st), the United States (2nd), Australia (3rd) and New Zealand (5th) – are clustered at the top of the ranking. This likely reflects both the current and historic policies in these countries that have favored immigration. Among the European countries, Germany ranked highest (4th), followed by Ireland (6th)9. At the bottom of the scale are Belgium (20th) and Finland (21st). Table 6 implies that the development impact for each of these measures is equivalent. This is not the case, however. As a further refinement, we suggest that those policies that promote immigrant access to and performance in DAC economies would have the greatest positive, long-term impact on developing countries. Thus, three of the measures: non-DAC immigrants as a
9 The position of Ireland may be artificially high since the inflow numbers cannot be fully disaggregated. See footnotes in Tables 1 and 2.
17
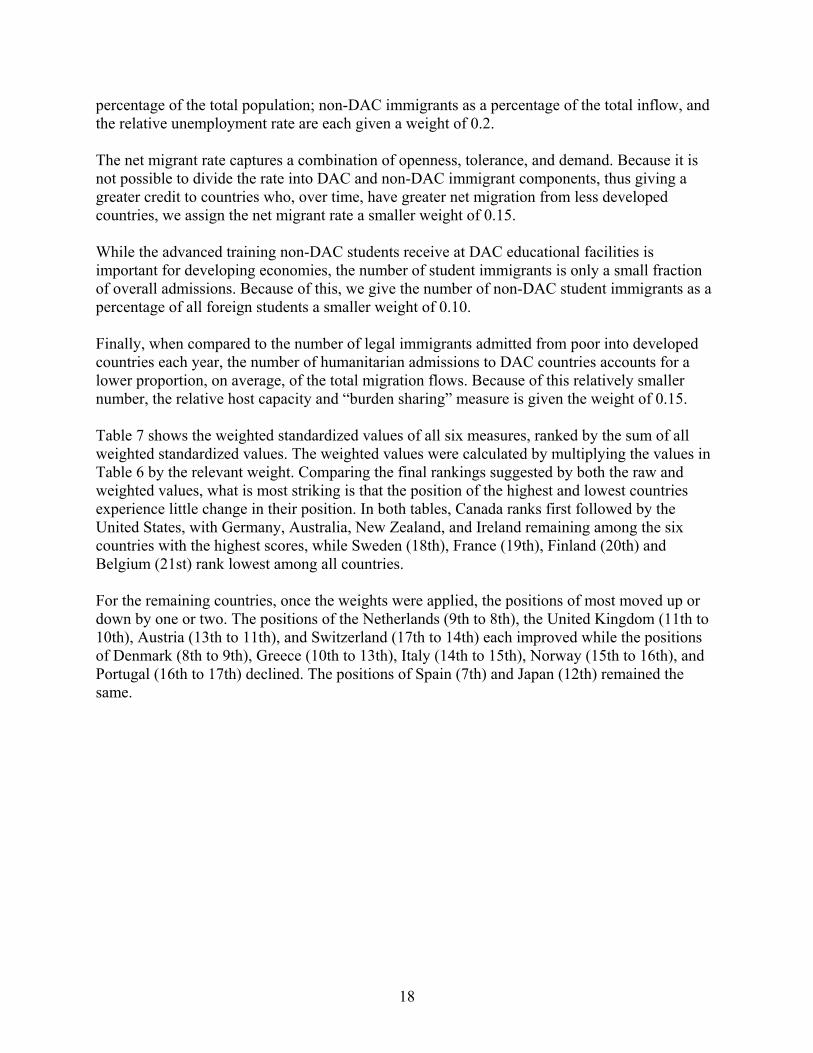
percentage of the total population; non-DAC immigrants as a percentage of the total inflow, and the relative unemployment rate are each given a weight of 0.2. The net migrant rate captures a combination of openness, tolerance, and demand. Because it is not possible to divide the rate into DAC and non-DAC immigrant components, thus giving a greater credit to countries who, over time, have greater net migration from less developed countries, we assign the net migrant rate a smaller weight of 0.15. While the advanced training non-DAC students receive at DAC educational facilities is important for developing economies, the number of student immigrants is only a small fraction of overall admissions. Because of this, we give the number of non-DAC student immigrants as a percentage of all foreign students a smaller weight of 0.10. Finally, when compared to the number of legal immigrants admitted from poor into developed countries each year, the number of humanitarian admissions to DAC countries accounts for a lower proportion, on average, of the total migration flows. Because of this relatively smaller number, the relative host capacity and “burden sharing” measure is given the weight of 0.15. Table 7 shows the weighted standardized values of all six measures, ranked by the sum of all weighted standardized values. The weighted values were calculated by multiplying the values in Table 6 by the relevant weight. Comparing the final rankings suggested by both the raw and weighted values, what is most striking is that the position of the highest and lowest countries experience little change in their position. In both tables, Canada ranks first followed by the United States, with Germany, Australia, New Zealand, and Ireland remaining among the six countries with the highest scores, while Sweden (18th), France (19th), Finland (20th) and Belgium (21st) rank lowest among all countries. For the remaining countries, once the weights were applied, the positions of most moved up or down by one or two. The positions of the Netherlands (9th to 8th), the United Kingdom (11th to 10th), Austria (13th to 11th), and Switzerland (17th to 14th) each improved while the positions of Denmark (8th to 9th), Greece (10th to 13th), Italy (14th to 15th), Norway (15th to 16th), and Portugal (16th to 17th) declined. The positions of Spain (7th) and Japan (12th) remained the same.
18
Table 7. 21 DAC countries ranked by the summation of all weighted and standardized values
Country
Summation of all weighted
standardized values
Canada 0.156United States 0.120Germany 0.110Australia 0.108New Zealand 0.103Ireland 0.074Spain 0.065Netherlands 0.049Denmark 0.048United Kingdom 0.046Austria 0.044Japan 0.040Greece 0.035Switzerland 0.030Italy 0.029Norway 0.023Portugal 0.020Sweden 0.014France 0.004Belgium -0.030Finland -0.037 Controversy and Improvements The ability of DAC countries to improve development outcomes through immigration and related policies is a mixed story. This exercise reveals that country size as well as a history of significant immigration continues to play an important role, as illustrated by the dominance of large and traditional countries of immigration at the top of the ranking. At the same time, there are policies that individual countries can promote to increase opportunities for non-DAC immigrants even given a relatively small immigration flow. Given the promise of migrant “earn, learn, and return” strategies, it is not surprising that improvements in immigration policy should inform part of the discussion on meeting the eighth of the Millennium Development Goals. That is the goal that holds rich countries to a promise “to focus on politically difficult steps that they themselves should take to help poor [countries]” (Birdsall and Clemens 2003: 2). Yet, immigration policy, like other elements in the Commitment to Development Index, is extremely controversial. As recent experience in some European countries, such as Austria and the Netherlands, demonstrates, immigration policy alone can make or break political futures. In this context, meeting clear objectives to promote development through increased immigration is a political high-wire act. This is true even as the demographic futures of countries such as
19
those in the southern Mediterranean and Japan demand a more flexible, open, and realistic understanding of immigration’s linchpin role in sustaining, not to mention stimulating, these economies. Even absent political hurdles, decisions about who to let in, how many, under what conditions, and for how long remain hotly debated. President Bush’s plan for temporary workers potentially opens the door for enormous numbers of unskilled workers to continue to access the US labor market, albeit under controversial conditions. The development potential could be significant. At the same time, countries such as Canada, Australia, the UK, and Germany have moved forward with very clear policies to “skill-up” their immigration flows and to narrow the channels for unskilled labor and asylum seekers. The onus to promote development through migration does not fall solely on rich country governments. Developing country governments must work actively to create an enabling environment that makes the most productive use of returning financial and human capital. At the same time, market mechanisms are already at work to reduce the transaction costs of remitting and to expand immigrant access to the banking sector on both sides of the border. Finally, there remains a significant gap in our knowledge of the interplay between microeconomic and macroeconomic strategies and the motivations of individual migrants along that spectrum. As governments on both sides of the remittance chain ponder a more effective role for remittances and other kinds of migration-produced capital, there remain millions of individuals who act quite independently to keep their household economies afloat. At the end of the day, remittances and skills belong to the migrants who earn and learn them. Government strategies to promote development through migration will need to work with migrants and not around them to influence positively individual decisions. Ultimately, any attempt to quantify the impact of wealthy countries’ immigration policies on poor country development is a magnet for controversy. In the context of this exercise, the policy questions we seek to answer far outrun our capacity to answer them. The data presented in this paper only begin to approximate the kinds of specific data that could open the black box of effective immigration policy with an eye on development. Knowing for all countries who enters and from where, under what conditions and for how long, and with what access to the labor market would begin to provide the kinds of baseline measures necessary to keep rich countries accountable for their development promises.
20
Technical Notes Migration data: “stock” and “flow” International migration data can be generally divided into two types: stock and flow. Stock data represent “snapshots” of a population as a single point in time by counting (as in a census) or estimating (as in a survey) the distribution of that population according to some characteristic, such as age, income, or sex. An example of migration stock data would be the distribution of all foreign persons in a population by their country of origin. Flow data are collected and produced by governmental administrative agencies. Unlike stock data, they are collected continuously but are usually presented in an aggregate form for a point in time, such as monthly or annual statistics. A good example of migration flow data is the number of immigrants entering a country, since immigration is a process that occurs continuously and is catalogued year round. Comparability of immigration data across DAC countries Any attempt to use international migration data to compare – and then rank – countries must be prefaced with strong words of warning. Many non-specialists, and even some migration specialists, are unfamiliar with the problems associated with comparing migration statistics across countries. In brief, significant differences in how countries define seemingly immutable migration related-concepts, such as “immigrant” and “permanent resident,” in fundamentally different ways directly affect how (and if) individuals are classified as migrants and counted. These differences can have a negative impact on the comparability of even the most basic statistics. While not exhaustive, the following discusses examples of the more egregious problems associated with international migration statistics. All of these have the potential to weaken the “robustness” of the migration measurement included in the Commitment to Development Index. The concepts of foreign-born v. foreigner: Nativity status in the traditional countries of immigration, including the United States, Canada, Australia, and New Zealand, is generally determined by place of birth. For example, in the United States place of birth and citizenship status divide the resident population into three groups: foreign-born non-citizens, foreign-born citizens, and natives (i.e., citizens at birth). By comparison, in many European countries, such as France, England, Italy, and Germany, emphasis is placed on citizenship rather than place of birth. In general the term “foreigner” refers to all those in the country who are not citizens, regardless of where they were born. The “foreign-born” and “foreigner” conundrum is significant because it effectively prevents the comparison of even the most basic migration statistics. This is most easily seen when comparing the size of migrant populations across countries. In the United States the foreign born population includes both naturalized immigrants and non-citizens. In Germany the foreign population includes only non-citizens and does not count those immigrants who have naturalized. Thus, in Germany, the number of foreigners underestimates of the number of foreign born, while in the United States, the number of foreign-born overestimates the number of foreigners. While this initially may appear to be a “splitting of conceptual hairs” and of only minor consequence, it has
21
been shown that in countries where both the foreign-born and foreigner concepts are used the size of the migrant populations they define varies significantly. For example, in the Netherlands, the size of the foreign-born population for 2002 was 1.5 million, compared to a foreign population of only 690,000. For Austria, the size of the foreign-born population in 2001 was 1.0 million, compared to 711,000 foreigners. Defining short- and long-term migrants: The United Nations defines a long-term migrant as “a person who moves to a country other than that of his/her usual residence for a period of at least a year, so that the country of destination effectively becomes his/her new country of usual residence.” By comparison, a short-term migrant is someone who moves for a period of at least three months but less than a year. Short-term migrants exclude tourists, business travelers, etc. Unfortunately, many countries fail to use these recommended definitions when tabulating their migration statistics. Often, short-term migrants are categorized and enumerated as long-term immigrants. For example, in the Netherlands, migrants with resident permits planning to stay at least six months are enumerated with long-term immigrants. This likely means that short-term contract workers and international students are counted as long-term immigrants, where in other countries they would be classified only as short-term and excluded from immigration statistics. Conversely, long-term migrants are often categorized as short-term. For example, in the United States, high-skilled migrants on H1B visas are classified as temporary even though they can renew their visas for a total of six years. In many other countries, these long-duration temporary immigrants would be classified as permanent immigrants. The lack of consistency among countries in the definitions of short- and long-term migrants is important because it can significantly inflate or deflate aggregate migration statistics. This is best seen in the inflow of permanent immigrants data. In Denmark, immigrants are defined as persons who have lived in the country for at least one year. However, foreigners residing in Denmark for more than three months are included in their national population register and, therefore, often appear in immigrant statistics. The inclusion of short-term migrants into long-term migrant statistics inflates the number of arriving immigrants. For example, when the three-month threshold is used, 27,900 immigrants arrived in Denmark in 1999. However, if the twelve-month threshold is used, only 20,300 immigrants arrived in Denmark. Conversely, in the United States, the exclusion of long-duration temporary immigrants from permanent immigrant statistics deflates the number of long-term immigrants. For example, in 2002 there were 1.1 million immigrants who obtained permanent resident status, while there were 811,000 visas issued to “temporary workers and trainees” and their families (H and O to T visas). Temporary workers and trainees and their families can stay initially for up to one year, with many of these visas having the option of multiple year renewals. Including some or all of these temporary immigrants with the permanent immigrants would significantly increase the number of long-term migrants arriving in the United States in 2002.
22
Availability and promulgation of statistics: International data is not always available consistently across years. For example, the main source of stock data is the census, which is taken by most countries every five or ten years. Some countries carry out intercensal estimates or annual surveys, but many, such as France or Canada, do not. This means much international migration data, such as the stock of foreign-born by country of birth, will not be available across countries for all years, and those years that are available may be spread out over a ten-year period. Flow data, which are collected by government administrative programs, are generally more widely available than stock data across countries on a year-to-year basis. Unfortunately, flow data are often released anywhere from a few to several years late, making it difficult to obtain data across countries for the same relatively current year. The problems associated with the generation and promulgation of international migration statistics, however, go well beyond the simple lack of annual and up-to-date stock and flow data. Some countries lack the institutional capacity to effectively collect, analyze and publish more than just the basic migration statistics, if that. Having only relatively recently become countries of immigration, Ireland, Greece, and Italy, among others, are now having to adjust their statistical systems and related bureaucracies to obtain the needed data, a process that can take years. Even with well-established statistical systems there is no guarantee that countries collect the type of data needed for comparisons with others. For example, unlike other countries that use the “foreigner” format, such as Denmark, Austria, and the Netherlands, Germany does not collect place of birth data. Other countries, such as France, collect a considerable amount of data but make only a limited amount available for public use. Some countries will publish basic migration data, but limit the number of cross-tabulations with other social or economic variables. For example, Austria publishes migrant inflow data by country of origin but does not cross this data by type of work/settlement permit. Other countries will only publish summary data, for example, limiting the list of origin countries for the resident migrant population to the top ten or fifteen and lumping the remainder into a generic “other” category. All of these issues significantly limit the comparability of immigration statistics among DAC countries.
23
24
Useful References and Sources Adelman, Carol. 2003. “The Privatization of Foreign Aid: Reassessing National Largesse.” Foreign Affairs. 82(6): 9-14. Bilsborrow, RE, G. Hugo, AS Oberai, and H. Zlotnik. 1997. International Migration Statistics: Guidelines for Improving Data Collection Systems. International Labour Organization: Geneva. Birdsall, Nancy and Michael Clemens. 2003. “From Promise to Performance: How Rich Countries Can Help Poor Countries Help Themselves.” CGD Brief (2):1. Black, Richard. 2003. “Soaring Remittances Raise New Issues”. June 1. Retrieved from the Migration Information Source Special Issue on Migration and Development. http://www.migrationinformation.org/Feature/display.cfm?ID=127. Hamilton, Kimberly A. 2003. “Migration and Development: Blind Faith and Hard-to-Find Facts.” Metropolis World Bulletin 3(September):7-9. Hamilton and Grieco. 2002. “Migration Policies as Development Impact Measures.” Prepared for the Center for Global Development. August 2, 2002. Kapur, Devesh and John McHale. 2003. “Migration’s New Payoff: Globalization at Work.” Foreign Policy 139 (November/December): 48-57. Newland, Kathleen. Forthcoming 2004. “Migration as a Factor in Development and Poverty Reduction: the Impact of Immigration Policies on the Prospects for the Poor.” In R. Picciotto and R. Weaving, eds, Impact of Rich Countries Policies on Poor Countries: Toward a Level Playing Field in Development Cooperation. New Brunswick and London: Transaction Press. SOPEMI. 2002 and 2003. Trends in International Migration: Annual Report, 2001 and 2002 Editions. OECD: Paris. Ratha, Dilip. 2003. “Workers Remittances: An Important and Stable Source of External Development Finance.” In Global Development Finance. Washington, DC: World Bank. United Nations. 2001. World Population Prospects: The 2000 Revision. Volume I: Comprehensive Tables. United Nations: New York.