realizing the potential - meg energy · realizing the potential • targeted 2014 annual production...
TRANSCRIPT
REALIZING THE POTENTIAL INVESTOR PRESENTATION MAY 2014

Disclaimer This presentation is not, and under no circumstances is to be construed to be a prospectus, offering memorandum, advertisement or public offering of any securities of MEG Energy Corp. (“MEG”). Neither the United States Securities and Exchange Commission (the “SEC”) nor any other state securities regulator nor any securities regulatory authority in Canada or elsewhere has assessed the merits of MEG’s securities or has reviewed or made any determination as to the truthfulness or completeness of the disclosure in this document. Any representation to the contrary is an offence.
Recipients of this presentation are not to construe the contents of this presentation as legal, tax or investment advice and recipients should consult their own advisors in this regard.
MEG has not registered (and has no current intention to register) its securities under the United States Securities Act of 1933, as amended (the “U.S. Securities Act”), or any state securities or “blue sky” laws and MEG is not registered under the United States Investment Act of 1940, as amended. The securities of MEG may not be offered or sold in the United States or to U.S. persons unless registered under the U.S. Securities Act and applicable state securities laws or an exemption from such registration is available. Without limiting the foregoing, please be advised that certain financial information relating to MEG contained in this presentation was prepared in accordance with Canadian generally accepted accounting principles, which differ from generally accepted accounting principles in the United States and elsewhere. Accordingly, financial information included in this document may not be comparable to financial information of United States issuers.
The information concerning petroleum reserves and resources appearing in this document was derived from a report of GLJ Petroleum Consultants Ltd. dated effective as of December 31, 2013, which has been prepared in accordance with the Canadian Securities Administrators National Instrument 51-101 entitled Standards of Disclosure for Oil and Gas Activities (“NI 51-101”) at that time. The standards of NI 51-101 differ from the standards of the SEC. The SEC generally permits U.S. reporting oil and gas companies in their filings with the SEC, to disclose only proved, probable and possible reserves, net of royalties and interests of others. NI 51-101, meanwhile, permits disclosure of estimates of contingent resources and reserves on a gross basis. As a consequence, information included in this presentation concerning our reserves and resources may not be comparable to information made by public issuers subject to the reporting and disclosure requirements of the SEC.
There are significant differences in the criteria associated with the classification of reserves and contingent resources. Contingent resource estimates involve additional risk, specifically the risk of not achieving commerciality, not applicable to reserves estimates. There is no certainty that it will be commercially viable to produce any portion of the resources. The estimates of reserves, resources and future net revenue from individual properties may not reflect the same confidence level as estimates of reserves, resources and future net revenue for all properties, due to the effects of aggregation. Further information regarding the estimates and classification of MEG’s reserves and resources is contained within the Corporation’s public disclosure documents on file with Canadian Securities regulatory authorities, and in particular, within MEG’s most recent annual information form (the “AIF”). MEG’s public disclosure documents, including the AIF, may be accessed through the SEDAR website (www.sedar.com), at MEG’s website (www.megenergy.com), or by contacting MEG’s investor relations department.
Anticipated netbacks are calculated by adding anticipated revenues and other income and subtracting anticipated royalties, operating costs and transportation costs from such amount.
INVESTOR PRESENTATION 2014 2

Disclosure Advisories Forward-Looking Statements Certain statements contained in this presentation constitute forward-looking statements. These statements relate to future events or MEG’s future performance. All statements other than statements of historical fact are forward-looking statements. The use of any of the words “anticipate”, “plan”, “contemplate”, “continue”, “estimate”, “expect”, “intend”, “propose”, “might”, “may”, “will”, “shall”, “project”, “should”, “could”, “would”, “believe”, “predict”, “forecast”, “pursue”, “potential”, “target” and “capable” and similar expressions are intended to identify forward-looking statements. These statements involve known and unknown risks, uncertainties and other factors that may cause actual results or events to differ materially from those anticipated in such forward-looking statements. No assurance can be given that these expectations will prove to be correct and such forward-looking statements included in this presentation should not be unduly relied upon. These statements speak only as of the date of this presentation. In addition, this presentation may contain forward-looking statements and forward-looking information attributed to third party industry sources.
In particular, this presentation contains forward-looking statements pertaining to the following: the reserve and resource potential of MEG’s assets; the bitumen production and production capacity of MEG’s assets; MEG’s growth strategy and opportunities; MEG’s capital expenditure programs, future capital requirements and debt maturities; the estimated quantity of MEG’s proved reserves, probable reserves and contingent resources; MEG’s projections of commodity prices, costs and netbacks; MEG’s estimates of future interest and foreign exchange rates; MEG’s environmental considerations, including water usage and greenhouse gas emissions; MEG’s blending capability for its bitumen diluent blend; the timing and size of certain of MEG’s operations and phases, including its planned bitumen development projects and the RISER initiative, and the levels of anticipated production as well as SORs including the impact of eMSAGP on production and SORs; supply and demand fundamentals for crude oil, bitumen blend, natural gas, condensate and other diluents; MEG’s access to adequate pipeline capacity and the timing thereof; MEG’s access to third-party infrastructure, including rail and barge, and the timing thereof; industry conditions including with respect to project development; potential future markets for MEG’s products; the planned construction and commencement of operation of MEG’s facilities, including the Access Pipeline expansion; MEG’s drilling plans; MEG’s plans for, and results of, exploration and development activities; the expected application timeframe for the Surmont Project and for the Growth Properties; the timing for receipt of various regulatory approvals, including receipt of various regulatory approvals for the Christina Lake Project, Surmont Project and Growth Properties; MEG’s treatment under governmental regulatory and royalty regimes and tax laws; and MEG’s future general and administrative expenses.
The forward-looking statements contained in this presentation are based on certain assumptions including: future crude oil, bitumen blend, natural gas, condensate and other diluent prices; MEG’s ability to obtain qualified staff and equipment in a timely and cost-efficient manner; the regulatory framework governing royalties, taxes and environmental matters in the jurisdictions in which MEG conducts and will conduct its business; MEG’s ability to market production of bitumen blend successfully to customers; MEG’s future production levels and SORs; the applicability of technologies for the recovery and production of MEG’s reserves and resources; the recoverability of MEG’s reserves and resources; operating costs; future capital expenditures to be made by MEG; future sources of funding for MEG’s capital programs; MEG’s future debt levels; geological and engineering estimates in respect of MEG’s reserves and resources; the geography of the areas in which MEG is conducting exploration and development activities; the impact of increasing competition on MEG; and MEG’s ability to obtain financing on acceptable terms.
In addition, information and statements in this presentation relating to “reserves” and “resources” are deemed to be forward-looking information and statements, as they involve the implied assessment, based on certain estimates and assumptions, that the reserves and resources described exist in the quantities predicted or estimated, and that the reserves and resources described can be profitably produced in the future.
The forward-looking statements included in this presentation are expressly qualified by this cautionary statement and are made as of the date of this presentation. MEG does not undertake any obligation to publicly update or revise any forward-looking statements except as required by applicable securities laws. For more information regarding forward-looking statements, please see “Risk Factors” and “Regulatory Matters” within the AIF.
Market Data This presentation contains statistical data, market research and industry forecasts that were obtained from government or other industry publications and reports or based on estimates derived from such publications and reports and management’s knowledge of, and experience in, the markets in which MEG operates. Government and industry publications and reports generally indicate that they have obtained their information from sources believed to be reliable, but do not guarantee the accuracy and completeness of their information. Often, such information is provided subject to specific terms and conditions limiting the liability of the provider, disclaiming any responsibility for such information, and/or limiting a third party’s ability to rely on such information. None of the authors of such publications and reports has provided any form of consultation, advice or counsel regarding any aspect of, or is in any way whatsoever associated with, MEG. Further, certain of these organizations are advisors to participants in the oil sands industry, and they may present information in a manner that is more favourable to that industry than would be presented by an independent source. Actual outcomes may vary materially from those forecast in such reports or publications, and the prospect for material variation can be expected to increase as the length of the forecast period increases. While management believes this data to be reliable, market and industry data is subject to variations and cannot be verified due to limits on the availability and reliability of data inputs, the voluntary nature of the data gathering process and other limitations and uncertainties inherent in any market or other survey. Accordingly, the accuracy, currency and completeness of this information cannot be guaranteed. None of MEG, its affiliates or the underwriters has independently verified any of the data from third party sources referred to in this presentation or ascertained the underlying assumptions relied upon by such sources. INVESTOR PRESENTATION 2014 3

Realizing the Potential
• Targeted 2014 annual production volumes of 60,000 – 65,000 barrels per day (bpd), more than 85% above 2013 guidance, driven by the ramp-up of Christina Lake Phase 2B, building to near-term targets of 80,000 bpd by early 2015
• Ongoing reservoir and plant efficiency measures, supporting a non-energy operating cost target of $8 to $10 per barrel in 2014
• Investing in major “brownfield” expansion within Phase 2B, which is anticipated to increase overall production to a level of 115,000 to 125,000 bpd by early 2017, resulting in approximately a 45% compounded annual growth over the next three years
• Investing in technology and infrastructure that enable access to the highest-priced markets in the most cost-effective manner
INVESTOR PRESENTATION 2014 4
2014 and beyond

High Quality 100%-Owned Oil Sands Assets 2.9 billion barrels 2P and 3.7 billion barrels contingent resources* identified to-date
Christina Lake Phase 1, 2 and 2B currently in production 2014 production guidance 60,000 to 65,000 bpd Regulatory approvals in place for 210,000 bpd
2P Reserves.............................................. 2,260 MMbbls Contingent Resources*............................... 946 MMbbls 2P Reserves PV-10%................................... $18,991 MM Resources* PV-10%...................................... $3,320 MM Lease Holdings……………………………………….. 51,200 acres
Surmont Submitted regulatory application in 2012 for 120,000 bpd, multi-phased project
2P Reserves ................................................ 637 MMbbls Contingent Resources*............................... 404 MMbbls 2P Reserves PV-10%..................................... $2,031 MM Resources* PV-10%...................................... $3,302 MM Lease Holdings .......................................... 20,480 acres
Growth Properties Contingent Resources*............................ 2,303 MMbbls Resources* PV-10% ..................................... $7,386 MM Lease Holdings – Evaluated...................... 218,240 acres Lease Holdings – Unevaluated................. 330,880 acres
* Best-estimate contingent resources Based on GLJ Reserve Report dated effective as of December 31, 2013. Present values of estimated future net cash flows do not represent the fair market value of reserves or resources.
Christina Lake
Surmont
Growth Properties
INVESTOR PRESENTATION 2014 5

Geology Confirms High Quality Reservoirs
Core hole drilling identifies similar characteristics at Christina Lake and Surmont
INVESTOR PRESENTATION 2014 6
Average Pay Thickness
(metres)
Bitumen Saturation
(%)
Porosity (%)
Permeability (millidarcies)
Christina Lake Phase 1 26 72 34 3,000 - 7,000
Christina Lake Phase 2 25 80 34 3,000 - 7,000
Christina Lake Phase 2B 28 75 33 3,000 - 7,000
Christina Lake Phase 3A 23 79 32 3,000 - 7,000
Surmont 26 76 34 3,000 - 7,000

RISER Initiative and Benefits
The RISER initiative focuses investment on projects which are expected to generate the highest returns and lead to near-term production and cash flow gains
Overview • Employ proprietary technology to reduce steam-oil ratios (“SOR”)
and enhance recovery • Redeploy freed-up steam and debottleneck facilities to increase
production from existing assets
INVESTOR PRESENTATION 2014 7
Anticipated Benefits • Lower capital cost • Lower operating costs • Higher production • Higher recoveries • Lower greenhouse gas emissions RISER and related brownfield expansion to drive medium-term production target of 115,000 to 125,000 bpd by early 2017.

-
0.5
1.0
1.5
2.0
2.5
3.0
Mar-11 Jun-11 Sep-11 Dec-11 Mar-12 Jun-12 Sep-12 Dec-12 Mar-13 Jun-13 Sep-13 Dec-13 Mar-14
eMSAGP Pilot Performance
Phase 1 pilot achieved an average SOR of 1.3 in 1Q14 Steam injected during 1Q14 averaged roughly 55% less than when eMSAGP was implemented in January 2012, with only a nominal decline in the production volume trend
Christina Lake Pad A
Infill wells NCG/steam co-injection
Stea
m-O
il Ra
tio
INVESTOR PRESENTATION 2014 8
Phase 1
A1
A2
A3
NCG injection/infill wells fully implemented

INVESTOR PRESENTATION 2014
Anticipate doubling of production over the next three years, driven by continued RISER implementation and Phase 2B brownfield expansion
*Graph is for illustrative purposes only
9
Significant Medium-Term Production Growth
Funding and infrastructure build-out completed to meet near-term 80,000 bpd production target by 2015

Strong Cash Operating Netbacks Low-cost structure delivers high netbacks despite volatile differentials
INVESTOR PRESENTATION 2014 10
Business Environment 2013 1Q14
WTI US$/bbl 97.96 98.68
AECO C$/mcf 3.16 5.69
FX C/US$ 1.03 1.10
Differential – WTI/Blend % 33% 29%
Diluent price – % of WTI 109% 98%
Netbacks Blend sales 67.88 76.96
Cost of diluent (18.60) (14.68)
Bitumen realization 49.28 62.28
Transportation (0.26) (0.67)
Royalties (3.14) (4.47)
Operating costs – non-energy (9.00) (9.05)
Operating costs – energy (4.62) (8.43)
Power sales 3.61 3.85
Cash operating netback 35.87 43.51
C$ per barrel unless specified

Marketing Strategy MEG’s Hub & Spoke strategy focuses on diversifying market access, bypassing pipeline congestion to get to world-priced markets
Hub • 50% owned Access Pipeline
will be expanded in 2014 to meet production growth beyond 2020
• Dual dilbit/condensate pipeline
• 100% owned Stonefell Terminal (900,000 barrels storage facility)
Pipelines • PADD II accessible via existing pipelines • PADD III accessible via secured capacity on
Flanagan/Seaway expected 2H14
Rail • Direct pipe-to-rail connection
from Stonefell to 3rd party rail-loading terminal
• Broad access to North American markets
Barge • Pipe-to-barge access to
U.S. Gulf Coast and Louisiana
INVESTOR PRESENTATION 2014 11
HUB

Marketing Development Hub and Spoke Strategy To access the highest-value markets
INVESTOR PRESENTATION 2014 12
Hub & Spoke Strategy
To access the highest-value
markets

2014 Capital Budget and Operational Guidance
INVESTOR PRESENTATION 2014 13
Capital Investment Summary $ millions Intraphase Growth – RISER 2B 340
Portfolio Growth Christina Lake Phase 3A 275 Resource development 115 Growth infrastructure 85 Enhancements and other 105 Marketing Initiatives Access expansion 210 Diluent Removal Facility 75 HI-Q Field Demonstration Project 125 Other 35 Sustaining and Maintenance 135
Other 100
Base Capital Program 1,600 Discretionary capital
200
Base + Discretionary Capital 1,800
Operational Guidance Production
2014 Budget 60,000 to 65,000 bpd
YTD Actual 58,643 bpd
Non-Energy Operating Costs
2014 Budget $8 to $10 per bbl
YTD Actual $9.05 per bbl
2014 capital investment will fund growth beyond near-term 80,000 bpd target
Financing Philosophy
Conservative principles provide flexibility through various market conditions
• Pre-funding of major capital programs
• Maintain significant liquidity at all times
• All debt is covenant-lite in structure
• Internal funding capability increases significantly over the next few years
• Debt maturities aligned to long-term nature of growth strategy
14 INVESTOR PRESENTATION 2014

Financial Snapshot
Liquidity As of March 31, 2014
Cash and cash equivalents 0.89
Undrawn line of credit 2.00
Letters of credit outstanding (0.12)
2.77
Outstanding Debt Senior secured term loan due 2020 1.41
6.5% Senior unsecured notes due 2021 0.83
6.375% Senior unsecured notes due 2023 0.88
7.0% Senior unsecured notes due 2024 1.11
4.23
Book Value of Equity 4.71
15 INVESTOR PRESENTATION 2014
In C$ billions, assume US$1 = C$1.1053 S&P ratings on MEG’s outstanding debt are BBB- and BB for the senior secured term loan and our three senior unsecured notes respectively, as of March 31, 2014.
Moody’s ratings on MEG’s outstanding debt are Ba1 and B1 for the senior secured term loan and our three senior unsecured notes respectively, as of March 31, 2014.

Debt Maturity Schedule
No debt maturity until 2020
* Projected amortized term loan balance at maturity in 2020. The term loan amortizes at $13 million per year.
16 INVESTOR PRESENTATION 2014
US$ in millions
Term loan* Senior unsecured notes
$1,197
$750 $800
$1,000
2014 2015 2016 2017 2018 2019 2020 2021 2022 2023 2024 2025
*

APPENDICES
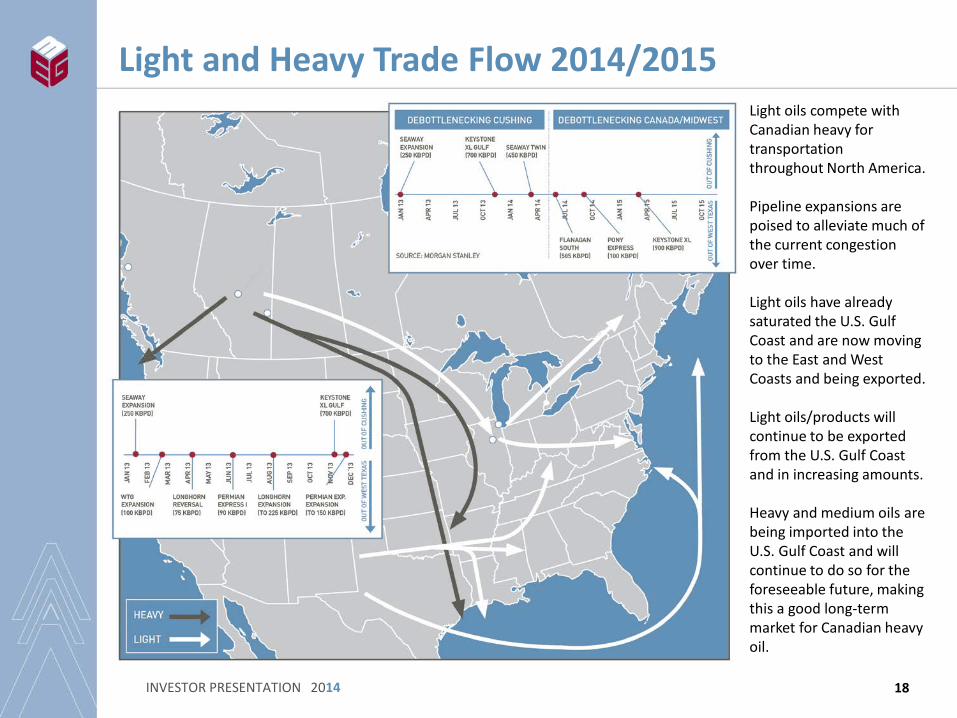
Light and Heavy Trade Flow 2014/2015
18 INVESTOR PRESENTATION 2014
Light oils compete with Canadian heavy for transportation throughout North America. Pipeline expansions are poised to alleviate much of the current congestion over time. Light oils have already saturated the U.S. Gulf Coast and are now moving to the East and West Coasts and being exported. Light oils/products will continue to be exported from the U.S. Gulf Coast and in increasing amounts. Heavy and medium oils are being imported into the U.S. Gulf Coast and will continue to do so for the foreseeable future, making this a good long-term market for Canadian heavy oil.

19 INVESTOR PRESENTATION 2014
Pipeline Expansions to Access Existing Refining Capacity for Heavy Oil
New graphic coming - 540 KBPD for TMX and 200 KBPD for Western Canada Refining Capacity
Canadian heavy oil is expanding rapidly, as is U.S. light non-conventional oil production. There is capacity on the U.S. Gulf Coast to handle all increases in Canadian heavy oil production well beyond 2020. In addition to the U.S. Gulf Coast, alternate markets via offshore West and East Coast Canada are being developed to increase market optionality for Canadian heavy.

Enhanced Modified Steam and Gas Push (eMSAGP)*
A combination of proven technologies to reduce SOR • Non-condensable gas (NCG) and infill wells are proven technologies,
typically carried out as a wind-down process after 6 - 8 years of SAGD operations
• Early application of eMSAGP has the potential to significantly reduce SORs while accelerating bitumen production and increasing ultimate recoveries
*Steam and Gas Push (SAGP) was invented by the late Dr. Roger Butler, who also invented the SAGD process.
20 INVESTOR PRESENTATION 2014

Christina Lake Delineation Wells
78 delineation wells to be drilled during the winter of 2014
Christina Lake 80 sections 884 vertical wells drilled to Dec. 31st 2013 751 wells cored to Dec. 31st 2013
21 INVESTOR PRESENTATION 2014
Phase 2
Phase 3A
6 Miles
Wabiskaw / McMurray cores 2014 delineation wells
Phase 1
Phase 2B
CVE Christina Lake
MEG Oil Sands Leases

Surmont Delineation Wells
12 delineation wells to be drilled during the winter of 2014
South Surmont 25 sections 130 vertical wells drilled to Dec. 31st 2013 81 wells cored to Dec. 31st 2013
Wabiskaw / McMurray cores 2014 delineation wells
22 INVESTOR PRESENTATION 2014
5 miles
MEG Oil Sands Leases

Comparing Crudes – Wells to Wheels
SAGD with cogeneration produces one of the lowest greenhouse gas intensity barrels in the industry
*Source: Jacobs Consultancy, “Life Cycle Assessment of North America and Imported Crudes” July 2009.
Uni
t Mea
sure
men
t (g
/MJ)
Kern
Riv
er,
Calif
orni
a
Bonn
y Li
ght,
Nig
eria
Mar
s,
Gul
f Coa
st
May
a,
Mex
ico
Bach
aque
ro,
Vene
zuel
a
Kiru
k,
Ira
q
Arab
Med
ium
, Sa
udi
SAG
D Di
lbit
SOR
3.0
SAG
D Di
lbit
SOR
2.4
with
Cog
en
114 106
104 102 102 102 98
105
96
23 INVESTOR PRESENTATION 2014
Conventional* In Situ Unconventional*

Notes:
INVESTOR PRESENTATION 2014 24

John Rogers VP, Investor Relations and External Communications 403.770.5335 [email protected]
Investor Relations Contacts
www.megenergy.com/investors
Helen Kelly Director, Investor Relations 403.767.6206 [email protected]