realization of a multi-sensor framework for process
TRANSCRIPT
1
Realization of A Multi-Sensor Framework for Process Monitoring of
the Wire Arc Additive Manufacturing in Producing Ti6Al4V Parts
Fangda Xua, Vimal Dhokia
a, Paul Colegrove
b, Anthony McAndrew
b,d,
Stewart Williamsb, Andrew Henstridge
c, Stephen T. Newman
a
a Department of Mechanical Engineering, University of Bath, Bath, UK
b Welding Engineering and Laser Processing Centre, Cranfield University, Cranfield, UK
c Airbus AGI, Filton Bristol, United Kingdom
d TWI Ltd, Granta Park, Great Abington, Cambridge, UK

2
Realization of A Multi-Sensor Framework for Process Monitoring of
the Wire Arc Additive Manufacturing in Producing Ti6Al4V Parts
Wire arc additive manufacturing (WAAM) is arc welding based additive
manufacture which is providing a major opportunity for the aerospace industry
to reduce buy-to-fly ratios from 20:1 with forging and machining to 5:1 with
WAAM. The WAAM method can build a wide range of near net shapes from a
variety of high grade (metallic) materials at high deposition speeds without the
need for costly moulds. However, current WAAM methods and technologies are
unable to produce parts reliably and with consistent structural material
properties and required dimensional accuracy. This is due to the complexity of
the process and the lack of process control strategies. This paper makes a brief
review on monitoring methods that have been used in WAAM or similar
processes. The authors then identify the requirements for a WAAM monitoring
system based on the common attributes of the process. Finally, a novel
multi-sensor framework is realised which monitors the system voltage/current,
part profile and environmental oxygen level. The authors provide a new signal
process technique to acquire accurate voltage and current signal without random
noises thereby significantly improving the quality of WAAM manufacturing.
Keywords: Process Monitoring; Additive Manufacturing; Welding; Quality
Measurement
1 Introduction
Over the past 30 years, Additive Manufacturing(AM) technology has been continually
developing. From its original applications using polymers for prototype parts it is now
being used as a process for generating near net shaped metal components with
increasing levels of complexity. These new AM processes enable components to be

3
designed and manufactured with complex internal structures from snake like ducting to
highly dematerialized lattices (Hussein et al. 2013).
Today, AM has the largest growth rate of any manufacturing process with
predictions of its value estimated to be over $30 Billion by 2022 (Wohlers Report,
2016). In metal AM, the most common form is powder bed fusion (PBF) technology,
which accounts for the large majority of components produced. However, new forms of
metal AM technology are still emerging, especially in the Direct Energy
Deposition(DED) subset (Frazier, 2014). This paper focuses on an emerging DED
process, namely, Wire Arc Additive Manufacturing (WAAM) which is emerging as a
new method to manufacture large scale structures.
As a newly emerging AM technology, WAAM has a number of technical issues
that must be overcome to enable the production of reliable, quality assured components.
One of the major technical issues is the need for robust process control and monitoring
to enable consistent deposition. Everton et al. (2016) compiled a comprehensive review
on metal AM process monitoring, but it is mainly on powder-bed fusion (PBF), as there
is limited literature related to WAAM process monitoring and control. In this paper, the
authors describe the design and realization of an in-situ multi-sensor system, entitled
iMUST, for a WAAM machine specifically for large component manufacture (up to
1.5m in length). The aim of this research is to investigate the capability of the WAAM
system in producing reliable, repeatable WAAM components.
The rest of this paper is organized as follows. Section 2 provides a review on
WAAM together with its process monitoring & control. Section 3 describes the design

4
of a monitoring system for WAAM, with section 4 outlining the realization of the actual
system. A series of analysed results from iMUST are presented in section 5. The final
sections discuss the results together with conclusions and future work.
2 Review on WAAM and its process monitoring & control
The following review consists of two parts. The first part describes the state of the art of
WAAM in comparison with similar wire-DED techniques including laser-based and
electron-beam based wire DED techniques. The second part describes the monitoring
methods that have been used in WAAM and similar process.
2.1 Overview for WAAM
BS ISO/ASTM 52900 (BSI, 2015) classifies additive manufacturing into seven types.
Of these seven types, four of them can be used for metal, namely Binder Jetting, Sheet
Lamination, Powder Bed Fusion (PBF) and Directed Energy Deposition (DED). The
other three types, namely VAT Photopolymerisation, Material Jetting and Material
Extrusion are mainly used for polymer printing. WAAM belongs to the Direct Energy
Deposition(DED) family. By definition, DED is a series of processes using focused
thermal energy to fuse and melt metal feedstock as being depositing (BSI, 2015).
Depending on the form of the feedstock, DED is categorized into powder-DED and
wire-DED.
Wire-DED mainly has three types of heat source, namely laser based,
electron-beam based, and arc based. Arc-based wire-DED can also be described as wire
arc additive manufacturing (WAAM). In terms of the working principle, these three

5
types of techniques have no major differences. They all originate from welding
techniques, and all use the principles of welding to generate a melt pool. However, their
working requirements and energy transfer efficiencies are different.
Laser-based wire-DED is the most widely adopted due to its precision (Ding et
al. 2015). The main weaknesses of laser based wire-DED is the high price of the
high-power laser source and the low energy transfer efficiency (less than 10%) (Unocic
and DoPont 2004). For some high reflective material, such as copper and aluminium,
the energy efficiency of the laser based process could be as low as 2% (Taminger and
Hafley 2003).
In 2007, researchers at NASA Langley Research Centre invented a new
technique named Electron Beam Freeform Fabrication (EBF3), which can fabricate
reflective material with high energy usage (Taminger et al. 2007). The inventors,
Taminger and Robert (2004) claimed that EBF3 can achieve 95% power efficiency, and
nearly 100% feedstock consumption efficiency. However, EBF3 also has its own
weakness, the intrinsic property of e-beam melting. Consequently, EBF3 is limited to
run in a vacuum chamber. This makes EBF3 less flexible. In addition, the EBF3
machine is relatively expensive due to the high price of its high-power electron beam
source.
WAAM is a largely promising welding-based deposition technique due to its
simplicity and high efficiency of metal transfer. It applies an arc welder as its heat
source to melt metal wire which can then be deposited. DuPont and Marder (1995)
conducted a series of experiments and found that the power efficiency of arc welding

6
varies between 40% to 90%. Considering the relatively low cost of the general arc
welding system (around £30k, by Williams, et al. 2016) and the high-power efficiency,
WAAM is very competitive compared to other techniques.
Typically, a WAAM system consists of four parts, i) an arc welder, ii) a motion
platform, iii) a wire feeder, and iv) a PC or an integrated control board (Ding et al.
2015). Additionally, to prevent the part from oxidisation, either a sealed chamber with a
protection gas or a localised shielding gas need to be applied. Furthermore, to monitor
and control the system performance, a monitoring system is required.
Three types of welding technology are commonly applied in WAAM processes,
namely gas metal arc welding (GMAW), gas tungsten arc welding (GTAW) and
plasma arc welding(PAW) (Ding et al. 2015). These three types of arc welder require
the application of high voltages between the electrode and workpiece to generate a
sufficiently high temperature plasma arc to melt the metal. The three types of arc
welder are illustrated in Figure 1. In Figure 1a a GMAW welder nozzle uses a
consumable metal wire as an electrode. Metal wire is fed into the molten pool and later
consolidated on the base plate or lower layer. To avoid oxidation in the melt pool area,
the shielding gas is inserted and carried through the outer casing tube around the nozzle
as detailed in figure 1a.
In Figure 1b./1c GTAW and PAW welders apply inconsumable tungsten
electrodes and separately inserted feedstock. Apart from the feeding pattern, the
GTAW welder is essentially the same as the GMAW welder. PAW can be considered
as an upgraded version of GTAW. It applies an extra outer tube inserting gas to

7
constrain the high temperature plasma torch. Through this approach, PAW can achieve
a high-power density and temperature torch, which is estimated to be in excess of
11000K, whereas GTAW and GMAW torches are in the region of 7000K (Wu et al.
2014). To avoid the deposited metal becoming oxidized in the high temperature
environment, all three types of welding methods insert shielding gas around the torch as
shown in Figure 1.
Figure 1. Different Types of Welding Techniques (1a. Gas Metal Arc Welding, 1b. Gas
Tungsten Arc Welding, 1c Plasma Arc welding (Ding et al. 2015))
1a 1b
1c

8
The typical working power of these arc welders varies from 3kw to 15kw
(DuPont and Marder, 1995). The high power enables WAAM to achieve a high
deposition rate which can be in excess of 10kg/h. With superior deposition rates,
WAAM can build a large-scale component within several days (Martina et al. 2015).
Additionally, WAAM affords a greater degree of flexibility in terms of the component
size, since it is not limited by a specifically sized powder-bed (compared to PBF). By
using a moving robotic arm platform, it is theoretically possible to build any size
component. Recently, Cranfield University built a 6-meter-length, 300kg,
aerospace-grade aluminium component, one of the largest 3D printed components built
to date (Cranfield University, 2016). With the potential to build large components,
WAAM has attracted considerable attention from the aerospace sector (Reuter, 2017,
Wohlers report 2016). In 2010, Baufeld et al. conducted a series of experiments to
examine the microstructure and the mechanical properties of titanium alloy
components produced by shaped metal deposition (SMD, a type of WAAM process).
The results showed SMD parts have a high strength and ductility with ultimate tensile
strength varying between 929 and 1014 MPa compared to cast and wrought material.
Baufeld et al. (2012) concluded that SMD components can attain material properties
suitable for aerospace and space applications. As many research studies have begun to
identify the potential of wire-DED, a growing number of industrial and academic
groups are increasing their efforts in this rapidly growing area.
As the industrial growth of WAAM increases (25.9% annually, Wohlers report
2016), particularly in the aerospace sector, the need to achieve a stable and precisely

9
controlled process is becoming more imperative. To achieve this, the first requirement
is to obtain a precise description of the WAAM process. From a monitoring prospective,
WAAM is a complex non-linear, time-variant process with multiple variables. Several
researchers have made considerable contributions to this area and this is detailed in the
following section.
2.2 Review for WAAM process monitoring
WAAM is an emerging AM technology with many technical challenges such as, high
levels of inbuilt residual stress, distortion and poor geometrical and feature accuracy.
Effective monitoring and control of the WAAM process is necessary for enabling
consistent and accurate component generation.
From a technology viewpoint, WAAM is similar to conventional welding. The
authors have adapted a classification of welding monitoring parameters by
Węglowski(2012) to WAAM monitoring, as shown in Figure 2. Under this proposed
classification, there are two types of methods/parameters. The first type of parameters
are traditional parameters which are monitored in most welding-related applications,
including arc voltage, arc current, wire feed rate, welder moving speed and shielding
gas flow. These parameters are associated with the system itself instead of the
component. For example, arc voltage and arc current are used to monitor the heat input
condition as demonstrated by the research undertaken by DuPont and Marder (1995).
The shielding gas flow is used to ensure that the inert gas quantity is sufficient to
10
prevent the part from oxidation. The welder moving speed and wire feeding rate are
used to monitor the deposition rate per minute (Xiong et al. 2017).
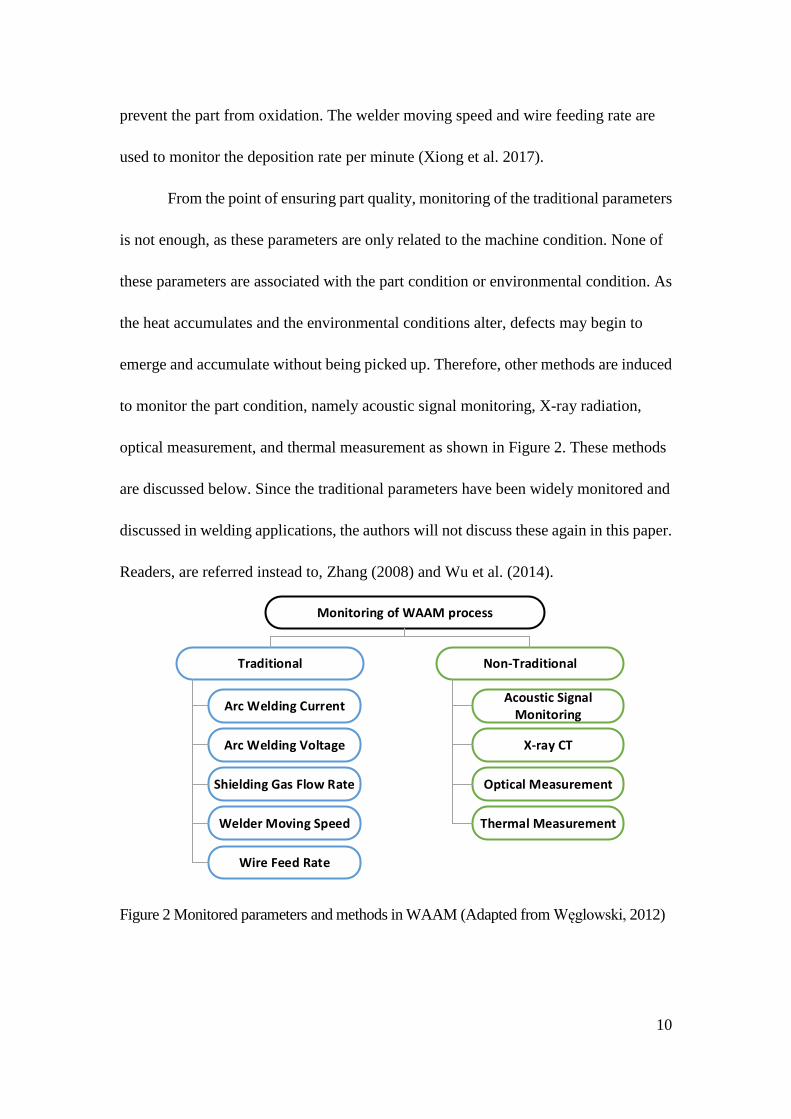
From the point of ensuring part quality, monitoring of the traditional parameters
is not enough, as these parameters are only related to the machine condition. None of
these parameters are associated with the part condition or environmental condition. As
the heat accumulates and the environmental conditions alter, defects may begin to
emerge and accumulate without being picked up. Therefore, other methods are induced
to monitor the part condition, namely acoustic signal monitoring, X-ray radiation,
optical measurement, and thermal measurement as shown in Figure 2. These methods
are discussed below. Since the traditional parameters have been widely monitored and
discussed in welding applications, the authors will not discuss these again in this paper.
Readers, are referred instead to, Zhang (2008) and Wu et al. (2014).
Figure 2 Monitored parameters and methods in WAAM (Adapted from Węglowski, 2012)
Monitoring of WAAM process
Traditional Non-Traditional
Arc Welding Current
Arc Welding Voltage
Shielding Gas Flow Rate
Welder Moving Speed
Wire Feed Rate
Acoustic Signal Monitoring
X-ray CT
Optical Measurement
Thermal Measurement

11
2.2.1 Acoustic signal monitoring
Acoustic signal monitoring is often referred to as sound intensity monitoring.
The acoustic signal in the WAAM process comes from the pulsation of the plasma arc
and the variation of the weld pool metal (Wang & Zhao, 2001). As shown in Figure 3,
Polajnar et al. (2013) developed a WAAM process monitoring system which can
monitor all traditional parameters and the sound intensity around the arc. A sound
intensity monitoring result is shown in Figure 4, where an acoustic signal is illustrated
with the welding current signal and the real component (Polajnar et al. 2013). It is clear
to see that when the irregular bead occurs there is a reflection on the acoustic signal and
current signal. Chen et al. (2010) argued that sound intensity can directly reflect the
energy variation of the process. As most defects are related to energy variation acoustic
signal analysis is widely used in features and defect recognition. Pal et al. (2010)
employed an acoustic signal in identifying the metal transfer mode. Chen et al. (2010)
applied a weighted mean method to estimate the arc length from welding voltage and
sound intensity.
Figure 3 Integrated Process parameters monitoring system (Polajnar et al. 2013)

12
Figure 4. Acoustic signal analysis for a single pass welding (Polajnar et al 2013)
2.2.2 X-ray CT monitoring
With AM components there is often a need to examine the internal structure to
understand its integrity and composition. Thompson et al. (2016) constructed a review
on X-ray CT for AM and argued that X-ray CT is currently the best method to measure
the internal features because of its volumetric nature. X-ray CT can form a 3D
representation of an object with its internal features by capturing many x-ray images
around an axis of rotation.
In several papers (Thompson et al. 2016, Kerckhofs et al. 2013, Slotwinski et al.
2014) X-ray CT is used as a post-process measurement method to analyse component
build consistency per layer and overall welding quality. The Welding Institute (TWI)
conducted an in-situ digital radiography monitoring system to monitor the
microstructure of built components in the project entitled, Quality Control of
Aluminium and Copper Laser-welded Assemblies (QCOALA). The authors discovered
that X-ray CT can be applied as an online measurement sensor. As shown in Figure 5,

13
considering the radiation property of the X-ray device, in most cases X-ray CT is
applied as a post-process non-destructive measurement method. For more precise
crystal structure measurement, the scanning electron microscope is widely applied
(Martina et al. 2015).
Figure 5 Digital radiography device in a wire laser additive manufacturing system from
TWI Project Quality Control of Aluminium and Copper Laser-welded Assemblies
(QCOALA)
2.2.3 Optical Signal Monitoring
The WAAM process is used to build near net-shaped components that do not require a
high degree of precision, but consistent layer height and layer width which are
important to both the path planning strategy and component quality. Specifically, layer
profile, layer height and layer width are three major factors for enabling optimal part
generation. Xiong et al. (2013) applied two CCD cameras to monitor the height and
width for a WAAM process. By applying a band-filtering lens and an image processing
algorithm, they were able to filter out the intensive torch light. By applying an edge

14
detection algorithm with the Sobel filter, Xiong et al. (2013) successfully extracted the
layer width as shown on the right of figure 6. The height was also extracted with a
similar strategy. Heralić (2012) applied a similar CCD camera set-up and another
infrared camera to detect layer height and width in wire laser additive manufacturing.
In addition, Lü et al. (2010) applied a camera to monitor the molten pool conditions
such as, molten pool profile and molten pool height.
Figure 6 Set-up for layer height & width monitoring (Xiong et al. 2016)
2.2.4 Thermal Signal monitoring
For the WAAM process, a major defect that may occur is structural distortion caused by
excessive heat input (Ding et al. 2015). There is still a lack of online detection methods
for structural analysis as the base plate of the part is clamped to the machine bed. The
quantity of distortion is only evident once the base plate is released as shown in figure
7.

15
Figure 7 Structural distortion of a WAAM part
Lin et al. (2016) and Bai et al. (2013) revealed that the cooling rate can affect
the crystal structure, and the residual stress, which eventually leads to structural
distortion. Thus, measuring the cooling rate or the thermal history is commonly applied
as mentioned by Everton et al. (2016) in their metal AM metrology review paper.
Typically, the thermal condition of the part is monitored by a pyrometer or a thermal
camera. Almeida and Williams (2010) applied a pyrometer to measure the temperature
difference between layers. Mireles et al. (2013) applied an infrared camera to measure
the temperature variation in electron beam based wire-DED. They also tried to apply
feedback control to minimise the temperature difference between layers as this measure
might decrease the distortion.
2.3 Critique of the Literature
The authors have identified six major types of defects in in the WAAM produced
components, namely, i) residual stress, ii) structural distortion, iii) cracking, iv) lack of
fusion, v) porosity, and vi) thermal dissipation. Of these six types, residual stress,
structural distortion and thermal dissipation are associated with thermal history (Ding
et al. 2011; Colegrove et al. 2013; Xiong et al. 2016). The lack of fusion and porosity

16
are related to process parameters (Heralić 2012; Cong et al. 2014). Cracks are normally
associated with residual stress (Jhavar et al. 2014).
Thermal dissipation is normally monitored by a pyrometer and thermal camera
(Almeida and Williams, 2010). The lack of fusion, porosity and cracking are normally
accompanied with relatively high energy variation (Heralić, 2012). An acoustic sensor
can measure the energy variation during the welding process. By applying a feature
classification algorithm, such as a neutral network (Pal et al. 2010) or fuzzy logic
algorithm (Yu et al. 2013), defects such as porosity, cracking together with the lack of
fusion have been identified.
From the literature review, five major goals for WAAM monitoring have been
recognized, namely; i) cooling rate, ii) molten pool condition, iii) geometric shape, iv)
working proof and v) structural defects (Lack of fusion, porosity and cracks). Different
methods are applied to measure these properties and are shown in table 1. Though many
researchers, for example Xiong et al. (2013), Ding et al. (2015), and Bai et al. (2013)
have proposed monitoring systems for WAAM technologies, there is still a lack of a
systematic monitoring method for potentially closed loop feedback controlled WAAM
process. Based on these findings, the authors propose a WAAM monitoring system
specifically for the unique requirements of large component WAAM manufacturing.
Table 1 Comparison of Measurement method
Traditional Optical Thermal Acoustic X-CT
Cooling Rate ●
Molten pool condition ● ●
Geometric Shape ●
Working proof ● ● ●
Structrual defects ● ● ● ● ●

17
3 In-situ Multi-Sensor System Model for monitoring the WAAM process
Based on the findings from the literature review in section 2, the authors will propose
an in-situ multi-sensor system model with the aim to acquire information on the
WAAM process. The model is divided into five layers as shown in Figure 8, namely the
sensor layer, the signal layer, the data layer, the decision-making layer and the output.
The sensor layer contains all physical devices and the signal layer collects the
raw signal from the sensors. Since the raw signal cannot directly reflect what is
happening in the WAAM process, an additional data processing procedure is needed. In
the data layer, data processing algorithms are applied to extract effective data which
might be used as process indicators or even feedback for further process control. As
shown in figure 8, in the feature layer, five types of factors are illustrated, namely,
defects, feature data will be passed to the decision-making layer which will adjust the
process parameters to improve the quality of the depositions. With each specific
deposition, the online monitoring system will be modified based on each individual
case.
Welder Traveling Speed
Wire Feed Speed
Rolling Pressure
Arc Current
Arc Voltage
Thermal Dissipation
Infrared Thermal Sensor
Electrical Sensor
Acoustic Sensor
Optical Sensor
Equipment Build-in Interface
Shielding Gas Flow
Oxygen Concentration Level
Instant Part Profile
Others
Acoustic Energy Varation
Signal Layer Feature Layer
Molten Pool Monitoring
Defects
Bead Geometry
Cooling Rate
Working Proof
Molten Pool Condition
WAAM Control Strategy
Model
Decision-Making LayerSensor Layer
Recommended Process
Parameters
Output

18
Figure 8 Schematic diagram of Full State Monitoring System for WAAM
4 Realization of the WAAM Monitoring & Experiment Set-up
To demonstrate the viability of the proposed method and setup, the realization of an
in-situ multi-sensor monitoring system (iMUST) has been developed for a large scale
WAAM machine. The WAAM machine is based on a retrofitted CNC machine with a
table size of 5m × 3m. Readers are referred to the High Value Engineering (HiVE)
machine in Colegrove et al. (2016) for detailed information of the machine. As shown
in Figure 9b, a plasma welder and a roller are mounted on the HiVE machine. The roller
reduces the part distortion and releases the residual stress by rolling each layer after
deposition (Colegrove et al. 2014). The HiVE machine is controlled by a Fanuc 30i-A
board which enables acquisition of the position data of the plasma head and the roller
from its internal API.
Figure 9a HiVE machine used for WAAM process; 9b Schematic of WAAM system
with rolling (Colegrove et al. 2016)

19
4.1 Realization of the iMUST monitoring system
4.1.1 System structure
The structure of iMUST is illustrated in Figure 10. It incorporates three layers, which
are the PC layer, data acquisition layer and physical sensor layer, which corresponds to
the feature layer, signal layer and sensor layer in the system model. The structure in
Figure 10 does not incorporate a decision-making layer, since it is only a monitoring
system.
As shown in figure 10, different communication protocols are applied in the
iMUST system, as detailed further in section 4.1.2. These protocols are applied
according to the different interfaces of the sensors and are not intentionally selected in
advance. Considering the compatibility to different protocols, a National Instruments
PXI Chassis was applied as it provided different modules and communication interface
for different protocols. NI Labview has been utilized as the programming platform for
iMUST due to the convenience of its graphical programming interface and its
multi-thread high-speed acquisition capacity.
iMUST can collect 8 types of data, including temperature of each layer,
shielding gas flow, wire feed speed, arc current, oxygen concentration, part outlier
geometry, arc voltage and welder moving speed. As shown in figure 10, there is no
sensor specifically for arc voltage and welder moving speed. This data is collected from
the Fronius built-in interface and FANUC controller built-in interface.

20
Figure 10 The WAAM monitoring system for the HiVE machine
4.1.2 Specification of Sensors
The specification of all sensors is listed in table 2. The output of the pyrometer, the
shielding gas flow sensor, the wire-feed speed sensor and the Hall current sensor are all
linear voltage signals corresponding to their working range. These signals are collected
through a NI PXI Analog to Digital(A/D) module.
The pyrometer was initially applied to measure the part temperature before and
after rolling. However, the cooling process was rapid compared to the relatively slow
depositing speed. Normally, the part is cooled to room temperature before rolling. Thus,
the pyrometer was later used as a method to measure the part cooling rate. Its working
range is from 50~400℃, and its accuracy is 0.1℃. The output of this pyrometer is a 0~5
Volts signal corresponding to 50~400℃.
The wire feed speed sensor, current sensor and shielding gas sensor are a
customized sensor suite manufactured by Triton. The specification is shown in Table 2.
The output of all three sensors is the linear voltage signal which corresponds to each
sensor’s working range.
NI PXI Chasis
Keyence
Profilometer
Oxygen
Concentration
SensorWire-Feed Speed Sensor
FANUC Controller
Fronius Plasma
WelderHall Current Sensor
PyrometerShielding Gas Flow
Sensor
PC - Labview Multi-Thread Data Acquisition Program
Ethernet / Fanuc API
RS232Analog SignalAnalog Signal
Ethernet
DeviceNetEthernet

21
Kahveci and Welsch (1991) found that higher oxygen concentration results in
the transition of titanium alloy from ductile to brittle where the transition oxygen
concentration level is between 0.26 wt.% to 0.56 wt.%. Ding et al. (2015) showed that
the oxygen concentration level close to plasma torch is normally lower than 1000ppm
(0.1 wt.%). Therefore, a working range of 10~1000ppm was selected. The oxygen
concentration sensor signal is transmitted through an RS232 protocol to the NI RS232
module.
The arc voltage is acquired though the Fronius machine. The Fronius welder
transmits the signal through DeviceNet bus and registers the signal in a fixed position
of the FANUC controller. Then through FANUC Focas API library, the arc voltage
information can be acquired.
In the monitoring system, the position information, the roller pressure and the
arc voltage are all acquired through the FANUC controller API. FANUC provide an
embedded programmable interface called the Focas library. Through the interface, all
machine information written in the PLC memory can be acquired in real time, including
the G-code, machine identification and position information. The FANUC controller is
connected to the PC through an Ethernet cable. The recommended running frequency
of the acquisition process is lower than 100 Hz. In our case, the running frequency is
approximately 6Hz.
Table 2. Sensors Specification
Type Rated Working Range Accuracy
Pyrometer MicroEpsilon CTLM Series 50~400℃ 0.1 ℃
Wire Feed Speed Sensor Triton 0~12m/s 0.1 m/s
Current Sensor Triton 0~1000A 0.1 A
22
Shielding Gas Flow Triton 0~20 L/Min 0.25L/min
Oxygen sensor PurgEye 500 10~1000 ppm 1 ppm
Laser Profilometer Keyence -120 ~ +120 mm 5 µm
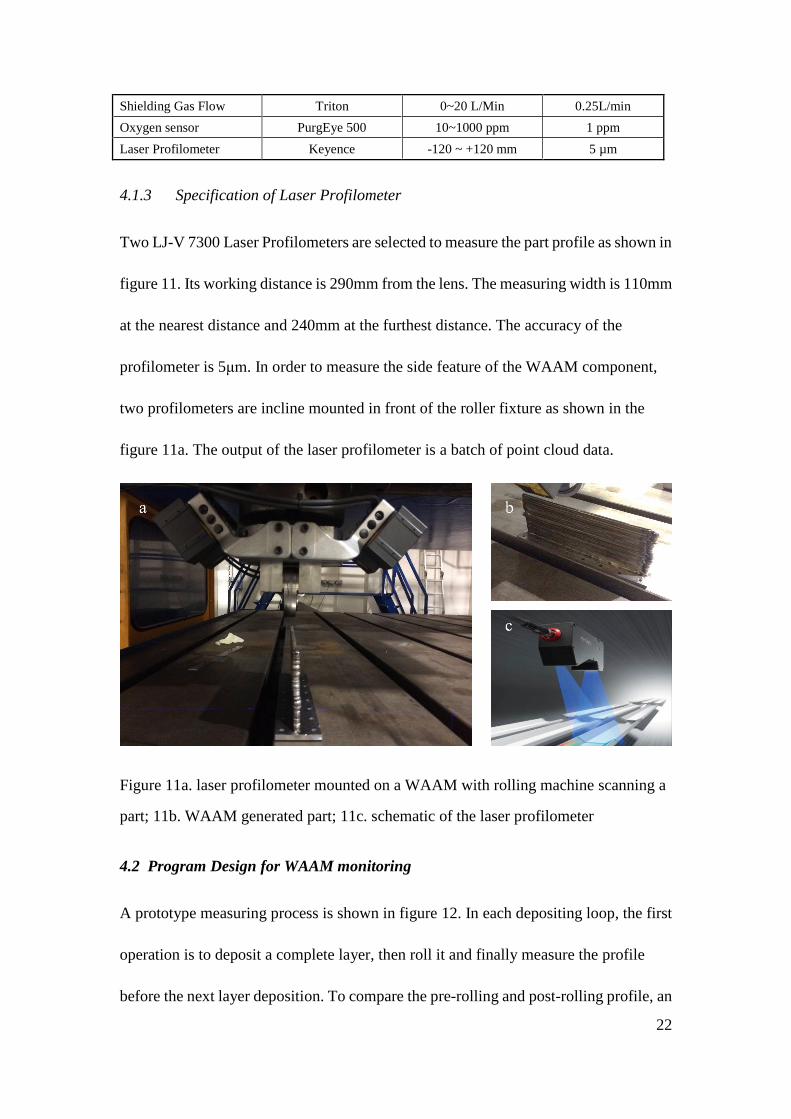
4.1.3 Specification of Laser Profilometer
Two LJ-V 7300 Laser Profilometers are selected to measure the part profile as shown in
figure 11. Its working distance is 290mm from the lens. The measuring width is 110mm
at the nearest distance and 240mm at the furthest distance. The accuracy of the
profilometer is 5μm. In order to measure the side feature of the WAAM component,
two profilometers are incline mounted in front of the roller fixture as shown in the
figure 11a. The output of the laser profilometer is a batch of point cloud data.
Figure 11a. laser profilometer mounted on a WAAM with rolling machine scanning a
part; 11b. WAAM generated part; 11c. schematic of the laser profilometer
4.2 Program Design for WAAM monitoring
A prototype measuring process is shown in figure 12. In each depositing loop, the first
operation is to deposit a complete layer, then roll it and finally measure the profile
before the next layer deposition. To compare the pre-rolling and post-rolling profile, an

23
additional measuring step will be conducted before rolling.
There are essentially two stages required for WAAM monitoring, in-deposition
monitoring and post-deposition monitoring. As shown in Figure 12, the bottom left
diagram is the in-process data acquisition model. Position information is used as a
primary index in each sample. Every 0.2s, all process data is recorded in a text file. In
the case of the same position being recorded in consecutive samples, the position
acquisition module runs slightly faster (6Hz) than the other modules. For the
post-depositing of the profile measurement, only profile data and position data are
recorded as shown in figure 12, bottom right. This was because all the other sensors
were designed for monitoring the deposition step other than profile measurement.
By using the position information as the primary index, the in-depositing data
and post-depositing data can be combined according to the position.
Figure 12 Schematic Diagram for iMUST Monitoring Process Results
5 Results & Discussion
Initial results from iMUST have been used for evaluating the performance of the
Oxygen
Concentration
Level (5Hz)
Absolute Position
Information
(6 Hz)
DepositingProfile Measurment
(Optional)
Process Log Data Structure
Rolling Profile Measurment
Next Layer
Profile Log Data Structure
Index · · · ·
Absolute Position
Information
(6 Hz)
Other signal
(Arc voltage,current,
etc) 5Hz
Left Laser
Profilometer
(5Hz)
Right Laser
Profilometer
(5Hz)
Index
Process Data Acquisition Profile Data Acquition

24
WAAM process with the HiVE machine. The following results relate to the WAAM
produced component profile, arc current and arc voltage. The wire feed speed was set to
2.4m/min. The oxygen concentration level was between 80ppm~200ppm. The
shielding gas was running at a constant rate of 10 L/min. The additional sensors are still
under investigation, but at present the oxygen sensor, shielding gas sensor and wire
speed sensor showed little variation in the measurement process. The purpose of the
oxygen sensor is to make sure the shielding gas is sufficient and that the system is
operating correctly.
5.1 Pointcloud Results from Laser Profilometer
As shown in figure 13, an initial result from a single laser profilometer is illustrated.
The raw data obtained from the laser profilometer is a batch of height data along the
cross-section of the part. A typical raw data sample is depicted in Figure 13b. One laser
profilometer can only obtain the feature from its own side due to the inclined setting of
the laser profilometers (See figure 11a). In order to capture a complete part shape, the
data from two different laser profilometers are combined.
Figure 13 a. Laser Scanning Point Cloud in comparison with real parts;
b. a cross-section frame of laser profilometer result;
Considering the noise in the data and the inclined set-up of the laser profilometer, a
600mm
20mm
b a
Unit: mm
Unit: mm

25
series of data processing procedures are needed. The standard procedure consists of six
steps as shown in figure 14.
Data Acquisition – Each laser profilometer scans the profile of a part, and sends the
data to the PC.
Data Cleaning – With the irregular reflection form the metal surface, the raw data
normally contains considerable erroneous and noisy data. In this paper the authors
applied an out-of-range filtering method to remove height data that was out of a
certain range (-120mm~+120mm) thereby cleaning the data. The range is manually
determined with regards to the distance between the parts and the laser profilometer.
Readers may refer to the Point Cloud Library (PCL) (Rusu et al. 2011) for the
advanced data cleaning algorithm.
Inclined Angle Correction - An inclined angle correction is needed to rotate the
profile back to horizontal as shown in Figure 12b. The authors obtained the inclined
angle of both laser profilometers during the calibration process.
Point Cloud Rough Alignment – Two point cloud datasets from two laser
profilometers must be combined to obtain the complete features of a component.
Before applying the point cloud register (fine point cloud alignment), an
approximate alignment needs to be manually carried out to make sure the two
datasets are in the same direction, so that the follow-up point cloud register step can
work effectively.

26
Point Cloud Register - Point cloud register is a specific phrase in data processing,
which means precisely aligning two point clouds through their similar shape. The
most common point cloud register algorithm is the iterative closest point(ICP)
algorithm. Readers are referred to Besl and McKay (1992) for the ICP algorithm.
Another method to register point clouds is to calculate the transforming matrix by
precisely calibrating two laser profilometers. In this research, the ICP algorithm is
applied in the preliminary stage.
Generate CAD model - The final step is to generate a CAD model from the
registered and combined point cloud. Most commercial point cloud software can
convert point cloud data to CAD models, such as Geomagic and Rhino.
Figure 14. Standard data processing procedure for inclined dual laser profilometers
5.2 Voltage Signal
The arc voltage data for a single layer is recorded as shown in Figure 15a. The arc
voltage is approximately 30Volts coupled with fluctuation and an increasing trend.
Figure 15b showed the frequency spectrum of the voltage data by applying 660 points
fast Fourier transform (FFT). There are two relatively high value components at
approximately 0.007Hz and 0.34Hz corresponding to the increasing trend and
Data Acquisition
Data cleaning
Point Cloud Register
Generate CAD model
Point Cloud Rough
Alignment
Inclined Angle Correction

27
fluctuation. The high frequency fluctuation is due to the circulated metal droplets
melting and dripping. The increasing trend might be due to the slightly uneven bottom
layer. The distortion often causes the components to be tilted upwards at its ends. As a
result, the decreased distance between the arc nozzle and the part caused this increasing
trend.
Figure 15 a. Raw voltage signal for a single layer and low-pass filtered voltage signal
15b. Voltage signal in frequency domain by fast Fourier transform
5.3 Current Signal
The current signal for a single layer is shown in Figure 16a. The current is set to a fixed
220 Amps. As shown in figure 16a, there is an almost flat line at 210 amps with
numerous spikes in the measured current signal. The FFT frequency spectrum is shown
in figure 16c. Apart from the frequencies lower than 0.05Hz, all the other frequency
components vary between -2000 and 2000 amps, which means the signal and noise is
evenly spread on the spectrum and the noise cannot be filtered out with a frequency
filter.
To eliminate the noise, the authors applied a simple statistical analysis for the
current data before and after the arc extinguished as shown in Table 3. After the arc
0 20 40 60 80 100 120 14022
24
26
28
30
32
34
Vo
lta
ge
(V
)
Time(s)
Raw Voltage
0.01 Hz Low Pass FFT Filter
Arc Extinguished
0.01 0.1 1-100
-50
0
50
100
150
200
250
300
350
Va
lue
Frequency (Hz)
FFT Spectrum
0.34Hz
a b

28
extinguished, the current should be zero, however the mean of the measurement result
was -7.2 amps. This error is recognized as a zero-drifting error. By adding 7.2 amps
(zero drifting error) to 213.1 amps, as shown in Table 2, the mean becomes 220.3 amps
which is very close to the value the authors set. Subsequently, the authors analysed the
error distribution of the data after the arc extinguished as shown in figure 16b. The
horizontal axis represents the error between measurement value and mean and the
vertical axis represents the count of the errors in each range. Most errors are located in
the range of -40 to 40 amps, and the distribution is approximately a Gaussian
distribution. Thus, the author has used a Kalman filter due to its good effect on filtering
Gaussian distribution error (Welch and Gary, 1995).
Figure 16a. Raw current signal for a single layer;
16b. error histogram for current data after arc extinguished
16c. fast Fourier Transformed Current Spectrum;
0 20 40 60 80 100 120 140
-400
-300
-200
-100
0
100
200
300
Curr
ent (A
)
Time (s)
Raw Current
arc extinguished
0.01 0.1 1
-20000
-15000
-10000
-5000
0
5000
Valu
e
Frequency (Hz)
FFT Spectrum
a b
0.1 1
-2000
-1000
0
1000
2000
Valu
e
Frequency (Hz)
FFT Spectrum
-200 -160 -120 -80 -40 0 400
10
20
30
40
50
60
70
Co
un
ts
Error Value
Current Error Distribution
d c

29
1d. zoom-in diagram of 15c from 0.05Hz;
Table 3. Statistic Result for current data
Mean (Amp) Variance
Current Data before arc extinguished 213.1 1016.5
Current Data after arc extinguished -7.2 2830.3
The Kalman filter (Welch and Gary, 1995) is a mature algorithm used to
estimate true value from a series of measurements with statistical noise over time.
Essentially, the Kalman filter is a discrete time-varying least square estimator. The
objective is to use the system function to predict the next state and then compensate the
prediction value based upon the measurement values. The measurement results are
assumed to be independent of the predicted values and subject to statistical noise. The
Kalman filter comprises of two stages, namely, prediction and correction.
Prediction: | 1 1 1| 1
ˆ ˆk k k k kx F x
Where:
1| 1ˆ
k kx is the best estimation from the previous time-step k-1;
| 1ˆ
k kx is the prediction value of time k from the system function;
1kF is the state transfer function based on system model.
All system models are a simplified representation of the real world and as such the
prediction will have some error associated with it. The variance of this error is named as
Q. At each step, the system states will be measured by specific sensors. Correction:
| | 1 | 1ˆ ˆ ˆ( )k k k k k k k kx x K z Hx
Where
kK is the Kalman gain value
kz is the measurement value

30
H is the representation matrix
| 1ˆ
k kx is the prediction value from the system function
|ˆ
k kx is the corrected estimation based on Kalman filter
The best estimated value is corrected by the Kalman gain value which is
introduced below. The measurement value is represented as zk, which is assumed to
have a zero-mean error with a variance of R. Since the measured value and the
prediction value might be in different coordinate space (e.g. prediction model in
Cartesian space, whereas sensor output could be in polar coordinate space), a
representation matrix is applied to unify the two values into the same form. The Kalman
gain is calculated as below:
Kalman Gain1
| 1 | 1( )T T
k k k k kK P H HP H R
Predicted Covariance | 1 1 1| 1 1
T
k k k k k kP F P F Q
Corrected Covariance | | 1( )k k k k kP I K H P
| 1k kP is the predicted covariance
Q is the system error variance
R is the measurement error variance
1| 1k kP is the previous covariance
|k kP is the estimated covariance
1kF is the state transfer function based on system model
I is the identity covariance
The basic idea behind the Kalman gain value is to minimize the errors with the
variance Q and R. The Kalman filtering algorithm was applied to the raw current signal
as shown in figure 17a and the result is shown in figure 17b. The authors set the arc

31
current to 220amps and the filtered signal shows that the arc current is almost steady at
213 amps from 0s to 108s. After this period the arc current remains at approximately
-7amps which is a zero drift. After correcting the zero drift, the measured value is
approximately 220 amps which is equal to the set value.
Figure 17 Comparison between raw current signal and Kalman filtered signal
17a Raw current signal for a single layer; 17b.Kalman filtered Current
5.4 Discussion
The results captured and analysed prove the feasibility of iMUST for WAAM process.
The authors have established a standard data process procedure for a dual profilometer
WAAM scanning data. Based on the results, the authors identified the variation pattern
of the voltage signal and analysed the reason for the variation. In addition, the authors
also experimented with filtering noise out of the current signal and achieved good
results as shown in Figure 16, 17.
The iMUST system firstly applied two laser profilometers which are able to
obtain complete point cloud information of a component. The output point cloud
enables the generation of a CAD model, which is useful for component post-processing
such as machining and inspection. Other WAAM monitoring systems reported in the
0 20 40 60 80 100 120 140
-400
-300
-200
-100
0
100
200
300
Curr
ent (A
)
Time (s)
Raw Current
arc extinguished
0 20 40 60 80 100 120 140-50
0
50
100
150
200
250
Cu
rre
nt
(A)
Time (s)
Kalman Filtered Current
32
literature mostly applied cameras to measure the height and width such as Heralić
(2012), Xiong (2013) etc. In comparison with iMUST, other camera-based systems
only provide a top-view and a side-view 2D images of a component, which make it hard
to measure multi-pass walls as the front pass may hide the contour of the back pass.
Since the WAAM process generates only near net shaped components there is a need
for final part machining. To do this, inspection of the near net shaped components is
required to generate a CAD model which can then be used to create suitable process
plans for final machining. From this perspective, iMUST is a more streamlined
approach as it has the capability to generate a CAD model directly.
Secondly, the authors proposed an advanced current and voltage signal
processing algorithm which can filter out more accurate voltage and current from a
Hall current sensor and voltage sensor. For the WAAM process, the arc current signal
is directly related to energy input and the arc voltage signal can reflect the arc length
(Yu et al. 2015). To sustain a stable defect-free WAAM process, obtaining accurate
voltage and current signal is important. Furthermore, without accurate voltage and
current monitoring, realizing a closed loop control WAAM system is impossible.
The literature review has shown that WAAM is an emerging manufacturing
processes with particular relevance to large scale component manufacture. The novel
integrated process monitoring multi-sensor framework and subsequent testing results
have demonstrated the importance of being able to monitor component quality.

33
Currently, one of the major obstacles preventing WAAM from becoming an
established manufacturing process is part quality monitoring, in terms of depositions
and defect free build component consistency.
This is primarily due to the following:
a) WAAM is a discrete manufacturing process, where the manufacturing condition
for different layers can be different (as heat dissipation condition varies). It means
conventional process control systems which simply control the process parameters
(such as the feeding speed and spindle speed) cannot satisfy the requirements for
WAAM manufacturing.
b) The consequence of defects in WAAM are more severe, as a defect in one layer
will affect subsequent layers.
c) Measuring after part building is often too late as the defects might have been
generated and cannot be resolved, leading to scrappage.
Therefore, the authors believe that in-situ process monitoring, and control are critical
for reducing defects in the WAAM process whilst producing more consistent
components.
6 Conclusions
In this paper, the authors have proposed and detailed a novel integrated monitoring
solution, namely, iMUST. This is comprised of a multi-sensor system that can monitor
the HiVE WAAM process. Experimental work was undertaken combining a range of
sensors to understand the build sequence. The results have demonstrated the feasibility

34
of iMUST for applications to the WAAM process. The authors have established a
standard data process procedure for dual profilometer WAAM scanning data. Based on
the results, the authors identified the voltage signal coupled with a high frequency
fluctuation that has an increasing trend. The reason for the fluctuation is because of the
melting and dripping of the metal droplets and the increasing trend is due to an uneven
previous layer surface. In addition, the authors were also able to filter out Gaussian
noise that is coupled to the current signal and the result is close to the set value, which
further demonstrated the feasibility of this method.
From the results, the following can be concluded which also represents the papers
major contributions to this domain:
i) The laser interferometer can be used in the WAAM process to provide
accurate (i.e. 0.1mm) variations in the layer height and profile.
ii) The feasibility of the dual laser profilometers has been used to measure the
side walls of WAAM components to identify and reconstruct the side feature,
which is useful for post-processing.
iii) The Kalman filter was used as part of current signal fileter and has shown
excellent performance in processing the current signal from the WAAM
process coupled with Gaussian noise.
iv) The iMUST approach detailed in this paper provides a new robust approach
for significnalty improved monitoring of WAAM processes. This approach
can be applied to different WAAM configurations to improve component
build quality with reduced layer defects.

35
Future work will focus on, i) developing a real-time defects detection algorithm based
on point cloud data, ii) analysing the relationship between the profile data and process
parameters in order to achieve high quality layers and parts, iii) development of a
closed loop process control system based on the iMUST architecture. This will include
testing of the sensors with components being manufactured with specific defects such
as porosity and fusion to extend evaluation of the multi-sensor monitoring system. This
will be used to create a closed loop control system that can adapt and modify the build
sequence for a given WAAM machine. The major impact of this will be consistent
build quality and components that have reduced variability, leading to greater industrial
adoption of this emerging additive manufacturing process. This will facilitate the
industrial uptake of this process within large scale aerospace component manufacture.
Acknowledgement
The authors would like to acknowledge all the partners and staff working on the
Innovate UK project RAWFEED (Project Number 29620-211180) in which the work
reported in this paper was funded.
Reference
Almeida, P. S. and S. Williams. 2010. “Innovative Process Model of Ti–6Al–4V
Additive Layer Manufacturing Using Cold Metal Transfer (CMT).” In
Proceedings of the Twenty-First Annual International Solid Freeform
Fabrication Symposium, University of Texas at Austin, Austin, TX, USA.

36
Bai, X., H. Zhang, and G. Wang. 2013. “Improving Prediction Accuracy of Thermal
Analysis for Weld-Based Additive Manufacturing by Calibrating Input
Parameters Using IR Imaging.” International Journal of Advanced
Manufacturing Technology 69 (5–8): 1087–95.
Bai, X., H. Zhang, G. Wang. 2013. “Improving prediction accuracy of thermal analysis
for weld-based additive manufacturing by calibrating input parameters using IR
imaging.” The International Journal of Advanced Manufacturing Technology,
69(5-8), 1087-1095.
Bandari, Y., S. Williams, J. Ding, and F. Martina. 2015. “Additive Manufacture of
Large Structures: Robotic or CNC Systems.” 26th International Solid Freeform
Fabrication Symposium, Austin, Texas; 08/2015, 1(September 2013), 17–25.
Baufeld, B. 2012. “Mechanical Properties of Inconel 718 Parts Manufactured by
Shaped Metal Deposition (SMD).” Journal of Materials Engineering and
Performance 21 (7): 1416–21.
Baufeld, B., E. Brandl, and O. Van der Biest. 2011. “Wire Based Additive Layer
Manufacturing: Comparison of Microstructure and Mechanical Properties of
Ti–6Al–4V Components Fabricated by Laser-Beam Deposition and Shaped
Metal Deposition.” Journal of Materials Processing Technology, 211(6),
1146-1158.
Baufeld, B., O. Van der Biest, and R. Gault. 2010. “Additive Manufacturing of
Ti-6Al-4V Components by Shaped Metal Deposition: Microstructure and
Mechanical Properties.” Materials and Design 31 (SUPPL. 1). Elsevier Ltd:
S106–11.
Besl, P., and N. McKay. 1992. “A Method for Registration of 3-D Shapes.” IEEE
Transactions on Pattern Analysis and Machine Intelligence.
BSI. 2015. “BSI Standards Publication Additive manufacturing — General principles
Part 2: Overview of process categories and feedstock.”

37
Chen, B., and S. Chen. 2010. “Multi-sensor Information Fusion in Pulsed GTAW
Based on Fuzzy Measure and Fuzzy Integral.” Assembly Automation, 30(3),
276-285.
Chen, B., J. Wang, and S. Chen. 2010. “A Study on Application of Multi-sensor
Information Fusion in Pulsed GTAW.” Industrial Robot: An International
Journal, 37(2), 168-176.
Chen, Z., J. Chen., Z. Feng, and Y. Zhang. 2016. “In-Situ Strain Monitoring in Gas
Tungsten Arc Welding Processes.” In Advanced Intelligent Mechatronics
(AIM), 2016 IEEE International Conference on (pp. 800-804). IEEE.
Colegrove, P. A., A. R. McAndrew, J. Ding, F. Martina, P. Kurzynski, and S. Williams.
2016. “System Architectures for Large Scale Wire + Arc Additive
Manufacture.” 10th International Conference on Trends in Welding Research,
no. October 2016.
Colegrove, P. A., F. Martina, M. J. Roy, B. A. Szost, S. Terzi, S. W. Williams, P. J.
Withers, and D. Jarvis. 2014. “High Pressure Interpass Rolling of Wire + Arc
Additively Manufactured Titanium Components.” Advanced Materials
Research 996: 694–700.
Colegrove, P. A., H. E. Coules, J. Fairman, F. Martina, T. Kashoob, H. Mamash, and L.
D. Cozzolino. 2013. “Microstructure and Residual Stress Improvement in Wire
and Arc Additively Manufactured Parts through High-Pressure Rolling.”
Journal of Materials Processing Technology 213 (10): 1782–91.
Cong, B., J. Ding, and S. Williams. 2014. “Effect of Arc Mode in Cold Metal Transfer
Process on Porosity of Additively Manufactured Al-6.3%Cu Alloy.”
International Journal of Advanced Manufacturing Technology 76 (9–12):
1593–1606.
Ding, D., Z. Pan, D. Cuiuri, & H. Li. 2015. “Wire-Feed Additive Manufacturing of
Metal Components: Technologies, Developments and Future Interests.” The
International Journal of Advanced Manufacturing Technology 81(1-4):
465-481.
38
Ding, J., P. Colegrove, F. Martina, S. Williams, R. Wiktorowicz, and M. R. Palt. 2015.
“Development of A Laminar Flow Local Shielding Device for Wire+ Arc
Additive Manufacture.” Journal of Materials Processing Technology 226,
99-105.
Ding, J., P. Colegrove, J. Mehnen, S. Ganguly, P. M Sequeira Almeida, F. Wang, and
S. Williams. 2011. “Thermo-Mechanical Analysis of Wire and Arc Additive
Layer Manufacturing Process on Large Multi-Layer Parts.” Computational
Materials Science 50 (12):3315–22.
DuPont, J. N., & Marder, A. R. 1995. “Thermal efficiency of arc welding processes.”
Welding Journal-Including Welding Research Supplement, 74(12), 406s.
Everton, S. K., M. Hirsch, P. Stravroulakis, R. K. Leach, and A. T. Clare. 2016.
“Review of in-Situ Process Monitoring and in-Situ Metrology for Metal
Additive Manufacturing.” Materials and Design 95: 431–45.
Frazier, W. E. 2014. “Metal Additive Manufacturing: A Review.” Journal of Materials
Engineering and Performance, 23(6): 1917-1928.
Heralić, A. 2012. “Monitoring and Control of Robotized Laser Metal-Wire
Deposition.” Chalmers University of Technology.
Hussein, A., L. Hao, C. Yan, R. Everson, and P. Young. 2013. “Advanced Lattice
Support Structures for Metal Additive Manufacturing.” Journal of Materials
Processing Technology 213(7): 1019-1026.
Jhavar, S., N. K. Jain, and C. P. Paul. 2014. “Development of Micro-Plasma
Transferred Arc (μ-PTA) Wire Deposition Process for Additive Layer
Manufacturing Applications.” Journal of Materials Processing Technology 214
(5): 1102–10.
Kerckhofs, G., G. Pyka, M. Moesen, S. Van Bael, J. Schrooten, and M. Wevers. 2013.
“High‐ Resolution Microfocus X‐ Ray Computed Tomography for 3D Surface
Roughness Measurements of Additive Manufactured Porous Materials.”
Advanced Engineering Materials, 15(3): 153-158.

39
Kobryn, P. A., E. H. Moore, and S. L. Semiatin. 2000. “Effect of Laser Power and
Traverse Speed on Microstructure, Porosity, and Build Height in
Laser-Deposited Ti-6Al-4V.” Scripta Materialia 43(4): 299–305.
Lin, J. J., Y. H. Lv, Y. X. Liu, B. S. Xu, Z. Sun, Z. G. Li, and Y. X. Wu. 2016.
“Microstructural Evolution and Mechanical Properties of Ti-6Al-4V Wall
Deposited by Pulsed Plasma Arc Additive Manufacturing.” Materials & Design
102: 30-40.
Lü, F., H. Chen, C. Fan, and S. Chen. 2010. “A Novel Control Algorithm for Weld Pool
Control.” Industrial Robot: An International Journal, 37(1), 89-96.
Martina, F., P. A. Colegrove, S. W. Williams, and J. Meyer. 2015. “Microstructure of
Interpass Rolled Wire+ Arc Additive Manufacturing Ti-6Al-4V Components.”
Metallurgical and Materials Transactions A 46, No. 12 (2015): 6103-6118.
Mireles, J., C. Terrazas, F. Medina, R. Wicker, E. Paso. 2013. “Automatic Feedback
Control in Electron Beam Melting Using Infrared Thermography.” In
Proceedings of the Solid Freeform Fabrication Symposium.
Pal, K., S. Bhattacharya, and S. K. Pal. 2010. “Investigation on Arc Sound and Metal
Transfer Modes for On-Line Monitoring in Pulsed Gas Metal Arc Welding.”
Journal of Materials Processing Technology, 210(10):1397-1410.
Polajnar, I., Z. Bergant, and J. Grum. 2013. “Arc Welding Process Monitoring by
Audible Sound.” 12th International Conference of the Slovenian Society for
Non-Destructive Testing: Application of Contemporary Non-Destructive
Testing in Engineering, ICNDT 2013 - Conference Proceedings, 613–20.
Reuters. 2017 Printed titanium parts expected to save millions in Boeing Dreamliner
costs. http://www.reuters.com/article/us-norsk-boeing-idUSKBN17C264
Rusu, R., and S. Cousins. 2011. "3D is here: Point cloud library (PCL)." In Robotics
and automation (ICRA), 2011 IEEE International Conference. 1-4. IEEE, 2011.
Slotwinski, J. A., E. J. Garboczi, and K. M. Hebenstreit. 2014. “Porosity Measurements
and Analysis for Metal Additive Manufacturing Process Control.” Journal of

40
Research of the National Institute of Standards and Technology 119(1):
494-529.
Taminger, K., and R. A. Hafley. 2003. “Electron Beam Freeform Fabrication: A Rapid
Metal Deposition Process.” Proceedings of the 3rd Annual Automotive
Composites Conference, 9–10.
Thompson, A., I. Maskery, and R. K. Leach. 2016. “X-Ray Computed Tomography for
Additive Manufacturing: A Review.” Measurement Science and Technology
27(7): 72001.
Thompson, S. M., L. Bian, N. Shamsaei, and A. Yadollahi. 2015. “An Overview of
Direct Laser Deposition for Additive Manufacturing Part I: Transport
Phenomena, Modeling and Diagnostics.” Additive Manufacturing 8: 36–62.
Unocic, R. R., and J. N. DuPont. 2004. “Process Efficiency Measurements in The Laser
Engineered Net Shaping Process.” Metallurgical and materials transactions B
35(1): 143-152.
Wang, Y. and P. Zhao. 2001. “Noncontact Acoustic Analysis Monitoring of Plasma
Arc Welding.” International Journal of Pressure Vessels and Piping 78 (1):
43–47.
Węglowski, M. S. 2012. “Monitoring of Arc Welding Process Based on Arc Light
Emission.” INTECH Open Access Publisher.
Welch, G., and G. Bishop. 1995. “An Introduction to the Kalman Filter.”
Kahveci, A. I. and G. E. Welsch. “Hardness versus strength correlation for
oxygen-strengthened Ti-6Al-4V alloy.” Scripta METALLURGICA 20 (1991)25
: 1957-1962.
Williams, S. W., F. Martina, A. C. Addison, J. Ding, G. Pardal, and P. Colegrove. 2016.
“Wire+ Arc Additive Manufacturing.” Materials Science and Technology,
32(7), 641-647.
Wohlers Associates, Inc. 2016 “Wohlers report 2016.”

41
Wu, C. S., L. Wang, W. J. Ren, and X. Y. Zhang. 2014. “Plasma Arc Welding: Process,
Sensing, Control and Modelling.” Journal of Manufacturing Processes 16 (1):
74–85.
Xiong, J., and G. Zhang. 2013. “Online Measurement of Bead Geometry in
GMAW-Based Additive Manufacturing Using Passive Vision.” Measurement
Science and Technology 24 (11): 115103.
Xiong, J., G. Zhang, Z. Qiu, and Y. Li. 2013. “Vision-Sensing and Bead Width Control
of a Single-Bead Multi-Layer Part: Material and Energy Savings in
GMAW-Based Rapid Manufacturing.” Journal of Cleaner Production 41:82–
88.
Xiong, J., Y. Lei, H. Chen, and G. Zhang. 2017. “Fabrication of Inclined Thin-Walled
Parts in Multi-Layer Single-Pass GMAW-Based Additive Manufacturing with
Flat Position Deposition.” Journal of Materials Processing Technology 240:
397–403.
Yu, H., Y. Xu, J. Song, J. Pu, X. Zhao, and G. Yao. 2015. “On-line monitor of hydrogen
porosity based on arc spectral information in Al–Mg alloy pulsed gas tungsten
arc welding.” Optics & Laser Technology, 70, 30-38.
Yu, H., Z. Ye, and S. Chen. 2013. “Application of Arc Plasma Spectral Information in
the Monitor of Al-Mg Alloy Pulsed GTAW Penetration Status Based on Fuzzy
Logic System.” International Journal of Advanced Manufacturing Technology
68(9–12): 2713–27.
Zhang, Y. Edited. “Real-time weld process monitoring.” Elsevier, 2008.
Zhang, Z., X. Chen, H. Chen, J. Zhong and S. Chen. 2014. “Online Welding Quality
Monitoring Based on Feature Extraction of Arc Voltage Signal.” The
International Journal of Advanced Manufacturing Technology 70(9-12),
1661-1671.