real tra c ow modelling with sumo - utds.cs.ut.ee/courses/course-files/finalreport-vent.pdf · ow...
TRANSCRIPT

Real traffic flow modelling with SUMO
Ragnar VentInstitute of Computer Science
University of [email protected]
Supervisor Amnir Hadachi
ABSTRACT
Traffic flow analysis and modelling are an essential partof various traffic management applications(e.g signal con-trol) and can provide a better insight into the state oftraffic. The purpose of this work was to create a trafficsimulation using real traffic counts gathered in the cityof Dublin. The subsequent simulation was created andanalysed with SUMO[1] traffic simulation package.
1 INTRODUCTION
The high volume of vehicular traffic has created the needto analyse and simulate the traffic flow of a given roadnetwork as to better manage and control it. The goal ofthe present work was to create such a simulation usingannual traffic count data[2] that was gathered in thecity of Dublin. The data was initially collected with thepurpose of analysing different trends and the type oftraffic entering the city. In the scope of this work we tryto simulate the traffic demand in the traffic simulationwith the given vehicle counts.
The first step of creating the simulation involvessetting up the actual road network for the SUMOsimulation, the process is described in Section 3. As anext step we generate the vehicle routes and the actualtraffic demand as explained in Section 4. Finally aftera successful simulation run, we obtain a considerableamount of statistics about the simulation, which wethen try to analyse and visualize using tools provided bySUMO. The simulation was created using SUMO 0.24.
2 THE DATA
The traffic count data was gathered from 2008 to 2012,however, only the data for the latest year was used for gen-erating the traffic demand. The counts were collected at
33 different locations(see Fig. 1), marking the entrancesto the Dublin city centre. In order to limit the size of thenetwork only 11 of those locations were used. In additionto the number of vehicles entering and exiting the city cen-tre, we know the various transportation types that wereused, starting with pedal cyclists and ending with bussesand vehicles that have over 7 axles. The data itself wasaggregated over 15 minute intervals starting at 7am in themorning til 7pm in the evening.
Figure 1: Different locations around Dublin, where trafficcounts were collected. The locations 2 to 12 were used forgenerating traffic demand. Image taken from [2].
The network data was taken from OpenStreetMaps[3] andwas confined by latitude [53.3186, 53.3473] and longitude[-6.3136, -6.2278] i.e basically the lower half of Fig. 1.
1
3 OSM TO SUMO NETWORK
The first step towards creating a running simulationinvolves generating a SUMO type network based onthe map we extracted from OpenStreetMaps. This canbe achieved by using the command line applicationNETCONVERT made available by SUMO. Basicallywe mark down all the input/output files and any otheradditional parameters in a configuration file and passit to NETCONVERT. As input files we specify thefollowing:
• OSM network - network obtained from Open-StreetMaps
• Typemap file - optionally specified. Contains allthe different types of roads(with various default pa-rameters) for given network. This can be useful incase information such as speed limit is missing in theraw data and must be inferred from the abstract typeof the road. Note that for most road types the pa-rameter oneway was marked as false, as to preventthe network from being comprised mostly of one-waystreets. In case the parameter is specified and setto true in the .osm file, the default value would beoverwritten.
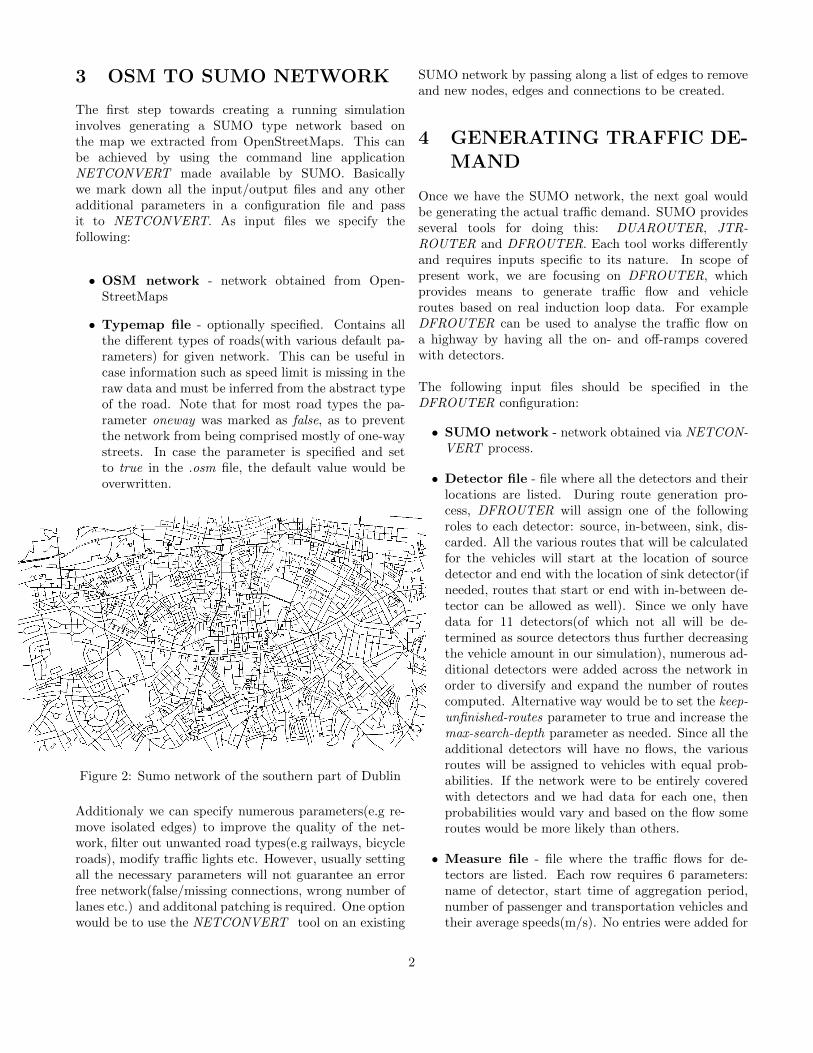
Figure 2: Sumo network of the southern part of Dublin
Additionaly we can specify numerous parameters(e.g re-move isolated edges) to improve the quality of the net-work, filter out unwanted road types(e.g railways, bicycleroads), modify traffic lights etc. However, usually settingall the necessary parameters will not guarantee an errorfree network(false/missing connections, wrong number oflanes etc.) and additonal patching is required. One optionwould be to use the NETCONVERT tool on an existing
SUMO network by passing along a list of edges to removeand new nodes, edges and connections to be created.
4 GENERATING TRAFFIC DE-MAND
Once we have the SUMO network, the next goal wouldbe generating the actual traffic demand. SUMO providesseveral tools for doing this: DUAROUTER, JTR-ROUTER and DFROUTER. Each tool works differentlyand requires inputs specific to its nature. In scope ofpresent work, we are focusing on DFROUTER, whichprovides means to generate traffic flow and vehicleroutes based on real induction loop data. For exampleDFROUTER can be used to analyse the traffic flow ona highway by having all the on- and off-ramps coveredwith detectors.
The following input files should be specified in theDFROUTER configuration:
• SUMO network - network obtained via NETCON-VERT process.
• Detector file - file where all the detectors and theirlocations are listed. During route generation pro-cess, DFROUTER will assign one of the followingroles to each detector: source, in-between, sink, dis-carded. All the various routes that will be calculatedfor the vehicles will start at the location of sourcedetector and end with the location of sink detector(ifneeded, routes that start or end with in-between de-tector can be allowed as well). Since we only havedata for 11 detectors(of which not all will be de-termined as source detectors thus further decreasingthe vehicle amount in our simulation), numerous ad-ditional detectors were added across the network inorder to diversify and expand the number of routescomputed. Alternative way would be to set the keep-unfinished-routes parameter to true and increase themax-search-depth parameter as needed. Since all theadditional detectors will have no flows, the variousroutes will be assigned to vehicles with equal prob-abilities. If the network were to be entirely coveredwith detectors and we had data for each one, thenprobabilities would vary and based on the flow someroutes would be more likely than others.
• Measure file - file where the traffic flows for de-tectors are listed. Each row requires 6 parameters:name of detector, start time of aggregation period,number of passenger and transportation vehicles andtheir average speeds(m/s). No entries were added for
2

any of the additional detectors. An optional param-eter guess-empty-flows was explored, which shouldapproximate the flows from upstream/downstream.However, this feature is still in development and notworking as of yet.
Furthermore, all the wanted output files have to bemarked down in the configuration file. For this work, thefollowing files were specified:
• routes - file where all the routes are stored. Eachroute is comprised of a list of edges it follows.
• emitters - file where different route distributions,along with vehicles to be emitted, are stored for eachsource detector. By default, vehicle types are omit-ted, however, they can be explictly set using the vtypeparameter, which adds either PKW or LKW as ve-hicle type.
• detectors - contains all the detectors that werepassed to DFROUTER with an addition of the rolesthat were determined for them.
Once DFROUTER has computed the traffic demand, wehave all the components necessary to run the simulation.
5 GATHERING STATISTICSFROM SIMULATION
SUMO provides a set of tools for analysing and visual-izing various statistics and metrics gathered during thesimulation run. There are several parameters that can beset in order to get the data dumps necessary for analysis.For example, the following were used in present work:
• edge based measures - different statistics(e.g den-sity, travel time, speed) aggregated over specified pe-riod per edge.
• summary - simulation-wide number of vehicles thatare loaded, inserted, running, waiting to be inserted.
• tripinfo - single vehicle trip info.
In addition, it is possible to define any number ofinduction loops and include them in the simulation. Allthe induction loops have to specified in a separate fileincluding their locations and the period over which thedata will be aggregated.
Once we have our post-run data dumps, we can vi-sualize the results using SUMO tools. Fig. 3 shows thenumber of running vehicles during the entire simulationrun.
Figure 3: Number of running vehicles throughout the sim-ulation. The timeline represents the 12 hour period(7amto 7pm) during which the actual counts were gathered.
The following plot shows the travel time distributionfor the vehicles. From total of 46469 emitted vehiclesthroughout the simulation, almost half of them finishedtheir run under 160 seconds.
Figure 4: Vehicle trip duration distribution
Furthermore, we can visualize the gathered edge metricson the created SUMO network. Fig. 5 and Fig. 6illustrate the average edge speed and density over theentire span of the simulation. Based on Fig. 5, we cantell that the average link speeds were quite high(mostlyover 10m
s ), indicating the traffic was fluid. As expecteddensity(Fig. 6) was the highest near the main road,which runs through the middle of the map and is directlyconnected to the bridges, which lead to central Dublinand where our vehicles are spawned. Based on the resultswe can say that the current scope of the simulation isquite limited due to small amount of detectors withactual data.
3
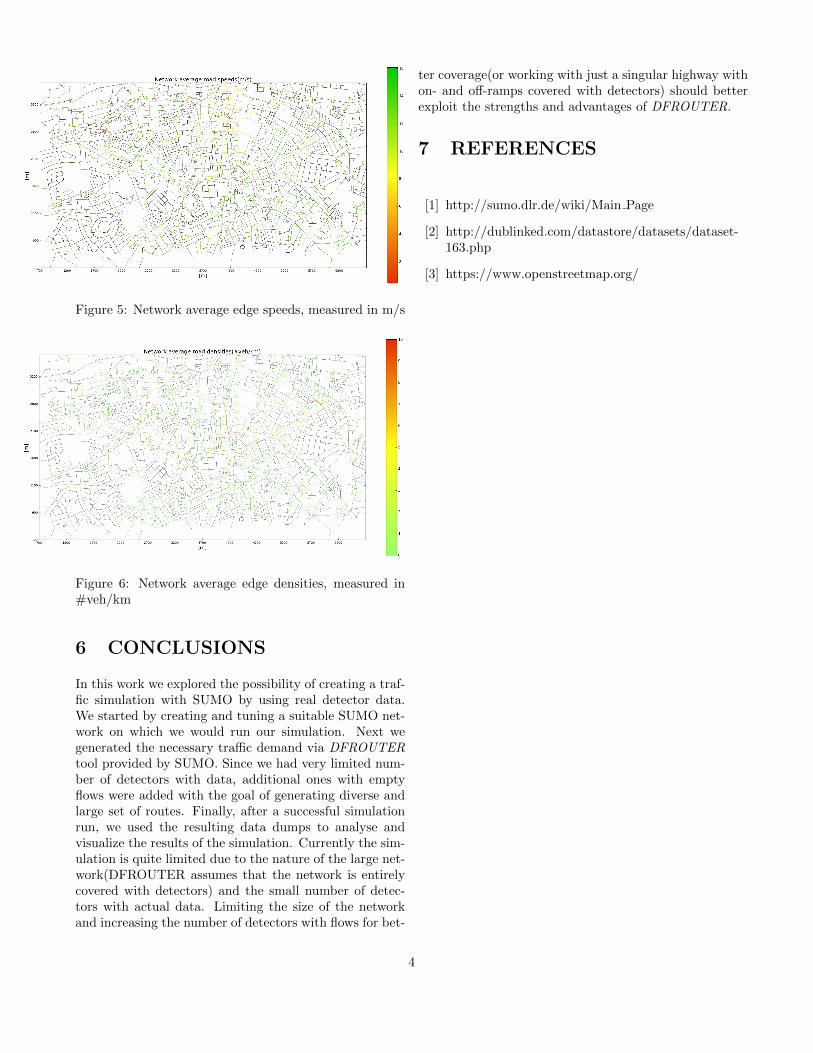
Figure 5: Network average edge speeds, measured in m/s
Figure 6: Network average edge densities, measured in#veh/km
6 CONCLUSIONS
In this work we explored the possibility of creating a traf-fic simulation with SUMO by using real detector data.We started by creating and tuning a suitable SUMO net-work on which we would run our simulation. Next wegenerated the necessary traffic demand via DFROUTERtool provided by SUMO. Since we had very limited num-ber of detectors with data, additional ones with emptyflows were added with the goal of generating diverse andlarge set of routes. Finally, after a successful simulationrun, we used the resulting data dumps to analyse andvisualize the results of the simulation. Currently the sim-ulation is quite limited due to the nature of the large net-work(DFROUTER assumes that the network is entirelycovered with detectors) and the small number of detec-tors with actual data. Limiting the size of the networkand increasing the number of detectors with flows for bet-
ter coverage(or working with just a singular highway withon- and off-ramps covered with detectors) should betterexploit the strengths and advantages of DFROUTER.
7 REFERENCES
[1] http://sumo.dlr.de/wiki/Main Page
[2] http://dublinked.com/datastore/datasets/dataset-163.php
[3] https://www.openstreetmap.org/
4