real-time resource efficiency indicators and the more project · 2017-02-27 · 3 • the resource...
TRANSCRIPT

1
Real-time Resource Efficiency Indicators
and the MORE Project

2
• The chemical industry is a major consumer of resources, mostly of fossil origin as oil and gas, and a major producer of CO2 emissions.
• Improvement of resource efficiency is a highly complex task in chemical plants, because:– Chemical plants are operated under changing conditions, and the
resource efficiency is determined also by the actual operation, not by the ideal operation assumed during plant design
– The daily operation currently cannot be steered byexisting long-term resource efficiency indicators
– Local and plant-wide resource efficiency may bein conflict
• Plants are not fully automated, operators playa crucial role
Resource efficiency improvement: The challenge
MORE Final Workshop 2017 REIFeb. 15, 2017

3
• The resource efficiency of chemical plants is influenced by– Plant design
– External influences (e.g. weather, feedstock quality,…)
– Operation and maintenance
• Goal of the EU Project MORE:
Resource efficiency
Feb. 15, 2017 MORE Final Workshop 2017 REI
Efficiency improvement by better operation
based on RTREI and decision support
KPI• Retrospective
• For reporting RTREI• Real-time
• For Optimization
4
MORE impacts
MORE Final Workshop 2017 REI
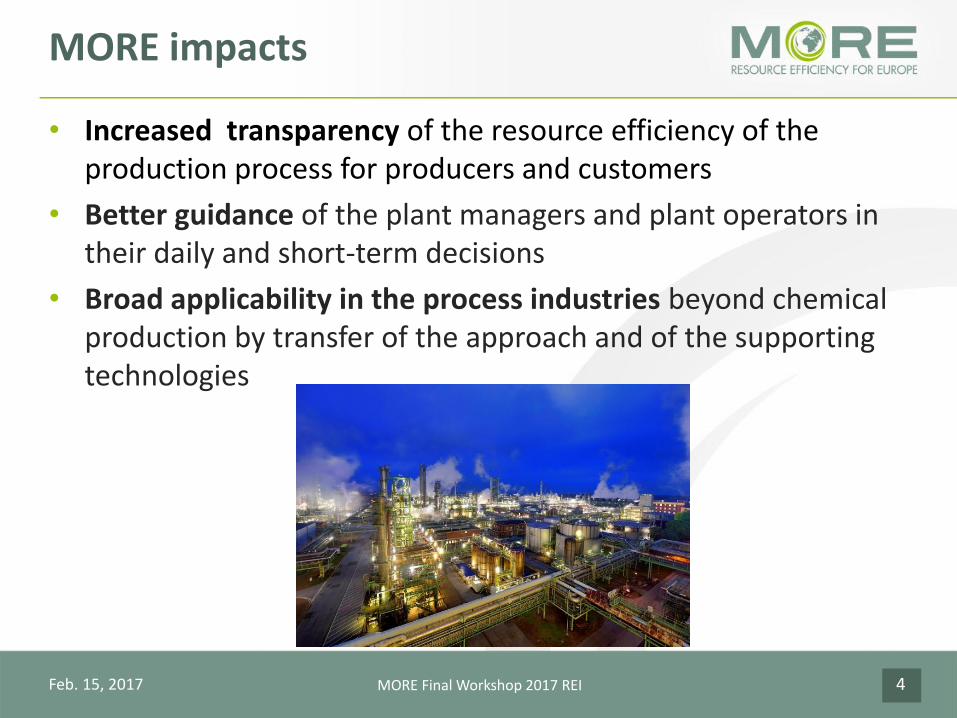
• Increased transparency of the resource efficiency of the production process for producers and customers
• Better guidance of the plant managers and plant operators in their daily and short-term decisions
• Broad applicability in the process industries beyond chemical production by transfer of the approach and of the supporting technologies
Feb. 15, 2017

5
• Collaborative research project
• Supported by the 7th EU Framework Programme for research, technological development and demonstration, Theme: NMP
• Duration: November 1st, 2013 – February 28, 2017 (40 months)
• Budget: 3 919 175 €
• Target group: European process industries and vendors of solutions for operational support.
• Web site: www.more-nmp.eu
MORE: Project identity card
MORE Final Workshop 2017 REI
Svetlana KlessovaProject Coordinator inno TSD, France+33 4 92 38 84 [email protected]
Prof. Dr.-Ing. Sebastian EngellScientific LeaderTechnische UniversitätDortmund, [email protected]
Dr.-Ing. Stefan KrämerIndustrial Application CoordinatorINEOS Köln, [email protected]
Feb. 15, 2017

6
Consortium
MORE Final Workshop 2017 REI
inno TSD, France – one of Europe’s leading innovation management consultancyfirms, specialised in helping major private and public stakeholders design andimplement R&D and innovation projects http://www.inno-group.com/
PETROLEOS DEL NORTE SA - REPSOL, Spain – the biggest petroleum refinery in Spain with a deep knowledge of petro-chemical processeshttp://www.petronor.com/
INEOS Köln GmbH, Germany – operating the INEOS petrochemical site in Cologne, Germany, and part of INEOS Group. INEOS Group is one of the leading world scale chemical companies http://www.ineoskoeln.de/
BASF Personal Care and Nutrition GmbH, Germany – a global supplier of nature-based specialty chemical products and nutritional ingredients and one of the most important European research locations for personal care products worldwide http://www.basf.com/
LENZING AKTIENGESELLSCHAFT, Austria – world market leader in global textile and nonwovens industry with high-quality man-made cellulose fibres, the leading supplier in many business to business markets http://www.lenzing.com/en
Feb. 15, 2017

7
Consortium
MORE Final Workshop 2017 REI
VTT, Technical Research Centre of Finland – the largest multidisciplinary research organisation in Northern Europe, providing high-end technology solutions and innovation services, and having extensive knowledge in sustainability assessment and standardization http://www.vtt.fi/
TECHNISCHE UNIVERSITÄT DORTMUND, Germany – a German research university with a leading position in Europe in chemical engineering and in the operation of chemical processes http://www.tu-dortmund.de
UNIVERSIDAD DE VALLADOLID, Spain – a European university with an excellent research group in chemical process operations http://www.uva.es
S-PACT GmbH, Germany – a Process Analytical Technology solution provider for process industries and scientific research institutions, with a focus on optical online spectroscopy http://www.s-pact.de
LEIKON GmbH, Germany – an innovative technology company working in the area of MES (Manufacturing Execution Systems) and process automationhttp://www.leikon.de
Feb. 15, 2017

8
Real-time Resource Efficiency Indicators

9
• Many existing standards and proposals
• Many indicators are for large-scale analysis, e.g. of a theeconomy of a complete country
• Intention often is to reduce to one or very few indicators, e.g. land use, CO2 footprint
• Not directly useful for steering plant operations
• Specific concepts had to be developed in MORE
Screening of available indicators
Feb. 15, 2017 MORE Final Workshop 2017 REI

10
• Indicators measure the input of resources per unit of valuable outputs (products) – resource intensities
• Resources: Materials, electricity, fresh water, ….
• Outputs: Products with specified properties
• Indicators initially should be specific: Specific consumption of energy in case of the use of raw material A for the product with specification Y
Principle: MORE from less!
𝑅𝐸𝐼 =𝑅𝑒𝑠𝑜𝑢𝑟𝑐𝑒 𝐼𝑛𝑝𝑢𝑡
𝑃𝑟𝑜𝑑𝑢𝑐𝑡 𝑂𝑢𝑡𝑝𝑢𝑡
MORE Final Workshop 2017 REIFeb. 15, 2017

11
Material and energy flow analysis
Feb. 15, 2017
• Site fence (or plant boundary) defines the system boundary
• All inputs and outputs must be considered
• Alternative use / conversion must be taken into account
• Split of resources between products must be determined
Unit 2
Unit 1
Raw material
Natural gas
Heat
Heat
MORE Final Workshop 2017 REI
Heat Product 1
Product 2

12
Extension to LCA
Feb. 15, 2017
• Extension to life-cycle assessment and CO2-footprint possible by including additional (upstream) information
• But: RTREI should guide managers and operators should be independent of external factors and decisions should be normalized for different conditions (baseline)
REIsAggregation
Reporting
Upstream information
Life cycle analysis
MORE Final Workshop 2017 REI

13
• Generic REI: Resource input per product output
• In order to be useful for plant operators and managers, RTREI should be related to a baseline
• Baseline:
– Historical data – best observed operations
– Model-based optimization
– Thermodynamic or stoichiometric limits
Normalization
𝑹𝑬𝑰𝑹𝑷𝑺 =𝑹𝒆𝒔𝒐𝒖𝒓𝒄𝒆 𝒊𝒏𝒑𝒖𝒕
𝑷𝒓𝒐𝒅𝒖𝒄𝒕 𝒐𝒖𝒕𝒑𝒖𝒕RPS = Resource and product specific
𝑹𝑬𝑰𝒏𝒐𝒓𝒎 =𝑹𝑬𝑰𝑹𝑷𝑺
𝑹𝑬𝑰𝑹𝑷𝑺,𝑹𝒆𝒇𝒆𝒓𝒆𝒏𝒛
Feb. 15, 2017 MORE Final Workshop 2017 REI

14
• Distillation process: Best historic operation
Best observed case: Example
Feb. 15, 2017 MORE Final Workshop 2017 REI
15
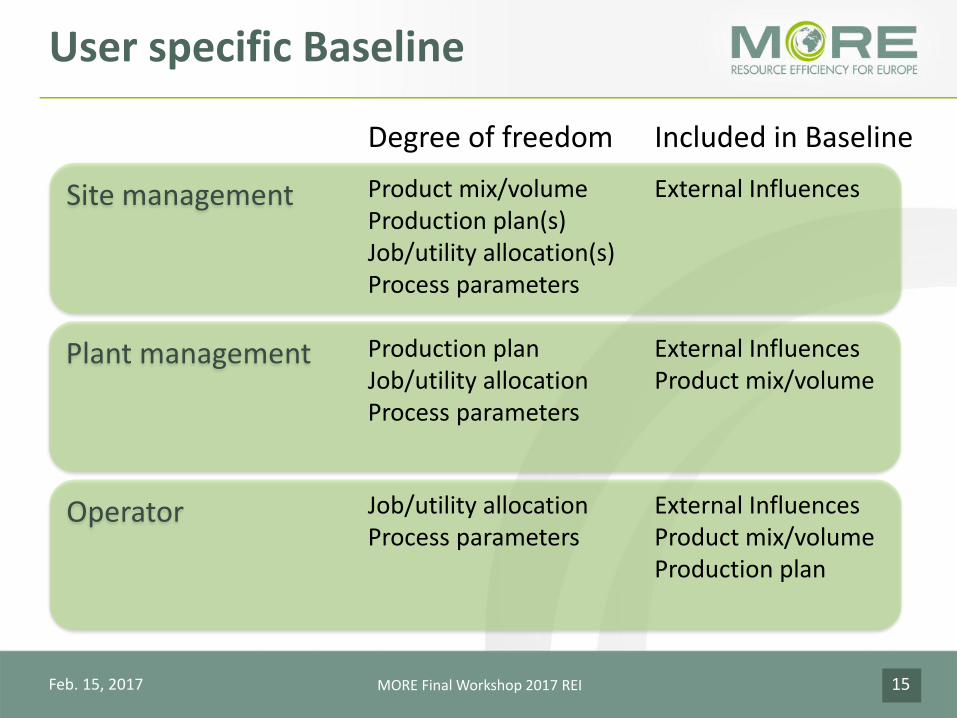
User specific Baseline
Feb. 15, 2017
Site management
Plant management
Operator
Included in BaselineDegree of freedom
Product mix/volumeProduction plan(s)Job/utility allocation(s)Process parameters
External Influences
Production planJob/utility allocationProcess parameters
External InfluencesProduct mix/volume
Job/utility allocationProcess parameters
External InfluencesProduct mix/volumeProduction plan
MORE Final Workshop 2017 REI

16
Different baselines
Feb. 15, 2017 MORE Final Workshop 2017 REI
Non-influenceable Parameter(s)
Res
ou
rce
effi
cien
cy in
dic
ato
r (R
EI)
Best practice for Operator
Best Practice for Plant Manager
Current Plant Operation Influenceable by Operator
Influenceable by Plant Manager

17
Environmental load
• Energy and material efficiency is not the only concern: environmental load must be included – separate indicators
• Many possible indicators:
– Use of fresh water
– Polluted water of different categories
– Gaseous emissions (greenhouse gases)
– Harmful emissions
– Solid waste of different categories
• Relevance depends on the location
MORE Final Workshop 2017 REIFeb. 15, 2017

18
• Raw materials can be converted or used as a source of energy (e.g. by exothermic side reactions)
• Introduction of the “Total Energy Consumption”
𝑅𝐸𝐼 =σ𝑖=1𝑛𝑆𝑡𝑒𝑎𝑚𝑚𝑆,𝑖 + 𝑊𝑒𝑙 +𝑚𝐹𝐺 𝐻𝐹𝐺
𝑈 + σ𝑗=1𝑛𝑅 Δ𝐻𝑗
𝑅
𝑚𝑃
– Accounts for the flows of energy due to the heat of reaction of the main reaction and the reaction to by-product
– Influence of operation on performance increases as catalyst selectivity is taken into account
Combined mass and energy flow analysis
Feb. 15, 2017 MORE Final Workshop 2017 REI

19
• Energy input per product output(separate or combined for different types of energy inputs)– Example: GJ Steam / t high value chemical
• Utilities/ raw materials required per ton of product(separate or weighted sum of different materials or utilities)– Example: m³ cooling water / t high value chemical
• Overall efficiency based on Energy Currency
• (Overall) yield for a resource– Example:
Mass conversion of Propylene and Ammonia into Acrylonitrile
• (Overall/ weighted) waste
Example of REIs for a site
CPHS 2016 • BrazilDez. 8th, 2016
20
• When REI are computed over short periods of time, storage effects may distort them.
• If large recycle streams are present, feedback effects occur on a long time scale.
• Remedies:
– Choose integration period long enough
– Include storage terms (accumulation/ depletion) into the computation
• Long-term effects must be included in some cases
– Deactivation of a catalyst dependent on the mode of operation
Dynamic effects
MORE Final Workshop 2017 REIFeb. 15, 2017

21
Generic and specific RTREI
Feb. 15, 2017
• Generic RTREIs for monitoring, optimization, reporting and decision making on the plant level
• Specific RTREIs for use in the day to day operations of individual units
MORE Final Workshop 2017 REI

22
Specific indicators
Feb. 15, 2017
• Measure the efficiency of units or of pieces of equipment
– E.g. steam consumption per ton of material processed
– Local view, may not always be correct from a global perspective (“shift of burden”)
• Helpful for operators and managers to assess and improve the daily operations
• Only comparable under similar conditions
MORE Final Workshop 2017 REI

23
• Idea: Use less complex indicatorsand detailed process information fromlower hierarchical levels to evaluate theaggregated performance
REI aggregation and contribution
Feb. 15, 2017 MORE Final Workshop 2017 REI
Application of equipment-specific
indicators where suitable
Lowest aggregation layerfor generic bottom-up
indicators
Generic indicators,specific indicators where
suitable
Generic indicators basedon aggregation
Complex
Plant 1
Section 1 Section 2
Equipment 1
…Equipment
n
Plant 2
Section 1 …
Base level of aggregation, mass and energy balances close
Indicatorcomplexity
Performancedeviationallocation

24
1. Decomposition of the plants to the lowest hierarchical level
Steps for aggregation
Feb. 15, 2017 MORE Final Workshop 2017 REI
Resource 1
AN
Energy
Resource 2
PlantComplex

25
1. Decomposition of the plants to the lowest hierarchical level
Decomposition of plants
Feb. 15, 2017 MORE Final Workshop 2017 REI
Resource 1
Resource 2
Product 2
Energy
Resource 1
Resource 2
Product 1
Energy
Plant 1
Plant 2

26
1. Decomposition of the plants to the lowest hierarchical level
Decomposition of plants
Feb. 15, 2017 MORE Final Workshop 2017 REI
Resource 1
Resource 2
Product 2
Energy
Resource 1
Resource 2
Product 1
EnergyEnergy
Energy
Inter-mediate 1
Inter-mediate 2
Plant 1Sub-plant 1
Plant 2Sub-plant 1
Plant 1Sub-plant 2
Plant 2Sub-plant 2

27
1. Decomposition of the plants to the lowest hierarchical level
2. Evaluation of the performance with historical data,identification of influencing factors
Steps for aggregation
Feb. 15, 2017 MORE Final Workshop 2017 REI
28
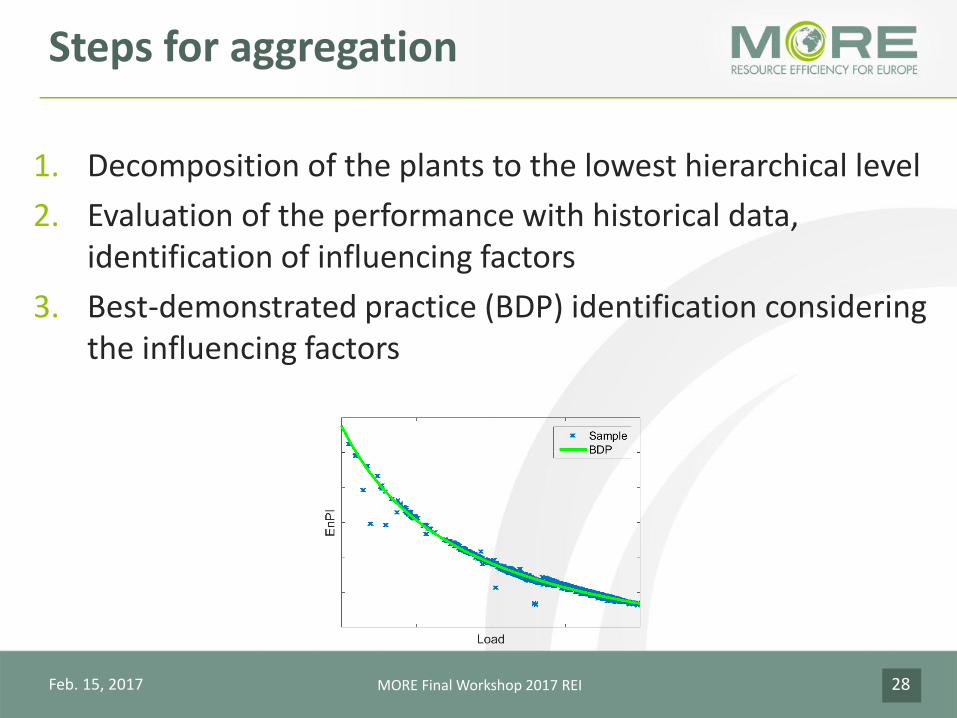
1. Decomposition of the plants to the lowest hierarchical level
2. Evaluation of the performance with historical data,identification of influencing factors
3. Best-demonstrated practice (BDP) identification consideringthe influencing factors
Steps for aggregation
Feb. 15, 2017 MORE Final Workshop 2017 REI

29
1. Decomposition of the plants to the lowest hierarchical level
2. Evaluation of the performance with historical data,identification of influencing factors
3. Best-demonstrated practice (BDP) identification consideringthe influencing factors
4. Aggregation of performance indicators and BDP to the nexthierarchical level
5. Visualization of the contributors to performance deviations
Steps for aggregation
Feb. 15, 2017 MORE Final Workshop 2017 REI

30
Visualization of contributions
Feb. 15, 2017 MORE Final Workshop 2017 REI
Standard Approach Aggregation and Contribution

31
• Individual batches
– Allocation of resources to this batch
• Overall production
– Plant logistics• Scheduling performance• Bottlenecks
– Slow dynamics• Catalyst degradation• Fouling
Feb. 15, 2017 MORE Final Workshop 2017 REI
RTREI for batch and mixed plants

32
batch balance
mwaste
mproduct
∑ Wm,cool∑ Qj,H ∑ Wi,el
mk
…
Qgenerated
.
RTREI for individual batches
Electrical energy efficiency
𝐸𝐸𝐸 =σ𝑖𝑊𝑖,𝑒𝑙
𝑚𝑝𝑟𝑜𝑑𝑢𝑐𝑡
Heating energy efficiency
𝐻𝐸𝐸 =σ𝑗𝑄𝑗,𝐻
𝑚𝑝𝑟𝑜𝑑𝑢𝑐𝑡
Cooling energy efficiency
𝐶𝐸𝐸 =σ𝑚𝑊𝑚,𝑐𝑜𝑜𝑙
𝑚𝑝𝑟𝑜𝑑𝑢𝑐𝑡
Total energy efficiency
𝑇𝐸𝐸 =σ𝑖𝑊𝑖,𝑒𝑙 + σ𝑗𝑄𝑗,𝐻 + σ𝑚𝑊𝑚,𝑐𝑜𝑜𝑙
𝑚𝑝𝑟𝑜𝑑𝑢𝑐𝑡
Feb. 15, 2017 MORE Final Workshop 2017 REI
Heat product
𝐻𝑃 =𝑄𝑔𝑒𝑛
𝑚𝑝𝑟𝑜𝑑𝑢𝑐𝑡
Total material efficiency
𝑇𝑀𝐸 =σ𝑘𝑚𝑘,𝑖𝑛
𝑚𝑝𝑟𝑜𝑑𝑢𝑐𝑡
Material efficiency
𝑀𝐸𝑘 =𝑚𝑘,𝑖𝑛
σ𝑝𝑚𝑝,𝑒𝑞,𝑘
Waste production
𝑊𝑃𝑗 =𝑚𝑗,𝑤𝑎𝑠𝑡𝑒
𝑚𝑝𝑟𝑜𝑑𝑢𝑐𝑡
Total waste production
𝑇𝑊𝑃 =σ𝑗𝑚𝑗,𝑤𝑎𝑠𝑡𝑒
𝑚𝑝𝑟𝑜𝑑𝑢𝑐𝑡
Water Usage
𝑊𝑈 =𝑚𝑤𝑎𝑡𝑒𝑟,𝑖𝑛
𝑚𝑝𝑟𝑜𝑑𝑢𝑐𝑡

33
REI for the overall batch plant
• Resource consumption that cannot be attributed to a single batch– Catalyst exchange
– Recycle purification
– Cleaning resource consumption
– Effect of production scheduling
• Statistical analysis of the individual batch RTREI on a medium time horizon (> weeks)– Discover effects of plant logistics (bottlenecks)
– Evaluate scheduling performance
Overall resource efficiency
𝑂𝑅𝐸𝑖 =𝑚𝑖
𝑚𝑝𝑟𝑜𝑑𝑢𝑐𝑡,𝑡𝑜𝑡𝑎𝑙
Feb. 15, 2017 MORE Final Workshop 2017 REI

34
Visualization concept – Sugar plant
Feb. 15, 2017 MORE Final Workshop 2017 REI16:00 17:00 18:00 19:00 20:00
45%
93%
91%
Material efficiency ME
Cooling energy efficiency CEE
Water Usage WU
!
!
Inefficient Efficient
Crystallizer sectionTotal energy efficiency TEE
95%
Heating energy efficiency HEE
Bullet-ChartHeating energy efficiency
HEE =σ𝑖 𝑄𝑖,𝐻
𝑚𝑝𝑟𝑜𝑐𝑢𝑘𝑡
Measurements: T01225 – T01231Data treatment: 10 min average
45%!Current numerical
value
Variability in set
Current value symbol
TrendWarning
Pan A1
Pan A2
Pan A3
Sugar Plant
Evaporator section
Crystallizer section
Recovery section

35
Clear focus on resource efficiency
Feb. 15, 2017
• Resource efficiency indicators should not be mixed with economic performance indicators
• Economic performance can be indicated in addition to explore trade-offs
– Pareto front indicates the trade-off
• The choice of the operating pointis a management decision
MORE Final Workshop 2017 REI
Pro
fit
[€/t
(pro
du
ct)]
●
●
●●●
●
●●
●●
●
● ●
●
●
●
● ●
Exceedinglegal limits
technically feasibleoperation points
Pareto front
Environmental load [Emissions/t(product)]

36
Summary: Definition of RTREIs
Feb. 15, 2017
• First step: Generic Resource Efficiency Indicators
• Material and energy flow analysis is the core
• Site fence defines the system boundary
• Environmental load (emissions/waste) should be considered separately
• Refinement to specific (tactical) indicators
• Trade-off with economic criteria not to be mixed with REIs
• Aggregation of indicators and addition of information on the incoming streams cradle-to-grave analysis
from less
MORE Final Workshop 2017 REI

37
Thank you for your attention
Feb. 15, 2017 MORE Final Workshop 2017 REI