real-time qc data for operational efficiency version 10 · cobas b 123 poc system cobas b 221 blood...
TRANSCRIPT

04348346010
eQAP User’s GuideReal-time QC data for operational efficiencyVersion 10
cobas b 123 POC system
cobas b 221 blood gas system
SM

version 10
The contents of this manual, including all graphics and photographs, are the property of Roche Diagnostics. No part of this document may be reproduced or transmitted in any form or by any means, electronic or mechanical, for any purpose, without the express written permission of Roche Diagnostics.
Roche Diagnostics has made every reasonable effort to ensure that all the information contained in this manual is correct at the time of printing. However, Roche Diagnostics reserves the right to make any changes necessary without notice as part of ongoing product development.
eQAP, COBAS and COBAS B are trademarks of Roche.
This training guide is published by the Engineering Operations Documentation department of Roche Diagnostics. Questions or comments regarding the contents of this guide can be directed to:
Roche Diagnostics Engineering Operations Department 9115 Hague Road P.O. Box 50457 Indianapolis, IN 46250-0457 USA © 2007-2014, Roche Diagnostics. All rights reserved.04348346010
eQAP User’s Guide i

ii eQAP User’s Guideversion 10
Revisions to this document are provided by Roche Diagnostics when necessary. No part of this document may be reproduced in any form or by any means without prior written consent.
PublicationReferenceNo.
PublicationDate PagesAffected
04348346001 November 2003 Creation
04348346002 June 2004 Entire document
04348346003 March 2005 Entire document
04348346004 March 2006 Entire document
04348346005 September 2006 Entire document
04348346006 March 2007 Entire document
04348346007 March 2010 Entire document
04348346008 March 2012 Entire document
04348346009 October 2012 Added cobasb 123 POC system and updated screenshots throughout
04348346010 April 2014 Removed Roche OMNI Modular System and updated navigation to Roche Diagnostics USA.
Revision History

version 10
On-Line Quality Assurance Program
GettingStarted Introduction................................................................................................................................................1
Overview......................................................................................................................................................1
ContactInformation...................................................................................................................................1
AccessingRocheDiagnosticsUSA..............................................................................................................1
AccessingeQAP...........................................................................................................................................2
Enroll an instrument in eQAP ...............................................................................................................2
Log in to eQAP and enter data ..............................................................................................................5
DataEntry SelectingtheHeaderInformation.............................................................................................................6
Selecting the Instrument ........................................................................................................................6
Selecting the Month and Year ................................................................................................................6
Selecting the Product and Lot ................................................................................................................6
QCData......................................................................................................................................................7
Data Entry Methods ...............................................................................................................................7
Data Import .....................................................................................................................................8
Summary Data ..............................................................................................................................12
Raw Data ........................................................................................................................................13
Validation Message ...............................................................................................................................14
Error Detection ..............................................................................................................................14
Printing Reports ...................................................................................................................................15
LinearityData............................................................................................................................................16
Entering Linearity Data ........................................................................................................................16
Submitting Linearity Data ...................................................................................................................18
Creating a Linearity Data Report .........................................................................................................19
Printing Reports ...................................................................................................................................19
AddingorRemovingLotNumbers..........................................................................................................20
Adding New Lot Numbers ...................................................................................................................20
Removing Lot Numbers .......................................................................................................................21
AppendixA eQAPexportcobasb221bloodgassystem.............................................................................................22
Setting the Data Export Format cobasb221 blood gas system.........................................................22
Exporting files from the cobasb221 blood gas system to a USB stick or floppy disk .....................23
AppendixB eQAPexportcobasb123POCsystem.....................................................................................................25
Setting the Data Export Format cobasb123 POC system ................................................................25
Exporting files from the cobasb123 POC system to a USB .............................................................26
Table of Contents
eQAP User’s Guide iii

Notes
iv eQAP User’s Guideversion 10

eQAP User’s Guide 1version 10
IntroductionWelcome to eQAP real-time peer review. This inter-laboratory statistical service, available through the Roche Diagnostics USA website, offers our customers access to a peer analysis program by providing secure web-based access to customer data and reports.
Enjoy the benefits of:• instantaneous reporting - receive up to the minute, live, quality control information the moment you
log on
• error checking for data entry - the centralized database manages and error-checks all data entries, flagging any results outside established parameters
• extra data entry - simply provide data in summary format, submit via daily entry, or download files saved from the cobasb123 POC system and cobasb221 blood gas system
• customized reports - receive a detailed custom report, highlighting inter-laboratory and peer group statistics.
OverviewOur On-Line Peer Analysis program is an internet-based system for review of Quality Control and Linearity information.
Contact InformationFor questions regarding data entry in the eQAP real-time peer review group reporting, contact the Roche Diagnostics Customer Support Center at 1-800-526-2272.
Accessing Roche Diagnostics USAeQAP peer group reporting program is available through the Roche Diagnostics USA website.
If you are not currently registered, instructions can be found at: usdiagnostics.roche.com/en/document/Login_Registration_instructions.pdf.
Getting Started

2 eQAP User’s Guideversion 10
Getting Started
Accessing eQAP
Enroll an instrument in eQAP 1. Log in to Roche Diagnostics USA.
2. Click QualityAssuranceProgram(eQAP) from the Support menu.

eQAP User’s Guide 3version 10
Getting Started
3. Click the EnrollanInstrumentineQAP link. For questions regarding instrument enrollment, contact Roche Technical Support at 1-800-526-2272 ext. 13555, for assistance.
4. Enter the instrument model number. Click Next.

4 eQAP User’s Guideversion 10
Getting Started
5. Enter the information in the appropriate fields of the Enrollment form.
6. Complete the Enrollment form contact information. Click Done once the form is completed.
7. Click the CloseWindow link to return to the eQAP main menu.

eQAP User’s Guide 5version 10
Getting Started
Log in to eQAP and enter data
1. Click QualityAssuranceProgram(eQAP) from the Support menu.
2. Click AccesseQAP from the eQAP screen.
n If a new or additional analyzer needs to be added, refer to the previous section.

6 eQAP User’s Guideversion 10
Selecting the Header Information
Prior to entering your monthly data you must first select the appropriate instrument, data entry month and QC Product criteria.
Selecting the Instrument
The first thing that must be selected is the instrument Model. This pull-down lists all instrument models that are registered for your hospital account.
Once you select your instrument model you must select the specific Instrument ID for that model. This pull-down list displays the instrument’s name, serial number or other unique identifier.
Selecting the Month and Year
Next select the Month and Year for which you are entering data. The system allows you to go back and enter, edit or view historical data.
Select Monthly QC from the Select Function pull-down menu if you are entering QC information. To enter Linearity material, select Linearity and refer to the “Entering Linearity Data” section.
n The header information must be filled out completely and in order before QC Product and Lot are selectable.
Selecting the Product and Lot
Once you complete all of the instrument parameters you need to set the QC or Linearity Product and Lot filter criteria. The product pull-down list contains all of the individual QC or Linearity products that you are currently using. The Lot pull down menu displays the lot numbers that you are currently using for the selected product.
The level is displayed at the end of the lot number for easy distinction between the levels.
Data Entry

eQAP User’s Guide 7version 10
QC Data
Data Entry Methods Now you may select your preferred method of data entry by clicking the link on the left side of the site. You may choose:
• Data Import
• Summary Data
• Raw Data.
Data Entry

8 eQAP User’s Guideversion 10
Data Import Data Import is available for customers who prefer to utilize the data management capabilities of their instrument. This method requires saving the monthly QC data to a USB device or diskette and then uploading the file from a PC with web access.
How to Import Monthly Data 1. Make the appropriate instrument and reporting period selections in the header area, and select the QC product with lot information. Select DataImport from the left menu.
2. Select the type of file to import. The system supports files that were exported from the cobasb 221 blood gas system and the cobasb 123 POC system.
Data Entry

eQAP User’s Guide 9version 10
3. Select the Browse button. This opens a window allowing you to browse to the location on your PC where the file is stored.
4. Select the file and click Open.
5. After selecting the appropriate QC file from the Browse menu, click SubmitFile.
Data Entry

10 eQAP User’s Guideversion 10
6. The following information screen appears, summarizing the data that was found to import:
Click the Proceedwithimport button to proceed, or Cancel to return to the main screen. Only the lot currently selected at QC Product and Lot is imported.
If there is no matching lot contained within the data file to that selected at QC Product and Lot, the message, “the file contains no relevant data” is displayed.
The following screen displays if data fails to import:
Data Entry

eQAP User’s Guide 11version 10
7. Click the Submit button to save the imported data into the database. A pop-up window appears confirming the successful download of data.
n You may view the actual raw data imported by selecting Raw Data under Data Entry options. Data may be edited in the Raw Data screen.
8. Click OK to confirm.
9. Click NextLot, at the lower right of the screen, after completing data entry for each lot number (Next Lot button becomes inactive after last lot is selected).
10. After all data is imported, click Summary to run a monthly report.
n If the pop-up blocker is ON, you may need to temporarily allow pop-ups. Click on the pop-up message at the top of the screen and select “temporarily allow pop-ups.”
n For information on how to generate a monthly report, refer to the Printing Reports section.
Data Entry

12 eQAP User’s Guideversion 10
Summary Data Summary data entry is the entry method for those customers who have used the instrument or calculated their own Mean and Standard Deviations using a data manager or manual method.
Entering Summary DataThe data entry screen is where you enter all of your QC data for that particular instrument.
How to Enter Summary Data1. In the Data Entry section on the left side of the screen, click SummaryData, then click Editlocated at the bottom of the data entry grid.2. For each analyte, click in the Points field. Enter the total number of QC samples run during the month for the respective analyte.3. Press the TAB key to advance to the Mean field. 4. Enter your calculated mean for the month. 5. Press the TAB key to advance to the SD field. 6. Enter your calculated 1 SD. 7. Continue entering your data for all analytes of the selected lot number. 8. Click Submit located at the bottom of the data entry grid and click OK. 9. Click NextLot after completing data entry for each lot number. Repeat steps 1-9 until data for all lots is entered (Next Lot button becomes inactive after last lot is selected).
n For information on how to generate a monthly report, refer to the Printing Reports section.
Data Entry

eQAP User’s Guide 13version 10
Raw Data Raw Data entry is for those customers who do not have the capabilities to process summary statistics. This system is meant to replace the “old” method of plotting daily QC results on a Levy-Jennings chart. With this method customers can log on after they run their controls and enter the data into our system, where it will be stored in our database.
Entering Raw DataThe Raw Data Entry Screen is where all of your individual QC values are calculated into mean and SD values.
HowtoEnterRawData1. In the “Data Entry” section at the left side of the screen, click RawData,then select your analyte.2. Click Edit located at the bottom of the data entry grid, then click in the first field of the Value column.3. Enter your individual value and press the TAB key on your keyboard to advance to the next field. 4. Continue entering your data. 5. Click Submit when you finish entering values for all analytes or pick the next analyte.6. Repeat steps 2 through 5 for all remaining analytes.7. Click NextLot after completing data entry for each lot. Repeat steps 1-9 until data for all lots is entered. (Next Lot Button becomes inactive after last lot is selected).
n The Raw Data screen is designed to display data points, mean and SD only when that particular analyte is selected. To view an update of the calculations for each parameter added in the Raw Data screen, click the Summary Data link under the data entry header.
Data Entry

14 eQAP User’s Guideversion 10
Validation MessageAs you enter data, the system automatically checks each entry to ensure that values entered are correct. If a value falls outside of the range a message appears in the column on the far right of the data entry grid. This is to provide you with a means of correcting possible transcription errors before saving your data. If a message does appear, verify that the value entered is correct and make any necessary changes or continue entering data.
ErrorDetectionTo help ensure quality, our system uses the manufacturer’s insert ranges to check for errors. Any value that falls outside of this range are excluded from the peer group calculations. This protects the integrity of the peer group by preventing erroneous data from corrupting the group.
Example: If the insert ranges are 7.150 - 7.210 any value above or below the range is excluded from the peer group.
n When using the Data Import feature, you must scroll to each parameter to see the warnings on screen for values that are out of range.
All excluded values are periodically reviewed for possible trends in QC degradation. This involves looking at each entry that was excluded and searching for possible errors in the insert ranges.
Example: If, out of a possible 20 analyzers reporting Ca values on Lot # A, 15 were reporting outside of the insert ranges, Bionostics would notify the manufacturer of changes recommended for insert ranges to accurately reflect the lot performance. After investigation, if values are verified as needing a change, customers will be notified.
Data Entry

eQAP User’s Guide 15version 10
Printing ReportsYou may run your monthly report at any time during the month to compare values against the peer group. All reports are calculated liveso that your peer group is up to date at the time that you print it.
To run a monthly report click the MonthlySummary link on the left side of the web page. Note that the report may take several minutes to generate.
n Be sure to save a copy of the report.
To print, click Summary to run a monthly report.
Data Entry

16 eQAP User’s Guideversion 10
Linearity Data
Entering Linearity Data1. Select Linearity from the Select Function menu.
2. Select the Linearity Product, Kit lot and Lot number from the QC Product and Lot menu listings.
Data Entry

eQAP User’s Guide 17version 10
3. Select the Linearity link located under Data Entry in the left column.
4. Click Edit.5. Select the analyte to enter data (e.g., pH).6. Click in the first field of the Value column.7. Enter individual Linearity data values.
n Press <Tab> to advance to each additional value.
Data Entry

18 eQAP User’s Guideversion 10
8. If you enter a value that is outside of the expected range, a Validation Message may appear. You may accept the value, if correct or edit the entry.
Submitting Linearity Data1. Click Submit after entering all Linearity values. 2. A message appears verifying you wish to save. Click OK.3. A message appears verifying the data was saved correctly. Click OK.
n Pushing the cancel button prompts you to save the data. If the data has been saved using the submit button, click OK to leave the screen.
Data Entry

eQAP User’s Guide 19version 10
Calibration Verification - Linearity ReportInstrument :ROCHE / OMNI 1
Instrument ID :Respiratory
ROCHE TECHNICAL SUPPORT
9115 Hague Road
Date Printed : 2/27/2012
Report Period : January 2012
Indianapolis, IN 46250-0457
Kit Lot Number : 012318 Expiration Date : July 2013 Product : CVC123
Analyte : pH Units :
Linear Regression Bias
Your Statistics Peer Statistics
Slope:
Intercept: Intercept:
Slope: .9764
.1726
.9825
.1286
Level
Expected
Mean Recorded Values Mean SD CV %
Your Data Variance Peer Data
Points Mean CV %SDExp Vs. Recorded
1 6.91, 6.9, 6.91 6.907 .005 1.08 92 6.891 0.011 2.57 6.880 0.391% 0.027
2 7.145, 7.146, 7.147 7.146 .001 0.18 89 7.155 0.009 1.94 7.160 -0.196%-0.014
3 7.375, 7.377, 7.379 7.377 .002 0.37 86 7.395 0.009 2.07 7.390 -0.176%-0.013
4 7.555, 7.566, 7.577 7.566 .009 2.05 84 7.565 0.006 1.35 7.570 -0.053%-0.004
5 7.77, 7.77, 7.769 7.770 .001 0.12 87 7.762 0.008 1.80 7.770 0.000% 0.000
Comments
Signature : Date :
Creating a Linearity Data Report1. Click theLinearity link under Reporting on the left side of the page. 2. The Linearity report displays as a PDF in a separate window.
n If the pop-up blocker is ON, you may need to temporarily allow pop-ups. Click on the pop-up message at the top of the screen and select “temporarily allow pop-ups.”
Printing ReportsYou may run your monthly report at any time during the month to compare values against the peer group. All reports are calculated liveso that your peer group is up to date at the time that you print it.
To run a monthly report click the MonthlySummary link on the left side of the web page. Note that the report may take several minutes to generate. Be sure to save a copy of the report.
Data Entry

20 eQAP User’s Guideversion 10
Adding or Removing Lot Numbers
Adding New Lot NumbersTo add new lot numbers you must select the new lot number as well as the analytes that you are reporting.
Only lot numbers that are still within their expiration dates are displayed. Only QC material can be added. Linearity material is preloaded for all customers.
HowtoAddNewLotNumbers1. Click the NewLot link under Setup on the left side of the page.2. Select the QC Product from the pull-down menu of available QC Products. This filters the list of lot numbers.3. Select the Lot Number from the pull-down list of available lots. 4. Once you have selected your lots a grid appears displaying the list of available analytes.5. Click Edit at the bottom of the grid to activate the analyte grid.6. Click the checkbox that corresponds to the analytes that you wish to add. Use the scroll bar to the right of the screen to view the full list of analytes.7. You may also select the appropriate units of measure for the selected analyte.
n Method and Reagent are also displayed, but are not applicable for blood gas instruments.
8. Click Submit located at the bottom of the grid.9. You may now click the DataEntry link to begin entering data for your new lot.
Data Entry
eQAP User’s Guide 21version 10
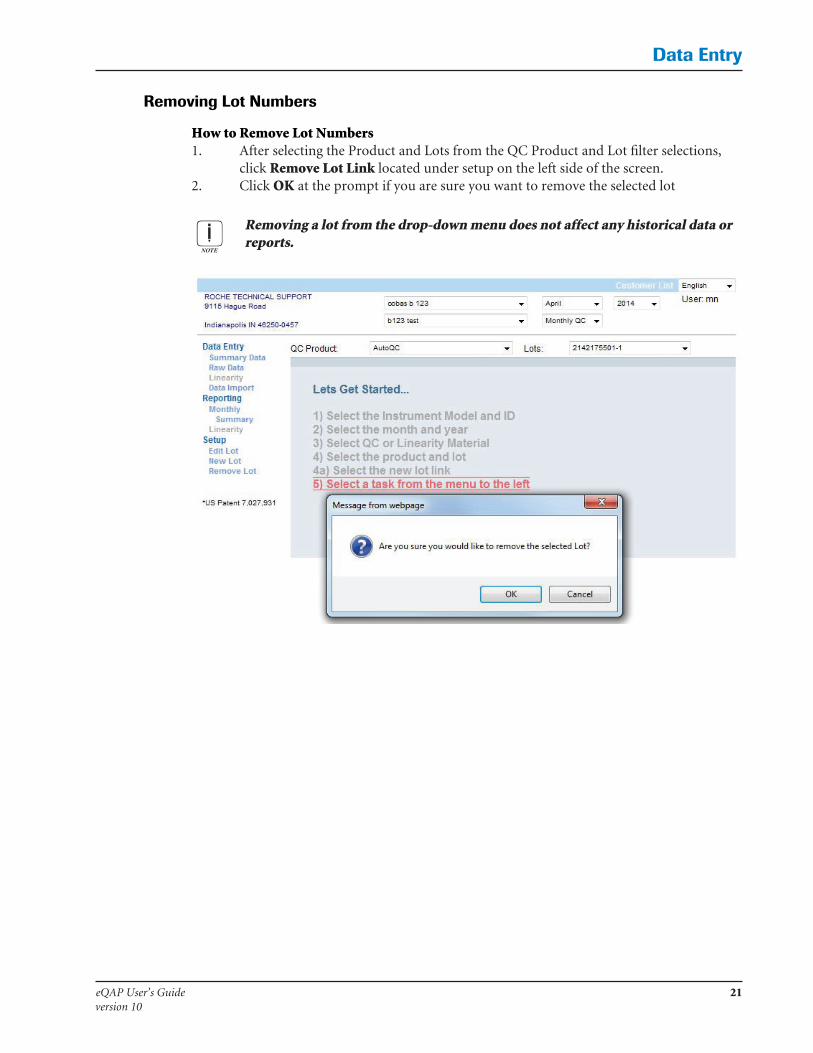
Removing Lot Numbers
HowtoRemoveLotNumbers1. After selecting the Product and Lots from the QC Product and Lot filter selections, click RemoveLotLink located under setup on the left side of the screen.2. Click OK at the prompt if you are sure you want to remove the selected lot
n Removing a lot from the drop-down menu does not affect any historical data or reports.
Data Entry

22 eQAP User’s Guideversion 10
Appendix A
eQAP export cobas b 221 blood gas system
SettingtheDataExportFormatcobasb221bloodgassystem
To check or change the order of the data fields for the QC database export press Setup > DisplaysandReports > QCMeasurement > QCDatabaseExport.
n The QC Database Export “Selected Items” list should typically be set in the same order that they appear on the left side of the set up screen on the “Items” list. Select items using the right pointing arrow key between the “Items” list and the “Selected Items” list the field highlighted on the left side moves under the line where the cursor exists on the “Selected Items” list.
1. Date2. Time3. Material4. Level5. Lot number6. Exp Date7. Base8. Equilibration Temp (Temp AQC)9. Remark field10. Analytes start here (e.g., pH, CO
2)
The order of the analytes (e.g., pH, pO2, Na) in the “Selected Items” list can be in any order as long as
they begin at item #10. List all analytes needed for import for the program. The additional fields do not effect the import to the eQAP program.
After setting the order of the “Selected items” for export, selected QC records may be exported for evaluation. The export is performed using DataManager > QCMeasurements > More > Export. The files must be imported as .txt files to the program. Typically a month’s data is exported for evaluation. Use a tab delimited file type.

eQAP User’s Guide 23version 10
Exportingfilesfromthecobasb221bloodgassystemtoaUSBstickorfloppydisk
See section B of the cobas b 221 blood gas system Instructions for Use of the analyzer for reference material. It shows a list of icons and the screen that must be accessed to down load the files.
n You should clean up your data first by reviewing for outliers and removing bad data points that should have been rejected.
1. Open the Data Manager file folder using the Data Manager icon in the top right corner of the screen.
2. Pick “QC data” to display a screen similar to the one below.
Appendix A

24 eQAP User’s Guideversion 10
Appendix A
3. The icon for mark range at the bottom of the screen is used to select the date range (Typically a month’s data is exported for evaluation).
4. After picking that icon, set the date range that is needed (One month’s data e.g., 3/01/2014 to 3/31/2014). The selected lines are now highlighted in yellow.
5. Export is performed using DataManager > QCData > More (the right pointing arrow key) >Export to show the Data Export icon on the next screen.
6. Pick the Data Export icon .
7. Setup the file for export:a. The files must be imported as .txt files to the program (i.e., text file with field delimiters). b. Name the file in a manner that it is unique when imported (e.g., July2013).c. Do not use compression. Turn it off so that a red dot is by the 0.d. Use a “tab delimited” file type. You may have to select this delimiter using the right left arrow keys near that field.e. Use a format style of decimal point (i.e., not a comma).
When data is selected:8. Press the Start button and insert the USB Stick (or for old SNs the floppy disk). This captures all lots of material run during that time frame.
9. Remove the storage medium.

eQAP User’s Guide 25version 10
eQAP export cobas b 123 POC system
See Chapter 9, Quality Control of the cobas b 123 POC system Instructions for Use, for more detailed information. The following are abbreviated specific steps.
SettingtheDataExportFormatcobasb123POCsystem1. Specify date format as (MM/dd/yyyy), m/dd/yy, mm/dd/yy, m/dd/yyyy, or mm/dd/yyyy for U.S. customers. For International Customers: dd/mm/yy. Include time format to 12 hour or 24 hour clock with format (e.g., 07/17/13 13:52). To set press Utilities > Configuration> System > Date/time
Appendix B

26 eQAP User’s Guideversion 10
Appendix B
2. Set export to use comma delimited file. To set press Utilities > Configuration> System > Export/import and select the delimiter to comma. Set the decimal point format to period.
Exportingfilesfromthecobasb123POCsystemtoaUSB
1. To open the database press Workplace > QCDatabase >

eQAP User’s Guide 27version 10
Appendix B
2. Designate which records to import from the database. After selecting the QC database, a list of records appears that can be sorted. Use the search icon that appears at the bottom of the screen to filter for the appropriate record. (This icon looks like binoculars.) After opening the search feature filter by date and QC record type to select the appropriate records as seen in the picture below. Any record type, date or other selection criteria desired may be selected to obtain a specific set of records.

28 eQAP User’s Guideversion 10
Appendix B
3. Select records for export. Use the icons to select required records. The records are highlighted after selection.
marks a single record in a file; select each record and press this button to highlight
marks all records
4. Export the records to USB stick. Use the export icon to start the export process. The analyzer prompts through three steps including:
• Add the USB storage device to the instrument’s USB port:

eQAP User’s Guide 29version 10
Appendix B
• Start the export of data.
• Remove the USB storage device and close the window.

30 eQAP User’s Guideversion 10
Notes
Appendix B