real-time modelling and simulation of distribution system
TRANSCRIPT

i
REAL-TIME MODELLING AND SIMULATION OF DISTRIBUTION
SYSTEM PROTECTION WITH AND
WITHOUT RENEWABLE DISTRIBUTED GENERATION
By
Ntuba Irene Nkhasi
211535371
In partial fulfilment of the academic requirements for the degree of
Master of Science in Electrical Engineering,
College of Agriculture, Engineering and Science
University of Kwazulu Natal
December 2017
Supervisor: Dr A K Saha
ii
ABSTRACT
The conventional radial power distribution systems were initially not designed to
accommodate distribution generation (DG). As DG penetration is being considered by many
distribution utilities, there is a rising need to address many incompatibility issues that put a
big emphasis on the need to review and implement suitable protection schemes. For a
significant greenhouse gas reduction using photovoltaic systems, numerous generators ought
to be embedded in the distribution system. For an effective penetration of PV systems on a
large-scale into the current distribution network, considerable work to investigate the nature
of incompatibility problems has been done and research is being carried out to develop
successful integration strategies. The main objectives of the thesis are; to model and simulate
a distribution system protection scheme, to study radial networks’ protection system
challenges after embedding distributed generation sources, investigation on the impacts of
high PV penetrations on protection systems of distribution networks and lastly make
modification recommendations and essential review process of existing protection equipment
settings. To accomplish the above-mentioned objectives, a radial distribution network is
modelled, simulated and protection settings validated. The PV generation system is designed
and added to specific distribution feeders and steady steady-state results obtained. The results
show that addition of DGs cause the system to lose its radial power flow. There is an increase
in fault contribution hence causing maloperation such as protection coordination mismatch.
An overall protection scheme is then proposed based on the addition of DG’s and an efficient
adaptive protection system for the distribution networks with a considerable penetration of
dispersed generations implemented. The impact study is performed which is compared with
the existing protection scheme and necessary modifications done. The entire analysis is
simulated on a real-time digital simulator (RTDS) and results displayed in a MATLAB
environment. For the islanded mode, relaying considerations are provided and
implementation of anti-islanding techniques achieved.

iii
Acknowledgements
My heartfelt gratitude goes to my supervisor Dr. A.K Saha for his constant supervision,
valuable academic support and patience during the course of the research. Thanks for the
encouragement and always being available to guide and advice although it was long and went
through some bumpy times. It has been an absolute pleasure working under his selfless
supervision. My sincere appreciation also goes to my friend N.V. Ndlhozi, who dedicated
time off his busy schedule and work to proofread my drafts. To my mother and family, thank
you for your encouragement and support all the way through my research journey, thanks for
not letting me give up. Finally yet importantly, this thesis is a dedication to my late father and
sister who are not around anymore to witness my academic achievements, this one is for you.
iv
Table of Contents
ABSTRACT ............................................................................................................................... ii
Acknowledgements .................................................................................................................. iii
List of Figures: ......................................................................................................................... vii
List of Tables ............................................................................................................................ ix
List of Abbreviations: ................................................................................................................ x
1. Introduction ........................................................................................................................ 1
1.1. Background ................................................................................................................. 1
1.2. Importance of research ................................................................................................ 2
1.3. Research objectives ..................................................................................................... 3
1.4. Research scope and limitations ................................................................................... 3
1.5. Problem statement ....................................................................................................... 4
1.6. Thesis outline .............................................................................................................. 4
2. Literature Review ............................................................................................................... 6
2.1. Introduction ................................................................................................................. 6
2.2. Review on faults .......................................................................................................... 6
2.3. Protection philosophy .................................................................................................. 7
2.3.1. Essential qualities of protection. .......................................................................... 8
2.4. Protective equipment ................................................................................................... 8
2.5. Protection scheme ....................................................................................................... 9
2.5.1. Transformer protection ...................................................................................... 10
2.5.2. Differential protection ........................................................................................ 10
2.5.3. Overcurrent Protection ....................................................................................... 10
2.6. Protection coordination ............................................................................................. 12
2.7. Distributed generation ............................................................................................... 12
2.7.1. Distributed Generation Technology ................................................................... 13
2.7.2. Grid-tied Photovoltaic System ........................................................................... 13
2.8. Impact of DG integration to the existing grid and protection scheme ...................... 14
2.9. Mitigation methods to DG penetration issues. .......................................................... 16
3. Methodology ..................................................................................................................... 18
3.1. Software selection ..................................................................................................... 18
3.2. Modelling of the distribution network in RSCAD .................................................... 19
3.2.1. Draft programme ................................................................................................ 19
3.2.2. Runtime programme .......................................................................................... 19

v
3.3. Protection set-up ........................................................................................................ 20
3.4. Protection relay testing .............................................................................................. 20
3.5. PV generation system design .................................................................................... 20
3.6. Grid-tied inverter model development ...................................................................... 21
3.7. Stand-alone grid tied PV system ............................................................................... 21
3.8. Optimal relay coordination........................................................................................ 21
3.9. PV impacts mitigation methods ................................................................................ 22
3.10. Recommendation for future works ........................................................................ 23
4. Modelling and real-time simulation ................................................................................. 24
4.1. Test distribution system configuration ...................................................................... 24
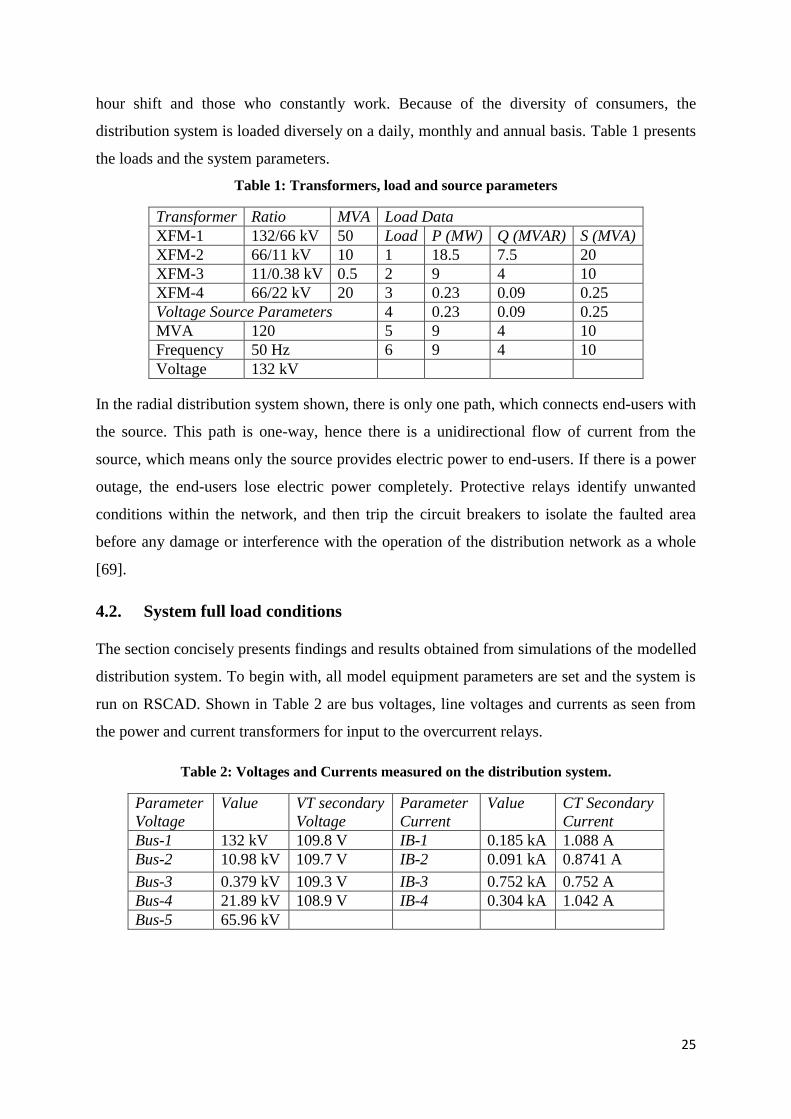
4.2. System full load conditions ....................................................................................... 25
4.2.1. Fault and breaker logic control .......................................................................... 27
4.2.2. Relay logic control ............................................................................................. 27
4.3. Software relays’ simulation:...................................................................................... 28
4.3.1. Testing software Relay-3 ................................................................................... 28
4.3.2. Time setting of Relay-2: .................................................................................... 29
4.3.3. Testing software Relay-2: .................................................................................. 30
4.3.4. Time setting of Relay-1: .................................................................................... 31
4.3.5. Testing software Relay-1: .................................................................................. 31
4.3.6. Testing software Relay-4 ................................................................................... 32
4.4. Protection Coordination results ................................................................................. 33
5. Experimentation and Verification .................................................................................... 37
5.1. Hardware-in-loop simulation .................................................................................... 37
5.1.1. Testing Hardware Relay-3 ................................................................................. 38
5.1.2. Testing Hardware Relay-2 ................................................................................. 38
5.1.3. Testing Hardware Relay-1 ................................................................................. 38
5.1.4. Testing Hardware Relay-4 ................................................................................. 39
5.2. Grid-connected PV system ........................................................................................ 40
5.2.1. Inverter model development .............................................................................. 41
5.2.2. Steady-state operation ........................................................................................ 43
5.2 Overcurrent Protection set-up ................................................................................... 48
5.3 Islanding Protection................................................................................................... 52
5.3.2 Passive techniques ............................................................................................. 52
5.3.3 Active techniques ............................................................................................... 53

vi
5.3.4 Islanding operation............................................................................................. 53
6 Conclusion ........................................................................................................................ 57
References ................................................................................................................................ 59
Appendix .................................................................................................................................. 65
vii
List of Figures:
Figure 1: Single line diagram of the modelled distribution system ......................................... 24
Figure 2: System R.M.S Currents ............................................................................................ 26
Figure 3: Distribution system RMS voltages ........................................................................... 26
Figure 4: Fault and circuit breaker logic .................................................................................. 27
Figure 5: Software overcurrent relay used ............................................................................... 28
Figure 6: Relay-3 operating for a fault on 380 V busbar ......................................................... 29
Figure 7: Relay-2 testing for a fault at zone-3 (380V busbar) ................................................. 30
Figure 8: Relay-2 operating for a fault at zone-2 (11 kV busbar) ........................................... 30
Figure 9: Relay-1 operating for a fault at zone-2 (11 kV busbar) ........................................... 31
Figure 10: Relay-1 operating for a fault at zone-1(132 kV busbar) ........................................ 32
Figure 11: Relay-4 operating for a fault on the 22 kV busbar ................................................. 32
Figure 12: Relay-2 failing to operate ....................................................................................... 33
Figure 13: Failure of relay-3 and relay-2 to operate ................................................................ 34
Figure 14: Operation of relay-2 for a fault at protection zone 3 .............................................. 35
Figure 15: Relay-4 failing to operate ....................................................................................... 35
Figure 16: System hardware-in-loop connection ..................................................................... 37
Figure 17: Hardware Overcurrent Relay 3 operating .............................................................. 38
Figure 18: Hardware Overcurrent Relay 2 operating .............................................................. 38
Figure 19: Hardware Overcurrent Relay 1 operating .............................................................. 38
Figure 20: Hardware Overcurrent Relay 4 operating .............................................................. 39
Figure 21: RSCAD model of grid connected PV system ........................................................ 40
Figure 22: Large and small time-step simulation interface ..................................................... 42
Figure 23: Characteristic curves of the PV array at STC ......................................................... 43
Figure 24: PV Array output voltage......................................................................................... 43
Figure 25: Stand-alone PV System output RMS voltage......................................................... 44
Figure 26: Single line diagram of the grid-tied photovoltaic system....................................... 45
Figure 27: Grid-connected PV system voltages....................................................................... 45
Figure 28: Grid-connected PV system CTs secondary RMS current ...................................... 46
Figure 29: PV System RMS voltage ........................................................................................ 47
Figure 30: System RMS currents ............................................................................................. 47
Figure 31: Relay-3 testing ........................................................................................................ 50
Figure 32: Relay-2 testing ........................................................................................................ 50
Figure 33: Testing relay-1 ........................................................................................................ 51
Figure 34: Relay-4 testing results ............................................................................................ 51
Figure 35: A radial feeder with PV generation integrated ....................................................... 53
Figure 36: Distribution system currents due to islanding ........................................................ 54
Figure 37: Protection against islanding layout......................................................................... 54
Figure 38: Circuit breaker logic ............................................................................................... 55
Figure 39: Circuit breaker 1 and 6 opening on fault F-1 occurrence ....................................... 55
Figure 40: System line current during islanding protection..................................................... 56
Figure 41: Circuit breaker 1 and 6 opening on fault F-2 occurrence ....................................... 56
Figure 42: Distribution System Model on RSCAD environment ............................................ 65

viii
Figure 43: GTFPI and GTAO card used for exporting signals ................................................ 66
Figure 44: PV System characteristics graphs........................................................................... 66
Figure 45: Maximum Power Point Tracking control circuit .................................................... 67
Figure 46: 2-level DC/AC inverter and filter ........................................................................... 67
Figure 47: Triangle wave data generator for the DC/AC inverter ........................................... 67
ix
List of Tables
Table 1: Transformers, load and source parameters ................................................................ 25
Table 2: Voltages and Currents measured on the distribution system. .................................... 25
Table 3: Comparison of operating time from software and hardware relays .......................... 39
Table 4: Parameters of Mitsubishi Electric Photovoltaic Module ........................................... 40
Table 5: PV system parameters and expected outputs at STC ................................................. 42
Table 6: PSM and a values ...................................................................................................... 49
Table 7: Dial output and corresponding fault .......................................................................... 65
Table 8: 1st iteration (Slack variables as basics) ..................................................................... 68
Table 9: 2nd iteration (X2 enters as basic, S2 comes out) ........................................................ 68
Table 10: 3rd iteration (X1 enters as basic, S1 comes out) ....................................................... 68
Table 11: 4th iteration (X3 enters as basic, S5 comes out) ....................................................... 68
x
List of Abbreviations:
DG Distributed Generation
IEEE Institute of Electrical and Electronics Engineers
IEC International Electro-technical Commission
PV Photovoltaic
DC Direct Current
AC Alternating Current
RTDS Real-time Digital Simulator
CT Current Transformer
VT Voltage Transformer
CB Circuit Breaker
OCR Overcurrent Relay
TMS Time Multiplier Setting
IDMT Inverse Definite Minimum Time
PSM Plug Setting Multiplier
CTI Coordination Time Interval
LOM Loss of Mains
ETAP Electrical Transient and Analysis Program
PSCAD Power System Computer Aided Design
HVDC High Voltage Direct Current
HIL Hardware-in-Loop
GUI Graphical User Interface
GTFPI Gigabit-transceiver Front Panel Interface
GTAO Gigabit-transceiver Analogue Output
MPPT Maximum Power Point Tracking
RMS Root Mean Square
VSC Voltage Source Converter
IGBT Insulated Gate Bipolar Transistor
STC Standard Test Conditions
NOCT Normal Operating Cell Temperature
PCC Point of Common Coupling
LPP Linear Programming Problem
1
1. Introduction
This research work highlights the effective use of a real-time digital simulator (RTDS) for
modelling, analysis and protection of an electrical distribution network emanating from
a 132 𝑘𝑉 grid. It provides an introduction to overcurrent protection scheme on a distribution
network injected with dispersed generation (DG) and the DG potential benefits to distribution
utilities discussed. A review of the protection issues associated with dispersed generation is
conducted. In this chapter, the research background, objectives and methodologies employed
in this thesis are stated and finally the chapters outline is provided. The system under study is
a modified adaptation of the IEEE test feeders.
1.1. Background
Due to a constantly rising energy demand and roughly two centuries of total dependency on
fossil fuels, the world has begun to feel the greenhouse gas emissions effect. As the demand
for electrical energy seems to be on a rise, alternative fuels are being looked at apart from
fossil fuels that power thermal power plants. Nuclear or hydroelectric power generation
systems do not generate greenhouse gases and are another alternative to be considered except
that a high level of safety is required for nuclear while water levels, which hydroelectric
depend on, are not entirely reliable [1] [2].
Distributed generation systems such as photovoltaic energy, wind turbines, fuel cells and
other energy storage technologies are at present increasingly finding their significance to
solve environmental issues. Unlimited renewable energy resources such as solar can serve as
substitutes for fossil fuels consequently reducing greenhouse gases significantly. Photovoltaic
generation through photovoltaic effect, converts solar irradiation directly into electrical
energy using solar cells. With the technical evolution, finance and electrical markets
expansion, new technologies make possible the electricity generation in small plants closer to
consumers.
This new concept leads to the development of innovative electrical power distribution
systems where photovoltaic (PV) generation systems supplies some of the energy and
centralized generation produces some. Traditional distribution systems are of radial topology,
which only permits flow of power in a single downstream direction and the protection
schemes are dependent on this assumption, particularly overcurrent relay selectivity and
coordination [3]. The unidirectional power flow assumption does however not hold when
2
distributed generation is injected in the distribution system. Back flow of current occurs due
to multiple sources hence disturbing the standard overcurrent protection and their relay
sequential operation.
Major concerns relating to penetration of PV systems include poor relay coordination,
sympathetic tripping and unintentional islands which result from continuous power flow from
the dispersed generation systems although the grid is disconnected due to a fault. Many
power distribution utilities currently mitigate these problems by limiting the DG units’
capacity and using strategic location [4]. This thesis aims to focus on the modelling of a
radial distribution feeder system structure and study the impacts of distributed energy
resources when integrated with distribution systems including relaying considerations when
in islanded mode.
1.2. Importance of research
For any nations’ technological and economic progression, a steady and reliable electric power
supply system is an inevitable pre-requisite. It is a known fact that around the world a higher
percentage of the power systems’ equipment damage and customer service interruptions
results from failure and faults in the electricity distribution feeders since overhead
distribution systems are subject to either temporary or permanent faults. Distribution systems
comprise of many diverse and expensive items that require a substantial capital investment
and it therefore it is very essential to protect this equipment. Moreover, a considerable
quantity of photovoltaic generators has to be injected into the distribution network for a
significant reduction in the greenhouse gas emissions. Large-scale PV penetration however
gives rise to potential distribution system protection problems such as protective equipment
coordination issues, etc. [3]. For an effective penetration of PV systems on a large-scale into
the current distribution network, considerable work to investigate the nature of
incompatibility problems has been done and this research is being carried out with a purpose
to develop and implement strategies for successful integration of PV generators into the
present network. The thesis aims to cover a systematic approach from modelling the
distribution network to various protective devices’ coordination on different nodes of the
feeder, the DG’s impact on the system and to cover lastly the implementation of mitigation
methods on the identified issues.

3
1.3. Research objectives
The core objectives of the thesis are:
Modelling and simulation of a distribution system overcurrent protection scheme
To introduce PV generation system into the distribution network and identify issues
arising concerning the network protection system.
To address the identified and aforementioned issues to maintain and improve the grid-
tied photovoltaic energy systems’ performance.
To investigate the impact of high PV penetrations levels distribution system stability
and on protection systems performance while varying the PV point of common
coupling to different voltage levels.
To make modification recommendations and essential review process of existing
protection equipment settings for correct discrimination.
To implement mitigation strategies to some of the problems arising from introduction
of PV systems to the distribution network
To make recommendations on studies that can be carried out to further this research
work
1.4. Research scope and limitations
The research identifies issues related to interconnection of PV systems to distribution
utilities, reviews and implements some pragmatic mitigation methods. This research scope
and limitations are as follows:
Only the major technical issues with over-current protection relays’ coordination of a
distribution system are covered and addressed.
The DG technologies have been limited to photovoltaic (PV) generation, which are
based on solar panels and DC-AC inverters.
The main focus is on protection scheme and protection issues related to
interconnection of the PV system.
Models have been developed in RSCAD and RTDS simulator and some of the
standard models available in the software have been used.

4
1.5. Problem statement
To demonstrate by simulation and experimental tests a distribution system model and
overcurrent protection scheme implementation and testing of protection devices through a
hardware-in-loop connection. As outlined earlier, the electricity demand is currently fast
growing and power engineers are bound to produce electricity from renewable energy sources
to overcome this upsurge and simultaneously diminish environmental effects and carbon
footprint of power generation. To address mitigation methods to some of the issues created
by addition of distributed generation to electricity distribution network.
1.6. Thesis outline
This section presents an overview of the research work covered. The thesis consists of six
chapters and an appendix. Each chapter’s summary of content is provided and organized
below as follows:
Chapter 1: Introduction
This is an overview to the research work undertaken, outlining aims and objectives,
description of motivation, research scope plus limitations and the background of this
research. It introduces the concept and background of distributed generation, existing
methods of harnessing renewable energy, particularly the role of photovoltaic systems in this
perspective and the drawbacks of connecting DGs on the existing protection systems.
Chapter 2: Literature Review
This section reviews the existing literature on distribution systems overcurrent protection
schemes followed by a discussion the several types and nature of dispersed generation
technologies with distinct reference to inverter tied PV systems. The impacts of grid-tied PV
systems on distribution networks are discussed, focusing mainly on feeder protection
problems due to interconnection of DG systems. It also highlights in theory some of the
mitigation methods to the negative impacts. A comprehensive understanding of the research
problem has been presented and the published research work results discussed in detail.
Chapter 3: Methodology
The chapter outlines a systematic approach deployed in this research to achieve objectives
discussed in the introduction. It gives briefly an overview to overcurrent protection
techniques and describes the type of simulator used, its main features and advantages
pertaining to the research work.

5
Chapter 4: Modelling and real-time simulation
In this chapter, the distribution network and overcurrent protection scheme for the radial
feeder is modelling and implemented. The chapter contains designed models in the graphical
user interface (RSCAD) environment; it also consists of several outcomes from investigations
taken up as a section of the research. It presents model calculations and tables for some of the
relevant algorithms employed in the study. The distribution network is analysed and
protection system coordination implemented, with which results obtained serve as a basis that
results after modifications and interconnection of DGs are compared to.
Chapter 5: Experimentation and verification
All results obtained from the software simulations are verified by substituting the software
relays on the network with the hardware relays through a hardware-in-loop connection. Since
probable problems generated by DG’s addition to distribution networks include protective
device discrimination and possible formation of islanded systems, the test radial distribution
feeder topology is then modified by introducing PV generation at nodes on the network and a
detailed analysis of the simulation results done to understand the PV generation impact on
protection coordination. A solution to overcome the issues is implemented and simulation
results with different DG interconnection points and configurations are presented.
Chapter 6: Conclusion
This chapter recapitulates the research work outcomes and key results as well as some
recommendations for future work. A detailed discussion of the research work results and a
comprehensive understanding of the problems has been presented.
6
2. Literature Review
2.1. Introduction
The diminishing of fossil fuels and increasing environmental awareness is resulting in an
increasing distributed power generation worldwide [5]. On the other hand, the scarcity of
fossil fuels, their increasing costs, the limited investment on new large power plants and
transmission lines construction are the other reasons contributing to the deployment of small
power plants which can be connected to strategic points on distribution systems or close to
load centres [6]. The continuing increase in the penetration of distributed generation (DG)
and the adoption of active network-management solutions in distribution networks across the
world creates a network protection challenge due to the effects on fault levels, fault current
paths, etc. [7].
Distribution systems are generally designed to operate without any generation on the
distribution network or customer loads. Due to the accumulating number of DG connected to
distribution networks, there arise concerns regarding power quality, reliability, protection
devices and control of the utility system [8]. Since integration of distributed generation in
distribution networks imposes many challenges, distribution overcurrent protection has
become more important today than it was a decade ago [9]. The distribution system
protection has faced new challenges due to distributed generation, which may be successfully
accomplished through the combination of the existing protections, such as overcurrent
protection, with modern protections based on evolving technologies discussed in [10].
2.2. Review on faults
Electrical networks, machines and equipment are often subjected to various types of faults
while in operation. Current that flows through the distribution is the element with which
detection of faults can be done given the large increase in current flow during short circuits.
The fault inception also involves insulation and conducting path failures, which result in short
and open circuit of conductors. Faults could either be symmetrical or asymmetrical;
symmetrical faults being the ones with which all lines are affected simultaneously and with
asymmetrical, either one or two phases are affected [11]. With respect to overcurrent
protection on distribution systems, various types of currents such as overload current, short
circuit current and ground fault current are taken into consideration. Overload currents result
from a number of factors such as successive outages of power devices, insufficient available

7
component capacity and incorrect operation. With short circuit, the effects are not limited to
the region of exposure as they could influence the performance of remote equipment as well.
The effects of fault currents include mechanical stress, undesirable overheating, deterioration
of insulation, etc. [12]. Equipment that are frequently exposed to short circuit conditions are,
therefore, very likely to fail as a result of such stresses. In terms of reliability, the failure rate
of these equipment will increase with time. The majority of faults that occur on a power
system involve ground and occur between conductor and tower. Large grounded distribution
systems are subject to system faults near the stations that produce extremely high fault
currents. These high currents may inflict severe circuit breaker interrupting duties and stress
on system equipment. The reduction of ground current is rapid as the fault distance increases
from the source; therefore, the most severe faults are those within a few miles of the station
[13] .
2.3. Protection philosophy
Power distribution systems are subjected to constant disturbances caused by arbitrary load
changes, faults created by natural causes and at times due to equipment or operator failure
[14]. If a fault occurs in an element of the network, an automatic protective device is needed
to clear the fault in a fraction of seconds to keep the healthy section of the system in normal
operation and to isolate the faulty element as quickly as possible [15]. Faults that persist
longer on a system may cause damage to some vital sections due to fire that may result from
heavy short circuits and as a result, the system voltages may decrease causing loss of
synchronism of the system machinery and equipment.
The main objectives of distribution system protection are [11] [16]
To disconnect faulted lines, transformers, or other apparatus.
To limit service outages to the smallest possible segment of the system.
To minimize the duration of a fault on the distribution network.
To eliminate safety hazards as fast as possible.
To protect the consumers’ apparatus.
To protect the system from unnecessary service interruptions and disturbances.
Protective systems include relays, circuit breakers and transducers that function together to
isolate the faulty section from the healthy sections of system. Circuit breakers work to
8
disconnect the faulty section of the system when triggered to do so by the relay which
detects, locates a fault and sends a command to the disconnection circuit breaker [15]. The
relay constantly monitors electrical quantities of the system which differ during abnormal
conditions. Protective relays do not foresee or prevent the occurrence of a fault, they only
take action after a fault has occurred [17] .
2.3.1. Essential qualities of protection.
The protection arrangements for any network must take into account and adhere to the
following basic requirements:
a) Selectivity: also known as discrimination, refers to the ability to maintain continuity
of supply by disconnecting the minimum section of the network necessary to isolate
the fault and the remaining healthy sections left intact [15] [11] [18].
b) Reliability: refers to the ability of protection to operate correctly. It consists of two
elements being dependability and security, which are the certainty of a right operation
on the occurrence of faults and the ability to avoid incorrect operation during faults
respectively [11] [19]
c) Sensitivity: the protective relay should be sufficiently sensitive to the magnitude of
the current and to operate when the current just exceeds the pre-set detection
threshold known as the pick-up current [15].
d) Stability: the ability of the protective system to remain stable even when a large
current is flowing through its protective zone due to an external fault which does not
lie in its zone. The fault is cleared by the concerned circuit breaker [19].
e) Speed: a protective system should quickly isolate the faulty element as quick as
possible to maintain system stability and minimise damage to the equipment.
f) Economics: achieving maximum protection at the lowest cost as possible, which
usually should not be more than 5% of the total cost of the power system being
protected [18] [19].
2.4. Protective equipment
The ability of protective equipment to minimize damage when failures occur and reduce
service interruption is needed not only for economic reasons, but also for reliability of service
to the public in general. Distribution system overcurrent protection is generally accomplished
by use of protection transducers that include current transformers (CTs), voltage transformers
9
(VTs), circuit breakers and overcurrent relays [20] [21]. The protective equipment
collectively functions to detect and isolate only that particular part of the network responsible
for the fault.
a) Voltage transformers
According to Sleva [22], voltage transformers accurately reflect primary network voltage into
the secondary low-voltage winding and are connected in shunt with the distribution system
components. They are used to provide lower input signals to the protective relays and to
physically isolate the relays and other instruments from the high voltages of the network. The
VTs’ secondary windings standard voltage rating is 110 V line to line.
b) Current transformers
Current transformers step down high currents to low values that are suitable for the operation
of relays and other measuring instruments [23]. The standard current ratings of CTs used in
practice are 5 A or 1 A. They are designed to withstand fault currents as high as 50 times the
full load currents for a few seconds.
c) Circuit breakers
Circuit breakers (CBs) are fault-interrupting devices that enable or interrupt the flow of
current to power system components. They separate the faulty parts from the rest of the grid
safely and reliably to avoid endangering unaffected parts and equipment [24]. The circuit
breakers are not self-actuating; they do not have their own tripping intelligence hence they
are used in conjunction with relays and only function when a trip or close signal is received.
d) Relays
Protection relays form the most important part of the protection scheme, as a result, their
capability and functionality plays a significant role in how the protection scheme works [22].
They serve as decision-making elements triggered by current and voltage measurements
obtained from the voltage and current transformers. If the magnitudes of the incoming signal
are outside a pre-set threshold, the relays operate generally to either open or close electrical
contacts to initiate some further operations such as tripping of a circuit breaker [11] [15].
2.5. Protection scheme
It is usually difficult to define precisely the protection scheme that should be adopted for an
electricity distribution system, given the large number of valid alternatives for each situation.
However, any protection scheme should strike a balance between the technical and economic
aspects to avoid use of sophisticated protection devices for small machines or less important
10
system elements [11]. Protection schemes are designed to detect abnormal network
conditions, normally contingency-related, and initiate pre-planned, corrective measures to
mitigate the consequence of the abnormal condition and provide acceptable system
performance [25]. They include one or more relays of the same or different types. The
following are some of the most common protective schemes usually used in modern power
systems [15].
2.5.1. Transformer protection
When large transformers fail, there is a high possibility of consequential damage due to tank
rupture with an oil spill and fire that spreads to the surrounding area. To minimize the
damage, transformer sudden pressure and differential relays are employed to quickly detect
and isolate the faulty transformer [22]. Nowadays the transformer differential protection
resides in microprocessor-based relays, which execute signal processing, filtering, currents
compensation, and computation of differential and restraint currents. The relay providing
transformer differential protection is normally linked to the current transformers from both
transformer windings [26].
2.5.2. Differential protection
Differential protection is a method that functions when the vector difference of two or more
similar electrical magnitudes exceeds a predetermined value. The principle is founded on the
direct application of Kirchhoff's first law [27] [28]. An internal fault is identified by
comparing the electrical conditions at the terminals of the equipment to be protected in a
method. The main component of differential protection scheme is the differential relay that
operates when the phasor difference of similar electrical quantity exceeds a set value.
Differential protection is also referred to as unit protection since it is confined to protecting a
particular unit or equipment of a plant or substation [15].
2.5.3. Overcurrent Protection
Overcurrent protection is a method used for detecting excessive currents in a system and
cutting the delivery of further current into the system when overcurrent is detected [29]. Very
high current levels in electrical distribution systems are usually a result of faults on the
system. These high fault currents can be used to determine the presence of abnormalities on
the distribution network and operate protection devices, which can vary in design depending
on accuracy and complexity required [11]. Among the more common types of protection
11
devices are thermomagnetic switches, moulded case circuit breakers, fuses and overcurrent
relays. Overcurrent relays are the most common form of protection devices used to deal with
excessive currents on electricity distribution networks [11].
2.5.3.1. Time overcurrent protection
To guard against the possible failure of main protection devices in a distribution system, time
overcurrent protection relays usually function as backup protection to prevent the system
from experiencing catastrophic consequences [30].The relays and their variants represent the
largest installed base of protective equipment on any distribution systems and may be
considered as the backbone of any protection strategy. The microprocessor-based relays
possess algorithms for monitoring the system through current and voltage inputs from CTs
and VTs respectively [31] [32].
Overcurrent protection methods directly use the magnitude of the current as indicator that a
fault has occurred and trip if the measured current overcomes a certain threshold [33]. The
relays operate within a time, inversely proportional to the fault current. The fault current
magnitude near the source is higher and hence the shortest tripping time [8]. Due to the
impedance between the two points, the fault current magnitude at the far end of the line is
relatively less and results in longer tripping time. This brings the flexibility on operation of
local protection devices to clear first. According to IEEE Std. C37.112-1996, inverse time
overcurrent protection generally uses the following standard characteristic equation:
𝑡𝑜𝑝 =0.14
𝑃𝑆𝑀 0.02−1× 𝑇𝑀𝑆 (1)
where; 𝑃𝑆𝑀 =𝐼𝑟𝑒𝑙𝑎𝑦−𝑐𝑜𝑖𝑙
𝐼𝑝𝑖𝑐𝑘−𝑢𝑝, 𝑡𝑜𝑝 = time of operation, 𝑇𝑀𝑆 = time multiplier setting and
𝐼𝑝𝑖𝑐𝑘−𝑢𝑝 = pick up current .
The standard inverse time characteristic equation is usually used for line protection, very
inverse time characteristic equation used when the short-circuit current of close-up fault is
much greater than far end fault and the extremely inverse time characteristic equation suitable
for over-thermal protection caused by heavy load currents [34]. With inverse definite time
overcurrent IDMT relays, the pick-up current is taken as 1.2 to 2 times the full load current,
in steps of 0.05. The time dial setting (TMS) defines the operation time of the device for each
current value [32].

12
2.6. Protection coordination
With protective relays, the aim is to achieve coordination between the downstream and
upstream relays and circuit breakers [32] [21] [35]. The goal is to allow enough time for the
relay and breaker closest to the fault to clear the fault from the system before the backup
relay associated with the adjacent section to the source could initiate the opening of its circuit
breaker. The time interval allowed between two adjacent relays’ operation in order to achieve
correct discrimination between them is called the grading margin. Taking into consideration
factors such as circuit breaker operating time, relay overshoot time, contact gap together with
relay and CTs errors, the MiCOM relay user manual shows that a time grading margin of
400 𝑚𝑠 is used.
An undesirable occurrence known as over-trip often happens, a situation whereby a feeder
relay and supply-side relay both trip for the same feeder fault and is usually blamed on poor
relay coordination. The relay and breaker nearest to the point of fault must be able to see the
fault and operate before other relays in the system, so that healthy parts of the system will not
be interrupted [35]. One of the important coordination problems on distribution feeders is the
proper selection of protective devices for correct sequential operation. Protection of
distribution lines can be provided in many different ways. A survey of industry practices in
the protection of distribution circuits showed that a large percentage of utilities employ phase
and ground overcurrent protection for instantaneous tripping of temporary faults with time
delayed tripping for permanent faults [36].
2.7. Distributed generation
According to Borbely and Kreider [37], distributed generation is not entirely a new concept
because originally, all energy was produced and consumed at or near the process that
required it. In relation to them, a fireplace, wood stove, candle, alarm clock and car battery
are all forms of small scale, demand-sited “distributed” energy. Distributed generation is
therefore a new concept in the economics literature about electricity markets, but the idea
behind it is not new at all [38]. A number of terms have emerged to define power that comes
from sources other than from large, centrally dispatched generating units connected to a high-
voltage transmission system or network [39]. The term distributed generation can be used
interchangeably or considered synonymous with embedded generation and dispersed
generation, which are now barely used.
13
Motivated by environmental concerns, the necessity to diversify energy sources, energy
autonomy and efficiency, the penetration of distributed generation from renewable resources
like solar and wind is rapidly growing as the trend moves away from large centralized power
stations towards more meshed power distribution on the electricity grid [40]. Distributed
generation is commonly thought of as small-scale generation that is used onsite and/or
connected to a distribution network [39]. The type of technologies employed have historically
varied, but were generally limited to small engines or combustion turbines fuelled by diesel,
gasoline, or natural gas and also costly to run relative to grid supplied power [39]. More
recently, intermittent renewable resources such as solar, small hydro, and wind energy are
thought of as distributed generation being deployed to reduce overall emissions [41].
2.7.1. Distributed Generation Technology
This section considers the technology deployed in the generation of electrical power from the
sun (solar energy) as a typical example of distributed generation technology. The choice of
this source without any prejudice to other sources such as wind, micro-turbines, fuel cells,
geothermal and internal combustion engines is because of its relevance to the study.
With reference to [42], solar energy could be used to describe any phenomenon that is created
by solar sources and harnessed in the form of energy, directly or indirectly – from
photosynthesis to photovoltaics. According to Langston and Ding [43], the direct conversion
of sunlight into an electrical energy is achieved by a process called photovoltaic (photo =
light, voltaic = electrical potential) effect. Although solar energy is the most abundant energy
resource, only an infinitesimal fraction of the available solar energy is used [44]. Luo and Ye
[44], state that the amount of solar energy reaching the earth surface is so vast that in one
year it is about double as much as will ever be obtained from all of the planet’s non-
renewable resources of coal, oil, natural gas, and mined uranium combined. Therefore, solar
energy consequently appears to be an easy alternative next to conventional sources, like
electricity, coal and other fossil fuels.
2.7.2. Grid-tied Photovoltaic System
Photovoltaic (PV) energy has grown at an average annual rate of 60% in the last five years,
exceeding one third of the cumulative wind energy installed capacity, and is becoming a
significant part of the energy mix in some regions and power systems [45]. Several studies
[45] [46] [47] [48], show that it is driven by a reduction in the cost of PV modules,
environment friendliness, containing no rotating elements and it being an inexhaustible
14
source. Recently, energy generated from clean, efficient and environmentally friendly sources
has become one of the major challenges for engineers and scientists and therefore
photovoltaic (PV) application has been a subject of interest in research since it appears to be
one of the most efficient and effective solutions to this environmental problem [47].
Compared to stand-alone systems, grid-connected PV systems account for more than 99% of
the PV installed capacity. In grid-connected PV systems, the power generated by the PV plant
is uploaded to the grid for direct transmission, distribution, and consumption [49].
PV arrays are built up of combined series or parallel combinations of PV solar cells [48]. The
PV cells generate a direct current (DC) that is significantly dependant on the solar irradiance,
temperature, and voltage at the PV system terminals. This DC power is transformed and
interfaced to the grid via a PV inverter [45]. At a certain environmental condition, one
unique operating point exists to provide the PV generation system with maximum output
power. PV modules exhibit non-linear voltage-current characteristics, and the maximum
power point varies with the irradiation and temperature [47].
2.8. Impact of DG integration to the existing grid and protection scheme
Conventional distribution networks are generally arranged in radial topology and the
protection strategies in use assume single source in-feed and radial flow of current [6] [50].
Conti [51] shows that the introduction of DGs affects several operational aspects of AC
power systems including their protection philosophy. If the PV penetration is high, PV
systems can subject the grid to several negative impacts. The following paragraphs discuss
some of the main issues associated with the protection of AC distribution system embedding
DGs.
a) Varying fault level contribution
Penetration of DGs can influence the performance of a current-based protection scheme by
changing the fault current seen by the protective device [6] [52]. Nuisance tripping can result
if the current measured exceeds the relay’s pick-up setting. The current that flows into a fault
can come from three sources on a distribution network: namely, in-feeds from the
transmission system, in-feeds from distributed generation or in-feeds from loads with
induction motors. DG connection causes fault levels close to point of connection to increase,
which is caused by an additional fault level from the generator and can cause the overall fault
level to exceed the designed fault level of the distribution equipment.
15
The risks when fault levels are exceeded will cause damage and failure of the plant, with
consequent risk of injury to personnel and interruption to supplies. Different distributed
generation technologies come with varying fault level current contribution and provision
needs to be made for adequate system protection under all system configurations. The
situation may lead to protection discrimination problems and impose requirements for
switchgear and potentially other plant capacity upgrade and/or reinforcement.
b) Loss of mains
One of the most important network safety requirements when local generation is present at
the distribution level is the loss of mains (LOM) protection, which has been recognised as
one of the most challenging aspects relating to distributed generation [53]. Loss of mains (or
islanding) occurs when part of the public utility network or a portion of the distribution
system becomes electrically isolated from the remainder power system, yet continues to be
energized by DG connected to the isolated subsystem.
Due to opposite current flow from DG, the reach of a relay is shortened, leaving high
impedance faults undetected. If LOM is not detected, then the generator could remain
connected, causing a safety hazard within the network. When a utility breaker is opened, a
portion of the utility system remains energised while isolated from the remainder of the utility
system, resulting in injuries to the public and utility personnel [35] [36]. In history, up until
not long ago, loss of mains protection was put to use mainly to protect from the viewpoint of
ensuring personnel and public safety since there was little DG in the system.
c) Protection coordination disruption
Since the initiation of electrical systems, coordination tasks were performed to ensure that
protection systems would operate with the necessary reliability and security. DG connection
to a distribution feeder can also change power flow and fault current direction, consequently
disrupting the coordination amongst the protection devices as they are mostly non-directional
units. Protection coordination is employed for cases such as security against failure or
incorrect relay/device operation. Due to one source of power, the relays can be non-
directional since the current flows in one direction, but the injection of distributed generation
poses a threat to the coordination system because the generators also contribute to the total
fault current [54].

16
At the end of a distribution feeder protected by a standard time graded overcurrent protection
scheme, a problem of discrimination appears when additional generation is connected at the
far end of the feeder and thereby results in downstream protection seeing fault current. Also,
the connection of distributed generators to the distribution lines raises challenges for the
effective settings for the feeder protection since the protective system should as well be
designed with due regard for its own unreliability. That is installation of backup protective
systems to operate in case of primary equipment failure [22].
2.9. Mitigation methods to DG penetration issues.
As the penetration of DG increases, grid flexibility requirements also increase. The previous
sections have presented the status of and major obstacles to the establishment of DG within
utility systems. The following are some potential solutions that have been discussed and
recommendations directed towards injection of DG.
a) Modifying the existing system
When fault level exceeds the current design limits because of distributed generation
installation, upgrading the capability of existing equipment such as circuit breakers is an
option to enhance the fault level capabilities of the distribution system [55]. This method is
widely used throughout the world as a solution to the issue of increased fault levels. To avoid
control interactions among several DG units and their controllers, in large distribution
networks, some precautions such as keeping a minimum distance among DG plants and
coordinating controllers should be taken [56].
b) Utilizing Fault Current Limiters (UFLs)
In [55], it is discussed that UFLs are devices that limit the fault current by increasing the
system impedance. During faults, the resistances increase very quickly and sharply for high
fault currents consequently reducing the current to low and acceptable limits.
c) Limiting the Inverter Current
Under the fault conditions, blocking the DG inverter is an extensively used strategy in order
to protect the inverter from the high fault currents and reconnect them when normal operation
has been restored [55].
17
d) Adaptive Overcurrent Protection
One method that can be utilized is the directional overcurrent relay with dynamic settings.
This method needs fast and effective monitoring of system conditions. It will automatically
update relay settings based on prevailing system conditions [57].
e) Distance and Directional Comparison Protection
Even with obvious advantages of better and simpler downstream coordination, fixed reach
zone and relative immunity to the source impedance behind the protection relay, distance
protection was not considered at the radial feeders [57]. However, nowadays many utilities
are applying this protection at the distribution level due to distributed generation. Owing to
distributed generation penetration, the fault current becomes bi-directional, which brings
directionality issues to the protection scheme. Since distance protection is inherently
directional, it solves this problem and secondly, distance is not affected by the changing fault
current level due to changing source impedance compared with overcurrent protection.
18
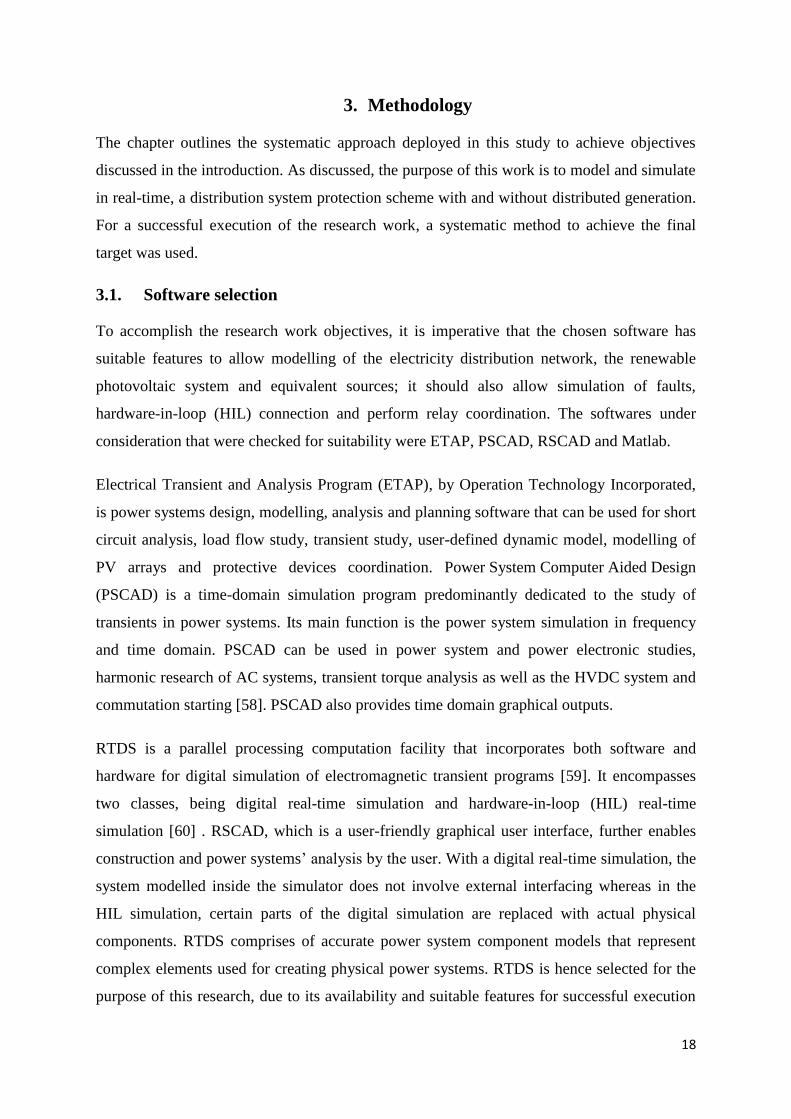
3. Methodology
The chapter outlines the systematic approach deployed in this study to achieve objectives
discussed in the introduction. As discussed, the purpose of this work is to model and simulate
in real-time, a distribution system protection scheme with and without distributed generation.
For a successful execution of the research work, a systematic method to achieve the final
target was used.
3.1. Software selection
To accomplish the research work objectives, it is imperative that the chosen software has
suitable features to allow modelling of the electricity distribution network, the renewable
photovoltaic system and equivalent sources; it should also allow simulation of faults,
hardware-in-loop (HIL) connection and perform relay coordination. The softwares under
consideration that were checked for suitability were ETAP, PSCAD, RSCAD and Matlab.
Electrical Transient and Analysis Program (ETAP), by Operation Technology Incorporated,
is power systems design, modelling, analysis and planning software that can be used for short
circuit analysis, load flow study, transient study, user-defined dynamic model, modelling of
PV arrays and protective devices coordination. Power System Computer Aided Design
(PSCAD) is a time-domain simulation program predominantly dedicated to the study of
transients in power systems. Its main function is the power system simulation in frequency
and time domain. PSCAD can be used in power system and power electronic studies,
harmonic research of AC systems, transient torque analysis as well as the HVDC system and
commutation starting [58]. PSCAD also provides time domain graphical outputs.
RTDS is a parallel processing computation facility that incorporates both software and
hardware for digital simulation of electromagnetic transient programs [59]. It encompasses
two classes, being digital real-time simulation and hardware-in-loop (HIL) real-time
simulation [60] . RSCAD, which is a user-friendly graphical user interface, further enables
construction and power systems’ analysis by the user. With a digital real-time simulation, the
system modelled inside the simulator does not involve external interfacing whereas in the
HIL simulation, certain parts of the digital simulation are replaced with actual physical
components. RTDS comprises of accurate power system component models that represent
complex elements used for creating physical power systems. RTDS is hence selected for the
purpose of this research, due to its availability and suitable features for successful execution

19
of this work. Graphical results exported from the runtime module are plotted and displayed
on Matlab. Following is a procedural and deeper insight into how the research was carried
out.
3.2. Modelling of the distribution network in RSCAD
3.2.1. Draft programme
The electrical design of the distribution feeders is done by computing the various parameters
of the network such as resistance, inductance and capacitance. Resistance plays an important
role in determining losses since increasing the line current also increases the 𝐼2𝑅 losses. The
system model is then set up and parameters inserted in RSCAD/Draft, which enables the user
to create a system in a user-friendly graphic interface [61]. It comprises of a three-phase AC
supply input voltage with a 132 𝑘𝑉 R.M.S. voltage at 60 𝐻𝑧, which is further stepped down
to 66 𝑘𝑉 substation with each feeder further branching into several subsidiary 22 𝑘𝑉 and
11 𝑘𝑉 laterals that carry power close to the load points. In RSCAD library, all load model
types are available and the constant active and reactive power dynamic load models are used
as indicated in chapter 4.
All CT ratios corresponding to full load conditions are determined and set, voltages and
currents at the transformers' primary and secondary windings of the transformers, the systems
MVA ratings, base frequencies and source parameters are then checked and verified. The
model is compiled, generating the executable code required by the RTDS to run the
simulation. In case of any errors in the modelling stage, the compile process cannot be
completed due to the possibility of unreasonable data for the network model and control
elements, inconsistency as well as duplication of parameter and signal labels.
3.2.2. Runtime programme
After a successful compilation, the runtime module is then opened where available racks
show with red indicators on the right side of the GUI environment. On runtime, different
actions such as controls can be applied and their response observed and analysed by the aid of
graphs and meters. A direct communication is enabled between the RTDS simulator and a PC
with the modelled network. Firstly, the monitored variables and controlled elements are
selected, which are then used for setting different events in the power-system model such as
fault applications and switching. The compiled model is next loaded onto the simulator and

20
real-time simulation run. The system’s power, voltage and current outputs are monitored and
checked to see whether they produce desired results.
3.3. Protection set-up
Current transformers’ appropriate choice and sizing is the first important phase in overcurrent
protection settings [21] [62]. The selection of CT ratios is based on the system’s full load
current. Zones to be protected are then identified on the distribution system and for each zone
overcurrent relays configured. The relays’ pick-up currents are computed based on a chosen
plug setting value and set. The characteristic curve selected for all relays was the IEC
standard inverse curve.
Time dial setting (TDS) selection provides the necessary protection devices coordination [21]
[63], and is dependent on factors such as the maximum fault current, selected IDMT curve
type and the downstream circuit breakers’ operating time. For the most downstream breaker,
the TDS is set to a minimum value, simulations are then ran and coordination studies for all
relays carried out systematically from downstream breakers up to the breaker closest to the
source.
3.4. Protection relay testing
A hardware-in-loop connection was set up and verification of all software simulations results
was accomplished by substituting the networks’ software relays with the physical commercial
relays. Current and voltage signals were exported from the RTDS using OMICRON CMC
156 amplifier and Gigabit-transceiver Front Panel Interface (GTFPI). Combination of the
amplifier and the RTDS produces the actual conditions in which the relay will function
during a fault.
3.5. PV generation system design
In order to simulate the behaviour of a solar panel, a fully functional photovoltaic array
consisting of 150 modules in series and 300 modules in parallel was built and developed in
RSCAD. For varying temperature and irradiation inputs, verification of all desired outputs
from the PV model was carried out to understand the impact of the change in weather
conditions. The PV array's operating point is maintained at the maximum power and output
by using a fractional open circuit voltage based maximum power point trackers (MPPT). The
tracker uses the fact that the PV array voltage corresponding to the maximum power displays
21
a linear dependence relating to array open circuit voltage for varying temperature and
irradiance.
3.6. Grid-tied inverter model development
For a grid-tied photovoltaic generation system, three-phase inverters are used to convert the
DC output into a three-phase AC power [64]. A photovoltaic inverter was configured and
coupled with the distribution network. The essential interface to bridge the large and small
time-step simulation portions is created by transferring voltage and current information
between them. Voltage information from the large time-step side of the simulation is
transferred to the small time-step side and current information from the small time-step side
is brought to the large time step side. Using this interface technique allowed the necessary
power electronics application device to be accurately modelled and simulated with the PV
array model. The main network is then connected to the small time-step sub-network through
three single-phase interface transformers.
3.7. Stand-alone grid tied PV system
The inverter was connected to transformers’ low voltage side and the high voltage to the grid
represented by a constant 11 𝑘𝑉 voltage source. The PV generation system was then
connected to the utility network using the 11 𝑘𝑉 busbar as the point of common coupling.
Steady state results and performance outputs of the whole distribution network and PV
inverter system were then monitored and verified. The PV system fault current contribution
impacts on the capacity of protection components in the distribution network was
investigated and using dual simplex method, relay coordination was achieved. A study was
done on the modelled system to support the theoretical expectations regarding possible
outcomes. The point of common coupling was changed to the 66 𝑘𝑉 busbar to determine PV
penetration impacts on different sections of the network.
3.8. Optimal relay coordination
Tap settings such as the current and time dial setting must be determined for relay
coordination. Full load and minimum fault currents assist in determining all relays’ current
settings [3] [65]. For the time multiplier determination of all the overcurrent relays protecting
the distribution system, the sum of all relays’ operating times are optimized using an
optimization technique [65]. Techniques under consideration were generic algorithm, partial

22
differentiation approach, particle swarm optimization and dual simplex method, of which the
dual simplex method was selected.
The regular simplex method was modified and developed by Lemke into dual simplex
method to solve linear programming problems (LPP). The technique results in the solution to
becoming feasible and optimal at some stage through an iterative computation [65].
Assuming that the OC relay’s TMS and plug setting are specified, its time of operation can be
calculated for a known fault current using the following mathematical equation (5) above.
Below is the algorithm of the dual simplex method used to solve the maximization problem
[65] [66].
a) Start.
b) Convert the problem into maximization problem.
c) Convert all the constraints into ≤ type.
d) Rewrite the functions into standard form by adding surplus variable, which are basic
variables.
e) Form the Dual Simplex table.
f) Find 𝐶𝑗 − ∑(𝐶𝑗 ∗ 𝑎𝑖𝑗)
If any 𝐶𝑗 − ∑(𝐶𝑗 ∗ 𝑎𝑖𝑗) element becomes non-negative, go to step (j).
If all the elements in this row become non-positive and if all the elements in
the RHS column are non-negative, go to step (i).
If at least one element in RHS is negative, go to step (g).
g) Form a dual simplex table after identifying the key column, key row and pivot
element.
h) Go to step (f).
i) Print results
j) Stop.
3.9. PV impacts mitigation methods
When high PV penetration levels, the grid is subjected to several negative impacts hence the
grid flexibility requirements need to increase. The status of and major obstacles to the
establishment of DG within utility systems was then presented and potential solutions
discussed. Implementations have been made to address the issue of reviewing present
protection settings for a reliable protection coordination establishment. Protection method
23
against islanding was implemented to provide basic detection of faults that will separate the
DG from the utility during an islanded mode [67] [68].
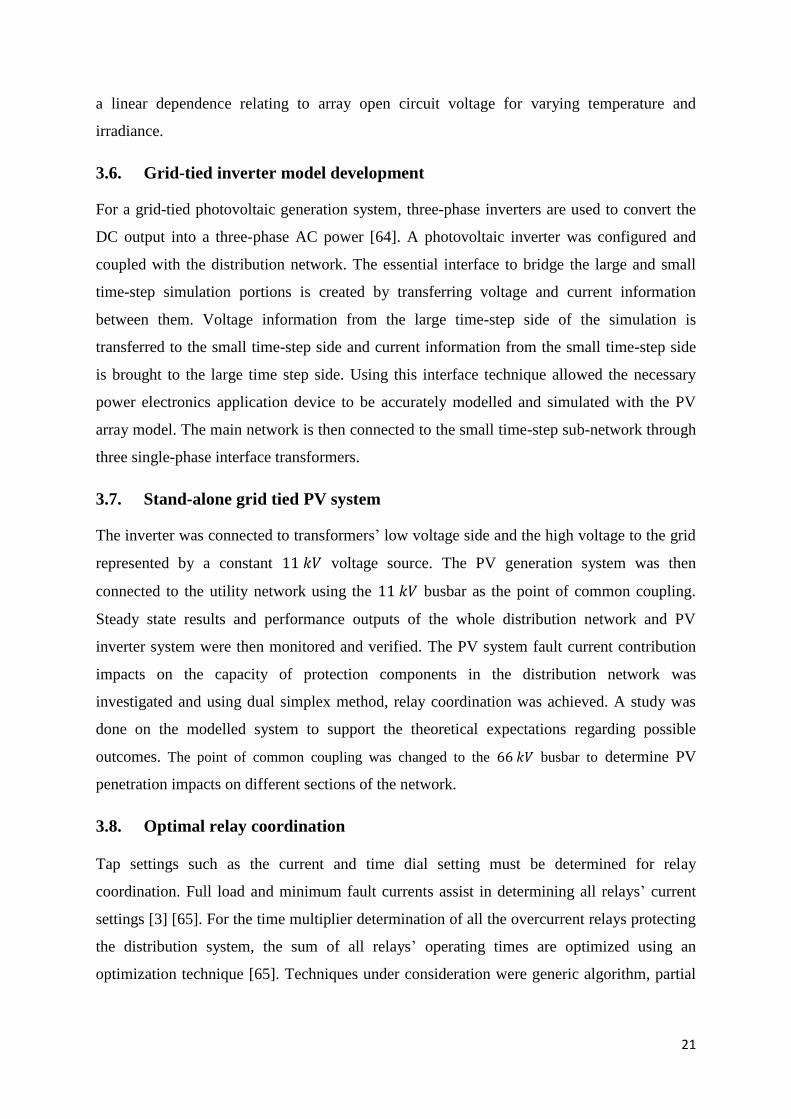
3.10. Recommendation for future works
Fields of future investigation were identified and described at the end of the research work.
As mentioned in the literature, distributed generation will be a trend in the near future hence
there will be a high volume distributed generations in the distribution systems. The
implemented anti-islanding technique is not an optimal choice for high-density PV systems
and will have some limitations in future; therefore, the work was carried out to enable the use
of its outcomes for further build up and refining for future research.
24
4. Modelling and real-time simulation
4.1. Test distribution system configuration
Real-time protective relaying is an effective and widely used technique that has been used for
decades by power distribution utilities for protection [31]. The real-time simulator employed
in this work is the RTDS simulator by RTDS technologies. The RSCAD is a graphical user
interface with wide model libraries permitting an extensive range of electrical system
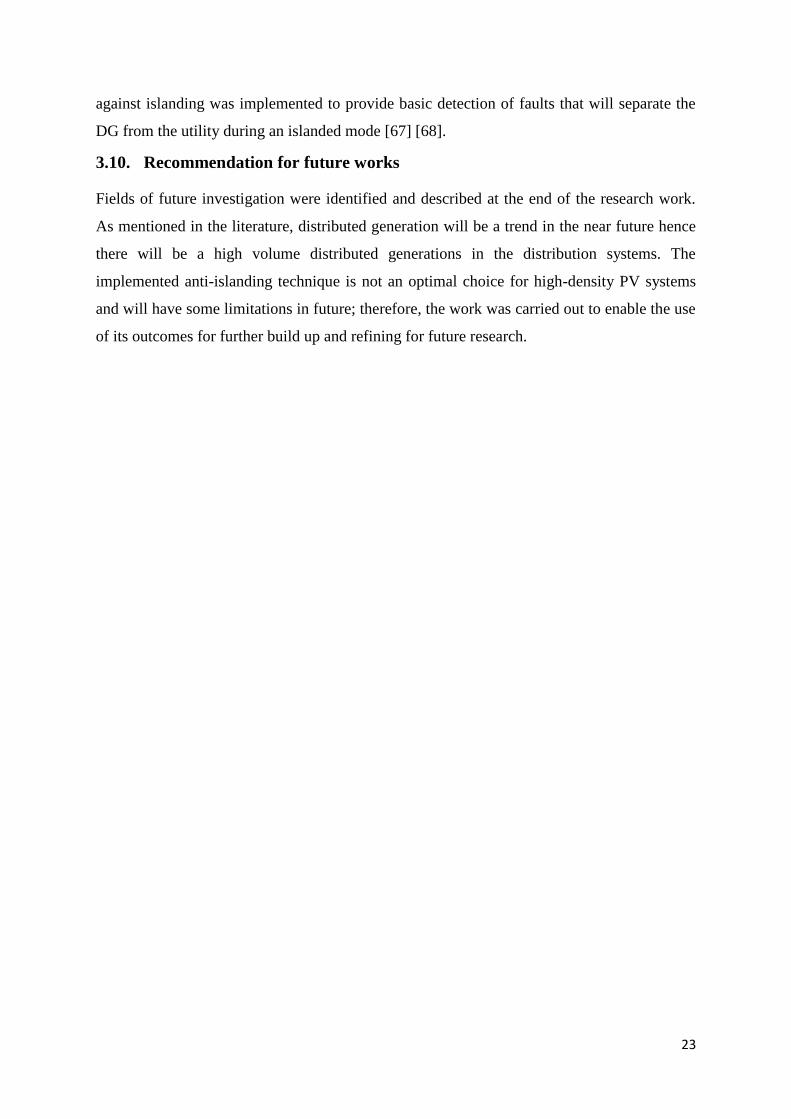
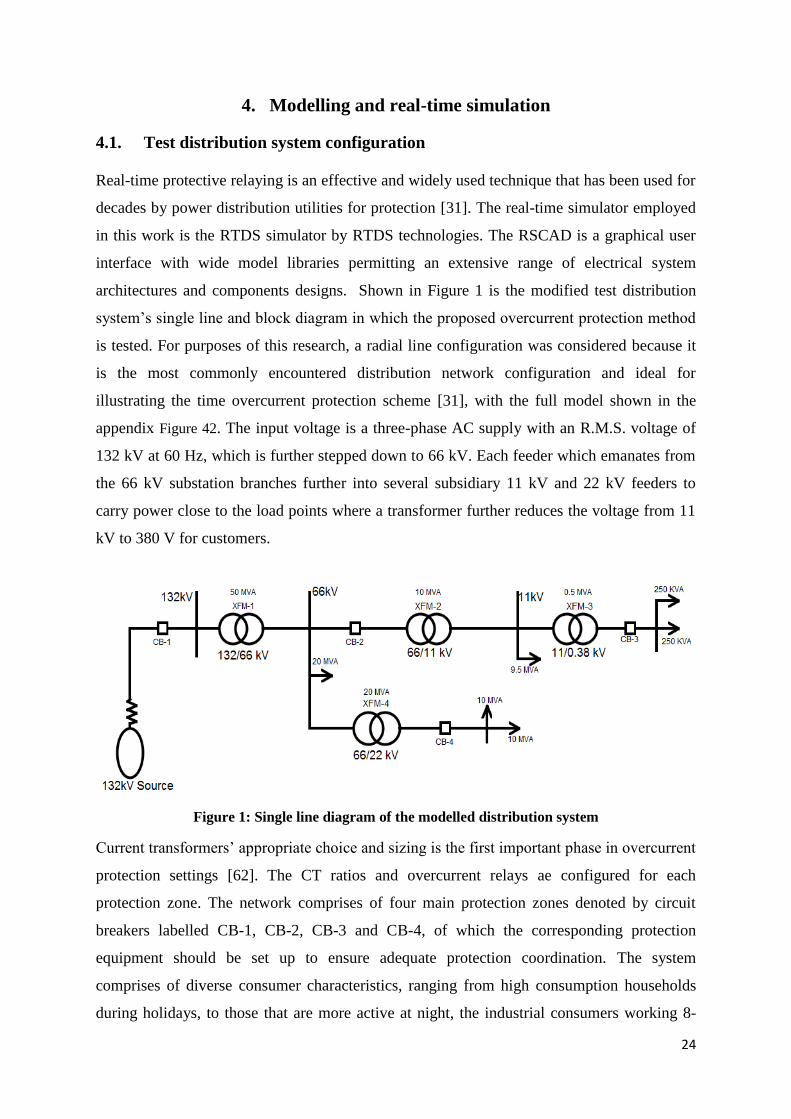
architectures and components designs. Shown in Figure 1 is the modified test distribution
system’s single line and block diagram in which the proposed overcurrent protection method
is tested. For purposes of this research, a radial line configuration was considered because it
is the most commonly encountered distribution network configuration and ideal for
illustrating the time overcurrent protection scheme [31], with the full model shown in the
appendix Figure 42. The input voltage is a three-phase AC supply with an R.M.S. voltage of
132 kV at 60 Hz, which is further stepped down to 66 kV. Each feeder which emanates from
the 66 kV substation branches further into several subsidiary 11 kV and 22 kV feeders to
carry power close to the load points where a transformer further reduces the voltage from 11
kV to 380 V for customers.
Figure 1: Single line diagram of the modelled distribution system
Current transformers’ appropriate choice and sizing is the first important phase in overcurrent
protection settings [62]. The CT ratios and overcurrent relays ae configured for each
protection zone. The network comprises of four main protection zones denoted by circuit
breakers labelled CB-1, CB-2, CB-3 and CB-4, of which the corresponding protection
equipment should be set up to ensure adequate protection coordination. The system
comprises of diverse consumer characteristics, ranging from high consumption households
during holidays, to those that are more active at night, the industrial consumers working 8-
25
hour shift and those who constantly work. Because of the diversity of consumers, the
distribution system is loaded diversely on a daily, monthly and annual basis. Table 1 presents
the loads and the system parameters.
Table 1: Transformers, load and source parameters
Transformer Ratio MVA Load Data
XFM-1 132/66 kV 50 Load P (MW) Q (MVAR) S (MVA)
XFM-2 66/11 kV 10 1 18.5 7.5 20
XFM-3 11/0.38 kV 0.5 2 9 4 10
XFM-4 66/22 kV 20 3 0.23 0.09 0.25
Voltage Source Parameters 4 0.23 0.09 0.25
MVA 120 5 9 4 10
Frequency 50 Hz 6 9 4 10
Voltage 132 kV
In the radial distribution system shown, there is only one path, which connects end-users with
the source. This path is one-way, hence there is a unidirectional flow of current from the
source, which means only the source provides electric power to end-users. If there is a power
outage, the end-users lose electric power completely. Protective relays identify unwanted
conditions within the network, and then trip the circuit breakers to isolate the faulted area
before any damage or interference with the operation of the distribution network as a whole
[69].
4.2. System full load conditions
The section concisely presents findings and results obtained from simulations of the modelled
distribution system. To begin with, all model equipment parameters are set and the system is
run on RSCAD. Shown in Table 2 are bus voltages, line voltages and currents as seen from
the power and current transformers for input to the overcurrent relays.
Table 2: Voltages and Currents measured on the distribution system.
Parameter
Voltage
Value VT secondary
Voltage
Parameter
Current
Value CT Secondary
Current
Bus-1 132 kV 109.8 V IB-1 0.185 kA 1.088 A
Bus-2 10.98 kV 109.7 V IB-2 0.091 kA 0.8741 A
Bus-3 0.379 kV 109.3 V IB-3 0.752 kA 0.752 A
Bus-4 21.89 kV 108.9 V IB-4 0.304 kA 1.042 A
Bus-5 65.96 kV

26
In the no fault scenario, normal RMS currents flow through the CTs and there is no
disturbance in the currents. The current pick-up value for a breaker to generate a trip signal
should be at least 1.2 times of the normal full load RMS current [70]. The current setting is
selected to be above the maximum short time rated current of the circuit involved and since
all relays have hysteresis in their current settings, the setting must be sufficiently high to
allow the relay to reset when the rated current of the circuit is being carried.
Figure 2: System R.M.S Currents
Figure 3: Distribution system RMS voltages
Shown in Figure 2 and Figure 3 are full load current and bus voltages of the distribution
system modelled at no fault. Figure 2 shows the system RMS currents as seen from the CTs
secondary windings. It can be seen that at no fault operating conditions, there is a constant
current flowing from the source to the dynamic loads in the different radial system laterals.
The voltage levels read are as initially set for the system design in section 4.1, with a small
deviation due to the system impedance and loads’ reactive power.

27
4.2.1. Fault and breaker logic control
To verify the fault levels in the system to different branches of the network, faults are applied
on the distribution feeders. For convenience, ability to control the fault type, fault location
and closing of the circuit breakers during runtime is necessary. Shown in Figure 4 is the fault
logic which enables fault application and changing in the runtime interface. The logic is
advantageous in provision of a more efficient way of testing as opposed to switching between
the draft and runtime interface to implement changes to the faults on the system. It allows
activation of fault using a push button, selection of and alteration between the different
combinations of line to ground faults via a dial switch as presented in Table 7 that shows the
binary and dialing outputs along with the corresponding fault type.
Figure 4: Fault and circuit breaker logic
For the design, all the three phases in the distribution lines of the system have to be protected
even if a fault occurs on either single line, double lines or all the three phases. A single logic
input is used to open and close the circuit breaker model in the simulator. The circuit breaker
model is designed to respond to separate open and close commands by means of an SR flip-
flop component. In the system, once the relay issues a trip command to the breaker logic
shown in Figure 4, the circuit breaker receives the signal to open; which can be closed by
means of a ‘close’ push button in runtime.
4.2.2. Relay logic control
The time overcurrent relay forms the vital fragment of the protection scheme, hence its
functionality takes up a significant role in operating as a decision making component in the
protection scheme. For operation, the relay is activated by the voltage and current
transformers’ voltage and currents measurements respectively. If an abnormal condition
exists, the relay then decides if it is large enough to endanger the system followed by an
appropriate preventative action to protect the system. Shown in Figure 5 is the multi-
functional overcurrent relay that is suitable for providing the protection function on
distribution system lines with the (51/67P) overcurrent element (PTOC) enabled. The
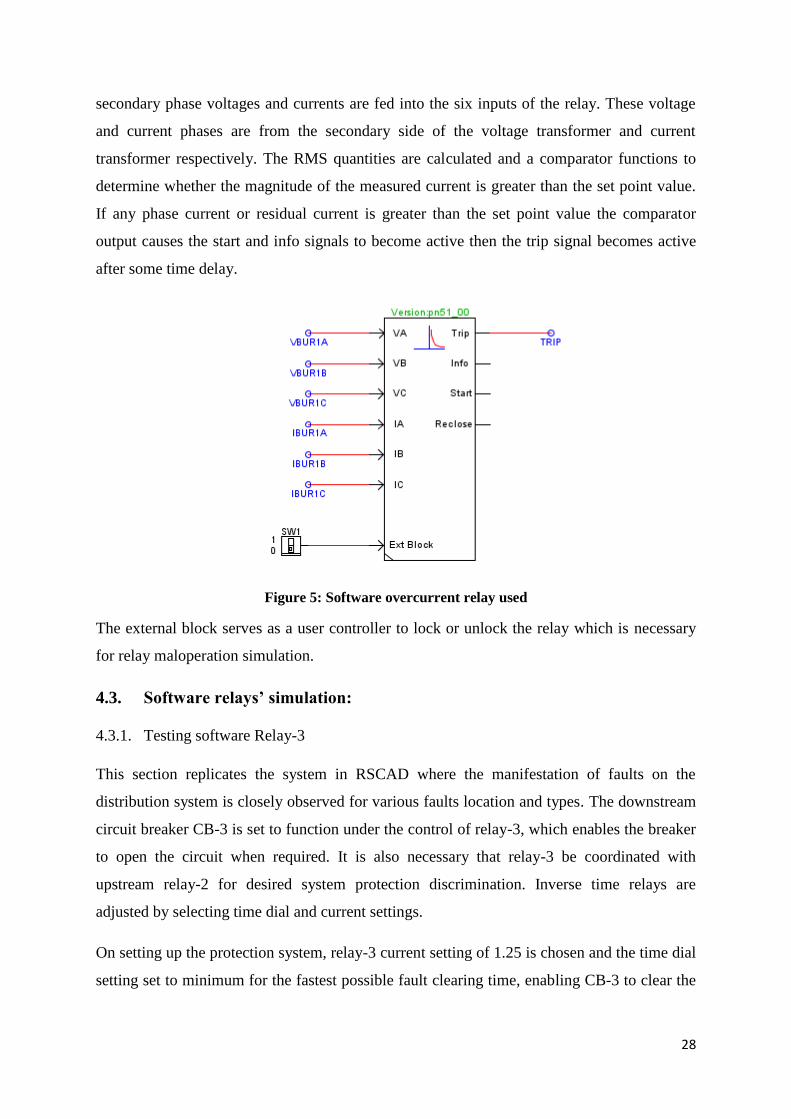
28
secondary phase voltages and currents are fed into the six inputs of the relay. These voltage
and current phases are from the secondary side of the voltage transformer and current
transformer respectively. The RMS quantities are calculated and a comparator functions to
determine whether the magnitude of the measured current is greater than the set point value.
If any phase current or residual current is greater than the set point value the comparator
output causes the start and info signals to become active then the trip signal becomes active
after some time delay.
Figure 5: Software overcurrent relay used
The external block serves as a user controller to lock or unlock the relay which is necessary
for relay maloperation simulation.
4.3. Software relays’ simulation:
4.3.1. Testing software Relay-3
References
This section replicates the system in RSCAD where the manifestation of faults on the
distribution system is closely observed for various faults location and types. The downstream
circuit breaker CB-3 is set to function under the control of relay-3, which enables the breaker
to open the circuit when required. It is also necessary that relay-3 be coordinated with
upstream relay-2 for desired system protection discrimination. Inverse time relays are
adjusted by selecting time dial and current settings.
On setting up the protection system, relay-3 current setting of 1.25 is chosen and the time dial
setting set to minimum for the fastest possible fault clearing time, enabling CB-3 to clear the
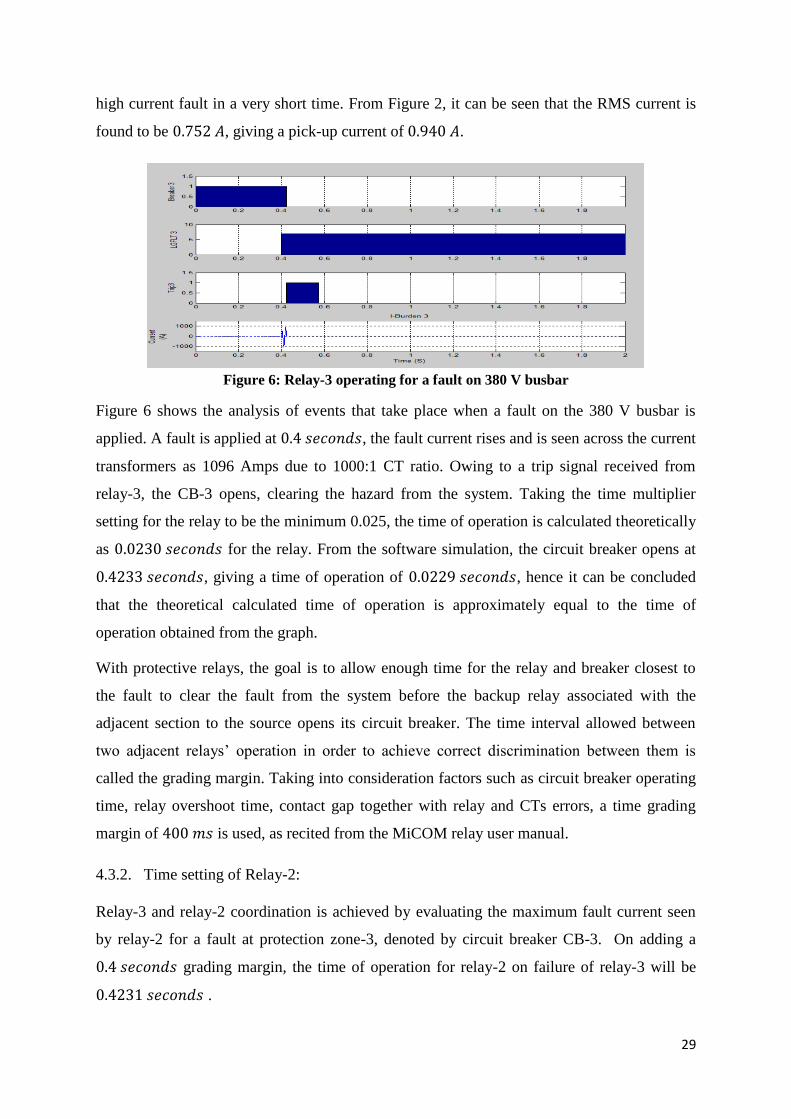
29
high current fault in a very short time. From Figure 2, it can be seen that the RMS current is
found to be 0.752 𝐴, giving a pick-up current of 0.940 𝐴.
Figure 6: Relay-3 operating for a fault on 380 V busbar
Figure 6 shows the analysis of events that take place when a fault on the 380 V busbar is
applied. A fault is applied at 0.4 𝑠𝑒𝑐𝑜𝑛𝑑𝑠, the fault current rises and is seen across the current
transformers as 1096 Amps due to 1000:1 CT ratio. Owing to a trip signal received from
relay-3, the CB-3 opens, clearing the hazard from the system. Taking the time multiplier
setting for the relay to be the minimum 0.025, the time of operation is calculated theoretically
as 0.0230 𝑠𝑒𝑐𝑜𝑛𝑑𝑠 for the relay. From the software simulation, the circuit breaker opens at
0.4233 𝑠𝑒𝑐𝑜𝑛𝑑𝑠, giving a time of operation of 0.0229 𝑠𝑒𝑐𝑜𝑛𝑑𝑠, hence it can be concluded
that the theoretical calculated time of operation is approximately equal to the time of
operation obtained from the graph.
With protective relays, the goal is to allow enough time for the relay and breaker closest to
the fault to clear the fault from the system before the backup relay associated with the
adjacent section to the source opens its circuit breaker. The time interval allowed between
two adjacent relays’ operation in order to achieve correct discrimination between them is
called the grading margin. Taking into consideration factors such as circuit breaker operating
time, relay overshoot time, contact gap together with relay and CTs errors, a time grading
margin of 400 𝑚𝑠 is used, as recited from the MiCOM relay user manual.
4.3.2. Time setting of Relay-2:
Relay-3 and relay-2 coordination is achieved by evaluating the maximum fault current seen
by relay-2 for a fault at protection zone-3, denoted by circuit breaker CB-3. On adding a
0.4 𝑠𝑒𝑐𝑜𝑛𝑑𝑠 grading margin, the time of operation for relay-2 on failure of relay-3 will be
0.4231 𝑠𝑒𝑐𝑜𝑛𝑑𝑠 .
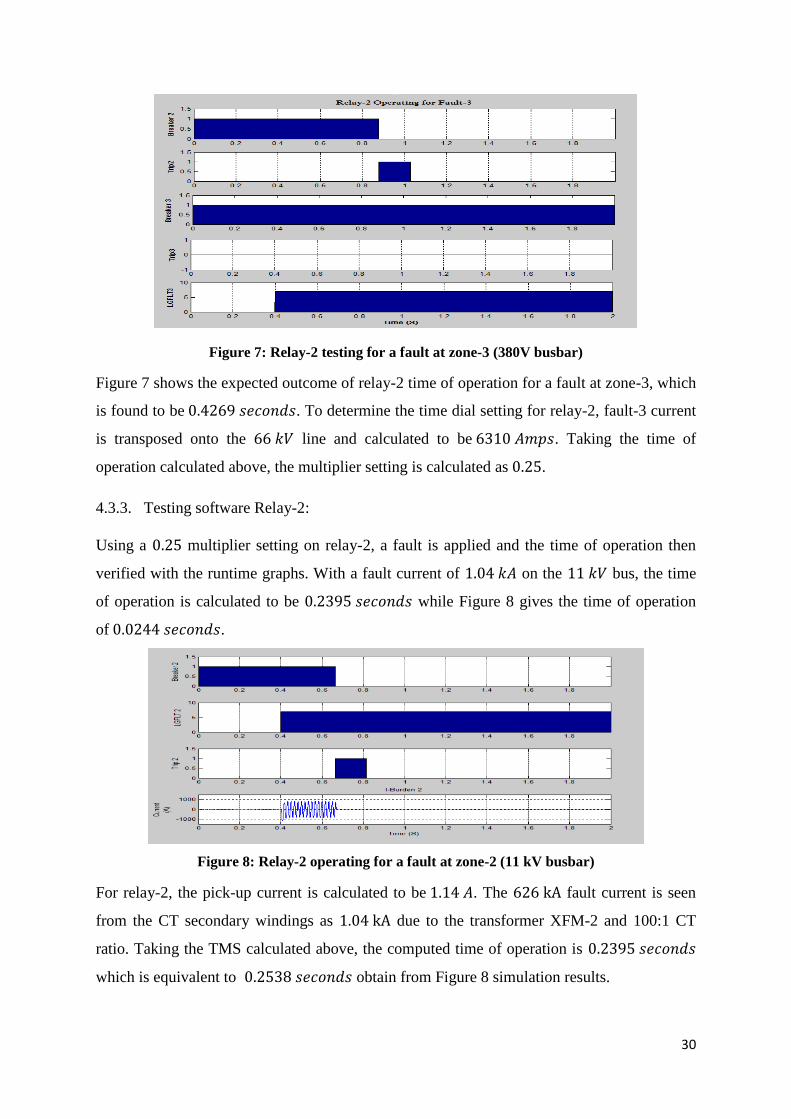
30
Figure 7: Relay-2 testing for a fault at zone-3 (380V busbar)
Figure 7 shows the expected outcome of relay-2 time of operation for a fault at zone-3, which
is found to be 0.4269 𝑠𝑒𝑐𝑜𝑛𝑑𝑠. To determine the time dial setting for relay-2, fault-3 current
is transposed onto the 66 𝑘𝑉 line and calculated to be 6310 𝐴𝑚𝑝𝑠. Taking the time of
operation calculated above, the multiplier setting is calculated as 0.25.
4.3.3. Testing software Relay-2:
Using a 0.25 multiplier setting on relay-2, a fault is applied and the time of operation then
verified with the runtime graphs. With a fault current of 1.04 𝑘𝐴 on the 11 𝑘𝑉 bus, the time
of operation is calculated to be 0.2395 𝑠𝑒𝑐𝑜𝑛𝑑𝑠 while Figure 8 gives the time of operation
of 0.0244 𝑠𝑒𝑐𝑜𝑛𝑑𝑠.
Figure 8: Relay-2 operating for a fault at zone-2 (11 kV busbar)
For relay-2, the pick-up current is calculated to be 1.14 𝐴. The 626 kA fault current is seen
from the CT secondary windings as 1.04 kA due to the transformer XFM-2 and 100:1 CT
ratio. Taking the TMS calculated above, the computed time of operation is 0.2395 𝑠𝑒𝑐𝑜𝑛𝑑𝑠
which is equivalent to 0.2538 𝑠𝑒𝑐𝑜𝑛𝑑𝑠 obtain from Figure 8 simulation results.

31
4.3.4. Time setting of Relay-1:
From Figure 9, relay-1 time of operation for fault-2 is found to be 0.7197 𝑠𝑒𝑐𝑜𝑛𝑑𝑠. As
expected, breaker-1 opens at 1.120 𝑠𝑒𝑐𝑜𝑛𝑑s, which is approximately 0.4 𝑠𝑒𝑐𝑜𝑛𝑑𝑠 later than
the time breaker-2 should have opened, confirming proper relay coordination on the
distribution system.
Figure 9: Relay-1 operating for a fault at zone-2 (11 kV busbar)
As seen, Figure 9 confirms and verifies the expected outcome of relay-1 time of operation for
a fault at zone-2. As carried out previously, relay-1 time multiplier setting is calculated and
set up so it operates for a fault at protection zone-2. Following are calculations carried out in
determining the time dial setting for relay-1. Fault-2 current transposed onto the 132 kV line
is calculated to be 52.17 kA and is seen across the relay coils as 260 A due to 200: 1 CT
ratio. Taking the time of operation calculated above using margin grading, the time multiplier
setting for relay-1 is calculated to be 0.52 and therefore set to 0.55.
4.3.5. Testing software Relay-1:
With all relay-1 parameters and time multiplier setting determined and set, fault-1 is applied
and the time of operation calculated and verified with the runtime graphs. Figure 2 shows a
132 kV distribution line full load RMS CT secondary current of 1.088 𝐴𝑚𝑝𝑠; hence, relay-1
pick-up current value is calculated to be 1.36 𝐴𝑚𝑝𝑠. A 26 kA fault current is seen in the
relay coils as 130 𝐴𝑚𝑝𝑠 due to the CT ratio. Taking the time multiplier setting for relay-1 as
0.55 calculated above, the time of operation is 0.7780 𝑠𝑒𝑐𝑜𝑛𝑑𝑠.
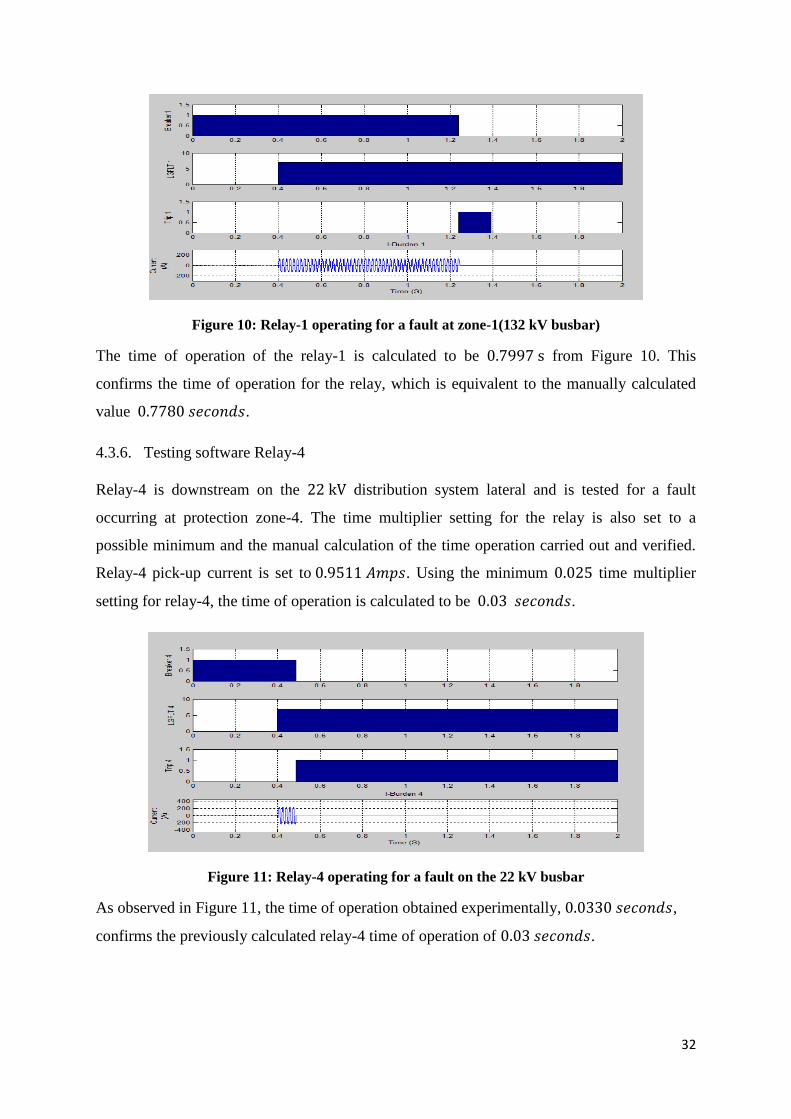
32
Figure 10: Relay-1 operating for a fault at zone-1(132 kV busbar)
The time of operation of the relay-1 is calculated to be 0.7997 s from Figure 10. This
confirms the time of operation for the relay, which is equivalent to the manually calculated
value 0.7780 𝑠𝑒𝑐𝑜𝑛𝑑𝑠.
4.3.6. Testing software Relay-4
Relay-4 is downstream on the 22 kV distribution system lateral and is tested for a fault
occurring at protection zone-4. The time multiplier setting for the relay is also set to a
possible minimum and the manual calculation of the time operation carried out and verified.
Relay-4 pick-up current is set to 0.9511 𝐴𝑚𝑝𝑠. Using the minimum 0.025 time multiplier
setting for relay-4, the time of operation is calculated to be 0.03 𝑠𝑒𝑐𝑜𝑛𝑑𝑠.
Figure 11: Relay-4 operating for a fault on the 22 kV busbar
As observed in Figure 11, the time of operation obtained experimentally, 0.0330 𝑠𝑒𝑐𝑜𝑛𝑑𝑠,
confirms the previously calculated relay-4 time of operation of 0.03 𝑠𝑒𝑐𝑜𝑛𝑑𝑠.

33
4.4. Protection Coordination results
Overcurrent protection scheme is implemented for coordination of relay of interest with
upstream relays, which refers to the supply side or higher voltage side of the system. For a
radial network, the coordination is done for the feeder protection with upstream protection. If
the first and second breakers from the fault zone both fail to operate, the circuit breaker closer
to the source should open [70]. Therefore, for a fault on bus 3, relay-3 is set to operate faster
than relay-2 by a time-delayed approach thus defining primary and backup protection zones.
The design approach is mentioned in the previous sections.
Figure 12 and Figure 13 display simulation results showing proper relay coordination for the
distribution system under study. To simulate the proceedings of events that occur in case of a
failure to send or receive the trip signal resulting in a failure of the relay, relays of interest are
disabled by deactivating the trip signal that governs the breaker so it does not open for a fault
on the protection zone. Following is the simulation of relay-2 malfunction; the trip signal
governing the 66 kV breaker is deactivated, disabling it to open for a fault on the line.
Simulation studies are done by applying a fault and observing the upstream active relay’s
response.
Figure 12: Relay-2 failing to operate
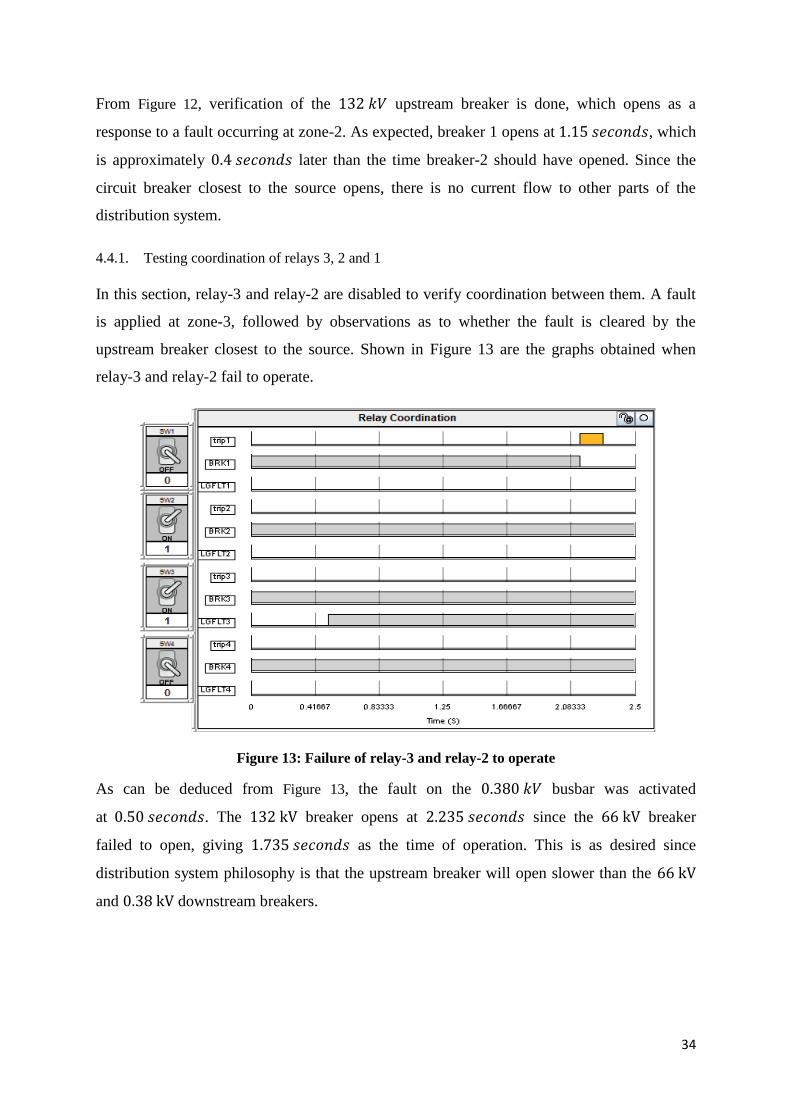
34
From Figure 12, verification of the 132 𝑘𝑉 upstream breaker is done, which opens as a
response to a fault occurring at zone-2. As expected, breaker 1 opens at 1.15 𝑠𝑒𝑐𝑜𝑛𝑑𝑠, which
is approximately 0.4 𝑠𝑒𝑐𝑜𝑛𝑑𝑠 later than the time breaker-2 should have opened. Since the
circuit breaker closest to the source opens, there is no current flow to other parts of the
distribution system.
4.4.1. Testing coordination of relays 3, 2 and 1
In this section, relay-3 and relay-2 are disabled to verify coordination between them. A fault
is applied at zone-3, followed by observations as to whether the fault is cleared by the
upstream breaker closest to the source. Shown in Figure 13 are the graphs obtained when
relay-3 and relay-2 fail to operate.
Figure 13: Failure of relay-3 and relay-2 to operate
As can be deduced from Figure 13, the fault on the 0.380 𝑘𝑉 busbar was activated
at 0.50 𝑠𝑒𝑐𝑜𝑛𝑑𝑠. The 132 kV breaker opens at 2.235 𝑠𝑒𝑐𝑜𝑛𝑑𝑠 since the 66 kV breaker
failed to open, giving 1.735 𝑠𝑒𝑐𝑜𝑛𝑑𝑠 as the time of operation. This is as desired since
distribution system philosophy is that the upstream breaker will open slower than the 66 kV
and 0.38 kV downstream breakers.

35
4.4.2. Testing coordination of relays 3 and 2
Figure 14: Operation of relay-2 for a fault at protection zone 3
Using 0.4 𝑠𝑒𝑐𝑜𝑛𝑑𝑠.grading margin, the time of operation for relay-2 on failure of relay-3 to
operate is calculated to be 0.4231 𝑠𝑒𝑐𝑜𝑛𝑑𝑠. Calculated from Figure 14, the time of operation
of the relay is 0.4269 𝑠𝑒𝑐𝑜𝑛𝑑𝑠. The simulations results show that the time of operation for
relay-2 is approximately equal to the manually calculated one, which goes in agreement with
theory that relay-2 will operate 0.4 𝑠𝑒𝑐𝑜𝑛𝑑𝑠 later than relay-3 would have operated.
4.4.3. Testing coordination of relays 4 and 1
Figure 15: Relay-4 failing to operate
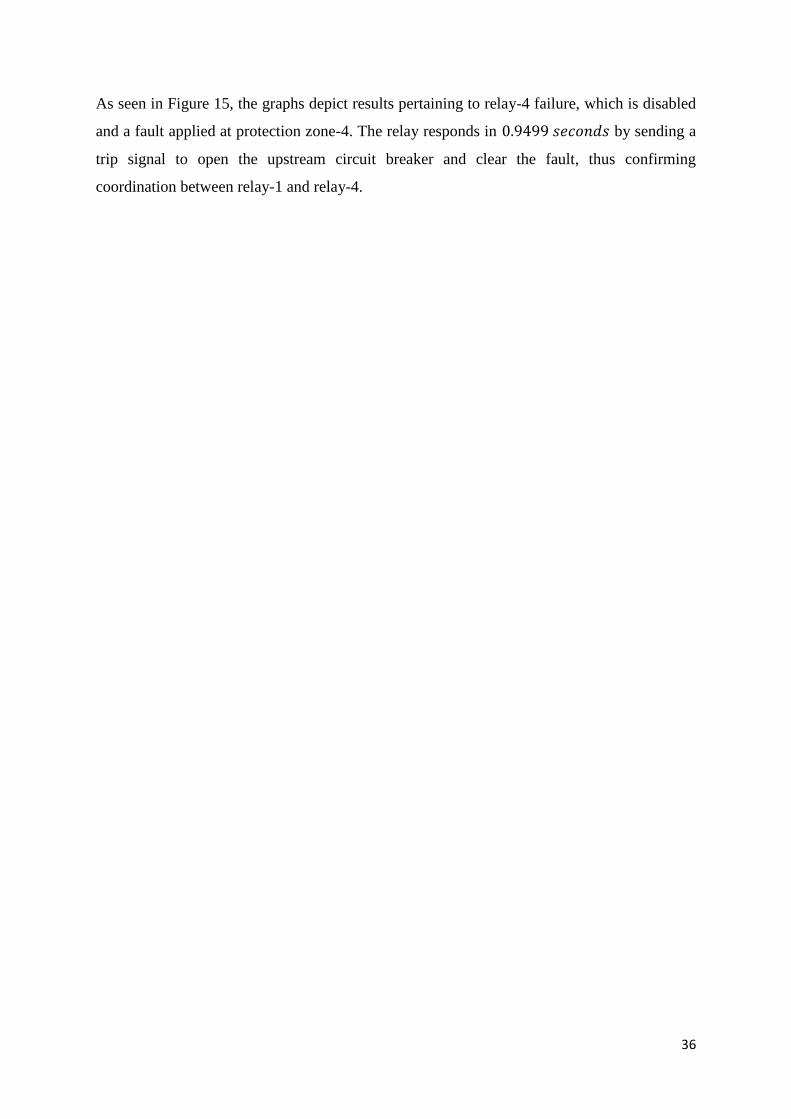
36
As seen in Figure 15, the graphs depict results pertaining to relay-4 failure, which is disabled
and a fault applied at protection zone-4. The relay responds in 0.9499 𝑠𝑒𝑐𝑜𝑛𝑑𝑠 by sending a
trip signal to open the upstream circuit breaker and clear the fault, thus confirming
coordination between relay-1 and relay-4.

37
5. Experimentation and Verification
5.1. Hardware-in-loop simulation
Verification of all results obtained from the software simulations is achieved by substituting
the software relays on the network with the hardware relays. This section considers the
performance of hardware relays in a hardware-in-loop connection with the software
distribution model. As depicted in the appendix Figure 43, Gigabit-transceiver analogue
output (GTAO) and GPC processor cards are configured in RSCAD for the connection
between the RTDS simulator, external protection and control devices replacing the software
components. For exportation of the current signals from the RTDS, OMICRON CMC 156
amplifier and Gigabit-transceiver Front Panel Interface (GTFPI) are used. During a fault, the
relay generates a trip signal which is sent back via GTFPI to the RTDS, which causes
disconnection of a corresponding circuit-breaker in the distribution network model.
The relay input is connected to the RTDS analogue/digital output which is connected to the
power amplifier as shown in Figure 16. The analogue/digital output of the relay is then
connected with the analogue digital input of RTDS. The signal level analogue output voltages
sent from the rack in real-time are converted to correctly-scaled currents and voltages for
input to amplifier. In this way, the real time simulation can be used to drive the relay with the
same power level currents and voltages it would experience in the field [71]. From the
amplifier, these currents are fed to the relay which produces a trip signal when tripping
conditions are fulfilled.
Figure 16: System hardware-in-loop connection
The relay receives current and voltage signals from the secondary side of instrument
transformers of the system simulated on the host PC through digital to analogue conversion

38
and necessary amplification stages. One at a time, the software relays are replaced with the
MiCOM P122 and simulations run to verify results obtained while using the software relays.
Figure 17 to Figure 20 show hardware relays 1 to 4 operating in the distribution system
through a hardware-in-loop connection and same settings used for software relays are in the
similar manner are set for the hardware relays.
5.1.1. Testing Hardware Relay-3
Figure 17: Hardware Overcurrent Relay 3 operating
5.1.2. Testing Hardware Relay-2
Figure 18: Hardware Overcurrent Relay 2 operating
5.1.3. Testing Hardware Relay-1
Figure 19: Hardware Overcurrent Relay 1 operating
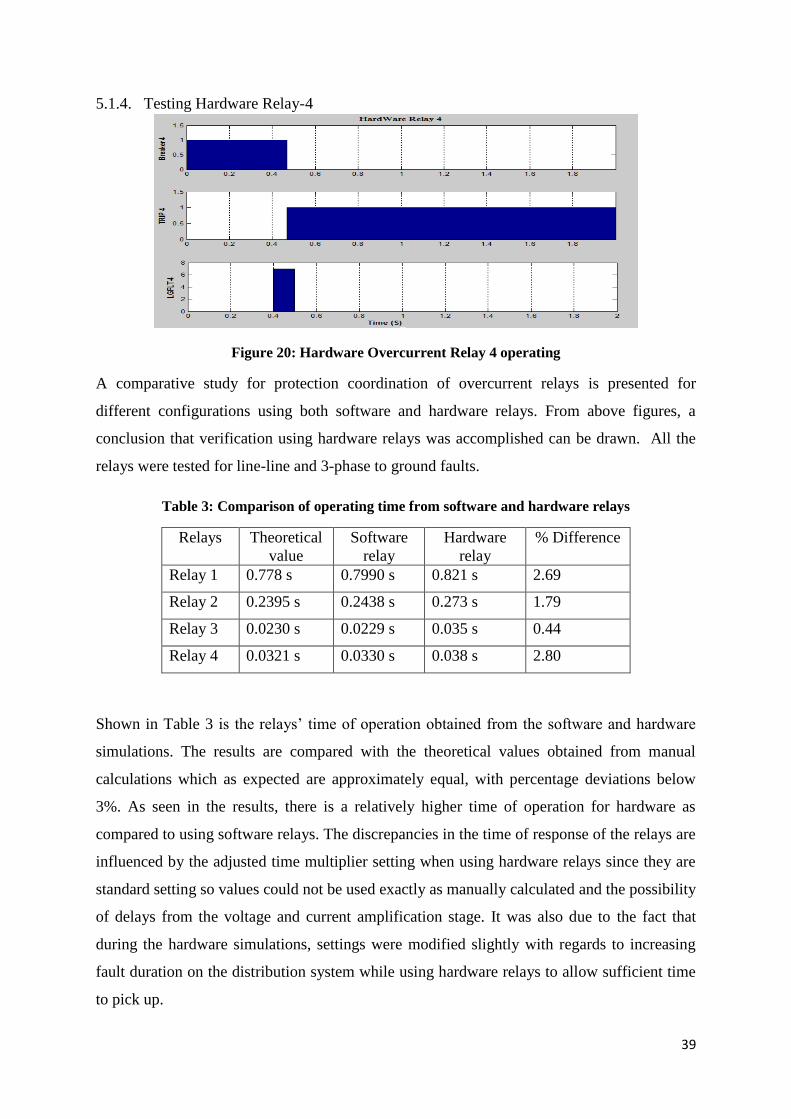
39
5.1.4. Testing Hardware Relay-4
Figure 20: Hardware Overcurrent Relay 4 operating
A comparative study for protection coordination of overcurrent relays is presented for
different configurations using both software and hardware relays. From above figures, a
conclusion that verification using hardware relays was accomplished can be drawn. All the
relays were tested for line-line and 3-phase to ground faults.
Table 3: Comparison of operating time from software and hardware relays
Relays Theoretical
value
Software
relay
Hardware
relay
% Difference
Relay 1 0.778 s 0.7990 s 0.821 s 2.69
Relay 2 0.2395 s 0.2438 s 0.273 s 1.79
Relay 3 0.0230 s 0.0229 s 0.035 s 0.44
Relay 4 0.0321 s 0.0330 s 0.038 s 2.80
Shown in Table 3 is the relays’ time of operation obtained from the software and hardware
simulations. The results are compared with the theoretical values obtained from manual
calculations which as expected are approximately equal, with percentage deviations below
3%. As seen in the results, there is a relatively higher time of operation for hardware as
compared to using software relays. The discrepancies in the time of response of the relays are
influenced by the adjusted time multiplier setting when using hardware relays since they are
standard setting so values could not be used exactly as manually calculated and the possibility
of delays from the voltage and current amplification stage. It was also due to the fact that
during the hardware simulations, settings were modified slightly with regards to increasing
fault duration on the distribution system while using hardware relays to allow sufficient time
to pick up.
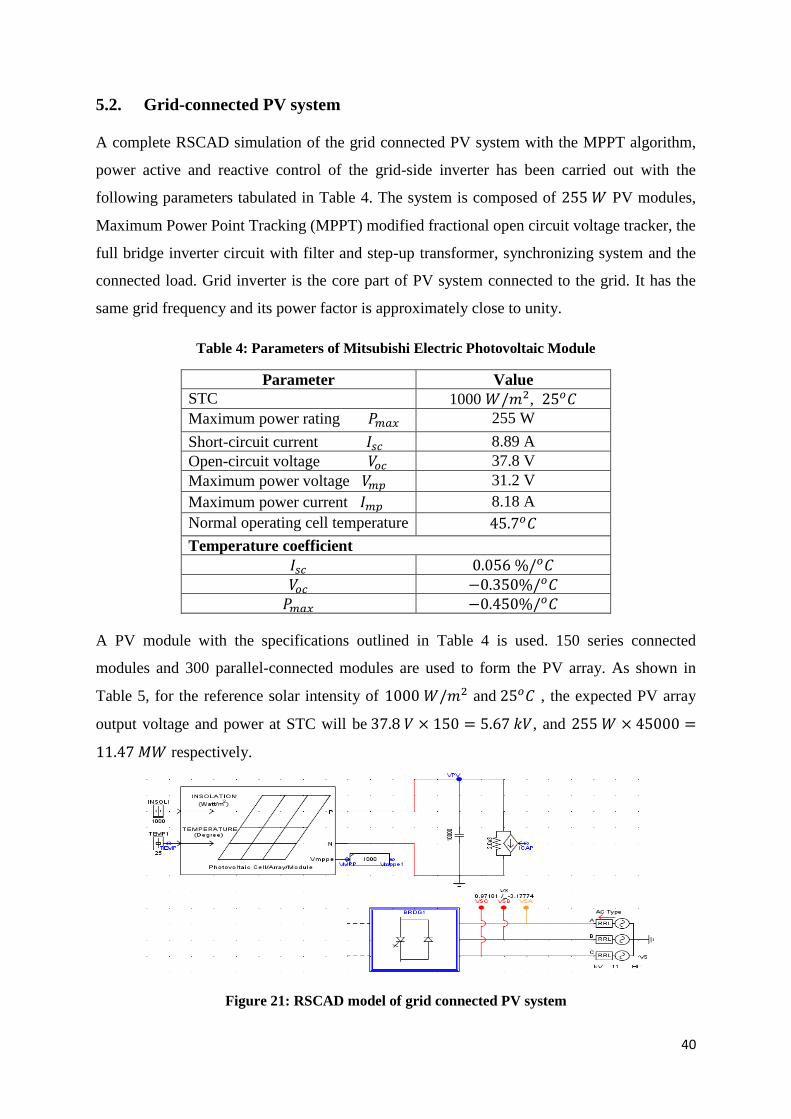
40
5.2. Grid-connected PV system
A complete RSCAD simulation of the grid connected PV system with the MPPT algorithm,
power active and reactive control of the grid-side inverter has been carried out with the
following parameters tabulated in Table 4. The system is composed of 255 𝑊 PV modules,
Maximum Power Point Tracking (MPPT) modified fractional open circuit voltage tracker, the
full bridge inverter circuit with filter and step-up transformer, synchronizing system and the
connected load. Grid inverter is the core part of PV system connected to the grid. It has the
same grid frequency and its power factor is approximately close to unity.
Table 4: Parameters of Mitsubishi Electric Photovoltaic Module
Parameter Value
STC 1000 𝑊/𝑚2, 25𝑜𝐶
Maximum power rating 𝑃𝑚𝑎𝑥 255 W
Short-circuit current 𝐼𝑠𝑐 8.89 A
Open-circuit voltage 𝑉𝑜𝑐 37.8 V
Maximum power voltage 𝑉𝑚𝑝 31.2 V
Maximum power current 𝐼𝑚𝑝 8.18 A
Normal operating cell temperature 45.7𝑜𝐶
Temperature coefficient
𝐼𝑠𝑐 0.056 %/𝑜𝐶
𝑉𝑜𝑐 −0.350%/𝑜𝐶
𝑃𝑚𝑎𝑥 −0.450%/𝑜𝐶
A PV module with the specifications outlined in Table 4 is used. 150 series connected
modules and 300 parallel-connected modules are used to form the PV array. As shown in
Table 5, for the reference solar intensity of 1000 𝑊/𝑚2 and 25𝑜𝐶 , the expected PV array
output voltage and power at STC will be 37.8 𝑉 × 150 = 5.67 𝑘𝑉, and 255 𝑊 × 45000 =
11.47 𝑀𝑊 respectively.
Figure 21: RSCAD model of grid connected PV system
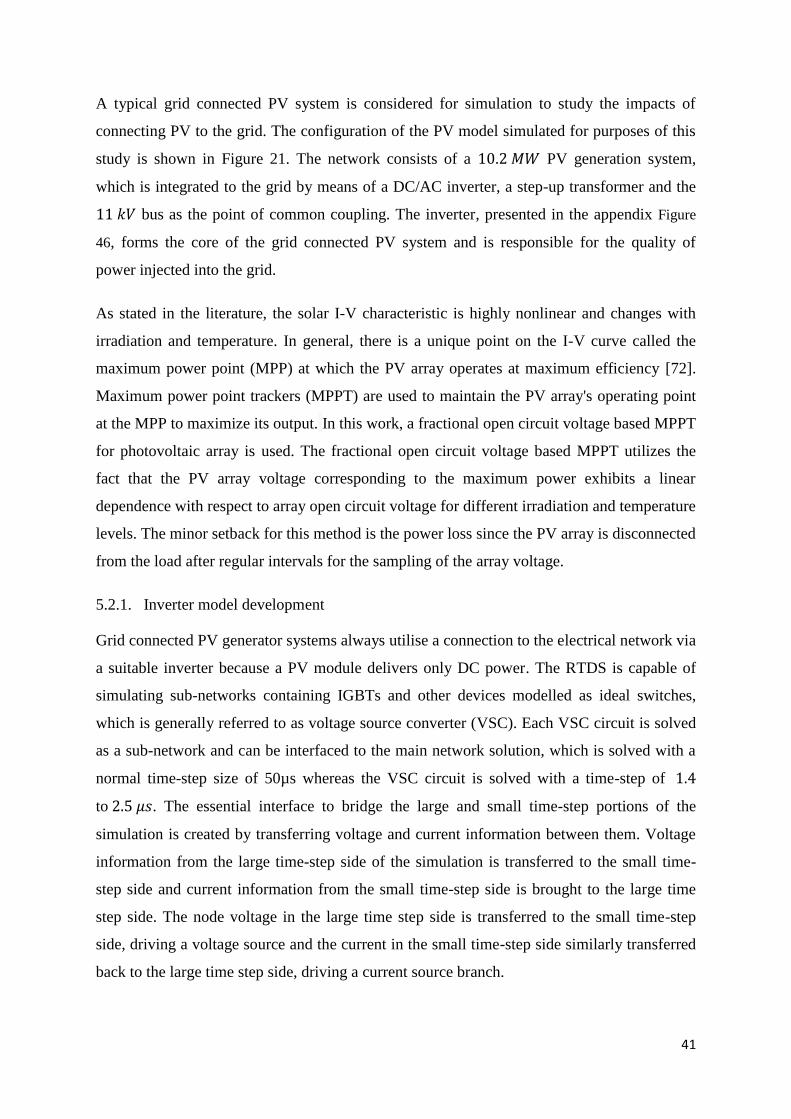
41
A typical grid connected PV system is considered for simulation to study the impacts of
connecting PV to the grid. The configuration of the PV model simulated for purposes of this
study is shown in Figure 21. The network consists of a 10.2 𝑀𝑊 PV generation system,
which is integrated to the grid by means of a DC/AC inverter, a step-up transformer and the
11 𝑘𝑉 bus as the point of common coupling. The inverter, presented in the appendix Figure
46, forms the core of the grid connected PV system and is responsible for the quality of
power injected into the grid.
As stated in the literature, the solar I-V characteristic is highly nonlinear and changes with
irradiation and temperature. In general, there is a unique point on the I-V curve called the
maximum power point (MPP) at which the PV array operates at maximum efficiency [72].
Maximum power point trackers (MPPT) are used to maintain the PV array's operating point
at the MPP to maximize its output. In this work, a fractional open circuit voltage based MPPT
for photovoltaic array is used. The fractional open circuit voltage based MPPT utilizes the
fact that the PV array voltage corresponding to the maximum power exhibits a linear
dependence with respect to array open circuit voltage for different irradiation and temperature
levels. The minor setback for this method is the power loss since the PV array is disconnected
from the load after regular intervals for the sampling of the array voltage.
5.2.1. Inverter model development
Grid connected PV generator systems always utilise a connection to the electrical network via
a suitable inverter because a PV module delivers only DC power. The RTDS is capable of
simulating sub-networks containing IGBTs and other devices modelled as ideal switches,
which is generally referred to as voltage source converter (VSC). Each VSC circuit is solved
as a sub-network and can be interfaced to the main network solution, which is solved with a
normal time-step size of 50µs whereas the VSC circuit is solved with a time-step of 1.4
to 2.5 𝜇𝑠. The essential interface to bridge the large and small time-step portions of the
simulation is created by transferring voltage and current information between them. Voltage
information from the large time-step side of the simulation is transferred to the small time-
step side and current information from the small time-step side is brought to the large time
step side. The node voltage in the large time step side is transferred to the small time-step
side, driving a voltage source and the current in the small time-step side similarly transferred
back to the large time step side, driving a current source branch.
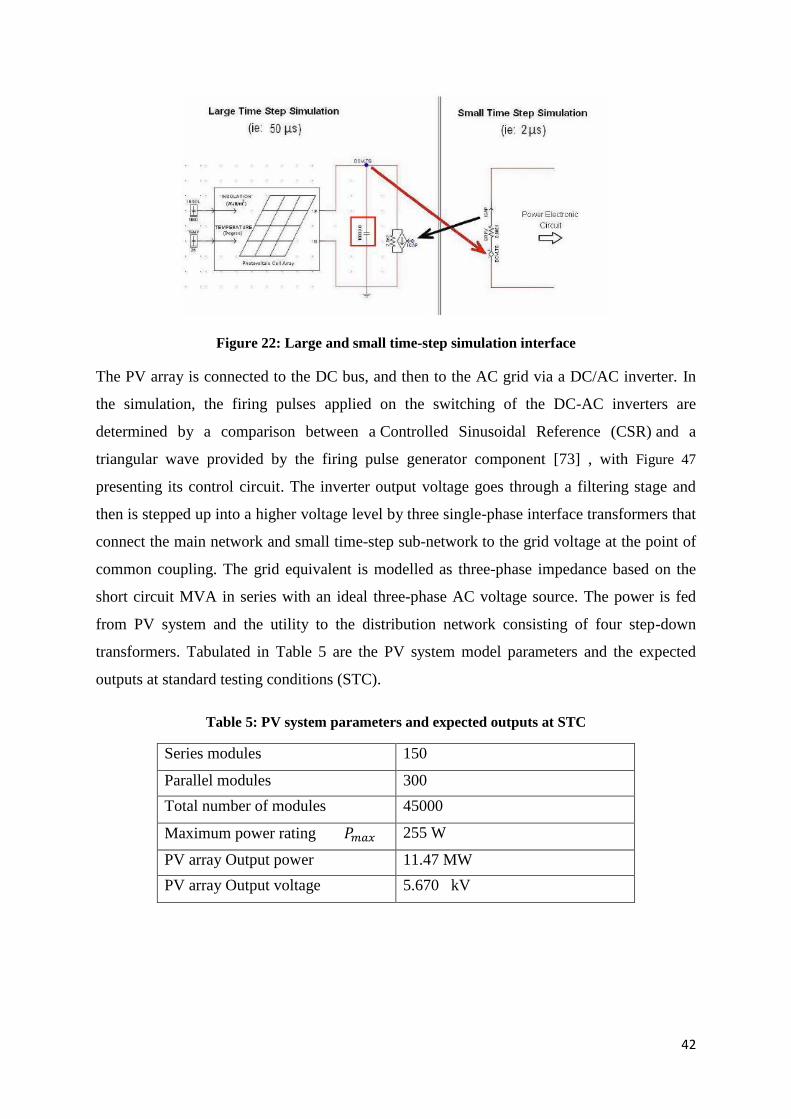
42
Figure 22: Large and small time-step simulation interface
The PV array is connected to the DC bus, and then to the AC grid via a DC/AC inverter. In
the simulation, the firing pulses applied on the switching of the DC-AC inverters are
determined by a comparison between a Controlled Sinusoidal Reference (CSR) and a
triangular wave provided by the firing pulse generator component [73] , with Figure 47
presenting its control circuit. The inverter output voltage goes through a filtering stage and
then is stepped up into a higher voltage level by three single-phase interface transformers that
connect the main network and small time-step sub-network to the grid voltage at the point of
common coupling. The grid equivalent is modelled as three-phase impedance based on the
short circuit MVA in series with an ideal three-phase AC voltage source. The power is fed
from PV system and the utility to the distribution network consisting of four step-down
transformers. Tabulated in Table 5 are the PV system model parameters and the expected
outputs at standard testing conditions (STC).
Table 5: PV system parameters and expected outputs at STC
Series modules 150
Parallel modules 300
Total number of modules 45000
Maximum power rating 𝑃𝑚𝑎𝑥 255 W
PV array Output power 11.47 MW
PV array Output voltage 5.670 kV
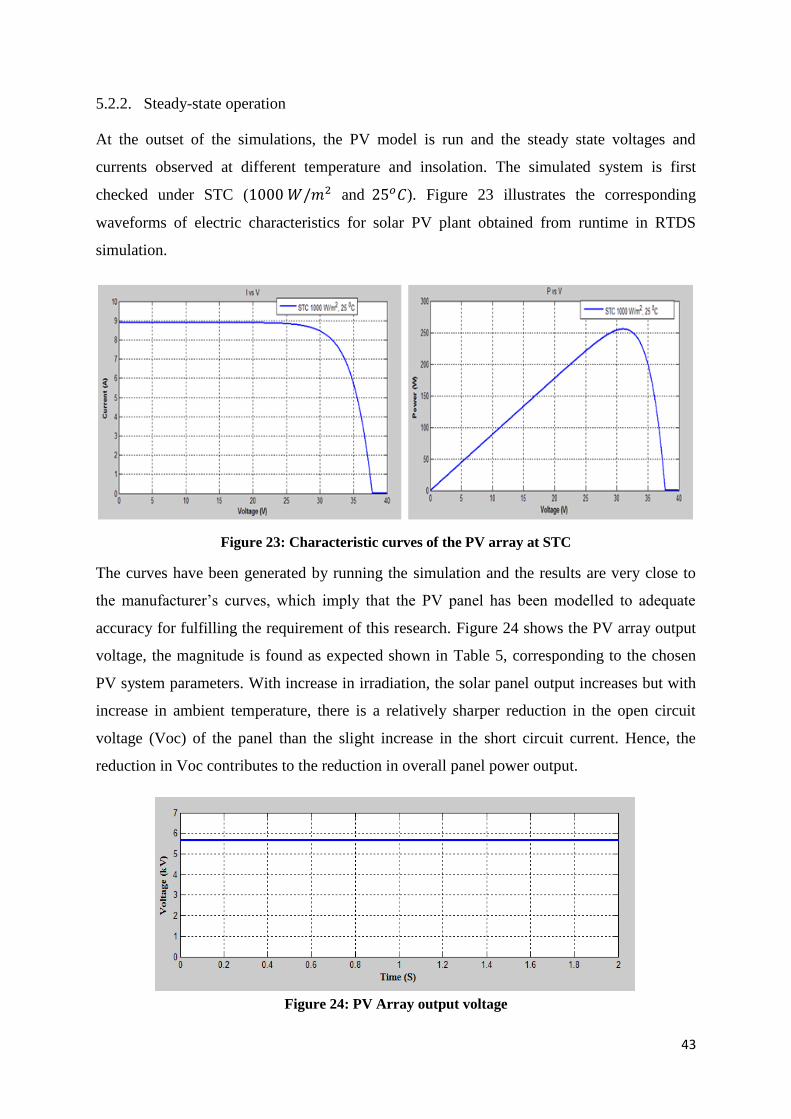
43
5.2.2. Steady-state operation
At the outset of the simulations, the PV model is run and the steady state voltages and
currents observed at different temperature and insolation. The simulated system is first
checked under STC (1000 𝑊/𝑚2 and 25𝑜𝐶). Figure 23 illustrates the corresponding
waveforms of electric characteristics for solar PV plant obtained from runtime in RTDS
simulation.
Figure 23: Characteristic curves of the PV array at STC
The curves have been generated by running the simulation and the results are very close to
the manufacturer’s curves, which imply that the PV panel has been modelled to adequate
accuracy for fulfilling the requirement of this research. Figure 24 shows the PV array output
voltage, the magnitude is found as expected shown in Table 5, corresponding to the chosen
PV system parameters. With increase in irradiation, the solar panel output increases but with
increase in ambient temperature, there is a relatively sharper reduction in the open circuit
voltage (Voc) of the panel than the slight increase in the short circuit current. Hence, the
reduction in Voc contributes to the reduction in overall panel power output.
Figure 24: PV Array output voltage
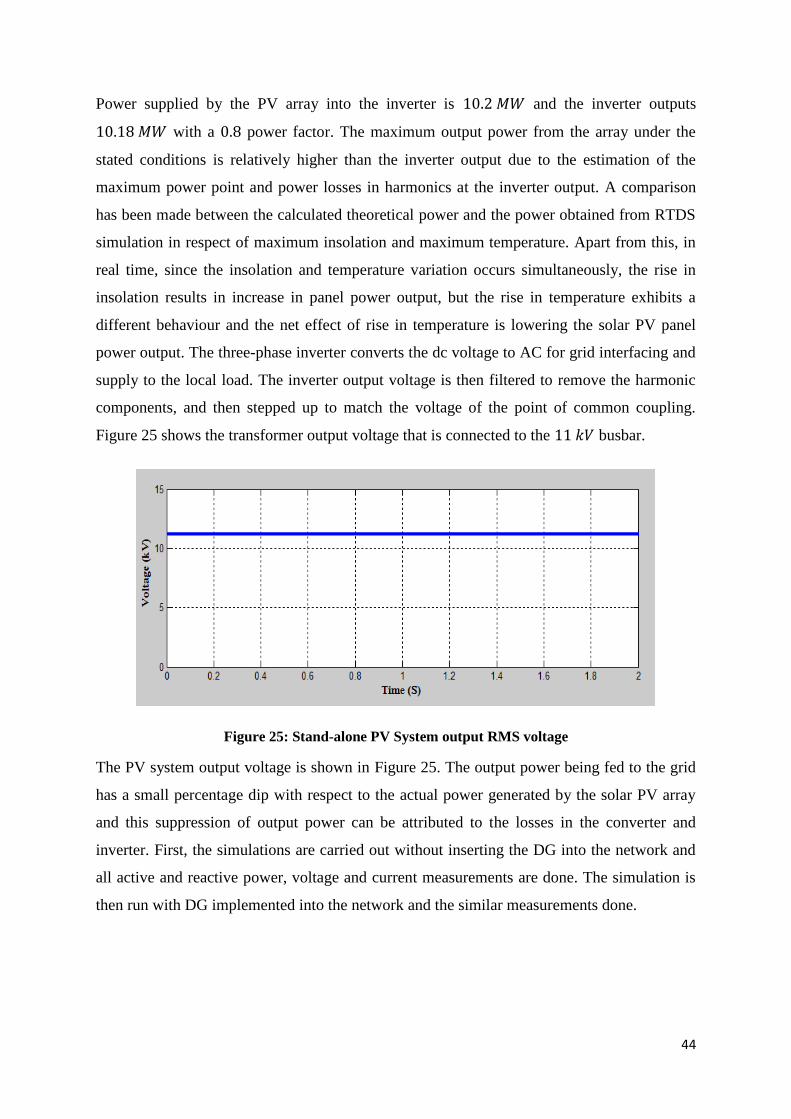
44
Power supplied by the PV array into the inverter is 10.2 𝑀𝑊 and the inverter outputs
10.18 𝑀𝑊 with a 0.8 power factor. The maximum output power from the array under the
stated conditions is relatively higher than the inverter output due to the estimation of the
maximum power point and power losses in harmonics at the inverter output. A comparison
has been made between the calculated theoretical power and the power obtained from RTDS
simulation in respect of maximum insolation and maximum temperature. Apart from this, in
real time, since the insolation and temperature variation occurs simultaneously, the rise in
insolation results in increase in panel power output, but the rise in temperature exhibits a
different behaviour and the net effect of rise in temperature is lowering the solar PV panel
power output. The three-phase inverter converts the dc voltage to AC for grid interfacing and
supply to the local load. The inverter output voltage is then filtered to remove the harmonic
components, and then stepped up to match the voltage of the point of common coupling.
Figure 25 shows the transformer output voltage that is connected to the 11 𝑘𝑉 busbar.
Figure 25: Stand-alone PV System output RMS voltage
The PV system output voltage is shown in Figure 25. The output power being fed to the grid
has a small percentage dip with respect to the actual power generated by the solar PV array
and this suppression of output power can be attributed to the losses in the converter and
inverter. First, the simulations are carried out without inserting the DG into the network and
all active and reactive power, voltage and current measurements are done. The simulation is
then run with DG implemented into the network and the similar measurements done.
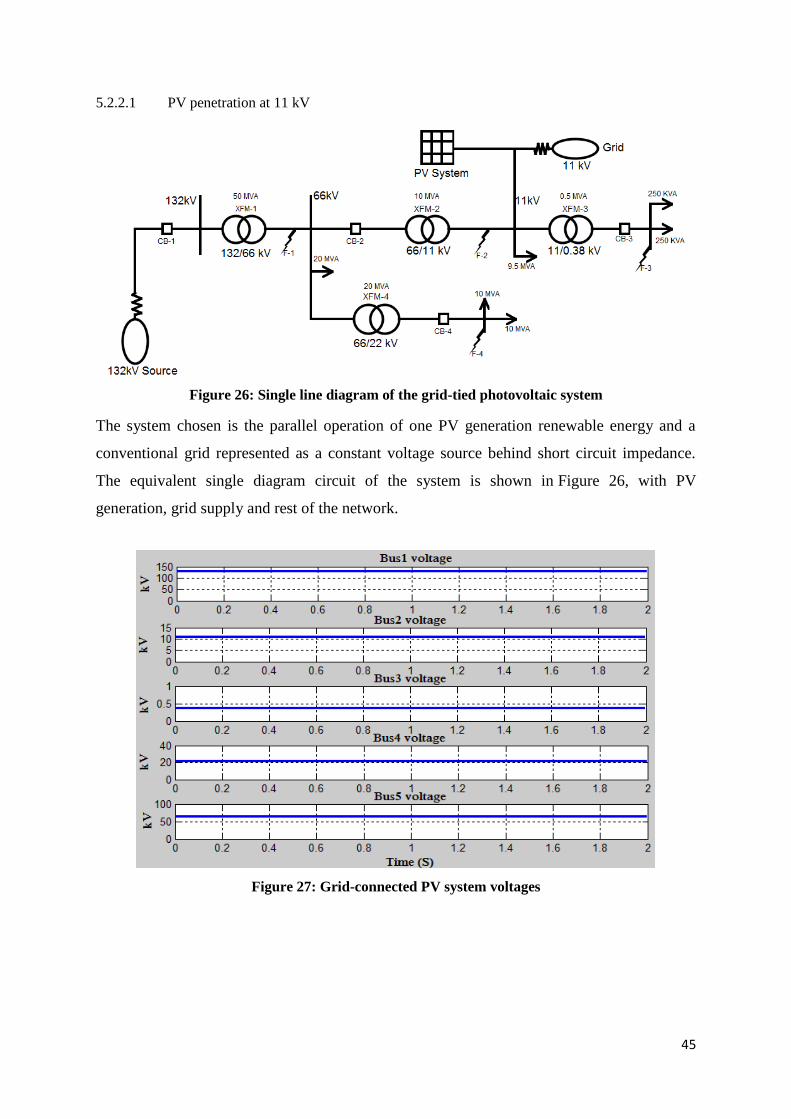
45
5.2.2.1 PV penetration at 11 kV
Figure 26: Single line diagram of the grid-tied photovoltaic system
The system chosen is the parallel operation of one PV generation renewable energy and a
conventional grid represented as a constant voltage source behind short circuit impedance.
The equivalent single diagram circuit of the system is shown in Figure 26, with PV
generation, grid supply and rest of the network.
Figure 27: Grid-connected PV system voltages

46
Figure 28: Grid-connected PV system CTs secondary RMS current
Figure 27 and Figure 28 show the system voltages and CTs secondary RMS currents 1 to 4
respectively after the PV system connection to the distribution network. As can be seen,
current through CT-1 and CT-2 secondary windings is seen to have doubled and quadrupled
respectively, and this can be accounted to the power being injected into the distribution
system and backflow of current resulting from the addition of the PV generation system on
the 11 𝑘𝑉 busbar. The conditions met and results thus obtained are in accordance with the
engineering principles in that the generated voltage of the incoming generator and the
frequency of generated voltage connected in parallel to a busbar are equal to the busbar
voltage and frequency.
5.2.2.2 PV penetration at 66 kV
Similarly, simulations are also carried out by varying the PV penetration level. The following
results show the performance of the grid-connected PV system when point of common
coupling is changed to the 66 𝑘𝑉 busbar. As the PV penetration varies, the distribution
feeders affected by the backflow of power change. The degree of impacts of DG addition to
distribution systems is further illustrated in the following figures.
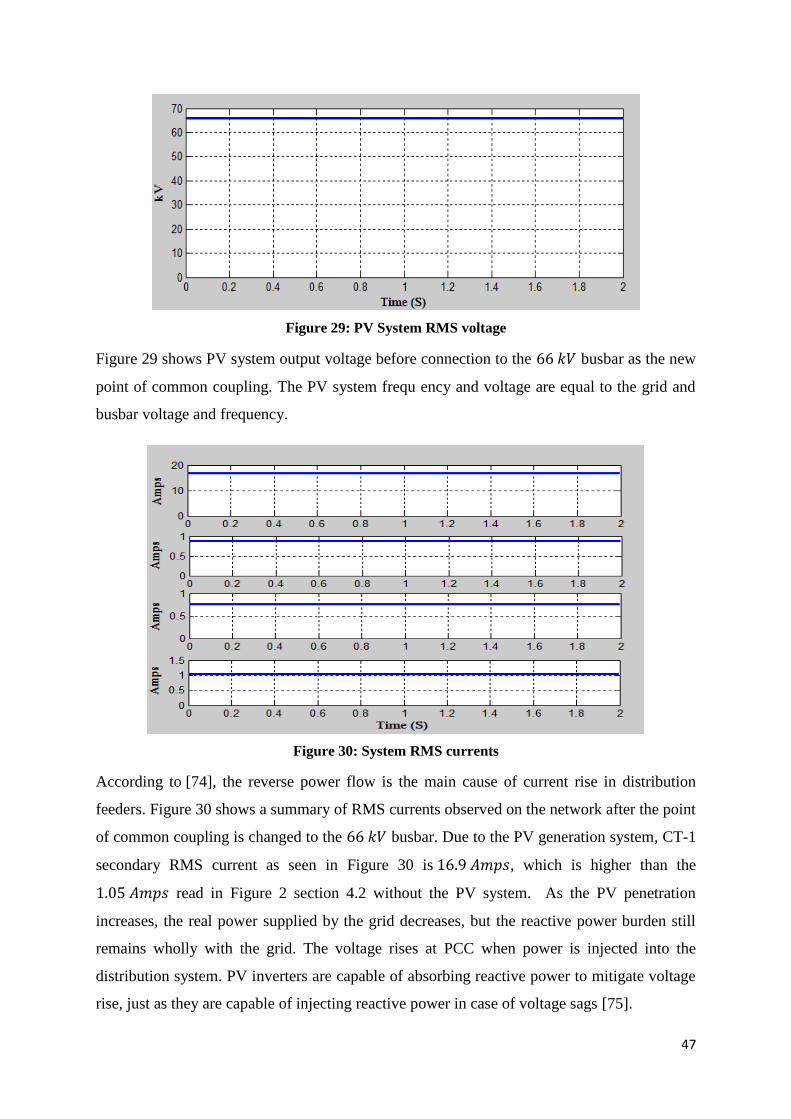
47
Figure 29: PV System RMS voltage
Figure 29 shows PV system output voltage before connection to the 66 𝑘𝑉 busbar as the new
point of common coupling. The PV system frequ ency and voltage are equal to the grid and
busbar voltage and frequency.
Figure 30: System RMS currents
According to [74], the reverse power flow is the main cause of current rise in distribution
feeders. Figure 30 shows a summary of RMS currents observed on the network after the point
of common coupling is changed to the 66 𝑘𝑉 busbar. Due to the PV generation system, CT-1
secondary RMS current as seen in Figure 30 is 16.9 𝐴𝑚𝑝𝑠, which is higher than the
1.05 𝐴𝑚𝑝𝑠 read in Figure 2 section 4.2 without the PV system. As the PV penetration
increases, the real power supplied by the grid decreases, but the reactive power burden still
remains wholly with the grid. The voltage rises at PCC when power is injected into the
distribution system. PV inverters are capable of absorbing reactive power to mitigate voltage
rise, just as they are capable of injecting reactive power in case of voltage sags [75].

48
5.2 Overcurrent Protection set-up
As stated earlier in the literature, injection of distributed generation to the conventional radial
distribution networks poses challenges concerning the already existing system protection
scheme. As soon as the fault takes place, it is sensed by both primary and backup protection.
The primary protection is the first to operate, as its operating time is less than that of the
backup relay. For the simple radial feeder shown under consideration, relay-3 should be the
first to operate for fault F-3, followed by back-up relay-2 if it fails to operate. The challenge
of coordination of overcurrent relays in distribution systems can be quantified as an
optimization linear programming problem (LPP), whereby using dual simplex method, the
operating times of the relays, for near end fault can be minimized [65], i.e.
min 𝑧 = ∑ 𝑡𝑖𝑚𝑖=1 (2)
where 𝑡𝑖 indicates the operating time of the primary relay at i, for near end fault. The
objective is achieved under the following constraints:
A. Coordination criteria
𝑡𝑏𝑖 − 𝑡𝑖 ≥ ∆𝑡 (3)
Where 𝑡𝑏𝑖 is the operating time of the backup relay for a fault at ‘i' and ∆𝑡 is the
coordination time interval (CTI).
B. Relay operating time boundaries
𝑡𝑖𝑚𝑖𝑛 ≤ 𝑡𝑖 ≤ 𝑡𝑖𝑚𝑎𝑥 (4)
Where 𝑡𝑖𝑚𝑖𝑛 is the minimum operating time of relay and 𝑡𝑖𝑚𝑎𝑥 is the maximum
operating time for the same relay.
C. Relay characteristics
Inverse definite minimum time (IDMT) characteristics are assumed to be same for all
relays and plug setting taken as 1.
𝑡𝑜𝑝 =0.14
𝑃𝑆𝑀0.02−1× 𝑇𝑀𝑆 (5)
Where 𝑡𝑜𝑝 is the time of operation, 𝑃𝑆𝑀 is the plug setting multiplier and 𝑇𝑀𝑆 is the
time multiplier setting. Taking
𝑎 =0.14
𝑃𝑆𝑀0.02−1 (6)
and substituting it into the objective equation (2), it becomes
min 𝑧 = ∑ 𝑎𝑖(𝑇𝑀𝑆)𝑖𝑚
𝑖=1 (7)
𝑃𝑆𝑀 =𝐹𝑎𝑢𝑙𝑡 𝐶𝑢𝑟𝑟𝑒𝑛𝑡
𝐶𝑇−𝑟𝑎𝑡𝑖𝑜 (8)

49
The dual simplex method algorithm used to solve the maximization problem is outlined in the
methodology. Considering relay-1, relay-2 and relay-3, the minimum operating time for each
relay is considered as 0.02 𝑠𝑒𝑐𝑜𝑛𝑑𝑠 and the CTI is taken as 0.4 𝑠𝑒𝑐𝑜𝑛𝑑𝑠. The maximum
fault currents at F-1, F-2 and F-3 are 52 𝑘𝐴, 500 𝑘𝐴 and 930 𝑘𝐴 respectively, with the CT
ratios being set at 400:1, 500:1 and 1000:1 for relay 1, 2 and 3 respectively. Due to
transformers XFM-1, XFM-2 and XFM-3 winding ratios, the fault currents seen by the circuit
breakers CB-1, CB-2 and the relays’ coils are less than the actual currents measured at the
faulted points. The PSM and a values are calculated using equation (6) and (8), and are
tabulated as shown in Table 6. PSM sample calculation for fault-3 current seen by relay-2
gives 𝐼_(3 − 2) = 5354 𝐴 and 𝑃𝑆𝑀 = 10.7.
Table 6: PSM and a values
Fault point and
current
Relays
Relay-1 Relay-2 Relay-3
F-1
52 kA
PSM 65 - -
a 1.6 - -
F-2
500 kA
PSM 104 166.7 -
a 1.43 1.29 -
F-3
930 kA
PSM - 10.7 930
a - 2.88 0.956
Adding slack variables and converting it into a maximization problem, the problem
formulation is carried out using dual-simplex method as follows:
Max 𝑦 = −1.6𝑋1 − 1.29𝑋2 − 0.956𝑋3
Subject to: −1.43𝑋1 + 1.290𝑋2 + 𝑆1 = −0.4
−2.88𝑋2 + 0.956𝑋3 + 𝑆2 = −0.4
−1.6𝑋1 + 𝑆3 = −0.02
−1.29𝑋2 + 𝑆4 = −0.02
−0.956𝑋3 + 𝑆5 = −0.02
The optimum solution is obtained in four basic iterations outlined in the appendix Table 8-11.
At the end of fourth iteration, all the values in the last right-hand column are non-negative
and the optimal solution is reached. The TMS values to be used are therefore 0.41 for relay-

50
1, 0.145 for relay-2 and 0.021 for relay-3. Due to the standard MiCOM P122 relay TMS
settings, the values shall be taken as 0.45, 0.15 and 0.025 for relay 1, 2 and 3 respectively.
5.2.2 Experimentation results:
Of interest initially, is the adequate sequential relay operation. The calculated results are
verified with an experimental model where the optimum relay TMS settings calculated in the
previous section are set on and model simulations run. A positive correlation between the
calculated results and proper relay coordination indicated by graphs from the simulations will
give credence to the dual simplex method employed.
Figure 31: Relay-3 testing
Figure 31 shows results for relay-3 TMS validation. As expected, it can be seen from the plot
that when a fault occurs, a trip signal is sent which consequently opens the circuit breaker
immediately on the signal detection. The relay’s time of operation was computed to
be 0.023 𝑠𝑒𝑐𝑜𝑛𝑑𝑠.
Figure 32: Relay-2 testing
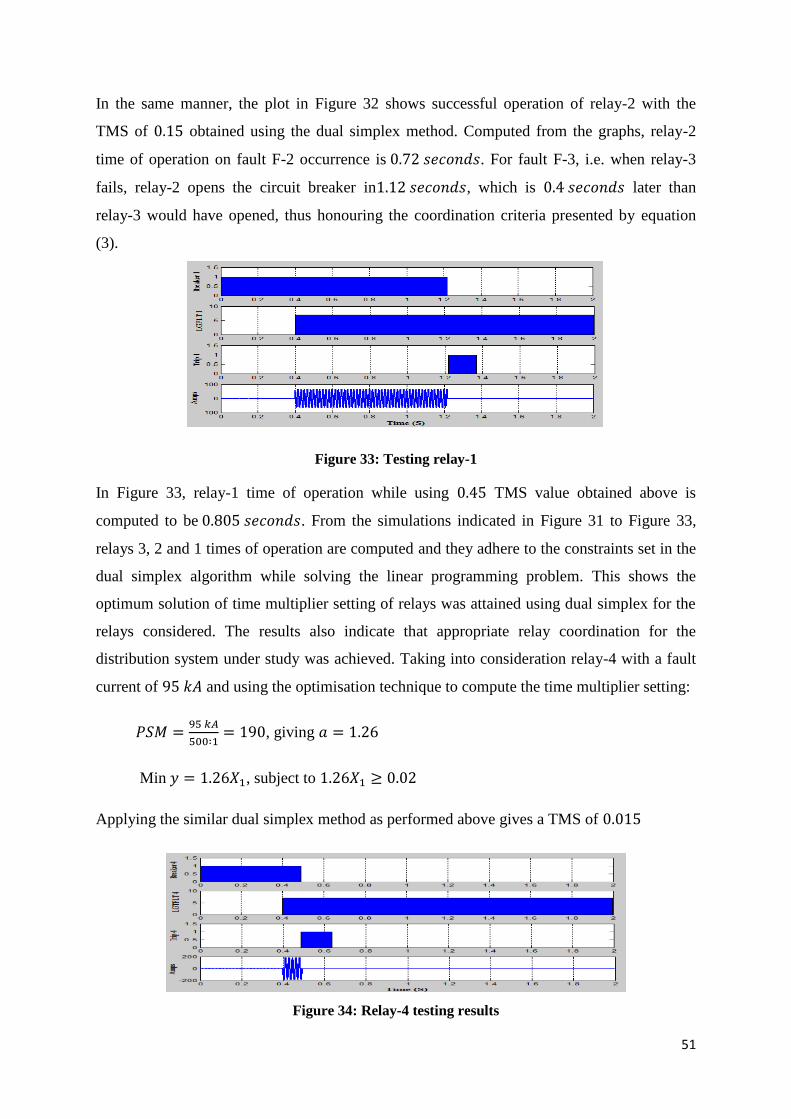
51
In the same manner, the plot in Figure 32 shows successful operation of relay-2 with the
TMS of 0.15 obtained using the dual simplex method. Computed from the graphs, relay-2
time of operation on fault F-2 occurrence is 0.72 𝑠𝑒𝑐𝑜𝑛𝑑𝑠. For fault F-3, i.e. when relay-3
fails, relay-2 opens the circuit breaker in1.12 𝑠𝑒𝑐𝑜𝑛𝑑𝑠, which is 0.4 𝑠𝑒𝑐𝑜𝑛𝑑𝑠 later than
relay-3 would have opened, thus honouring the coordination criteria presented by equation
(3).
Figure 33: Testing relay-1
In Figure 33, relay-1 time of operation while using 0.45 TMS value obtained above is
computed to be 0.805 𝑠𝑒𝑐𝑜𝑛𝑑𝑠. From the simulations indicated in Figure 31 to Figure 33,
relays 3, 2 and 1 times of operation are computed and they adhere to the constraints set in the
dual simplex algorithm while solving the linear programming problem. This shows the
optimum solution of time multiplier setting of relays was attained using dual simplex for the
relays considered. The results also indicate that appropriate relay coordination for the
distribution system under study was achieved. Taking into consideration relay-4 with a fault
current of 95 𝑘𝐴 and using the optimisation technique to compute the time multiplier setting:
𝑃𝑆𝑀 =95 𝑘𝐴
500∶1= 190, giving 𝑎 = 1.26
Min 𝑦 = 1.26𝑋1, subject to 1.26𝑋1 ≥ 0.02
Applying the similar dual simplex method as performed above gives a TMS of 0.015
Figure 34: Relay-4 testing results

52
Figure 34 gives the operation time of relay-4 as 0.088 𝑠𝑒𝑐𝑜𝑛𝑑𝑠, and further simulations
show that when relay-4 fails, relay-1 operates in 0.94 𝑠𝑒𝑐𝑜𝑛𝑑𝑠, indicating that accurate and
optimum solutions were achieved for the overall system relays’ coordination.
5.3 Islanding Protection
Islanding of a grid connected distributed generation (DG) occurs when a section of the utility
system containing such generators is disconnected from the main utility, but the independent
DGs continue to energize the utility lines in the isolated section (termed as an island) [76].
Unintended islanding is a concern primarily because it poses a hazard to utility and customer
equipment, maintenance personnel, and the general public; hence, anti-islanding protection is
essential to ensure that grid-tied energy harvesting systems cut their connection to the grid
when the grid itself loses power. The identification of power loss in the grid can be
challenging, requiring an approach able to find the right balance between sensitivity to
normal fluctuations in the grid and responsiveness to grid power failure. Many anti-islanding
techniques have been proposed to prevent islanding caused by DGs [77] [78]. They are either
passive techniques that monitor the voltage and frequency or active methods where the output
of the reactive power is varied to help destabilize the island and accelerate the dissolving of
the system to extinguish the island.
5.3.2 Passive techniques
a) Under/Over voltage and Under/Over frequency
Under/Over voltage and Under/Over frequency relaying are effective loss of grid (LOG)
techniques for small DGs. According to [67], they usually provide an acceptable level of
protection but may fail to operate if the change of load associated with LOG can be
compensated by the DGs' control system, keeping voltage and frequency more or less stable.
b) Rate of change of frequency (ROCOF)
ROCOF relays monitor the voltage waveform and trips the CB when the measured rate of
change of frequency exceeds a pre-set level for longer than a set period [68]. The settings are
chosen such that the relay operates only for fluctuations associated with islanding and with
the DG operating independently from the utility, but not for those fluctuations governed by
utility time constants [67].

53
5.3.3 Active techniques
a) Reactive power export error detection
A level of reactive power flow in the inter-tie between the DG and the utility is generated by
DG control system interfaced with the reactive power export error detection relay. This level
can only be maintained when the utility generation is connected. There should be a
considerable reduction on the DG disturbance during normal operation and has to, after
islanding, be sufficient to drive the frequency outside its threshold limits [67] [79]. The relay
operates when there is an error between the setting and the actual reactive power being
exported for a period greater than the set value.
b) System fault level monitoring
In this scheme, system fault level is monitored by sensing the short circuit current and
reduction in supply voltage when a shunt inductor is connected across the supply by using
point-on-wave triggered, thyristor switches. It is a faster acting protection technique. Its
tripping is dependent on the power system's source impedance close to the inter-tie. Firing of
the thyristor occurs just before a current zero [80]. This causes a short pulse of current to flow
in the inductor and a voltage glitch. The tripping decision depends on the comparison of the
measured system fault level with that corresponding to a network fed from the utility
generation [67].
5.3.4 Islanding operation
The difficulties with islanded DG have been outlined in the literature review. To prevent
island operation, the protection system has to detect islands quickly and reliably. Much
literature is available concerning protection of distributed generation. Many publications
demonstrate the same problems and issues, but solutions are rare.
Figure 35: A radial feeder with PV generation integrated
Figure 35 shows a simple single line diagram of the distribution feeder modelled with a fault
F-1 applied nearer to the source. As soon as the fault takes place, it is sensed by relay R1

54
which then trips and opens the circuit breaker CB-1 shown in Figure 26. Due to the location
of the fault, the source is cut from and does not supply the grid; however, the PV generation
system denoted by DG is still connected to the rest of the network, resulting in an island.
Figure 36: Distribution system currents due to islanding
Figure 36 indicates network RMS currents after experiencing fault F-1. The utility protection
system detected the overcurrent and opened circuit breaker CB-1, and as can be seen, there is
almost no phase RMS current I1 flowing in the 132 𝑘𝑉 feeder, 0.9 × 10⁻⁶ 𝐴𝑚𝑝𝑠. Although
the source is disconnected from the rest of the network, the PV system still supplies the grid
and hence current I2, I3 and I4 flows. In the context of power supply to loads, there is current
flowing but the condition is unfavourable as critical situations can occur due to the part of the
utility network which is islanded and the connected integrated PV unit.
Figure 37: Protection against islanding layout
An example of a simple protection technique against islanding is shown in Figure 37. The
overcurrent protection relays R1 and R2 provide basic detection of faults that will separate
the DG from the utility by opening circuit breaker CB-6 if fault F-1 or F-2 occurs. The circuit
breaker is controlled by a trip signal from either R1 or R2.
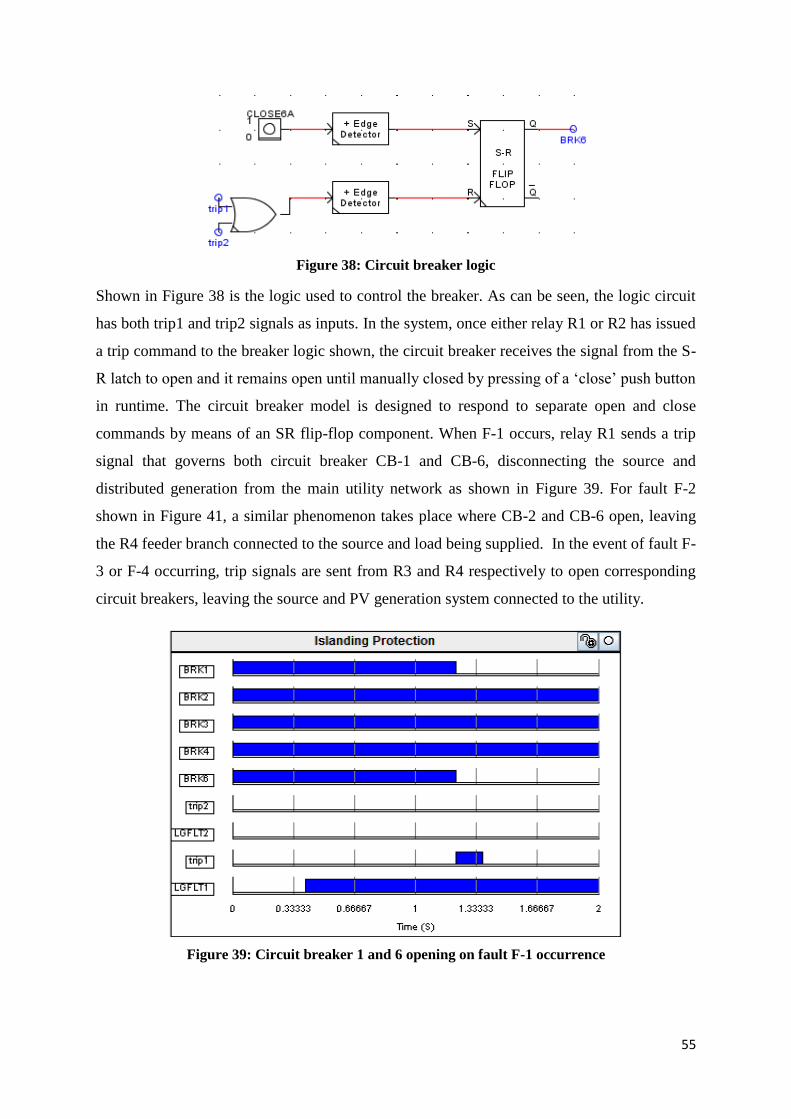
55
Figure 38: Circuit breaker logic
Shown in Figure 38 is the logic used to control the breaker. As can be seen, the logic circuit
has both trip1 and trip2 signals as inputs. In the system, once either relay R1 or R2 has issued
a trip command to the breaker logic shown, the circuit breaker receives the signal from the S-
R latch to open and it remains open until manually closed by pressing of a ‘close’ push button
in runtime. The circuit breaker model is designed to respond to separate open and close
commands by means of an SR flip-flop component. When F-1 occurs, relay R1 sends a trip
signal that governs both circuit breaker CB-1 and CB-6, disconnecting the source and
distributed generation from the main utility network as shown in Figure 39. For fault F-2
shown in Figure 41, a similar phenomenon takes place where CB-2 and CB-6 open, leaving
the R4 feeder branch connected to the source and load being supplied. In the event of fault F-
3 or F-4 occurring, trip signals are sent from R3 and R4 respectively to open corresponding
circuit breakers, leaving the source and PV generation system connected to the utility.
Figure 39: Circuit breaker 1 and 6 opening on fault F-1 occurrence

56
Figure 40: System line current during islanding protection
Figure 40 shows the distribution system line currents after fault F-1 occurs. Due to the open
circuit breakers disconnecting both the source and PV system from the grid, there is almost
no current flowing since the system is not getting any voltage supply.
Figure 41: Circuit breaker 1 and 6 opening on fault F-2 occurrence
For safety concerns, a successful implementation of anti-islanding assists against unexpected
live wires, which repair crews may be faced with during a fault or maintenance. End-user
equipment is also guarded against damage since customer equipment could theoretically be
damaged if operating parameters differ greatly from the normal.

57
6 Conclusion
Apart from fossil fuels that power thermal power plants, alternative fuels are under
consideration due to the rising electrical energy demand. This lead to the development of
innovative electrical power distribution systems where photovoltaic generation systems
supply some of the energy and centralized generation produces some. Major concerns
relating to penetration of PV systems included poor relay coordination, sympathetic tripping
and unintentional islands that result from continuous power flow from the dispersed
generation systems although the grid is disconnected during a fault. This work involved
modelling and development of an overcurrent protection scheme for a modified test
distribution network with and without dispersed generation. A study of the electricity
distribution systems was done and the system model developed. All the relevant theory prior
to the technical design and all results obtained thus far in terms of the design procedure
progress were discussed. This research work presented the experimental results of the
protection scheme using both software and hardware relays on RTDS. Control logic functions
for system faults and circuit breakers were implemented and tested on all protection zones
and the obtained results demonstrated correct operation. The expected relay operation defined
in the theory was verified, with the higher fault currents showing a reduction in relay time of
operation. The results were discussed and analyzed to verify existing theories under steady
and faulted operating conditions.
Integration of all parts of the work with physical components to obtain a system where the
complete protection philosophy was implemented. The RTDS enables hardware closed-loop
testing with the distribution system digital model. Results were compared with the theoretical
values obtained from manual calculations, which as expected were approximately equal with
percentage deviations below 3%. The results show a relatively higher time of operation for
hardware relays as compared to using software relays. The adjusted time multiplier setting
when using hardware relays and the possibility of delays from the amplification stage
influenced the discrepancies in the relay time of response since physical relays use a certain
TMS values range and standard settings so some values could not be used exactly as
manually calculated. Coordination of the protection relays was tested on the distribution
system and implemented using the software and hardware relays in verification of the relay
coordinated sequential operation during faults. The test system was analysed without the
presence of DG, which served as a basis with which subsequent results were compared to.
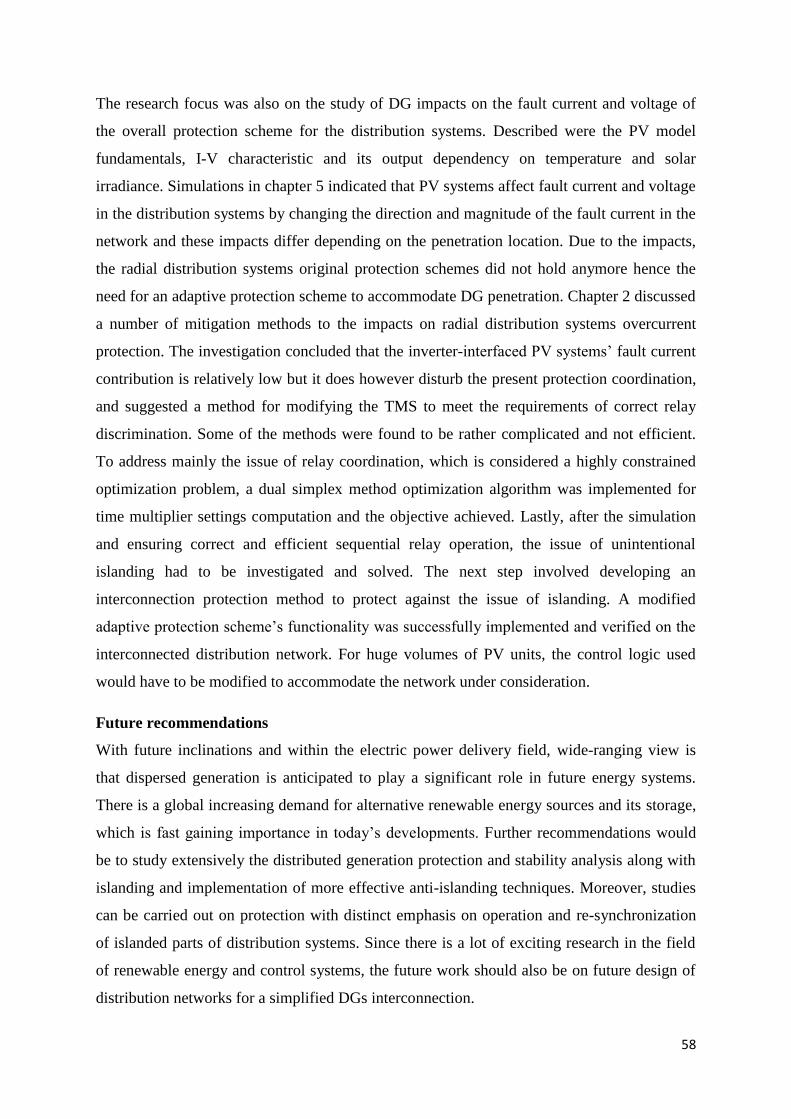
58
The research focus was also on the study of DG impacts on the fault current and voltage of
the overall protection scheme for the distribution systems. Described were the PV model
fundamentals, I-V characteristic and its output dependency on temperature and solar
irradiance. Simulations in chapter 5 indicated that PV systems affect fault current and voltage
in the distribution systems by changing the direction and magnitude of the fault current in the
network and these impacts differ depending on the penetration location. Due to the impacts,
the radial distribution systems original protection schemes did not hold anymore hence the
need for an adaptive protection scheme to accommodate DG penetration. Chapter 2 discussed
a number of mitigation methods to the impacts on radial distribution systems overcurrent
protection. The investigation concluded that the inverter-interfaced PV systems’ fault current
contribution is relatively low but it does however disturb the present protection coordination,
and suggested a method for modifying the TMS to meet the requirements of correct relay
discrimination. Some of the methods were found to be rather complicated and not efficient.
To address mainly the issue of relay coordination, which is considered a highly constrained
optimization problem, a dual simplex method optimization algorithm was implemented for
time multiplier settings computation and the objective achieved. Lastly, after the simulation
and ensuring correct and efficient sequential relay operation, the issue of unintentional
islanding had to be investigated and solved. The next step involved developing an
interconnection protection method to protect against the issue of islanding. A modified
adaptive protection scheme’s functionality was successfully implemented and verified on the
interconnected distribution network. For huge volumes of PV units, the control logic used
would have to be modified to accommodate the network under consideration.
Future recommendations
With future inclinations and within the electric power delivery field, wide-ranging view is
that dispersed generation is anticipated to play a significant role in future energy systems.
There is a global increasing demand for alternative renewable energy sources and its storage,
which is fast gaining importance in today’s developments. Further recommendations would
be to study extensively the distributed generation protection and stability analysis along with
islanding and implementation of more effective anti-islanding techniques. Moreover, studies
can be carried out on protection with distinct emphasis on operation and re-synchronization
of islanded parts of distribution systems. Since there is a lot of exciting research in the field
of renewable energy and control systems, the future work should also be on future design of
distribution networks for a simplified DGs interconnection.

59
References
[1] A. Evans and V. Strezov, “A Sustainability Assessment of Electricity Generation,” in 2010
International Conference on Biosciences, Mexico, 2010.
[2] Z. Li, “Natural gas for generation: a solution or a problem?,” IEEE Power and Energy Magazine,
vol. 3, no. 4, pp. 16 - 21, 2005.
[3] N. K. Choudhary, . R. S. Mohanty and . K. R. Singh, “Protection Coordination of Over Current
Relays in distribution system with DG and superconducting fault current limiter,” in 2014
Eighteenth National Power Systems Conference, Guwahati, 2014.
[4] J. Franco, . L. Ochoa and . R. Romero, “AC OPF for Smart Distribution Networks: An Efficient
and Robust Quadratic Approach,” IEEE Transactions on Smart Grid, no. 99, pp. 1-1, 2017.
[5] D. Chengdi, L. Peng, W. Chengshan, W. Zhiying, Y. Dawei, Z. Jin and L. Zheng, “A design and
implementation of FPGA-based real-time simulator for distribution system with DG integration,”
in 2016 China International Conference on Electricity Distribution (CICED), Xi'an, 2016.
[6] M. Monadi, A. M. Zamanic, J. Ignacio , C. Alvaro and L. Pedro, “Protection of AC and DC
distribution systems Embedding distributed energy resources: A comparative review and
analysis,” Renewable and Sustainable Energy Reviews, vol. 51, pp. 1578-1593, 2015.
[7] F. Coffele, C. Booth and A. Dyśko, “An Adaptive Overcurrent Protection Scheme for
Distribution Networks,” IEEE Transactions On Power Delivery, vol. 30, no. 2, pp. 561-568,
2015.
[8] Rakesh Sinha and A. Zaidi, “Protection of Distribution Systems with Significant Penetration of
Distributed Generation,” in Power Generation System and Renewable Energy Technologies,
Karachi, 2015.
[9] G. Electric, “Distribution System Feeder Overcurrent Protection,” GE Power Management,
Canada.
[10] F. B. Costa, A. Monti and S. C. Paiva, “Overcurrent Protection in Distribution Systems with
Distributed Generation based on the Real-Time Boundary Wavelet Transform,” IEEE
Transactions on Power delivery, vol. 32, no. 1, pp. 462-473, 2017.
[11] J. M. Gers and E. J. Holmes, Protection of electricity distribution networks, London: The
Institution of Electrical Engineers, 1998.
[12] S. Behzadirafi and H. Salehfar, “Preventive Maintenance Scheduling Based on Short Circuit and
Overload Currents,” IEEE Transactions on Smart Grids, vol. 6, no. 4, pp. 1740-1747, 2015.
[13] M. Lantz, “Fault-Resistance Effect on Ground Fault Current,” AIEE Transactions, vol. 72, 1953.
[14] S. H. Horowitz and A. G. Phadke, Power System Relaying, England: Research Studies Press
LTD., 1995.
[15] B. Ram and N. D. Vishwakarma, Power System Protection and Switchgear, New Delhi: McGraw
Hill Education Private Limited, 2011.
60
[16] L. J. Blackburn, Protective Relaying Principles and Applications, New York: Marcel Dekker Inc,
1998.
[17] IEEE, “Reducing Outages Through Improved Protection, Monitoring, Diagnostics, and
Autorestoration in Transmission Substations—(69 kV and Above),” IEEE Transactions On
Power Delivery, vol. 31, no. 3, pp. 1327-1334, 2016.
[18] B. Ravindranath and M. Chander, Power system protection and switchgear, New Delhi: New
Age International Publishers, 1995.
[19] T. Guillod, F. Krismer and J. W. Kolar, “Protection of MV Converters in the Grid: The Case of
MV/LV Solid-State Transformers,” IEEE Journal of Emerging and Selected Topics in Power
Electronics, vol. 5, no. 1, pp. 393 - 408, 2017.
[20] Y. G. Paithankar and . S. R. Bhide, Fundamentals of Power System Protection, India: PHI
Learning, 2011.
[21] A. Onal, “Relay coordination in the protection of radially connected power system network,”
Nigerian Journal of Technology , vol. 31, pp. 58-62, 2012.
[22] A. F. Sleva, Protective Relay Principles, Boca Raton: Taylor & Francis Group, 2009.
[23] B. Ram and P. N. Vishwakarma, Power System Protection and Switchgear, India: McGraw-Hill
Education Private Limited, 2011.
[24] B. Feizifar and O. Usta, “Condition monitoring of circuit breakers: Current status and future
trends,” in 2017 IEEE International Conference on Environment and Electrical Engineering and
2017 IEEE Industrial and Commercial Power Systems Europe, Milan, 2017.
[25] J. McCalley, O. Oluwaseyi, V. Krishnan and R. Dai , “System Protection Schemes: Limitations,
Risks, and Management,” Power Systems Engineering Research Center, Texas, 2010.
[26] L. Sevov, U. Khan and Z. Zhang, “Enhancing power transformer differential protection to
improve security and dependability,” IEEE Transactions on Industry Applications, vol. 53, no. 3,
pp. 2642 - 2649, 2017.
[27] Y. Yin, Z. Zhang and Y. Fu, “A bus differential protection scheme using real-time synchrophasor
data,” in 2017 IEEE 30th Canadian Conference on Electrical and Computer Engineering
(CCECE), Windsor, 2017.
[28] C. Edward, O. I. Okoro and T. M. Khan, Concise Higher Electrical Engineering, Cape Town:
Juta and Company Ltd, 2008.
[29] Areva, Network Protection and Automation Guide, Barcelona: Cayfosa, 2005.
[30] C. So, K. Li, K. Lai and K. Fung, “Application of genetic algorithm for overcurrent relay
coordination,” in Sixth International Conference on Developments in Power System Protection,
Nottingham, 1997.
[31] A. Sinclair, D. Finney, D. Martin and P. Sharma, “Distance Protection in Distribution Systems:
How It Assists With Integrating Distributed Resources,” IEEE TRANSACTIONS ON INDUSTRY
APPLICATIONS, vol. 50, no. 3, pp. 2186-2196, 2014.
61
[32] P. Mahat, Z. Chen, B. Bak-Jensen and C. . L. Bak, “A Simple Adaptive Overcurrent Protection
of Distribution Systems With Distributed Generation,” IEEE Transaction on Smart Grid, vol. 2,
no. 3, pp. 428-437, 2011.
[33] N. Gaur and P. Gaur, “Automation in Power Distribution Systems,” Journal of Engineering
Research and Studies, vol. 3, no. 2, pp. 82-84, 2012.
[34] V. Prasad, . P. Rao and . S. Rao, “Coordination of directional relays without generating all
circuits,” IEEE Transactions on Power Delivery, vol. 6, no. 2, pp. 584 - 590, 1991.
[35] D. A. Ko, G. Burt, S. Galloway, C. Booth and J. Mcdonald, “UK distribution system protection
issues,” IET Generation, Transmission & Distribution, vol. 1, no. 4, pp. 679 - 687, 2007.
[36] D. Jones, Analysis and Protection of Electrical Power Systems, Great Britain: Pitman, 1996.
[37] A.-M. Borbely and J. F. Kreider, Distributed Generation: The Power Paradigm for the New
Millennium, Boca Raton: CRC Press, 2001.
[38] A. K. Singh and S. K. Parida, “Need of distributed generation for sustainable development in
coming future,” in 2012 IEEE International Conference on Power Electronics, Drives and
Energy Systems, Bengaluru, 2012.
[39] P. M. Sotkiewicz and I. J. M. Vignolo, “Nodal pricing for distribution networks: efficient pricing
for efficiency enhancing DG,” IEEE Transactions on Power Systems, vol. 21, no. 2, pp. 1013 -
1014, 2006.
[40] T. Wang, D. O’Neill and H. Kamath, “Dynamic Control and Optimization of Distributed Energy
Resources in a Microgrid,” IEEE Transactions on Smart Grid, vol. 6, no. 6, pp. 2884 - 2894,
2015.
[41] H. Jiayi, J. Chuanwen and X. Rong, “A review on distributed energy resources and MicroGrid,”
Renewable and Sustainable Energy Reviews, vol. 12, no. 9, pp. 2472-2483, 2008.
[42] T. Bradford, Solar revolution: the economic transformation of the global energy industry,
Cambridge: MIT Press, 2006.
[43] C. A. Langston and G. K. C. Ding, Sustainable Practices in the Built Environment, Oxford:
Routledge, 2008.
[44] F. L. Luo and H. Ye, Renewable Energy Systems: advanced conversion technologies and
applications, Boca Raton: CRC Press, 2013.
[45] S. Kouro, J. I. Leon, D. Vinnikov and L. G. Franquelo, “Grid-Connected Photovoltaic Systems:
An Overview of Recent Research and Emerging PV Converter Technology,” IEEE Industrial
Electronics Magazine, vol. 9, no. 1, pp. 47 - 61, 2015.
[46] L. Stoyanov and N. Cholakova, “Simulation of the shading in photovoltaic systems,” in 2017
15th International Conference on Electrical Machines, Drives and Power Systems, Bulgaria,
2017.
[47] R.-J. Wai and W.-H. Wang, “Grid-Connected Photovoltaic Generation System,” IEEE
Transactions on Circuits and Systems, vol. 55, no. 3, pp. 953-964, 2008.

62
[48] I. H. Altas and A. Sharaf, “A Photovoltaic Array Simulation Model for Matlab-Simulink GUI
Environment,” in 2007 International Conference on Clean Electrical Power, Capri, 2007.
[49] J. Sreedevi, N. Ashwin and N. Raju, “A Study on Grid Connected PV system,” in 2016 National
Power Systems Conference (NPSC), Bhubaneswar, 2016.
[50] P. T. Manditereza and R. Bansal, “Renewable distributed generation : The hidden challenges – A
review from the protection perspective,” Renewable and Sustainable Energy Reviews, vol. 58, p.
1457–1465, 2016.
[51] S. Conti, “Analysis of distribution network protection issues in presence of dispersed
generation,” Electric Power Systems Research, vol. 79, no. 1, pp. 49-56, 2009.
[52] H. A.Abdel-Ghany, M. Ahmed , N. I. Elkalashy and E. M. Rashad, “Optimizing DG penetration
in distribution networks concerning protection schemes and technical impact,” Electric Power
Systems Research, vol. 128, pp. 113-122, 2015.
[53] D. M. Laverty, . R. J. Best and D. J. Morrow , “Loss-of-mains protection system by application
of phasor measurement unit technology with experimentally assessed threshold settings,” IET
Generation, Transmission & Distribution, vol. 9, no. 2, pp. 146-153, 2015.
[54] H. Zayandehroodi, . A. Mohamed, H. Shareef and M. Mohammadjafari, “Impact of distributed
generations on power system,” International Journal of the Physical Sciences, vol. 6, no. 16, pp.
3999-4007, 2011.
[55] T. M. Masaud and R. D. Mistry, “Fault current contribution of Renewable Distributed
Generation: An overview and key issues,” in 2016 IEEE Conference on Technologies for
Sustainability, Phoenix, 2016.
[56] N. K. Roy and H. R. Pota, “Current Status and Issues of Concern for the Integration of
Distributed Generation Into Electricity Networks,” IEEE Systems Journal, vol. 9, no. 3, pp. 933 -
944, 2015.
[57] Y. Pan, I. Voloh and W. Ren, “Protection issues and solutions for protecting feeder with
distributed generation,” in 2013 66th Annual Conference for Protective Relay Engineers, College
Station, 2013.
[58] H. Teng, C. Liu, M. Han, S. Ma and X. Guo, “IEEE9 Buses System Simulation and Modeling in
PSCAD,” in 2010 Asia-Pacific Power and Energy Engineering Conference, Chengdu, 2010.
[59] K. G. Ravikumar, N. N. Schulz and A. K. Srivastava, “Distributed simulation of power systems
using real-time digital simulator,” in 2009 IEEE/PES Power Systems Conference and Exposition,
Seattle, 2009.
[60] M. D. O. Faruque, T. Strasser, G. Lauss, V. Jalili-Marandi, P. Forsyth, C. Dufour, V. Dinavahi,
A. Monti, P. Kotsampopoulos, J. A. Martinez, K. Strunz, M. Saeedifard, X. Wang, D. Shearer
and M. Paolone, “Real-Time Simulation Technologies for Power Systems Design, Testing, and
Analysis,” IEEE Power and Energy Technology Systems Journal, vol. 2, no. 2, pp. 63 - 73, 2015.
[61] U. Rudež, P. Osredkar and R. Mihalič, “Overcurrent protection-relay testing with Real-Time
Digital Simulator Hardware,” in Elektrotehniski Vestnik, Slovenia, 2012.
[62] D. Rayworth and M. A. Rahim, “Configuration and Setting of Protection Relays or Numeric

63
Relays,” in The IEE Seminar on Advances in Power Protection: Learning the Lessons from
Major Disturbances, London, 2006.
[63] T. T. Trung, S.-J. Ahn and J.-H. Choi, “Real Time Simulation of Distribution System with
Distributed Energy Resources,” Journal of Clean Energy Technologies , vol. 3, no. 1, pp. 57-61,
2015.
[64] M. G. Villalva, J. R. l Gazoli and E. R. Filho, “Comprehensive Approach to Modeling and
Simulation of Photovoltaic Arrays,” IEEE Transactions on Power Electronics, vol. 24, no. 5, pp.
1198 - 1208, 2009.
[65] P. P. Bedekar, S. R. Bhide and V. S. Kale, “Optimum Coordination of Overcurrent Relays in
Distribution System Using Dual Simplex Method,” in International Conference on Emerging
Trends in Engineering & Technology, Nagpur, 2009.
[66] A. Gupta, . G. O. Swathika and S. Hemamalini, “Optimum Coordination of Overcurrent Relays
in Distribution Systems Using Big-M and Dual Simplex Methods,” in International Conference
on Computational Intelligence and Communication Networks, Jabalpur, 2015.
[67] S. Chowdhury, S. Chowdhury, C. F. Ten and P. Crossley, “Islanding protection of distribution
systems with distributed generators — A comprehensive survey report,” in 2008 IEEE Power
and Energy Society General Meeting - Conversion and Delivery of Electrical Energy in the 21st
Century, Pittsburgh, 2008.
[68] X. Ding and P. A. Crossley, “Islanding detection for distributed generation,” Journal of
Electrical Engineering and Technology, vol. 2, no. 1, pp. 19-28, 2007.
[69] A. J. Onal, “Relay Coordination in The Protection Of Radially-Connected Power System,”
Nigerian Journal of Technology, vol. 31, no. 1, pp. 58-62, 2012.
[70] A. Kamal, S. Sankar and R. Soundarapandian, “Optimal Over Current Relay Coordination of a
Real Time Distribution System with Embedded Renewable Generation,” Indian Journal of
Science and Technology, vol. 7, no. 7, pp. 149-155, 2014.
[71] P. G. McLaren, R. Kuffei, R. Wierck, J. Giesbrecht and L. Arendt , “A Real Time Digital
Simulator For Testing Relays,” Transactions on Power Delivery, vol. 7, no. 1, pp. 207-213,
1992.
[72] J. Ahmad, “A fractional open circuit voltage based maximum power point tracker for
photovoltaic arrays,” in International Conference on Software Technology and Engineering, San
Juan, 2010.
[73] G. G. Pinheiro, J. M. d. C. Filho and . D. B. Bonatto, “Modeling, simulation and comparison
analysis of an installed photovoltaic system using RTDS,” in IEEE International Conference on
Industry Applications, Brazil, 2016.
[74] H. Mortazavi, H. Mehrjerdi, M. Saad and D. Asber, “A Monitoring Technique for Reversed
Power Flow Detection With High PV Penetration Level,” IEEE Transactions on Smart Grid, vol.
6, no. 5, pp. 2221 - 2232, 2015.
[75] J. Sreedevi, N. Ashwin and N. M. i Raju, “A study on grid connected PV system,” in 2016
National Power Systems Conference, Bhubaneswar, 2016.
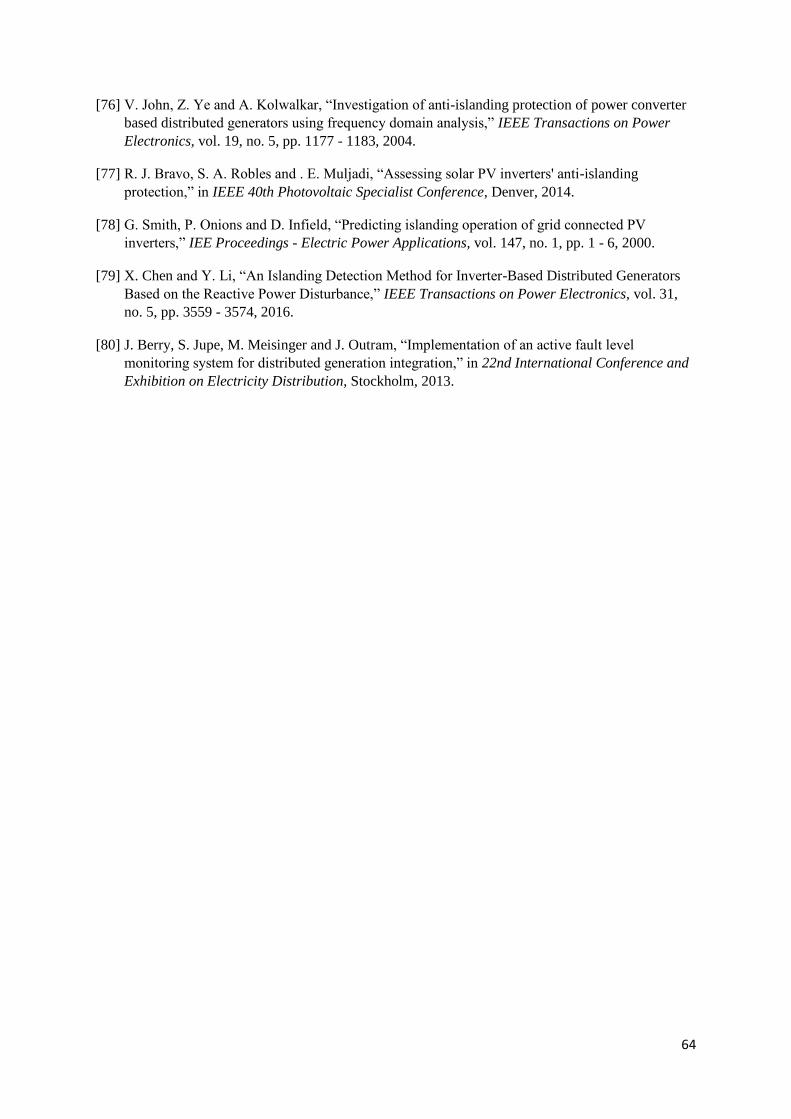
64
[76] V. John, Z. Ye and A. Kolwalkar, “Investigation of anti-islanding protection of power converter
based distributed generators using frequency domain analysis,” IEEE Transactions on Power
Electronics, vol. 19, no. 5, pp. 1177 - 1183, 2004.
[77] R. J. Bravo, S. A. Robles and . E. Muljadi, “Assessing solar PV inverters' anti-islanding
protection,” in IEEE 40th Photovoltaic Specialist Conference, Denver, 2014.
[78] G. Smith, P. Onions and D. Infield, “Predicting islanding operation of grid connected PV
inverters,” IEE Proceedings - Electric Power Applications, vol. 147, no. 1, pp. 1 - 6, 2000.
[79] X. Chen and Y. Li, “An Islanding Detection Method for Inverter-Based Distributed Generators
Based on the Reactive Power Disturbance,” IEEE Transactions on Power Electronics, vol. 31,
no. 5, pp. 3559 - 3574, 2016.
[80] J. Berry, S. Jupe, M. Meisinger and J. Outram, “Implementation of an active fault level
monitoring system for distributed generation integration,” in 22nd International Conference and
Exhibition on Electricity Distribution, Stockholm, 2013.

65
Appendix
A. Distribution system:
A RSCAD model of the distribution system network:
Figure 42: Distribution System Model on RSCAD environment
Dialing outputs that allow activation of fault using a push button, selection and alteration between the
different combinations of line to ground faults via a dial switch.
Table 7: Dial output and corresponding fault
DIAL OUTPUT BINARY OUTPUT FAULT APPLIED
1 001 A-G
2 010 B-G
3 011 AB-G
4 100 C-G
5 101 AC-G
6 110 BC-G
7 111 ABC-G
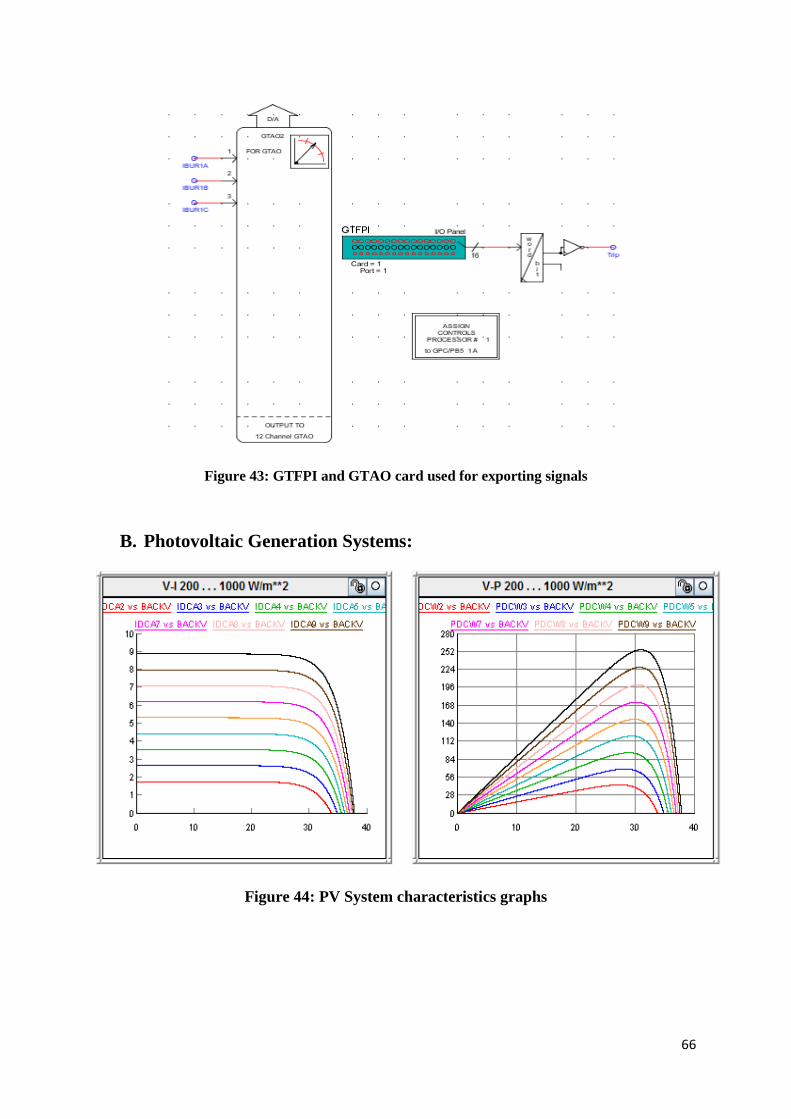
66
Figure 43: GTFPI and GTAO card used for exporting signals
B. Photovoltaic Generation Systems:
Figure 44: PV System characteristics graphs

67
A PV system MPPT controller:
Figure 45: Maximum Power Point Tracking control circuit
Figure 46: 2-level DC/AC inverter and filter
Figure 47: Triangle wave data generator for the DC/AC inverter
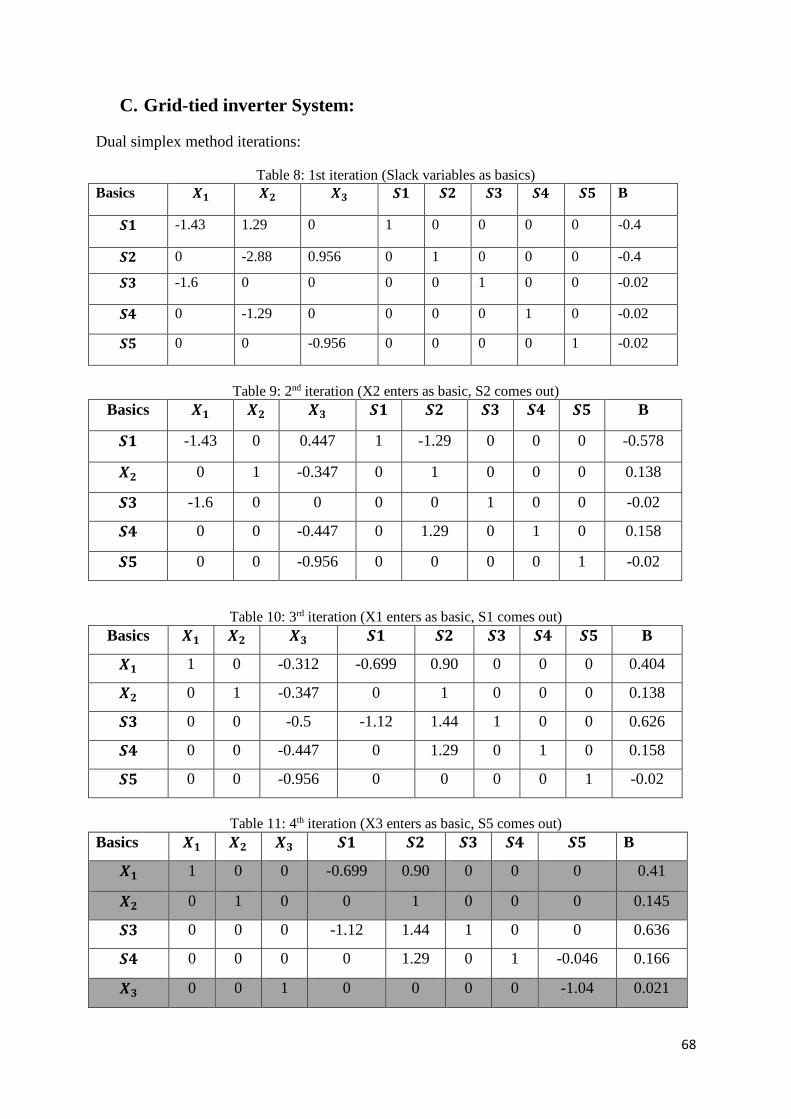
68
C. Grid-tied inverter System:
Dual simplex method iterations:
Table 8: 1st iteration (Slack variables as basics)
Basics 𝑿𝟏 𝑿𝟐 𝑿𝟑 𝑺𝟏 𝑺𝟐 𝑺𝟑 𝑺𝟒 𝑺𝟓 B
𝑺𝟏 -1.43 1.29 0 1 0 0 0 0 -0.4
𝑺𝟐 0 -2.88 0.956 0 1 0 0 0 -0.4
𝑺𝟑 -1.6 0 0 0 0 1 0 0 -0.02
𝑺𝟒 0 -1.29 0 0 0 0 1 0 -0.02
𝑺𝟓 0 0 -0.956 0 0 0 0 1 -0.02
Table 9: 2nd iteration (X2 enters as basic, S2 comes out)
Basics 𝑿𝟏 𝑿𝟐 𝑿𝟑 𝑺𝟏 𝑺𝟐 𝑺𝟑 𝑺𝟒 𝑺𝟓 B
𝑺𝟏 -1.43 0 0.447 1 -1.29 0 0 0 -0.578
𝑿𝟐 0 1 -0.347 0 1 0 0 0 0.138
𝑺𝟑 -1.6 0 0 0 0 1 0 0 -0.02
𝑺𝟒 0 0 -0.447 0 1.29 0 1 0 0.158
𝑺𝟓 0 0 -0.956 0 0 0 0 1 -0.02
Table 10: 3rd iteration (X1 enters as basic, S1 comes out)
Basics 𝑿𝟏 𝑿𝟐 𝑿𝟑 𝑺𝟏 𝑺𝟐 𝑺𝟑 𝑺𝟒 𝑺𝟓 B
𝑿𝟏 1 0 -0.312 -0.699 0.90 0 0 0 0.404
𝑿𝟐 0 1 -0.347 0 1 0 0 0 0.138
𝑺𝟑 0 0 -0.5 -1.12 1.44 1 0 0 0.626
𝑺𝟒 0 0 -0.447 0 1.29 0 1 0 0.158
𝑺𝟓 0 0 -0.956 0 0 0 0 1 -0.02
Table 11: 4th iteration (X3 enters as basic, S5 comes out)
Basics 𝑿𝟏 𝑿𝟐 𝑿𝟑 𝑺𝟏 𝑺𝟐 𝑺𝟑 𝑺𝟒 𝑺𝟓 B
𝑿𝟏 1 0 0 -0.699 0.90 0 0 0 0.41
𝑿𝟐 0 1 0 0 1 0 0 0 0.145
𝑺𝟑 0 0 0 -1.12 1.44 1 0 0 0.636
𝑺𝟒 0 0 0 0 1.29 0 1 -0.046 0.166
𝑿𝟑 0 0 1 0 0 0 0 -1.04 0.021

69