real-time downhole weight on bit (dwob) …...downhole torque on bit, axial compression/tension on...
TRANSCRIPT
1 Copyright © 2015 by ASME
Proceedings of the ASME 2015 34th International Conference on Ocean, Offshore and Arctic Engineering
OMAE2015
May 31-June 5, 2015, St. John's, Newfoundland, Canada
41425
REAL-TIME DOWNHOLE WEIGHT ON BIT (DWOB) AUTOMATION IN DIRECTIONAL
DRILLING
Andrew Wu Rocsol Technologies Inc.
Calgary, AB, Canada
Geir Hareland Oklahoma State University
Stillwater, OK, USA
ABSTRACT This paper introduces the functionality of a new type of
Autodriller software system, which can acquire downhole
weight on bit (DWOB) based on surface rig measurement. Field
tests are performed, including DWOB measured by downhole
measuring tools and the hookload below the top drive using a
TTS (Torque and Tension Sub). Three sets of drilling data from
three horizontal wells in Western Canada were utilized to verify
the models of this new Autodriller system. DWOB comparisons
between the model and the measuring tools were carried out.
The comparisons indicate a good agreement between the
downhole measured DWOB and the new Autodriller predicted
values. The difference between the new Autodriller prediction
and downhole measured DWOB can be quantified using rooted
mean square error (RMSE) or relative error (RE). This paper
also analyzes the differences in some sections, and some
measures are suggested to potentially reduce these differences.
The new Autodriller is a closed loop control system which can
automatically in real-time adjust surface weight on bit (SWOB)
so that the DWOB is accurate, which will directly improve the
performance of drill bits, and decrease the cost of drilling,
especially in directional well drilling applications.
INTRODUCTION Oil and gas reservoirs have become increasingly difficult to
explore and produce, therefore operators are seeking methods to
access these reservoirs and to produce them in the most cost-
effective way. One of the methods is to use automatic drilling
tools such as an Autodriller. The Autodriller system is usually
an automatic self-adjusting weight on bit tool based on SWOB
or motor differential pressure. It has been used since the early
1970s. The development of the modern Autodriller has been
supported with the rise of more sophisticated mechanical
braking and electronic control systems [1]. Designed to reduce
costs by saving drilling hours and extending the life of drill bits,
the Pason’s AutoDriller maintains a specified weight on bit
(WOB) to maximize the rate of penetration (ROP) while
drilling. Like a regular Autodriller, the principle of
this Autodriller is to actuate the drilling rig’s drawworks brake
handle using continuous feedback from hookload, drilling fluid
pressure, drawworks drum rotation, and a target ring depth
sensor [2]. Another Autodriller automatically maintains deadline
tension, enabling a constant penetration rate for fast and
efficient drilling. This durable driller reduces drilling costs,
increases bit life, and helps ensure an accurate drilling path [3].
The NOV’s electronic drilling system delivers performance,
including improved bit wear, improved safety, enhanced rig
efficiency, and a higher quality wellbore. The design of the
system provides the precise control and performance needed in
conventional and unconventional drilling operations— the high
count stepper motor and improved control algorithms improve
the drilling control and results. This system offers more
information at a glance through an easier setup, and operation
via the driller’s screen, allowing to maximize the potential of
the Autodriller [4]. The Rigserv developed an advanced and
comprehensive integrated automatic drilling and travelling
block safety system. It utilizes state-of-the-art PLC and
touchscreen control technology with comprehensive software
designed to optimize drilling control and drilling safety,
complete with reliable sensors and control interfaces. Normal
steady drilling functions carried out by the driller can be
performed by the system with far more precision, consistency,
and safety, due to the fact that all related drilling variables are
integrated and interacting simultaneously [5]. However, these
Autodrillers, which are called the regular Autodrillers, are still
conservative where an excessive potential safety margin is
applied to prevent damage to the drill bits and as a result in
some cases the optimal performance of the drill bits cannot be
achieved. New mathematic models and software in real-time
2 Copyright © 2015 by ASME
drilling have played a very important role in the development of
a new Autodriller system. This new type of Autodriller is used
in real-time to get accurate downhole weight on bit, and can
shorten or remove the potential difference margin and realize a
better performance optimization of drill bits [6, 7].
AUTODRILLER MODEL The authors of this paper have been seeking better ways of
improving drilling operations and decreasing costs by the use of
advanced real-time modeling and simulation technologies. It is
well known that the performance of a drill bit directly affects
the overall drilling performance. The bit performance is often
evaluated by the rate of penetration which is dependent on the
weight on bit [8]. Therefore, obtaining actual DWOB is crucial
in achieving good performance of a drill bit. The torque and
drag (T&D) model referred to herein is based on other
researchers’ models [9, 10] and is introduced as follows.
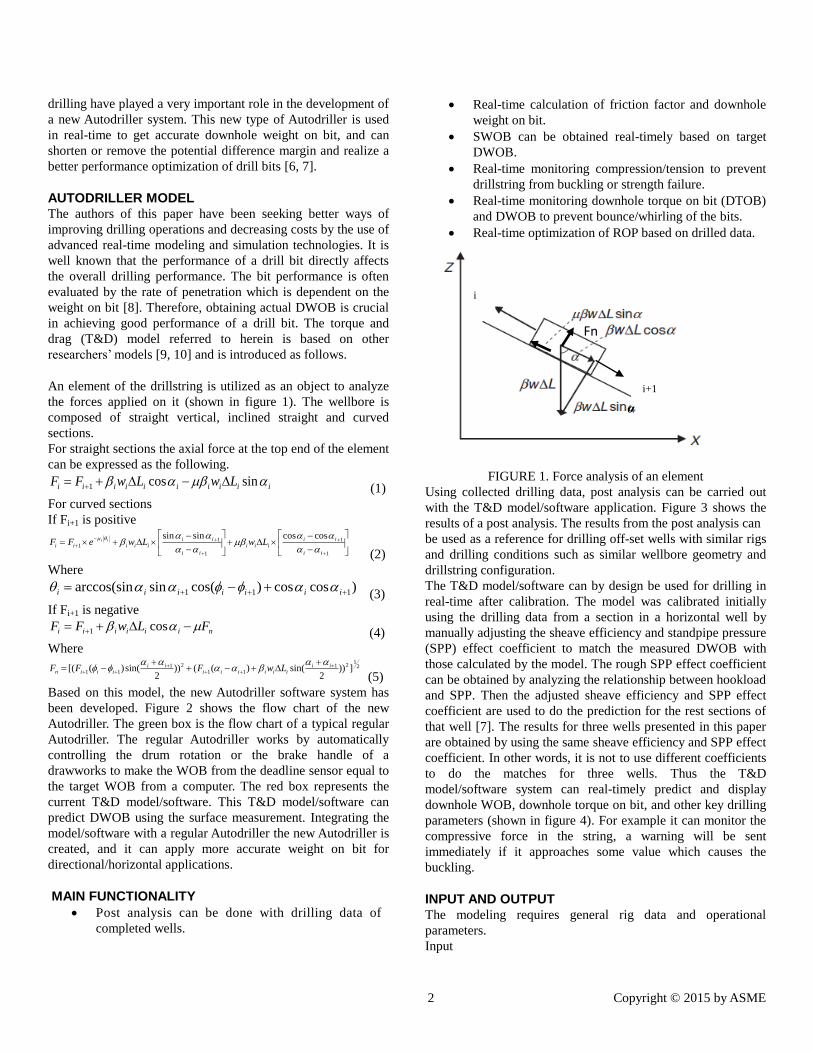
An element of the drillstring is utilized as an object to analyze
the forces applied on it (shown in figure 1). The wellbore is
composed of straight vertical, inclined straight and curved
sections.
For straight sections the axial force at the top end of the element
can be expressed as the following.
iiiiiiiiii LwLwFF sincos1 (1)
For curved sections
If Fi+1 is positive
1
1
1
11
coscossinsin
ii
ii
iii
ii
ii
iiiii LwLweFF ii
(2)
Where
)coscos)cos(sinarccos(sin 111 iiiiiii (3)
If Fi+1 is negative
niiiiii FLwFF cos1 (4)
Where
21
2111
2111 ]))
2sin()(())
2sin()([(
ii
iiiiiiii
iiin LwFFF
(5)
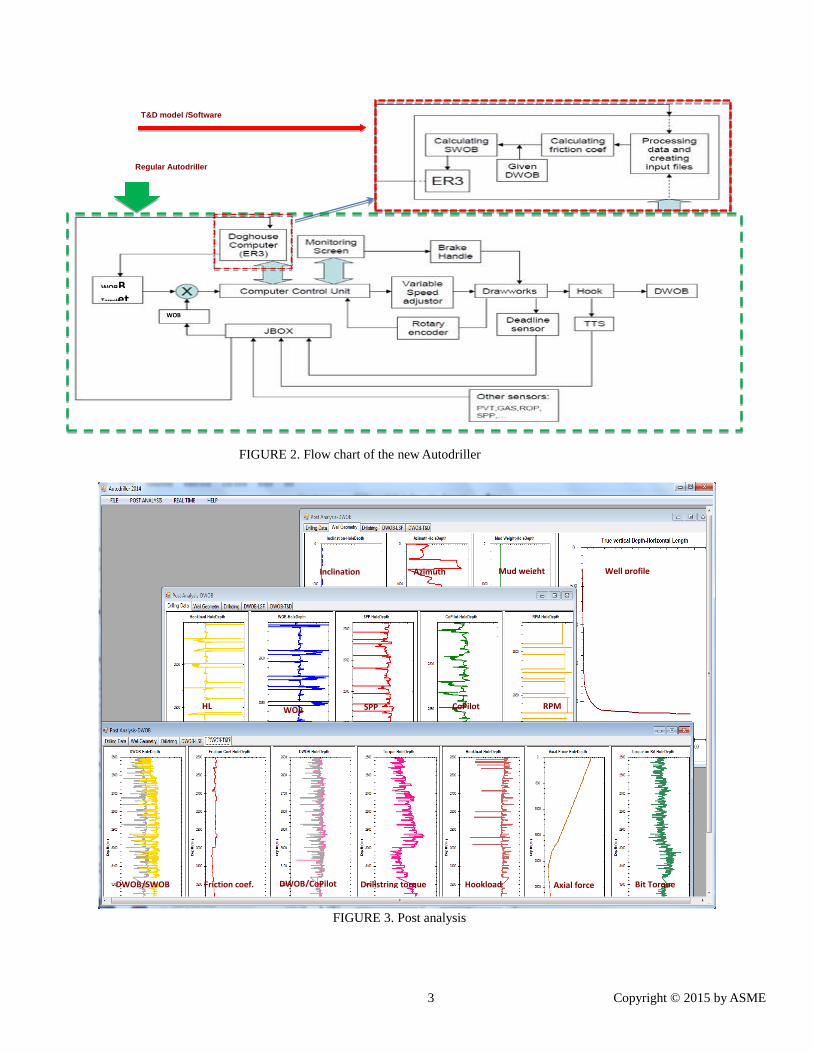
Based on this model, the new Autodriller software system has
been developed. Figure 2 shows the flow chart of the new
Autodriller. The green box is the flow chart of a typical regular
Autodriller. The regular Autodriller works by automatically
controlling the drum rotation or the brake handle of a
drawworks to make the WOB from the deadline sensor equal to
the target WOB from a computer. The red box represents the
current T&D model/software. This T&D model/software can
predict DWOB using the surface measurement. Integrating the
model/software with a regular Autodriller the new Autodriller is
created, and it can apply more accurate weight on bit for
directional/horizontal applications.
MAIN FUNCTIONALITY
Post analysis can be done with drilling data of
completed wells.
Real-time calculation of friction factor and downhole
weight on bit.
SWOB can be obtained real-timely based on target
DWOB.
Real-time monitoring compression/tension to prevent
drillstring from buckling or strength failure.
Real-time monitoring downhole torque on bit (DTOB)
and DWOB to prevent bounce/whirling of the bits.
Real-time optimization of ROP based on drilled data.
FIGURE 1. Force analysis of an element
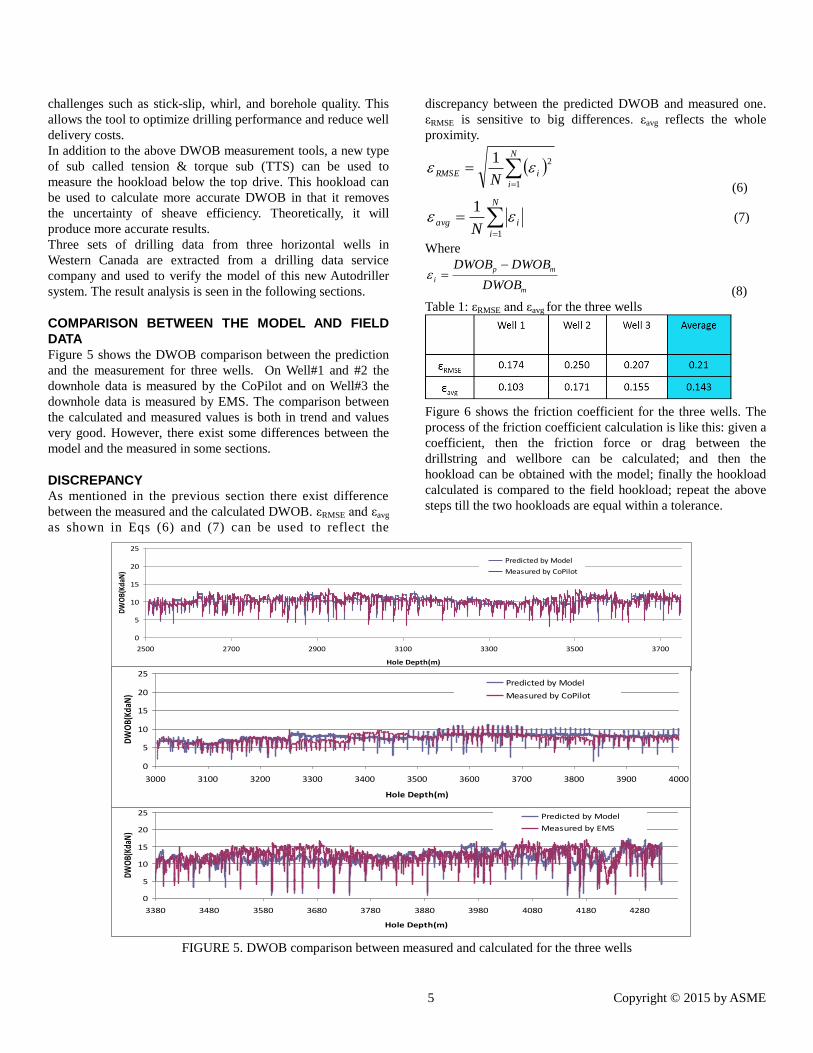
Using collected drilling data, post analysis can be carried out
with the T&D model/software application. Figure 3 shows the
results of a post analysis. The results from the post analysis can
be used as a reference for drilling off-set wells with similar rigs
and drilling conditions such as similar wellbore geometry and
drillstring configuration.
The T&D model/software can by design be used for drilling in
real-time after calibration. The model was calibrated initially
using the drilling data from a section in a horizontal well by
manually adjusting the sheave efficiency and standpipe pressure
(SPP) effect coefficient to match the measured DWOB with
those calculated by the model. The rough SPP effect coefficient
can be obtained by analyzing the relationship between hookload
and SPP. Then the adjusted sheave efficiency and SPP effect
coefficient are used to do the prediction for the rest sections of
that well [7]. The results for three wells presented in this paper
are obtained by using the same sheave efficiency and SPP effect
coefficient. In other words, it is not to use different coefficients
to do the matches for three wells. Thus the T&D
model/software system can real-timely predict and display
downhole WOB, downhole torque on bit, and other key drilling
parameters (shown in figure 4). For example it can monitor the
compressive force in the string, a warning will be sent
immediately if it approaches some value which causes the
buckling.
INPUT AND OUTPUT The modeling requires general rig data and operational
parameters.
Input
Fi
Fi+1
Fn
i+1
i
α
3 Copyright © 2015 by ASME
FIGURE 2. Flow chart of the new Autodriller
FIGURE 3. Post analysis
Regular Autodriller
T&D model /Software
Targetet WOBB
WOB
Axial force Bit Torque Hookload Drillstring torque Friction coef. DWOB/CoPilot DWOB/SWOB
Azimuth
RPM SPP WOB HL CoPilot
Inclination Mud weight Well profile

4 Copyright © 2015 by ASME
FIGURE 4. Real-time monitoring of drilling operation
Off-bottom data after every connection: Bit depth, hole
depth, WOB, RPM, hookload, SPP, differential
pressure, and etc.
Survey data : Measured depth, azimuth, inclination and
TVD
Drill string configuration : Drill string components
such as, section lengths, inner and outer diameters, unit
weights
Additional parameters: Single sheave efficiency,
weight of traveling block, number of lines between
blocks etc.
Output
Friction coefficient at each connection
Effective surface weight on bit
Downhole torque on bit, axial compression/tension on
drillstring, and etc.
DWOB MESUREMENT IN THE FIELD In order to verify the model of the new Autodriller, downhole
measurement data, especially downhole weight on bit and
downhole torque on bit, is required. It is noted that this kind of
downhole measurement is costly. That is why the T&D
model/software system was developed in this paper. For
measurement of DWOB and DTOB, strain gauges are utilized
to measure strain at the locations of the drill string just above
the drill bit. Two downhole measurement tools for measuring
DWOB and DTOB were used, and one surface measurement
sub for measuring hookload was used below the top drive.
CoPilot Tool
The CoPilot downhole tool represents the industry’s most
advanced and versatile downhole drilling dynamics data
acquisition and processing system. It can measure more than 15
parameters down hole at the same time.
EMS Tool
Through application of extensive measurements knowledge and
experience, the EMS delivers custom solutions to drilling
5 Copyright © 2015 by ASME
challenges such as stick-slip, whirl, and borehole quality. This
allows the tool to optimize drilling performance and reduce well
delivery costs.
In addition to the above DWOB measurement tools, a new type
of sub called tension & torque sub (TTS) can be used to
measure the hookload below the top drive. This hookload can
be used to calculate more accurate DWOB in that it removes
the uncertainty of sheave efficiency. Theoretically, it will
produce more accurate results.
Three sets of drilling data from three horizontal wells in
Western Canada are extracted from a drilling data service
company and used to verify the model of this new Autodriller
system. The result analysis is seen in the following sections.
COMPARISON BETWEEN THE MODEL AND FIELD
DATA Figure 5 shows the DWOB comparison between the prediction
and the measurement for three wells. On Well#1 and #2 the
downhole data is measured by the CoPilot and on Well#3 the
downhole data is measured by EMS. The comparison between
the calculated and measured values is both in trend and values
very good. However, there exist some differences between the
model and the measured in some sections.
DISCREPANCY As mentioned in the previous section there exist difference
between the measured and the calculated DWOB. εRMSE and εavg
as shown in Eqs (6) and (7) can be used to reflect the
discrepancy between the predicted DWOB and measured one.
εRMSE is sensitive to big differences. εavg reflects the whole
proximity.
N
i
iRMSEN 1
21
(6)
N
i
iavgN 1
1 (7)
Where
m
mp
iDWOB
DWOBDWOB
(8)
Table 1: εRMSE and εavg for the three wells
Figure 6 shows the friction coefficient for the three wells. The
process of the friction coefficient calculation is like this: given a
coefficient, then the friction force or drag between the
drillstring and wellbore can be calculated; and then the
hookload can be obtained with the model; finally the hookload
calculated is compared to the field hookload; repeat the above
steps till the two hookloads are equal within a tolerance.
FIGURE 5. DWOB comparison between measured and calculated for the three wells
0
5
10
15
20
25
2500 2700 2900 3100 3300 3500 3700
Hole Depth(m)
DW
OB(
KdaN
)
Predicted by Model
Measured by CoPilot
0
5
10
15
20
25
3380 3480 3580 3680 3780 3880 3980 4080 4180 4280
Hole Depth(m)
DWO
B(Kd
aN)
Predicted by Model
Measured by EMS
0
5
10
15
20
25
3000 3100 3200 3300 3400 3500 3600 3700 3800 3900 4000
Hole Depth(m)
DW
OB(
KdaN
)
Predicted by Model
Measured by CoPilot

6 Copyright © 2015 by ASME
About the result of well#1, the DWOBs from model match
those from the CoPilot very well in both the whole trend and
values. However, there exist some minor differences in very
small sections. These differences can be negligible. The
prediction accuracy is over 80%, εRMSE or εavg.
From the result of well#2, the DWOBs from model match those
from the CoPilot in both the whole trend and values. There are
some differences in three sections. The prediction accuracy is
over 83% in εavg, and 75% in εRMSE.
In the result of from well#3, the DWOBs from model match
those from the EMS in both the whole trend and values. There
are some differences in a few small sections. The prediction
accuracy is close to 85% in εavg, and 80% in εRMSE.
For the three wells, the average of εRMSE and εavg is around 80%
and 86% respectively (as shown in table 1).
DEVIATION ANALYSIS AND IMPROVEMENT
MEASURES As discussed above there exist some deviations or differences
between the measurement and the prediction. Potential reasons
which caused those differences are discussed below.
For well#1, two deviation sources: one is from sliding mode,
this deviation will be eliminated by using a correct model for
sliding which is addressed in the next section. Another is the
potential for measurement deviation which could be caused by
the tool itself, or potentially because of the vibration of the
drillstring.
For well#2, by checking the downhole measurement, it was
found that the whirling severity diagnostic potentially had
something to do with the difference. Another cause is probably
the wear of drill bit’s gage section. When the drill bit is new,
there are cutting force or friction applied on the gage section,
and there is no force on the closer stabilizer. On the contrary,
when gage section is worn out, the forces on the gage section
decrease and some of them are transferred to the closer
stabilizer. As the hookload is almost keeping the same, the
predicted DWOB has the same trend as SWOB. However, the
DWOB from CoPilot obviously decreased. Measurement
deviation is a possible cause.
For well#3, it was found that when the predicted DWOB is
maximum, the TTS hookload is minimum correspondingly.
Therefore the possible reason is the lower TTS reading, or the
lower reading was potentially caused by the vibration of the
string.
FIGURE 6. The friction coefficient calculated for the three
wells
NEW SLIDING MODELING From the previous analysis, some differences are from the
FIGURE 7. Comparison of DWOB/SWOB for three sliding sections

7 Copyright © 2015 by ASME
FIGURE 8. Comparison of DWOB/SWOB for all the Sliding Sections
FIGURE 9. SWOB calculated given constant DWOB(left) and comparison of DWOB/SWOB(right)
2500
2700
2900
3100
3300
3500
3700
0 5 10 15 20
DWOB/SWOB(KdaN)
Dep
th (
m)
)
SWOB
DWOB-Given
2500
2700
2900
3100
3300
3500
3700
0 5 10 15 20
DWOB/SWOB(KdaN)
De
pth
( m
) )
SWOB-Measured
SWOB-Model
DWOB-Given
8 Copyright © 2015 by ASME
model for sliding, therefore a new sliding modeling was
developed. The T&D model did not work well in sliding mode
as it is. It can be seen in figure 7 there is a big difference
between the prediction and the measurement and it was
therefore conducted more sliding modeling. It was seen that
DWOB_sliding is a function of differential pressure (DP),
standpipe pressure, DWOB_rotation, and coefficient K related
to motor type as shown in Eq. 9. DWOB_rotation is obtained
with T&D model, and K is obtained by comparing DWOB-
rotation to DWOB from the measurement tools. With the new
sliding model, there is a good match. Figure 7 shows the
comparison of DWOB/SWOB for three sliding sections. Figure
8 shows the comparison of DWOB/SWOB for all the sliding
sections.
(9)
DWOB/SWOB AUTOMATION From the previous sections, the new Autodriller can
automatically calculate DWOB by the use of surface drilling
data. A key feature of this new type Autodriller is that it can
also automatically get surface weight on bit if target DWOB is
given. If the DWOB is fixed at a formation for a specific drill
bit the SWOB is automatically obtained with the new
Autodriller software system as shown in figure 9(left). Figure 9
(right) shows the comparison of DWOB/SWOB-Model/SWOB-
Measured.
SUMMARY The following conclusions can be drawn from the newly
developed and verified Autodriller system.
1. A new concept is developed and presented that gives more
accurate downhole WOB based on surface measurements.
2. The new modeling can be integrated in a new Autodriller
system that gives accurate DWOB predictions in horizontal
wells using surface measurements.
3. Analyzing three horizontal wells, the verification results are
very good in most of the horizontal well sections.
4. The matches are good in most sections of the horizontal
well, both in trends and values. The trends include two
aspects: one is proximity between predicted DWOB and
the measured one; the other is between predicted DWOB
and the measured SWOB.
5. In a normal condition, the new Autodriller model gives
consistent results. Those differences between the predicted
and the measured are most likely caused by abnormal
conditions such as stick slip, whirling, tool wear, vibrations
or other. This can be improved by using other alert/alarm
software when the Autodriller is being used if applicable.
6. One of the concerns is using the sheave efficiency and
weight of traveling block, in that we get the values through
repeated tuning when calibrating. However, the existence
of TTS solves the uncertainty of sheave efficiency and
traveling block weight.
From the above points, the new Autodriller model has been
proven. More trial wells will be collected for the further
verification. This new Autodriller will be a closed loop control
system that automatically and in real-time adjusts SWOB so
that the DWOB is accurate, which will directly improve the
performance of drill bits, and decrease the cost of drilling,
especially in directional well drilling. In addition, the
Autodriller can also in real-time monitor the
compression/tension in the drillstring to prevent buckling.
NOMENCLATURE Fi, Fi+1 the tension or compression at top end and bottom end
of element i, N
Ti torque, N.m
βi buoyancy coefficient, dimensionless
wi unit weight of element, N/m
ΔLi length of element, m
μi friction coefficient, dimensionless
φi, φi+1 azimuth at top end and bottom end of element i, rad
θi dogleg angle, rad
αi, αi+1 inclination at top end and bottom end of element i, rad
εavg average of all absolute εi
εi relative error percentage, dimensionless
εRMSE rooted mean square error, dimensionless
ACKNOWLEDGMENTS Thanks are given to Rocsol Technologies Inc., Pason Systems
Corp. and Talisman Energy Inc. for providing drilling
data/downhole measurement data.
REFERENCES 1. Florence, F., Porche, M., Thomas, R. and Fox, R.,
2009, ―Multi-Parameter Autodrilling Capabilities
Provide Drilling, Economic Benefits‖, SPE/IADC
Drilling Conference and Exhibition, 17-19 March,
Amsterdam, The Netherlands.
2. Products & Services, Pason System Inc., retrieved
from the following website: https://www.pason.com
/index.php? option=com_content&view=article&id=30
&Itemid=32
3. Drilling & Intervention, Forum Energy Technologies,
retrieved from the following website: http://www.f-e-
t.com/our_products_technologies/drilling- intervention
/drilling-instrumentation/monitoring-systems/aoi-auto-
driller/

9 Copyright © 2015 by ASME
4. National Oilwell Varco, retrieved from the following
website: www.nov.com/WorkArea/DownloadAsset.
aspx?id=7463/
5. Intelligent Automatic Drilling & Block Safety System,
Rigserv, retrieved from the following website:
www.rigserv.com
6. Hareland, G., Fazaelizadeh, M. and Wu, Z., 2014,
―AUTODRILLER SYSTEM‖, US patent
2014/0196949
7. Hareland, G., Wu, A. and Lei, L.,2014, ―The Field
Tests for Measurement of Downhole Weight on Bit
(DWOB) and the Calibration of a Real-time DWOB
Model‖, International Petroleum Technology
Conference held in Doha, Qatar, 20–22 January 2014.
8. Hareland, G., Wu, A. and Rashidi, B.,2010, ―A New
Drilling Rate Model for Tricone Bits and Its
Application to Predict Rock Compressive Strength‖,
the 44th US Rock Mechanics Symposium and 5th
U.S.-Canada Rock Mechanics Symposium, held in Salt
Lake City, UT June 27–30, 2010.
9. Johancsik, C. A., Friesen, D. B. and Dawson, R., 1984,
―Torque and Drag in Directional Wells- Prediction and
Measurement‖, Journal of Petroleum Technology, June
1984.
10. Aadnoy, B.S., Fazaelizadeh, M. and Hareland, G.,
2010, ―A 3-Dimentional Analytical Model for
Wellbore Friction‖, Journal of Canadian Petroleum
Technology, Volume 49, Issue 10, page 25-36.