real-time distribution level metering and visualization for
TRANSCRIPT
NREL is a national laboratory of the U.S. Department of Energy, Office of Energy Efficiency and Renewable Energy, operated by the Alliance for Sustainable Energy, LLC.
Real-Time Distribution Level Metering and
Visualization for High Pen PV Circuits
Jason Bank
Sept 14, 2012

Innovation for Our Energy Future
Data Collection Network Objectives
• In order to support research projects related to the integration of
distributed generation NREL has developed a solution for high-
speed, real-time, measurement of electrical quantities a low
voltage points in a distribution system
• Remote measurement devices stream data back to a set of
central data collection servers, in a network architecture similar to
those used for PMUs
• The servers collect and store this data which is then made
available for end users through a set of query tools and
visualization applications
• Most off-the-shelf products did not meet all the requirements for
data rates, compact size, all weather capability, and real-time data
transmission
2

Innovation for Our Energy Future
Distribution Monitoring Units
• Based in National Instruments sbRIO hardware and C-series modules
• GPS equipped for timestamping and Phasor calculations
• Developed specifically for metering at low voltage points on the distribution level
• Each Unit measures voltage and current phasors, RMS values, real, reactive and apparent power, power factor and temperature (external and internal)
3
• Output data rate configurable from 1 Hz up to 60 Hz
• Designed for metering at points up to 300 Vrms, higher voltage levels can be achieved with PTs or divider circuits
• Uses clip on voltage probes and Rogowski coils
• 9” x 11” x 3.5”

Innovation for Our Energy Future
Distribution Monitoring Units
• High temperature and weather rated for outdoor installations
• Data transmitted in real-time through a Ethernet, WiFi or Cellular
internet connection
• 120/240 Split-Phase and 277 Y models have been developed
• Twelve units have been fielded into SMUD’s Anatolia Circuit
• Five units have been installed on the Kihei Circuit on Maui
Meter installation on a Pad Mount Residential Transformer in Sacramento
4

Innovation for Our Energy Future
• DMU measurements are immediately sent out through the onboard cellular modem, ethernet or Wi-Fi connection using the PMU communication protocol specified by the IEEE C37.118 Standard
• The data streams pass through the internet, arriving at the Data Concentrator housed at NREL
• The Data Concentrator time-aligns these streams and condenses them into one data set containing all of the measurement data
• The concentrator data stream is sent to the Historian for archival, then onto the Data Visualization applications and any other end users requiring live data feeds.
• The Data Concentrator is capable of receiving data from any internet connected device that can transmit using the C37.118 protocol, which includes almost all off the shelf PMUs and Phasor Data Concentrators
• The OpenPDC software package (http://openpdc.codeplex.com/) provides the server-side software for both the concentrator and historian
Data Collection Network
5

Innovation for Our Energy Future
• This data collection network is focused
on irradiance measurement
• Individual stations are solar powered
and equipped for cellular
communication
• Once fielded the units begin collecting
global horizontal measurements at data
rates up to once per second
• Data is passed to the central servers at
NREL in a batch process
Solar Irradiance Measurements

Innovation for Our Energy Future
• The red traces on these plots are global horizontal Irradiance measurements Taken from a MIDC tower in the Anatolia Neighborhood
• Blue traces are power flow through a transformer serving 10 houses, each with about 2kW of installed rooftop PV
• These plots represent three consecutive days, one cloudy, one sunny and one with intermittent cloud cover
Collected Data Examples – PV Production
Sept 24
Sept 25 Sept 26

Innovation for Our Energy Future
• Upper plot is measured P and Q at a transformer serving 10 houses in Anatolia
• A load is observed switching on then off throughout the time span
• This load is about 5 kW and is observed all over the system at all times of day, most likely AC
• This switching effect is also apparent in the voltage measurements on the bottom plot
Collected Data Examples – Load Characteristics

Innovation for Our Energy Future
• Neighborhood voltage profiles on a clear day
• At night with light load and no PV production nearly flat through neighborhood (1am -- blue)
• At peak load with no PV (8pm – black) voltage drops from start to end of feeder
• With PV producing (12pm – red) voltage rises from start of feeder to end
• Data sets averaged over one hour around given time, dashed lines give width of distribution
Collected Data – Voltage Profiles

Innovation for Our Energy Future 10
Data Visualization
-Live data is displayed in Google
Earth
-Accessible to internet connected
users with the proper credentials
Innovation for Our Energy Future
Strip Chart Displays
11
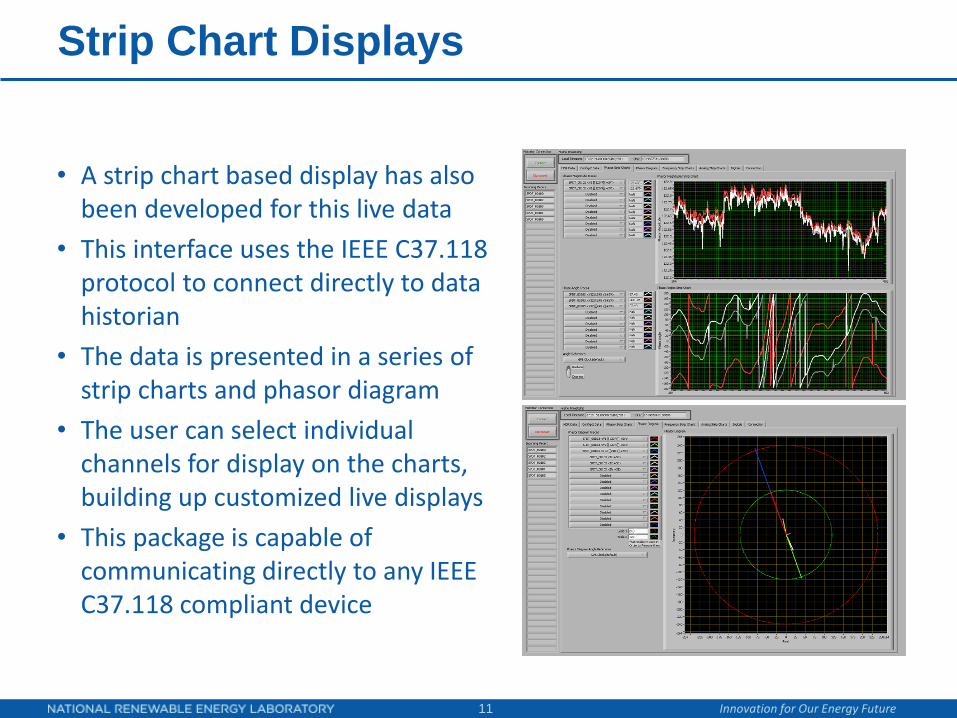
• A strip chart based display has also been developed for this live data
• This interface uses the IEEE C37.118 protocol to connect directly to data historian
• The data is presented in a series of strip charts and phasor diagram
• The user can select individual channels for display on the charts, building up customized live displays
• This package is capable of communicating directly to any IEEE C37.118 compliant device
Innovation for Our Energy Future
Data Access
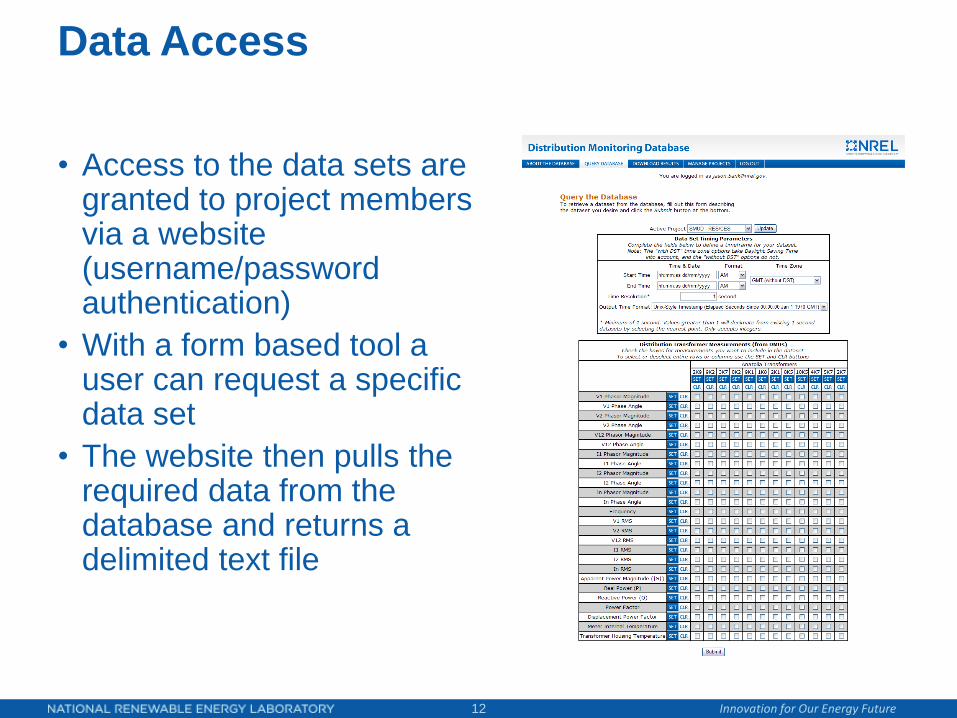
• Access to the data sets are granted to project members via a website (username/password authentication)
• With a form based tool a user can request a specific data set
• The website then pulls the required data from the database and returns a delimited text file
12

Innovation for Our Energy Future
• Further deployment of meters into other distribution circuits • SCE High Pen Study
• NREL Campus
• Development of other meter models for additional metering locations and reduced hardware cost
• DFR-style triggered waveform capture
• More complete support for Harmonics and THD
• FTP store and forward version (trades real-time for reliability, higher measurement rates and ease of communications)
• Integration of other, data sets into data retrieval website • Utility SCADA data
• Household level and Smart Meter Data
• Solar and weather measurements
• Refinement and addition of features to Visualizations
• Integration of other sources into visualizations, including results from simulation and modeling
• NREL technical report to be published late September 2012
Continuing Work
13

Innovation for Our Energy Future
• The communications to the Google Earth and Strip chart
displays have an open architecture which allows for easy
integration of other data sources
• This would include data sets generated by simulation and
modeling packages
• On going work includes the integration of the DEW
distribution system modeling package so that simulation
results can be incorporated and displayed along with the
live data
• DEW can also receive the live data feeds as input to its
solver, allowing it to fill in the missing points on the map
Integration of Simulation and Modeling