real-time analysis of beats in music for entertainment robots
TRANSCRIPT
www.ausmt.org 319 auSMT Vol. 2 No. 4 (2012)
Copyright © 2012 International Journal of Automation and Smart Technology
ORIGINAL ARTICLE SPECIAL ISSUE: Intelligent Robotics (1/2) Guest edited by Yi-Hung Liu
Real-Time Analysis of Beats in Music for
Entertainment Robots
Yue-Der Lin1, 2, *, Ting-Tsao Wu1, Yu-Ren Chen1, Yen-Ting Lin2, Wen-Hsiu Chen3, and Shih-Fan Wang2, and Jinghom Chakhap4 1Department of Automatic Control Engineering, Feng Chia University, Taiwan 2Master’s Program in Biomedical Informatics & Biomedical Engineering, Feng Chia University, Taiwan 3Precision Machinery Research Development Center, Taiwan 4Department of Electronics and Communication Engineering, Indian Institute of Technology Guwahati, India
(Received 5 October 2012; Accepted 22 October 2012; Published on line 1 December 2012)
*Corresponding author: [email protected]
DOI: 10.5875/ausmt.v2i4.165
Abstract: The dancing actions for entertainment robots are usually designed in advance and saved in a database
according to the beats and rhythm of the given music. This research is devoted to developing a real-time algorithm
that can detect the primary information of the music needed for the actions of entertainment robots. The
computation of the proposed algorithm is very efficient and can satisfy the requirement of real-time processing by a
digital signal controller. The digitized music signal is first normalized to make the algorithm robust for miscellaneous
music volume. Next, the primary features of the beat for the music are extracted. Based on the extracted features, the
algorithm will then identify the occurrence of beats in the music through the use of an optimized classifier. From the
accumulated information of the timing for the beats, the algorithm can provide the predicted timing information of
the next beat through regression analysis. The type and tempo of the given music can also be derived thereafter. The
entertainment robot can thus move or dance according to the information derived by the algorithm. A graphical user
interface (GUI) program in LabVIEW is also utilized to observe and verify the analysis results. In this study, the ratio for
correct beat detection is greater than 85%. The prediction ratio for the correct timing of beats is over 80%, and it is
100% correct for both music type and music tempo.
Keywords: beats; entertainment robot; fast Fourier transform (FFT); regression analysis; rhythm; standard of octave
Introduction
Robots have been developed to serve human
beings in various tasks. ABI research reported that
entertainment robots that are designed to amuse users
have had an average annual growth rate of 50% during
the past six years in the Asian market [1]. Among
miscellaneous entertainment robots, robots that can
move or dance in response to a particular piece of music
are the ones that customers find most attractive.
Conventionally, the actions of such robots were usually
scheduled in advance according to the beats and rhythm
of a given piece of music existing in the robot’s database.
In such cases, the robot can only respond to music in its
database, and extra memory space is required for this
kind of robot. In order to overcome these drawbacks, this
research is dedicated to the development of a real-time
algorithm that can, from the music which the robot is
responding to, extract the primary information needed
for the actions of an entertainment robot.

ORIGINAL ARTICLE Real-Time Analysis of Beats in Music for Entertainment Robots
www.ausmt.org 320 auSMT Vol. 2 No. 4 (2012)
Copyright © 2012 International Journal of Automation and Smart Technology
Music is composed of components such as beats,
rhythm, tempo and type. Some of the components are
time-varying and nonstationary, and this is why the
music is pleasant to hear. Human beings have the ability
to recognize the basic components in music and can
instinctively act in response to music. However, it is
challenging for artificial systems such as computers and
robots to respond in a similar way. A number of research
studies have been devoted to the analysis and extraction
of major features in music. Scheire developed a method
that utilized band-pass filters and a filter bank to analyze
the tempo of music, and a specific algorithm was also
designed to predict the occurrence of subsequent beats
[2]. In another research, Eck proposed a rule-based
approach to identifying the beats in the music. The
detected beats were then compared with those marked
intuitively by human listeners [3]. Goto presented a
real-time beat tracking system based on the onset time,
chord changes and drum patterns in the music [4-6].
Jensen and Andersen extracted certain features from the
music to identify the onset of particular notes. The beat
location was then determined by the most probable beat
intervals. This proposed technique performs well for a
wide variety of popular music [7]. In reference [8],
Sethares et al. presented methods based upon a
Bayesian decision framework and employed a gradient
descent approach to track the beats in musical
performance. One probabilistic model proposed by Lin et
al. involved estimating tempo and timing signature
together in order to detect and track beats in music. [9].
Klapuri et al. utilized a comb filter and another
probabilistic methods based on a priori music knowledge
to extract musical features and to estimate the timing
signature in various hierarchical metrical units [10]. In
reference [11], a methodology is presented for predicting
the beats in a particular piece of music according to the
note onsets determined by a weighted linear
combination of the sub-band features in the spectrum of
the music signal. Mikel’s study is devoted to estimating
the metrical structure of a piece of music based on the
generation of a beat similarity matrix [12]. In order to
model the dancing action of robots, Aucouturier et al.
utilized the characteristics of chaotic itinerancy for the
bio-inspired FitzHugh-Nagumo neuron model [13]. These
studies have provided a variety of approaches for the
analysis of music. However, because they depend on
large amounts of computation, most of the proposed
methods require the use of desktop computers or costly
digital signal processor units. In addition, very little of the
research could satisfy the requirement of real-time
analysis without the support of a music database.
The objective of this research is to develop a
real-time algorithm for music analysis that possesses a
low computation load and can satisfy real-time
requirements without the inclusion of a music database
in a general digital signal controller. The proposed
algorithm has been implemented and tested on dsPICTM
(Microchip Technology Inc.). The algorithm can detect
the timing of beats in musical input in real time, and the
predicted timing of succeeding beats can also be
provided by regression analysis. Based on information
about the timing of beats, the type and tempo of the
given music can then be derived. In addition, a graphical
user interface (GUI) program in LabVIEW is also
developed to observe and verify the results of the
analysis.
Yue-Der Lin was born in Taichung, Taiwan, in 1963. He earned a Ph.D. degree
in electrical engineering from National Taiwan University in 1998. He is now
an associate professor at the Department of Automatic Control Engineering,
Feng Chia University, Taiwan. Dr. Lin was a visiting scholar at the University of
Wisconsin-Madison in 2006, where he pursued research in advanced signal
processing techniques. He was the winner of the Rotary International
Scholarship in 1994-1995 and 1996-1997, and has been listed in Marquis
Who’s Who in the World in 2008, 2009, 2010 and 2012. He has also been
listed in IBC Top 100 Educators, 2000 Outstanding Intellectuals of the 21st
Century, Foremost Educators of the World, Foremost Engineers of the World,
21st Century Award for Achievement and Leading Engineers of the World in
2008 and IBC Top 100 Engineers in 2010. Dr. Lin’s research interests include
digital signal processing and pattern recognition. He is a senior member of
IEEE.
Ting-Tsao Wu was born in Taichung, Taiwan, in 1989. He earned a master’s
degree from the Institute of Automatic Control Engineering, Feng Chia
University, Taiwan, in 2012. His research interests include embedded systems
and signal processing.
Yu-Ren Chen was born in Changhwa, Taiwan, in 1987. He earned a master’s
degree from the Institute of Automatic Control Engineering, Feng Chia
University, Taiwan in 2011. He is now a R&D engineer at Holux Technology
Incorporated. His primary work includes the implementation of embedded
systems with signal processing algorithms for non-contact vital sign
monitoring using UWB technology.
Yen-Ting Lin was born in Taipei, Taiwan, in 1987. He earned a master’s
degree from the Master’s Program in Biomedical Informatics and Biomedical
Engineering, Feng Chia University, Taiwan in 2011. He is now a research
assistant for the Brain Research Center, National Chiao Tung University,
Taiwan, where he is responsible for the system development of wearable
electroencephalogaphy. His research interests include the development of
medical device and medical electronic circuit design.
Wen-Hsiu Chen was born in Taipei, Taiwan, in 1986. She earned a master’s
degree from the Master’s Program in Biomedical Informatics and Biomedical
Engineering, Feng Chia University, Taiwan in 2010. She has been an engineer
for the Precision Machinery Research & Development Center, Taiwan, since
September, 2010. She is responsible for the development of entertainment
robots.
Shih-Fan Wang was born in Yungling, Taiwan, in 1989. He earned a master’s
degree from the Master’s Program in Biomedical Informatics and Biomedical
Engineering, Feng Chia University, Taiwan, in 2012. His research interests
include system integration and medical instrumentation.
Jinghom Chakhap was born in Assam, India, in 1992. She is a final year
undergraduate in the Department of Electronics and Communication
Engineering in Indian Institute of Technology Guwahati. She has undergone a
research internship in Feng Chia University, Taiwan in May-July 2012 for
developing a platform for multi-modal signal analysis in Python. She is now
working on a novel real time MEMS glucose sensor. She is a recipient of
National Talent Search Examination Scholarship. Her research interests
include the development of MEMS biosensors and digital signal processing.

Yue-Der Lin, Ting-Tsao Wu, Yu-Ren Chen, Yen-Ting Lin, Wen-Hsiu Chen, Shih-Fan Wang, and Jinghom Chakhap
www.ausmt.org 321 auSMT Vol. 2 No. 4 (2012)
Copyright © 2012 International Journal of Automation and Smart Technology
Audio
FFTAudio
Analyzing
Type of
Music
Prediction of
BeatsTransmmition
ExternalCircuit
Robot
dsPIC33
A/D Coverter
Tempo of
Music
Beats Detecting
Normalization
Figure 1. Flow diagram of the proposed system.
Methods
The flow diagram of the proposed system is
demonstrated in Figure 1. The system can be divided into
two units. They are the analog processing unit for the
input audio signal and the digital processing unit for the
digitized audio signal. For the analog processing unit, the
input music signal from the line-in plug is first pulled up
to be of positive potential. The pulled-up signal is then
filtered by a bandpass filter (BPF), which is composed of
a highpass filter (HPF) and a cascaded lowpass filter (LPF).
Single-supply operational amplifiers (OP AMP) are
utilized for the circuit design in the analog processing
unit. An analog-to-digital converter (ADC) in the digital
processing unit is utilized to digitize the analog signal. In
the digital processing unit, the digitized signal is first
normalized by a formula of linear projection. Next, the
respective energy in eighteen sub-bands of the signal is
derived by fast Fourier transform (FFT). The derived
energy is the primary element of the algorithm for beat
detection. The timing for each beat is then utilized to
determine the tempo, type and the timing prediction of
the followed beat in the music. A more detailed
description follows.
Processing the analog music signal
The digital signal controller utilizes single supply
for its operation. It is desirable that the condition of the
signal for the music be in a single-supply mode, because
this reduces the complexity of the printed circuit board
(PCB) and simplifies the circuit design. Therefore,
single-supply OP AMPs were adopted in the analog
processing unit for this research. Music is composed of
sound waves emanating from a variety of musical
instruments, and each instrument has its specific timbre
and characteristic spread in the spectrum. In order to
reduce the overall computation burden of the digital
processor, the frequency range that the system is
required to process must be taken into consideration in
advance. As the fundamental frequency for most musical
instruments in rhythmic music ranges from around 20 Hz
to 2000 Hz [14], this range was adopted for the -3dB
cutoff frequency of LPF and HPF for the music signal. The
resulting effect on the signal conditioning of the analog
processing unit is shown in Figure 2, in which the left
figure shows the original music signal and the right figure
shows the processed output signal. It can be seen that
the signal has been elevated to positive potential and the
high-frequency components in the original signal have
been removed by the analog processing unit.
Figure 2. The original signal (left); the processed signal (right).
Normalization
Normalization is a way to make the proposed
algorithm for the detection of beats more robust for
various volumes of the input audio signal. In the digital
processing unit, the digitized signal is normalized before
ORIGINAL ARTICLE Real-Time Analysis of Beats in Music for Entertainment Robots
www.ausmt.org 322 auSMT Vol. 2 No. 4 (2012)
Copyright © 2012 International Journal of Automation and Smart Technology
any further processing. The formula is based on linear
projection and is given in Equation (1):
2 1 1 1 2 2ˆ[ ] [ ] ,
1 2 1 2
b b a b a bx n x n
a a a a
(1)
in which ˆ[ ]x n denotes the normalized signal, x[n] is the
original digital signal; and b1 and b2 represent the
minimum and maximum threshold desired in digital
presentation, whereas a1 and a2 denote the maximum
and minimum value of x[n] within a window of 0.064
seconds. Figure 3 demonstrates the result for the original
signal (upper) and for the normalized signal (lower).
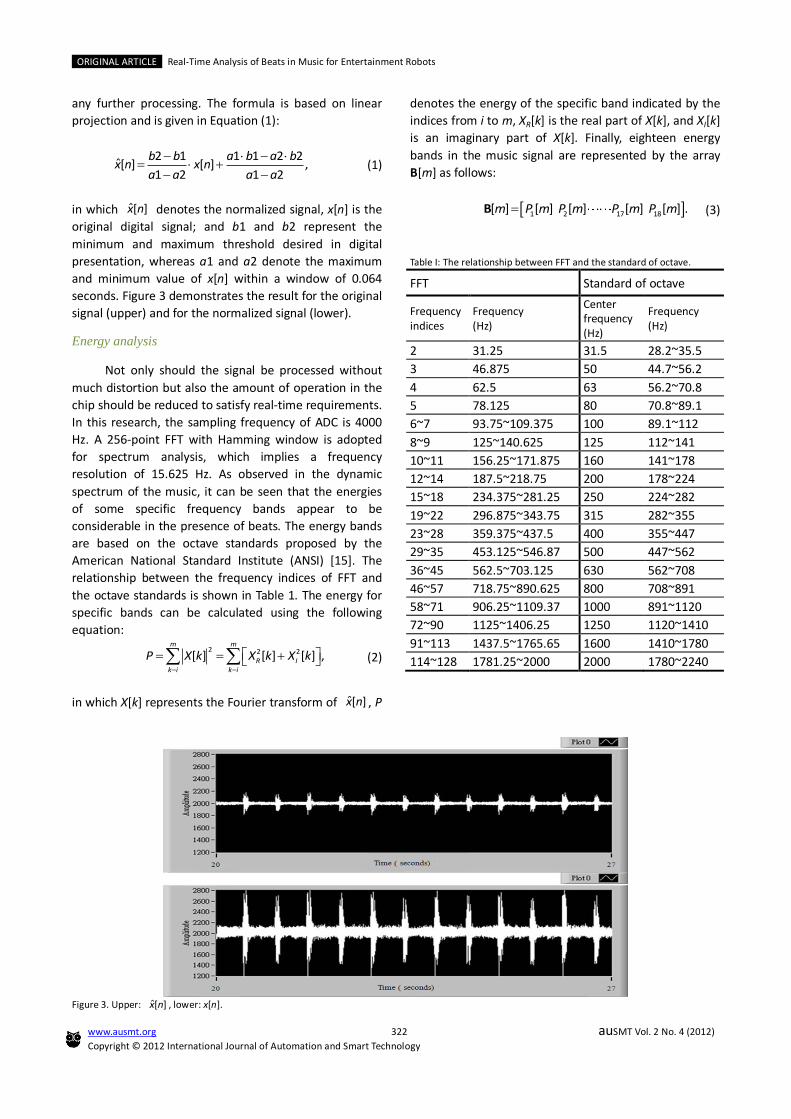
Energy analysis
Not only should the signal be processed without
much distortion but also the amount of operation in the
chip should be reduced to satisfy real-time requirements.
In this research, the sampling frequency of ADC is 4000
Hz. A 256-point FFT with Hamming window is adopted
for spectrum analysis, which implies a frequency
resolution of 15.625 Hz. As observed in the dynamic
spectrum of the music, it can be seen that the energies
of some specific frequency bands appear to be
considerable in the presence of beats. The energy bands
are based on the octave standards proposed by the
American National Standard Institute (ANSI) [15]. The
relationship between the frequency indices of FFT and
the octave standards is shown in Table 1. The energy for
specific bands can be calculated using the following
equation:
2 2 2[ ] [ ] [ ] ,m m
R Ik i k i
P X k X k X k
(2)
in which X[k] represents the Fourier transform of ˆ[ ]x n , P
denotes the energy of the specific band indicated by the
indices from i to m, XR[k] is the real part of X[k], and XI[k]
is an imaginary part of X[k]. Finally, eighteen energy
bands in the music signal are represented by the array
B[m] as follows:
1 2 17 18[ ] [ ] [ ] [ ] [ ] .m P m P m P m P mB (3)
Table I: The relationship between FFT and the standard of octave.
FFT Standard of octave
Frequency indices
Frequency (Hz)
Center frequency (Hz)
Frequency (Hz)
2 31.25 31.5 28.2~35.5
3 46.875 50 44.7~56.2
4 62.5 63 56.2~70.8
5 78.125 80 70.8~89.1
6~7 93.75~109.375 100 89.1~112
8~9 125~140.625 125 112~141
10~11 156.25~171.875 160 141~178
12~14 187.5~218.75 200 178~224
15~18 234.375~281.25 250 224~282
19~22 296.875~343.75 315 282~355
23~28 359.375~437.5 400 355~447
29~35 453.125~546.87 500 447~562
36~45 562.5~703.125 630 562~708
46~57 718.75~890.625 800 708~891
58~71 906.25~1109.37 1000 891~1120
72~90 1125~1406.25 1250 1120~1410
91~113 1437.5~1765.65 1600 1410~1780
114~128 1781.25~2000 2000 1780~2240
Figure 3. Upper: ˆ[ ]x n , lower: x[n].

Yue-Der Lin, Ting-Tsao Wu, Yu-Ren Chen, Yen-Ting Lin, Wen-Hsiu Chen, Shih-Fan Wang, and Jinghom Chakhap
www.ausmt.org 323 auSMT Vol. 2 No. 4 (2012)
Copyright © 2012 International Journal of Automation and Smart Technology
Beat detection
Feature extraction The energy at some bands can be found to be
considerable when a beat occurs. To determine the
presence of beats, information about the bands of beats
and the bands of non-beats should be analyzed in
advance. With the help of CakewalkTM (a software for
processing music that can display all the information in
the music in octave standards), the segments for beats
and non-beats in the music are extracted to determine
the decision rule for further analysis. The music is cut
into segments and collected into two groups, one for
beats and the other for non-beats. We then evaluate the
eighteen energy bands of selected features using
principal component analysis (PCA) and receiver
operating characteristic (ROC) curves. The PCA results are
shown in Table 2. It can be seen that a cumulated
variance of 80% can be attained with seven eigenvalues.
Thus the energy sum of seven primary energy bands is
selected to be one of the features for the classification
for beats or non-beats, and the resulting ROC curves for
different sums of energy are shown in Figure 4. From the
area under the curve (AUC), the energy sum of bands 2, 3,
4, 5, 7, 8 and 10 in the array B[m] is a feasible feature
and is selected to be the first feature for the classification
of beats or non-beats. The energy distribution for the
first feature is demonstrated in Figure 5. Since the
features of beats and non-beats overlap, there is a need
to find a way to discriminate between beats and
non-beats so that they may be properly classified. To
improve classification, adding another feature may be
helpful. As the total energy of beats was much larger
than that of non-beats, eighteen energy bands in B[m]
are sorted in an ascending order and are denoted by ˆ[ ]mB as follows:
1 2 17 18ˆ[ ] [ [ ] [ ] [ ] [ ]],m Q m Q m Q m Q mB (4)
where Qi(t), i 1, 2, 18, represents the sorted band.
Table 2. The result of principal component analysis.
Principal component Eigenvalue Cum. variance (%)
1 6.197106 34%
2 2.337917 47%
3 2.080548 59%
4 1.396445 67%
5 0.990206 72%
6 0.675946 76%
7 0.638761 80%
8 0.590391 83%
9 0.528705 86%
10 0.47125 88%
11 0.422939 91%
12 0.38889 93%
13 0.364556 95%
14 0.234352 96%
15 0.209889 97%
16 0.180129 98%
17 0.165939 99%
18 0.126029 100%
Figure 4. ROC curves with different features.

ORIGINAL ARTICLE Real-Time Analysis of Beats in Music for Entertainment Robots
www.ausmt.org 324 auSMT Vol. 2 No. 4 (2012)
Copyright © 2012 International Journal of Automation and Smart Technology
Figure 5. The energy distribution for the first feature. The solid-line represents the beat, and the dashed-line represents the non-beat.
Figure 6. Scatter diagram for the features selected from 20 songs. The cross (+) represents the beats, the check (□) represents the non-beats.
Since the features should be independent of each
other, only the bands that are not included in the first
feature are considered. Next, a similar approach to that
used for the first feature is applied to the remaining
eleven energy bands. The energy sum for the eleven
bands is thus selected to be the second feature, and the
scatter diagram for the two features selected from 20
songs is derived in Figure 6.
Yue-Der Lin, Ting-Tsao Wu, Yu-Ren Chen, Yen-Ting Lin, Wen-Hsiu Chen, Shih-Fan Wang, and Jinghom Chakhap
www.ausmt.org 325 auSMT Vol. 2 No. 4 (2012)
Copyright © 2012 International Journal of Automation and Smart Technology
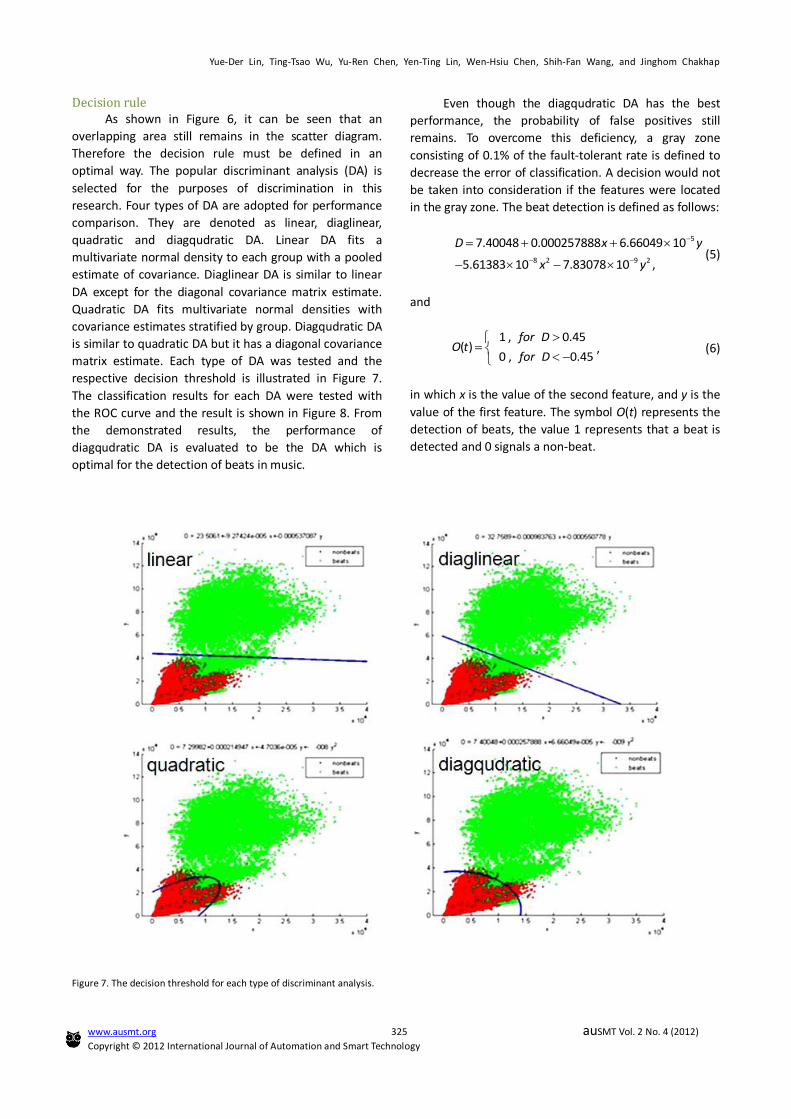
Decision rule As shown in Figure 6, it can be seen that an
overlapping area still remains in the scatter diagram.
Therefore the decision rule must be defined in an
optimal way. The popular discriminant analysis (DA) is
selected for the purposes of discrimination in this
research. Four types of DA are adopted for performance
comparison. They are denoted as linear, diaglinear,
quadratic and diagqudratic DA. Linear DA fits a
multivariate normal density to each group with a pooled
estimate of covariance. Diaglinear DA is similar to linear
DA except for the diagonal covariance matrix estimate.
Quadratic DA fits multivariate normal densities with
covariance estimates stratified by group. Diagqudratic DA
is similar to quadratic DA but it has a diagonal covariance
matrix estimate. Each type of DA was tested and the
respective decision threshold is illustrated in Figure 7.
The classification results for each DA were tested with
the ROC curve and the result is shown in Figure 8. From
the demonstrated results, the performance of
diagqudratic DA is evaluated to be the DA which is
optimal for the detection of beats in music.
Even though the diagqudratic DA has the best
performance, the probability of false positives still
remains. To overcome this deficiency, a gray zone
consisting of 0.1% of the fault-tolerant rate is defined to
decrease the error of classification. A decision would not
be taken into consideration if the features were located
in the gray zone. The beat detection is defined as follows:
5
8 2 9 2
7.40048 0.000257888 6.66049 10
5.61383 10 7.83078 10 ,
D x y
x y
(5)
and
1 , 0.45( )
0 , 0.45
for DO t
for D
, (6)
in which x is the value of the second feature, and y is the
value of the first feature. The symbol O(t) represents the
detection of beats, the value 1 represents that a beat is
detected and 0 signals a non-beat.
Figure 7. The decision threshold for each type of discriminant analysis.

ORIGINAL ARTICLE Real-Time Analysis of Beats in Music for Entertainment Robots
www.ausmt.org 326 auSMT Vol. 2 No. 4 (2012)
Copyright © 2012 International Journal of Automation and Smart Technology
Figure 8. ROC curves for each type of discriminant analysis.
Figure 9. Depiction of beats prediction.
Prediction Linear regression exists in a variety of types,
depending on the number of independent variables. In
this research the simple regressive equation (only one
independent variable) is utilized to predict the next beat
desired. The next beat’s position would be predicted by
the positions of three adjacent beats (as depicted in
Figure 9). The equation can be presented as in Equation
(7):
0 1 ,i iy B B x (7)
with
, ,3 3
ii i
x y
X Y
(8)
and
1 0 122
3
, .3
i ii
ii
x y X Y
B B Y b Xx X
(9)
In brief, xi is the number of beats in the first array of
beats, yi is the timing of beat position, X is an average
of set of three beats, Y is an average of a set of three
beat positions, B0 is the intercept of regression, and B1 is
the coefficient of regression.
Tempo and Type of Music Using the developed algorithm, the first beat of
each measure in 3/4 time music and each beat in 4/4
time music can be specified.
Tempo means the number of beats per minute in
the music. The tempo of music can be computed by the

Yue-Der Lin, Ting-Tsao Wu, Yu-Ren Chen, Yen-Ting Lin, Wen-Hsiu Chen, Shih-Fan Wang, and Jinghom Chakhap
www.ausmt.org 327 auSMT Vol. 2 No. 4 (2012)
Copyright © 2012 International Journal of Automation and Smart Technology
interval of beats. As the developed algorithm can
recognize the tempo in 4/4 time music and one-third of
the tempo in 3/4 time music, the type of music can
consequently be inferred.
Results
In this research, twenty songs (ten of which are in
3/4 time and ten of which are in 4/4 time) have been
chosen for performance testing. The test results for a
randomly selected set of 17 songs are summarized in
Table 3. The tempo of each song is successfully detected
within 10% of error, and the recognition of music type is
also achieved with a 100% degree of accuracy.
Additionally, the rate of beat is predicted accurately 80%
at least of the time within plus or minus 20 milliseconds
of error.
This algorithm can be utilized to detect the beats
of music, recognize the type and tempo of music, and
predict where the next beat is located. In addition, all the
results could be displayed and verified by a developed
graphical user interface (GUI) program in LabVIEW. The
GUI program is as shown in Figure 10.
The algorithm is implemented in dsPICTM with a
clock of 40 MHz. The execution time for the proposed
algorithm is 65.27 milliseconds, in which the
computation of FFT occupies 64 milliseconds. Hence, all
the analysis can be executed in real-time.
Conclusion and Discussion
The objective of this research is to develop a
real-time algorithm that can analyze beats without the
need of a database. The digital processing controller
dsPICTM, which is low in cost but high in performance, is
selected to implement the proposed algorithm in this
research. To counteract the computation load in the chip,
we have developed an efficient algorithm to analyze the
information in the music. Energy related features and a
DA classifier with a gray zone are proposed to identify
the beats and non-beats in the music. Among various DA
classifiers, diagqudratic DA is evaluated to have the best
performance. In addition to detecting the musical beats,
the proposed algorithm also possesses the ability to
recognize musical tempo, music type and to predict
following beats.
Table 3. Performance of analysis module (√: correct and satisfied).
Songs with 3/4 time and 4/4 time
Detection rate
Prediction rate (20 ms)
Music tempo
Music type
The one dwight 100 97.43 √ √
Never too late 97.18 96.22 √ √
Stars over Texas 100 95.65 √ √
Jump 98.15 95.10 √ √
Strawberry wine 97.64 93.67 √ √
Disturbia 93.55 92.49 √ √
You look so good 97.63 92.10 √ √
Edwin McCain ill be 95.48 89.95 √ √
Bridge to cross 96.76 87.45 √ √
Quarter call 97.02 86.73 √ √
Wanted 95.00 85.63 √ √
All the lovers 91.90 84.27 √ √
Rain on me 85.87 82.87 √ √
Tush 89.80 82.85 √ √
Lucille 97.46 82.48 √ √
Just dance 88.40 82.20 √ √
Please come home 92.05 81.89 √ √
Don't lie 90.82 80.58 √ √
You rock my world 90.61 80.58 √ √
Poker face 85.12 80.10 √ √
Figure 10. The interface of analysis module: the check is the desired point of beat. The solid-line is the estimated point of beat, and the dashed-line is
the forecast point of beat.

ORIGINAL ARTICLE Real-Time Analysis of Beats in Music for Entertainment Robots
www.ausmt.org 328 auSMT Vol. 2 No. 4 (2012)
Copyright © 2012 International Journal of Automation and Smart Technology
In the proposed method, the analysis results are
determined by the accuracy of beat detection. The beat
detection is closely related to the quantity of training
data. In order to enhance the stability of the system,
adding training data would be a promising route for
further research. Moreover, the dimension of feature
space could also be increased to improve detection
accuracy.
Acknowledgement
The authors wish to express their appreciation to
the Precision Machinery Research Development Center
(contract number: 99TR04 and 100TR10), the
Department of Industrial Technology of the Ministry of
Economic Affairs (100-EC-17-A-19-S1-163) and the
National Science Council (contract number NSC
100-2221-E-035-021 and NSC 101-2221-E-035-001),
Taiwan for the financial support for this research.
References
[1] ABI Research, [Online]. Available: http://www.abiresearch.com/ [Accessed: November, 2011]
[2] E. D. Scheirer, "Tempo and beat analysis of acoustic musical signals," Journal of the Acoustical Society of America, vol. 103, no. 1, pp. 588-601, 1998. doi: 10.1121/1.421129
[3] D. Eck, "A positive-evidence model for rhythmical beat induction," Journal of New Music Research, vol. 30, no. 2, pp. 187-200, 2001. doi: 10.1076/jnmr.30.2.187.7110
[4] M. Goto, "An audio-based real-time beat tracking system for music with or without drum-sounds," Journal of New Music Research, vol. 30, no. 2, pp. 159-171, 2001. doi: 10.1076/jnmr.30.2.159.7114
[5] M. Goto and Y. Muraoka, "Beat tracking based on multiple-agent architecture a real-time beat tracking system for audio signals," in The Second International Conference on Multiagent Systems, Kyoto, Japan, 1996, pp. 103-110. Available:
http://www.aaai.org/Papers/ICMAS/1996/ICMAS96-
013.pdf
[6] M. Goto and Y. Muraoka, "Real-time beat tracking for drumless audio signals: Chord change detection for musical decisions," Speech Commun., vol. 27, no. 3-4, pp. 311-335, 1999. doi: 10.1016/s0167-6393(98)00076-4
[7] K. Jensen and T. H. Andersen, "Real-time beat estimation using feature extraction," in International Symposium on Computer Music Modeling and Retrieval, Montpellier, France, 2003, pp. 13-22. Available:
http://www.springer.com/computer/database+mana
gement+%26+information+retrieval/book/978-3-54
0-20922-5
[8] W. A. Sethares, R. D. Morris, and J. C. Sethares, "Beat tracking of musical performances using low-level audio features," IEEE Transactions on Speech and Audio Processing, vol. 13, no. 2, pp. 275-285, 2005. doi: 10.1109/TSA.2004.841053
[9] L. Qian, L. Lie, C. Weare, and F. Seide, "Music rhythm characterization with application to workout-mix generation," in IEEE International Conference on Acoustics Speech and Signal Processing (ICASSP), Dallas, TX, 2010, pp. 69-72. doi: 10.1109/ICASSP.2010.5496203
[10] A. P. Klapuri, A. J. Eronen, and J. T. Astola, "Analysis of the meter of acoustic musical signals," IEEE Transactions on Audio, Speech, and Language Processing, vol. 14, no. 1, pp. 342-355, 2006. doi: 10.1109/TSA.2005.854090
[11] M. Davies, M. D. Plumbley, and D. Eck, "Towards a musical beat emphasis function," in IEEE Workshop on Applications of Signal Processing to Audio and Acoustics, New Paltz, NY, 2009, pp. 61-64. doi: 10.1109/ASPAA.2009.5346462
[12] M. Gainza, "Automatic musical meter detection," in IEEE International Conference on Acoustics, Speech and Signal Processing, Taipei, Taiwan, 2009, pp. 329-332. doi: 10.1109/ICASSP.2009.4959587
[13] J. J. Aucouturier, Y. Ogai, and T. Ikegami, "Making a robot dance to music using chaotic itinerancy in a network of FitzHugh-Nagumo neurons," in Neural information processing. vol. 4985, M. Ishikawa, K. Doya, H. Miyamoto, and T. Yamakawa, Eds., Berlin/Heidelberg: Springer, 2008, pp. 647-656. doi: 10.1007/978-3-540-69162-4_67
[14] Interactive frequency chart, Independent Recording Network, [Online]. Available:
http://www.independentrecording.net/irn/resources
/freqchart/main_display.htm [Accessed: November, 2011]
[15] Octave-band and fractional-octave-band analog and digital filters, ANSI/ASA S1.11-2004(R2009).