real options and the evaluation of research …archive/pdf/e_mag/vol.45_04_385.pdf · real options...
TRANSCRIPT

Journal of the Operations Research Society of Japan
Vol. 45, No. 4, December 2002
REAL OPTIONS AND THE EVALUATION OF RESEARCH AND DEVELOPEMENT PROJECTS IN THE PHARMACEUTICAL INDUSTRY:
A CASE STUDY
Nguyen Thu n a n g Naoya Takezawa International University of Japan International University of Japan
Nobuya Takezawa International Christian University
(Received September 17,2001; Revised July 30, 2002)
Abstract Research and development projects in the pharmaceutical industry normally last for a decade, require a large amount of investment and are highly risky. During the early stages of development, a company can seldom tell which chemical compound will successfully pass all subsequent stages and eventually become a marketable drug. Moreover, the long development process makes it difficult to predict the value of the marketable drug. The Net Present Value (NPV) method, used in most pharmaceutical companies to value their research and development projects, does not take into account the value of managerial flexibility. Examples of managerial flexibility include the right to stop or to make changes during the life of a project. Real-option evaluation expands the NPV method to embody the notion of managerial flexibility. For long- term projects, managers act upon new information revealed in the future and thus the real options approach better suits the decision making process in R &D management. In this article, we compute the value of an ongoing R&D project a t Nihon Schering Kabushiki Kaisha (Nihon Schering). We show that, a t the pre-clinical stage, the project had a negative value when evaluated under the traditional NPV method but a slightly positive value under the real-option approach. The difference comes from the recognition of "real options" embedded in the project. We conclude that real-option evaluation provides for a relevant and reliable method for reviewing a company's internal projects.
1. Introduction The research and development (R&D) process in general, especially for new drugs, comes with a high degree of uncertainty. Traditionally, drug companies screen a virtually infi- nite number of chemical compounds that are thought to have pharmacological effects and carefully choose the ones that are likely to become marketable products before investing millions of dollars into the R&D process. Statistics show that only one out of five thousand compounds ever make it to the market. And of those that do make it to the market, only three out of ten recover the full cost of development [20]. This means that pharmaceutical companies depend on a few best sellers to keep the company profitable and to generate enough revenue for further research and development.
While costly, long-lasting and highly risky R&D is becoming increasingly important as a means of survival for companies in this competitive industry, and especially important in the global market. Each new drug when patented and approved brings a stream of revenue for the patentee, but this revenue stream does not last forever. A normal patent time for a new drug varies from 5 to 20 years. This depends on the quality and effectiveness of the drug, the market where the drug is introduced, and the particular institution that grants the patent. However, there are cases when a granted drug can also take several years or
© 2002 The Operations Research Society of Japan

386 N. T. Trang, N. Takeza wa & N. Takeza wa
longer to reach its first patient. Thus, drug companies sometimes have only a few years to recoup their R&D costs [20]. After this period, the company looses its monopoly and its profit drops. Thus, pharmaceutical companies always have to back themselves up with new and innovative drugs. This requires large spending in R&D activities.
Most of the pharmaceutical and biotechnology companies currently use the traditional Net Present Value (NPV) method to value R&D projects. In this method, as far as uncer- tainty is concerned, a project with high uncertainty is valued less than one which has less uncertainty. However, the uncertainty, which is associated with the managerial flexibility in decision making, creates value that needs to be accounted for. Looking into the process of a new drug development project, there are two different kinds of uncertainty that need to be considered. The first is technical uncertainty, or technical risk that determines the rate of success or failure a t each stage of the development. Management has to act accordingly to the consequences of risk rather than trying to control the outcome. The technical uncer- tainty is sometimes referred to as "unfavourable risk". The second uncertainty lies in the future time contingent decisions that are resolved over time, allowing management to revise its decision in the future.
This investment flexibility on real assets is referred to as "real options" in analogy to financial options. Real-option valuation takes into account the value of flexibility. More flexibility means there are more chances to adjust the process so that loss can be mitigated and gains can be maximized. Thus, flexibility adds value to projects. This implies that certain projects might be undervalued when examined under the traditional NPV approach since it does not account for the existence of managerial flexibility.
It thus follows that a real option is the right, but not the obligation to acquire a real asset (the profit of a project, for instance) by paying a certain strike price (the required investment) a t a future time before or at maturity of the option. If the holder of the real option decides to buy the asset, she exercises the option, otherwise, she waives the option. A real option exists if one has the right to take a decision at one or more points in the future. Between now and the time of the decision, the market and other conditions change, making one decision preferred over another. By holding real options, management is able to take whatever decision that will suit the company best at certain times or periods of time
51 - The undervaluation problem encountered in the traditional NPV technique is one justi-
fication for the real-option technique. Real-option valuation can provide managers with a quantitative metric for the evaluation of their projects; to the extent that the input vari- ables, model assumptions, and valuation model itself conform to reality. R&D projects in general and in the pharmaceutical industry are often associated with several real options. There are defer options, which allows a firm to defer investment until more information becomes available. An abandonment option is an option when nlanagement can decide a t certain times whether to go further or to stop the project. Expansion or contraction options offer the opportunity to change scale of the project based on new situations. A project sometimes is undertaken not just for the sake of the underlying cash flow but also (perhaps primarily) for the "new opportunities that may be opened up" 1221.
Similar to financial options, real options often also rely on five major parameters: the underlying asset S , the strike price X, the time to maturity T. the risk-free rate of interest r and the volatility a.
The objectives of this article are threefold. First, we argue that real option valuation better suits the need of R&D project management and evaluation because the value of flexibility is explicitly taken into account. Second, we present an options-based evaluation
Copyright © by ORSJ. Unauthorized reproduction of this article is prohibited.

Real Options 387
framework by applying the binomial tree in a pharmaceutical industry context. Third, by focusing on a comprehensive evaluation of a real-life project, we further show that the real-option method need not remain in the theoretical realm.
The remainder of this article is structured as follows. Section 2 provides an overview and summary of the literature related to real options, particularly on R&D options. Next, we discuss the shortcomings of the traditional NPV method and explain why the real-option method should be considered in evaluating an R&D project for new drug development. In Section 3, we provide a description of the binomial model and explain how the valuation process is constructed. To fill the gap between theory and practice, in Section 4, we refer to an ongoing project a t Nihon Schering and argue that there exists a non-negligible value associated with the abandonment options and the growth options embedded in the project .
Section 5 concludes the article with the authors' comments on the implications of applying the real-option approach.
2. R&D Real Options in Theory and Practice The literature on real options is relatively new compared to financial options. Trigeorgis [22] provides a thorough introduction to real options. In the field of research and development, there are articles emphasizing the recognition of real options in R&D activities, such as Newton and Pearson (131, who identify the analogy of investing in an R&D project and buying a call option in the financial market. In both cases, one possesses the choice of either to pay a certain amount of money to acquire an asset or to allow the option to expire unexercised. They criticize the use of a single discount rate for different projects and suggest the use of option pricing theory (OPT) in replacement of the currently used NPV method for R&D project evaluation. Copeland and Keenan [2] suggest that business decisions in many industries and in many situations can be implemented flexibly through decisions of deferral, abandonment and expansions, or through a series of decisions made at multiple stages.
Other articles demonstrate the feasibility of adopting the real option methodology by numerically evaluating either hypothetical or real projects. Most of the real options liter- ature considers European type R&D options, but depending on the purpose of evaluation,
ISCUSS different frameworks and models may be proposed. For example, Perlitz et ul. [19] d' the pros and cons of the Binomial model, the Black-Scholes model and the Geske model [4]. In conclusion, the authors argue that the Geske compound option model is the most appropriate model because R&D options are in most cases, if not all, compound options. Finally, they provide a hypothetical example where the project is undervalued in NPV, and then give an explanation for the gap between the results derived from the NPV model and from the Geske model.
Lint and Pennings [18, 11, 121 in a series of three articles introduce how companies should evaluate an option to launch a new product to the market. Unlike Perlitz et al. they emphasize the importance of the discrete time approach by arguing that, as far as R&D options are concerned, the information that leads to a change in the project value only arrive a t discrete points in time. The uncertainty or volatility of the underlying asset is estimated from a sample of jumps made during the process. Empirical research is then conducted to estimate the value of the R&D project.
A discussion about uncertainty can be found in Huchzermeier and Loch [6]. They identify
'We have approached and interviewed several Japanese subsidiaries of large global pharmaceutical coin- panies like Dainabot, Pfizer and Nihon Sohering.
Copyright © by ORSJ. Unauthorized reproduction of this article is prohibited.
388 N. T. Trang, N. Takeza wa & N. Takeza wa
five types of operational uncertainty: 1) the generated cashflow from the market, 2) the budget required, 3) the performance in the research and the development process, 4) the market requirement and 5) the schedule or time scales. They also discuss how each of them affect the value of a project and conclude that not all types of uncertainties are favourable to the project.
Similarly, Kellogg et al. [9] consider market uncertainty and technical uncertainty as different sources of volatility. They treat the technical risk as unique risk, which reduces the expected value of the underlying asset. They assume that when a new drug reaches the market, it can fall into one of the five different product types, ranging from breakthrough to dog, according to the cash flow it generates. The volatility is derived based on the difference between the present value of the expected cash flow and the highest possible cash flow (the case of a breakthrough drug) upon market introduction. Using the Binomial tree method, the authors evaluate a biotechnology company to estimate the market value of its stock.
According to Jagle f8], a critical part of the value of technology intensive companies stems from the ongoing R&D projects and the intangible assets that come with R&D activities. He distinguishes the valuation of those companies into two different parts: existing business and value of growth opportunities (VGO)2. Value of growth opportunities is the sum of all future innovations of a company. Each of theses innovations is valued via an appropriate, industry-specific sequential new product development (NPD) model, and the use of the appropriate option pricing techniques. The key insight behind the approach is that each phase in the NPD process can be considered a real call option on the next phase of the NPD process. He also values a hypothetical pharmaceutical R&D project. He stresses that the industry averages can serve as a benchmark for the calculation of input parameters such as cash flow, probabilities, cost of development, time scales and liquidation value. Based on the comparison between the option approach and the DCF approach, Jagle finds that the value of fast growing companies are less dependent on free cash flows (FCFs), which are often difficult to forecast.
Pharmaceutical R&D project managers always have to answer the question of whether or not to accept a proposal for a new R&D investment. Also, year after year, managers have to make decisions on whether to continue or to stop their ongoing projects. Currently, the majority of corporations use some sort of quantitative method to measure the value of those projects. The most common ones are internal rate of return (IRR), net present value (NPV) , and pay back. One of the most popular techniques is the discounted-cash-flow (DCF) technique, often called the traditional NPV method, which calculates the net-present value of expected cash flow in the future. The techniques are simple, visible, comprehensive and can be obtained quickly. However, they require assunlptions that potentially misrepresent the value of an investment. One of the most problematic assumptions is the assumption about the discount rate for each project. Some companies apply a very high discount rate to reflect reality and many others use only a single rate derived from the capital asset pricing model (CAPM) for all projects, despite their different riskiness. Since one R&D project in this industry can take as long as 10 to 15 years, "the positive cash flows are severely dis~ounted"~ and management may be deceived by a low or even negative NPV.
More importantly, NPV is likely to ignore the managerial flexibility which might exist during the life of a project. A project, once initiated, can be changed or stopped a t any time, as managers always have to answer the question of "should we continue to invest?"
Discussion of growth opportunities can be found in Brealey and Myers [I]. S t a t e d by Judy Lewent in an interview with Harvard Business Review [17].
Copyright © by ORSJ. Unauthorized reproduction of this article is prohibited.
Real Options 389
Also, R&D for a new drug, if successful, often contains the potential to engage in subsequent projects that develop future generations of related products, which promises a sequential stream of revenue. The traditional NPV method assumes management's passive commit- ment to a certain operating strategy, e. g. to initiate the project immediately, and operate it continuously a t a set scale until the end of its pre-specified expected useful life. The embed- ded future opportunities are not included in the NPV of many project managers, although some with their managerial experience and intuition see the "somewhat powerful value" of the project. Sometimes they might accept a low NPV project for a strategic reason based on a non-quantitative approach.
"Since market and technology uncertainties change expectations about the viability of many projects, the value of projects is frequently adjusted during the R&D stages" [I l l . If the traditional NPV method cannot capture management's right to make adjustments, then highly risky R&D projects might be undervalued. Waiving investment into these projects could mean waiving profit for the company.
There remains a void in the literature on empirical evaluation of specific and real R&D projects in various industries. In this article, by estimating the value of an ongoing R&D project in a Japanese pharmaceutical company, we hope to bridge the gap between theory and practice.
3. Model Presentation 3.1. Model selection To value real options, some of the models that were initially developed for financial options are often used. Both the Black-Scholes model and the Binomial Tree model are frequently used to value Real Options. In this paper, we evaluate the R&D options using a Binomial model. Lint and Pennings [12] suggest use of the Binomial model since the events and information that may affect the value of a project only arrive a t discrete points in time. In addition, the Binomial TYee is flexible and applicable to a broad range of options. The model is appealing to practitioners because of its simplicity and ease in implementation. Also, should information arrive almost continuously, a sufficiently large number of time steps will approximate the option price in the discrete-time approach corresponding to that obtained under the continuous time scale. Cox, Ross and Rubinstein have proved that, as the number of steps increases, the option value resulted from a Binomial Tree will converge to its Black-Scholes value [3]. 3.2. Binomial model In this paper, we use the binomial model that was first introduced by Cox, Ross and Rubinstein [3] . In the article, they argue that, because the option value is independent of the investor's risk preference, it will remain the same even when everything is placed in a risk-neutral environment. The risk-neutral approach simplifies the calculation method by eliminating the need to estimate the risk premium because everyone is indifferent to risk. To obtain the option value, first, a n-step Binomial tree that spans the option life T is constructed by setting the step length At as,
During the first period, the value of the underlying asset S can take either an upward movement to Su or an downward movement to Sd . Cox, Ross and Rubinstein [3] set the probability of an upward move to
e^ - d '= u - d
Copyright © by ORSJ. Unauthorized reproduction of this article is prohibited.

N. T. Trang, N. Takeza wa & N. Takezawa
S Sud
Figure 1: Binomial model: Original model introduced by Cox, Ross and Rubinstein [3]
and the probability for a downward move to (1 - P). The value of u and d are calculated as
so that u d = 1. Note o- is the volatility of the underlying asset S, T is the life of the project, At denotes the step size, and r is the riskfree rate. In the second period, there are three possible outcomes: Su2, S and Sd2. The process is illustrated in Figure 1 until time step 3. In general, a t time step j (for j = 0, 1, . . . , n), there are j + 1 possible outcomes for the underlying asset S j k = S ~ j - ~ d j with state k = 0,1, . . . , j .
In the context of R&D options for this paper, the underlying asset S is defined to be the present value of the cash flow generated from the pharmaceutical drug product. This value can take different up- or downside movements from the beginning until the end of the project depending on differing market demand conditions for the product.
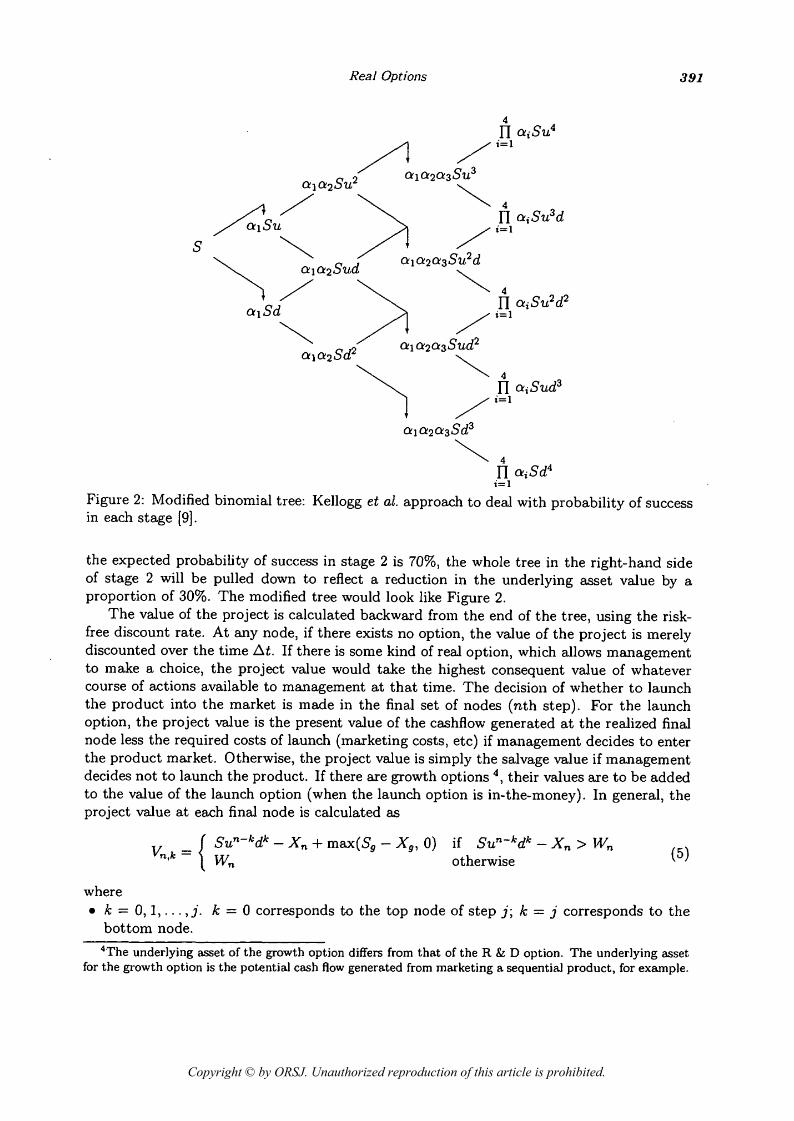
Since each R&D project is a unique stand-alone project and specific to a certain company, there is the possibility of unique project risk. Following Kellogg et al. [9] and Jagle [8], we capture the unique risk element through a sequence of technical success probabilities. The success or fail uncertainty a t a certain phase is resolved only after the decision to go on to that phase has been made, in this way it reduces the flexibility in subsequent stages and thus decreases the total value of the real options [6]. We denote unique risk as the Greek letter a. Many companies have a database of project histories that provides a good estimate of success probabilities. Others determine the success probabilities for each step of the development process based on their intuition and experience.
In this article, we assume that the variability of the probability of success is negligible when compared to the future market value of the project. We will refer to the "probability of success" as the expected probability of success for each stage of the development process. Following Kellogg et al. [9], we allow the probability of success in each stage to pull the standard binomial tree down a proportion equal to the probability ratio. For example, if
Copyright © by ORSJ. Unauthorized reproduction of this article is prohibited.
Real Options
Figure 2: Modified binomial tree: Kellogg et al. in each stage [9].
approach to deal with probability of success
the expected probability of success in stage 2 is 70%) the whole tree in the right-hand side of stage 2 will be pulled down to reflect a reduction in the underlying asset value by a proportion of 30%. The modified tree would look like Figure 2.
The value of the project is calculated backward from the end of the tree, using the risk- free discount rate. At any node, if there exists no option, the value of the project is merely discounted over the time At. If there is some kind of real option, which allows management to make a choice, the project value would take the highest consequent value of whatever course of actions available to management at that time. The decision of whether to launch the product into the market is made in the final set of nodes (nth step). For the launch option, the project value is the present value of the cashflow generated a t the realized final node less the required costs of launch (marketing costs, etc) if management decides to enter the product market. Otherwise, the project value is simply the salvage value if management decides not to launch the product. If there are growth options 4, their values are to be added to the value of the launch option (when the launch option is in-the-money). In general, the project value a t each final node is calculated as
Sun-Qk - Xn + rnax(Sg - X,, 0) if Sun-V' - An > Wn Vn,k = otherwise
where 0 k = 0,1,. . . , j. k = 0 corresponds to the top node of step j ; k = j corresponds to the
bottom node.
"The underlying asset of the growth option differs from that of the R & D option. The underlying asset for the growth option is the potential cash flow generated from marketing a sequential product, for example.
Copyright © by ORSJ. Unauthorized reproduction of this article is prohibited.

392 N. T. Trang, N. Takezawa & N. Takezawa
So is the cashflow generated from the growth option. Xg is the required strike price for the growth option. Xn is the required strike price for the market launch decision. Wn is the salvage value of the project if management decides not to launch the drug. The decision made at a certain node j, k # n (other than the final set of nodes) is done
by looking at the value of the project a t that node, where there is an abandonment option defined as
where j = 1 ,2 , . . . , n - 1. j represents the year or step number of the tree. k = 0,1, . . . , j. k = 0 corresponds to the top node of step j ; k = j corresponds to the bottom node. V J k is the value of the options at node (j , k). X j is the required investment installment (R&D expenses, etc.) a t step j . a, is the probability that the project will go successfully through year j . Wj is the salvage value of the project if management decides to stop it at time j Note the abandonment option differs from the option a t the final set of nodes defined
in Equation(5). At earlier nodes, management decides to move on if S is larger than the required investment installments as opposed t o market launch expenses (final nodes). In short, we assume and model three options: (1) a series of abandonment options throughout the R&D process, (2) a product launch option, and (3) a growth option.
4. A Case Study at Nihon Schering 4.1. Project evaluation at Nihon Schering Background information in this section was partly obtained from the company's web site and partly through interviews with Nihon Schering's project managers. In this part, we evaluate a project currently in the research and development process a t Nihon Schering. To maintain confidentiality, this project is referred to as project Y throughout the paper. The readers should also be reminded that the figures in this section are stylised and some other details are disguised to maintain confidentiality5. Moreover, arguments presented do not necessarily represent the reality and the conlpany's standpoint on research and development activities at a particular time.
Nihon Sohering is a Japanese subsidiary owned 100% by Schering Group. Research and development projects are united globally among members of the group under control from the headquarters based in Berlin, Germany. Normally, Schering runs many different R&D projects simultaneously. During the life of each project, which often takes about eight to twenty years, the company has a number of decision points at which it could make major changes to the development process. A common R&D process consists of eight different decision making points (notation: P). In the first step (PO), scientists in laboratories make a proposal to a project committee in order to get the approval of the necessary funds to search for new chemical compounds. After this approval, if certain con~pounds have proved some medical effects, they become the candidates that will go through pre-clinical research
51n this particular case, the data is normalized, meaning the raw data is altered by the same scale. The results of the calculation, however, remain valid for both the real and the norrnalised data.
Copyright © by ORSJ. Unauthorized reproduction of this article is prohibited.

Real Options
P2 I Pre-clinical (1 year)
P3 90% sucres r- Phase I (1 year)
P4 70% success Phase II (5 years)
P5 70% success Phase 111 (5 ycarsi
P6 95% success - Submission (1 year)
P7 v Launch
4 4 Total: 13 years
Figure 3: Process for project Y, starting from pre-clinical research
study. In pre-clinical research (step P2), the chemical compound is tested on animals and tissue cultures to determine its effects. If the candidate shows promises of being safe and effective in treating a certain disease, the company can file an Investigational New Drug Application with the governmental authority. Once the proposal is approved, development stages can take place through three phases of clinical study. Submission (P6) and launch (P7) can be done only after the drug successfully passes through all clinical studies.
Steps PO and Pi are called research and the steps from P2 through P7 are called develop- merit. Most of the R&D activities a t Nihon Schering are mainly involved in the development process, that is, the clinical studies of the profiled chemical compounds starting from P2. Thus, the cost-effect relationship of a project is measured only from P2 onward. Figure 3 shows the process of a development project at Nihon Sobering, project Y, with the average probability of success for each phase (believed to be reasonable based on past experience and specific characteristics of project Y)6. According to management's belief, the project would take a total of 13 years to finish.
To value a project financially, the company values the project's NPV based on the traditional NPV method. Starting from P2, a project's NPV is calculated every year, with cash flows discounted annually using a discrete discount rate of 13%' the uniform opportunity cost of capital for the Schering Group. Valuation is based on all information in the past and expectations for the future. Due to new conditions and new beliefs, NPV can fluctuate drastically year after year. When the NPV is recalculated, the previous NPV of the same project becomes irrelevant.
Although NPV is not the only criterion for decision making, a positive NPV would justify a request for management's approval. When calculating NPV, probability of success for each phase is not taken into consideration. 4.2. Evaluation of project Y In the beginning of year 1999, a project team evaluated the net present value of project Y mentioned above. Year 1999 is the eighth year of the project, where the drug has just passed Phase 11. Phase 111, therefore, is expected to start from the beginning of this year and last for five years. Submission will follow and the launch of the product is expected in year 2005. Initial revenue is assumed to be generated in year 2006. Expected sales under the Nippon Health Insurance (NHI) prices were projected for 20 years, beginning in year 2006. In Japan, the NHI price is the price patients or end consumers pay to hospitals or pharmacies, and is determined by the Japanese ministry of health and can be regarded as
6Generally, research, conducted in laboratories, has a higher failure ratio. In other words, the probability that a certain chemical compound has no useful pharmacological effects is smaller in the development period.
Copyright © by ORSJ. Unauthorized reproduction of this article is prohibited.

394 X T. Trang, N. Takezawa & N. Takezawa
a retail price7. Distribution margin, costs of good sold and distribution costs are to be deducted from the expected sales to obtain net income before tax. To get the continuous compounding discount rate corresponding to the discrete rate of 13%, we use the formula in Hull [7]
Re = ln(l + 0.13) w 12%. (7)
Missing from the above discussion of NPV methods is the notion of technical risk. The technical risk of any project is theoretically a source of uncertainty. This risk or uncertainty is reflected in the success probability. A series of success probabilities for each stage of the development process should be unique to a certain project and can be estimated only by people who understand the technicality of the project itself. We believe the company has overlooked the importance of the success probabilities. However, to launch and obtain the income from the drug, the company needs to successfully pass all remaining clinical tests in addition to the approval process required by the Japanese government. Since each test holds a certain risk, the risk must enter into the equation to reflect the true value of the expected income. The probabilities used in our paper were estimated and provided by the managers a t Nihon Schering K.K.
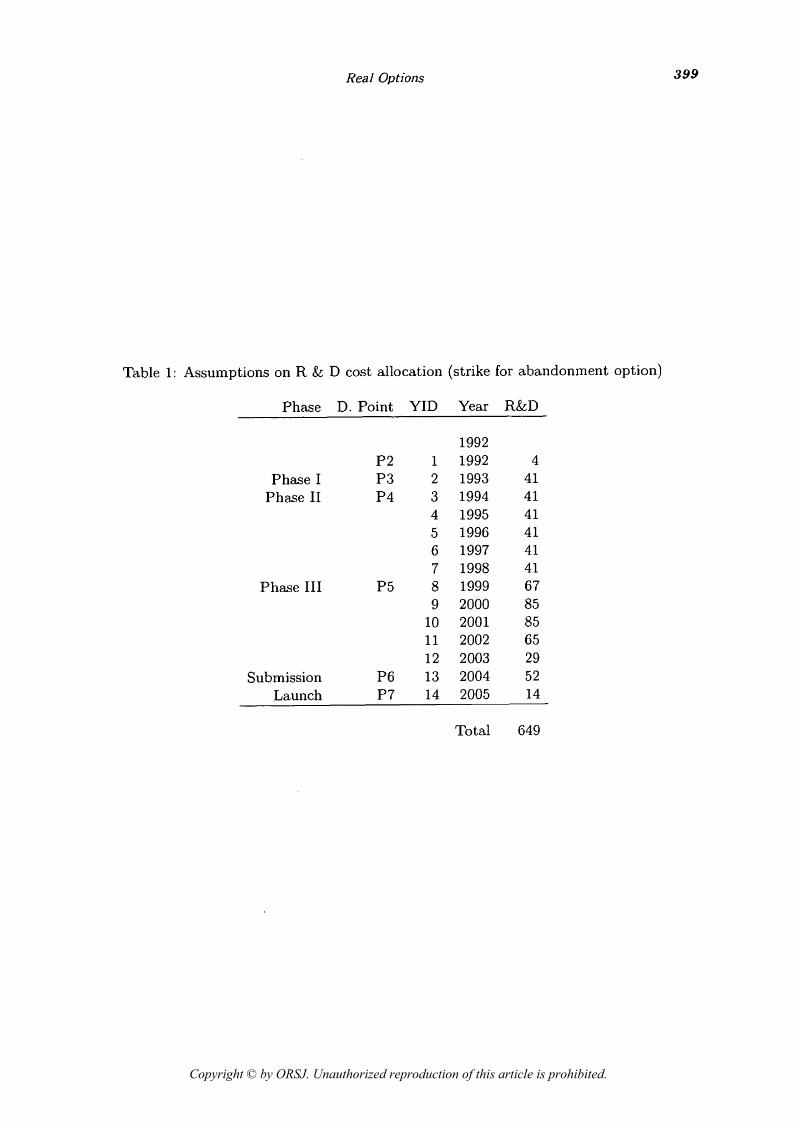
It is tempting to see what project Y's value was seven years ago, in year 1992, when it was initiated. We assume that costs from 1992 to 1999 were allocated as presented in Table 1 and other expectations were exactly the same as in year 1999. Net income each year is discounted continuously under the annual discount rate of 12%. According to Table 2, project Y's NPV in the beginning of the pre-clinical stage, year 1992, is -91 million yen.
We do not have the specific details on how the company evaluated project Y in order to determine the initiation of the pre-clinical phase. But according to our NPV evaluation, the project should have had a negative value at its initiation. What can we conclude from this? If all future expectations in the past were the same as the future expectations made this year, the project team should have stopped the project right from the outset according to our NPV analysis. But is the project really worthless as being suggested by traditional net-present value approach? Did the project team really make the wrong decision to go on to further invest in year 1992? 4.3. Evaluation of project Y with real-options embedded Every year, the project team holds a meeting to review the ongoing project and decides whether to continue the project or not. This implies that project Y contains a sequence of real options. The real options follow one after another and each lasts for one year. In other words, each year of the development process is followed by one real option on the subsequent phases of the development process. For instance, the success of development in year z offers the right but not the obligation to go further in year z + 1 of the development process. The last option is called a launch option, which specifies the right, but not the obligation to pay certain marketing expenses in order to launch the drug that is going to be approved by the government. "Exercise of the options at any stage depends on management's assessment of the future profitability of the end-product concerned" [8].
Furthermore, the development process of drug Y provides the right but not the commit- ment to further develop a series of other drugs that are similar to drug Y, say, Yl , Y2, Y3. Depending on the quality of drug Y and the promised income generated from Yl,Y2 and Y3, management will decide whether to invest into further development of the subsequent drugs Yl , Y2 and Y3. Since management does not have to make the decision now, it is
his is also used to calculate the insurance coverage.
Copyright © by ORSJ. Unauthorized reproduction of this article is prohibited.

Real Options 395
an option, and since it includes the value of sequential products of Y, it is called a growth option. Assumptions
Expectation of the project time-line, success probability and expected sales remains the same as in the NPV valuation. Project Y holds 13 abandonment options, each starts one year after another and lasts for one year. The options can be exercised only a t maturity, thus they can be classified as European options. At the end of the project, if the drug Y successfully gets the approval from the govern- ment, there exists a growth option which allows Nihon Schering to do further study for a sequence of drugs similar to Y. Here, we assume that the cash flow from the growth options (that is, from drug Y l forward) is equal to 30% of the total cash flow of drug Y, while the strike price, or the R&D costs required for the project would be only one tenth of the total costs spent for the initial drug.
Value of the input variables The underlying asset value S is equal to the present value of sales from year 2006-2025, net of the present value of distribution margin and the present value of costs of goods sold, which gives S = 416 - 73, which is equal to 343 million yen. The strike price of each abandonment option equals the required R&D expenses that management needs to approve each year. The annual amount of strike price X can be found in the Table 1 of the Appendix. According to Lint [lo], the risk-free rate of interest can be set equal to a government bond with the same time to maturity as the R&D option examined. In this paper, the risk-free rate of interest r is set at 6%. This is the Treasury-bill rate over a one year period. Later on, in Section 4.4, we conduct sensitivity analysis on project value for a range of r . The salvage value of the project is equal to 1% of the underlying asset value. That means, at any time from year 2 onward, if management decides to stop the project, the learning, the information and all other tangible and intangible values of the project sum up to 1% of the underlying asset value at that time. Since we consider technical uncertainty as the probability that the change of the project value encounters a t each branch of the tree, volatility a should measure the variability of project cash flow assuming 100% success in all phases of development. We derive the implied volatility by looking a t the worst possible value of expected cash flow after thirteen years. More specifically, we assume that after successfully passing all stages of the development process, if the market condition changes so that management decides not to launch the drug, then the project value drops to its salvage value, which is 1% of the expected revenues at that phase. In our binomial-tree model, the worst-case value is equivalent to the value a t the bottom-right corner of the tree. Given all probabilities equal 1, this is equivalent to Sd^ (refer to Figure 2). Thus, we can calculate the implied volatility as
should be noted that all variables describing the behavior of the drug value is empirically obtained from Nihon Schering K.K.
Copyright © by ORSJ. Unauthorized reproduction of this article is prohibited.

396 N.T. Trang, N. Takezawa & N. Takezawa
A volatility level of 30% to 40% is said to be common for the pharmaceutical industry. A number of scholars including Kellogg et al. [9] and Perlitz et al. [19] obtained similar values. We also conduct sensitivity analysis to inspect the sensitivity of the project value against changes in a. The probability of success for each phase is the probability specified in Figure 3.
Following the model and equations presented in Section 3, we calculate the value of project Y at the beginning of 1992 in Table 3. In each step there is a horizontal line below which abandonment options would be exercised, or in other words the project should be stopped for its salvage value. According to Table 3, Y has a value of 6 million yen, with abandonment and growth options embedded. The strike price of the growth option Xg is assumed to be 70 that is 10% of the total base-case R & D costs and the underlying asset value of the growth option Sg is assumed to be 103 that is 30% of the base-case underlying asset. Perhaps it is worthwhile to note here that other valuable options, such as options to defer investment or installment for a certain phase in the project, options to change scale, options to alter direction , etc. , have not been taken into account. If project Y embraces more real options other than the above default and growth options, Y should be more valuable than 6 million yen.
As we mentioned above, neither the NPV nor the real-option value may reflect the exact value of project Y. However, one should notice the difference between the two valuation methods. The value of project Y is worth much more under the real-options valuation method than under the NPV method. This difference comes from the recognition of valuable managerial flexibility. All other things being equal, a project that allows management to make adjustments to capture higher profit or avoid unnecessary costs should be valued higher than a project that requires rigid commitment. 4.4. Sensitivity analysis As our valuation is based on certain assumptions, sensitivity analysis of those assumptions are useful. It allows managers to stimulate their beliefs and assists them in their decision making.
In this section, we vary the value of volatility, risk-free rate of interest and the level of the salvage value to examine the sensitivity of the value of project Y against the value of these three input parameters. Figure 4(a), (b) and (c) summarize the range of the final value due to the changes in these parameters. As we can see, project Y is worth nothing if the volatility is less than 0.3 or if the risk-free rate of interest is less than 3.5%. In addition, if there is no learning, or if the salvage value is zero, then the project value is reduced to 4 million yen.
5. Implications For most cases, project evaluation takes into account many different factors other than just the net-present value. For instance, suddenly stopping a product can have an adverse effect on the relationship with patients and customers (the drug-administering hospitals). Thus, the decision should be driven by strategic commercial implications rather than pure financial logic, and by long-term concerns as opposed to short-term.
However, with the illustration presented above, we have shown that a "real-life" project actually can be quantitatively valued under the "real-option" methodology. We have also shown that, by taking the value of managerial flexibility into account, the real-option based methodology does capture the shortcoming of the traditional NPV method and thus pro- duces more reliable results for management in the decision making process.
Copyright © by ORSJ. Unauthorized reproduction of this article is prohibited.

Real Options 397
Project. value (million yen)
30 r Project value (million yen) Project value (million yen)
8 r
4 , 1 t I
0.0 0.5 1.0 1.5 2.0
Risk-neutral vola.t.ility Risk-free ra t:c of interest Salvage value arbi t rary l i i~ i r s ) (%) (%. of underlying asset value)
Figure 4: Sensitivity of Y against the value of the risk-neutral volatility, risk-free rate of interest and salvage value
The real options theory does not create the value of managerial flexibility, but it rather identifies the managerial flexibility, which has been long time acknowledged as valuable. The real-options approach allows us to quantitatively measure this flexibility. Since R&D projects in the pharmaceutical industry are long lasting, costly and involve cooperation from a large number of people, we believe that quantitative measurement is necessary. It provides greater insight and thus a benchmark not available through a purely qualitative argument. This quantitative measurement, once being set up as a company-wide standard, can con- tribute to the transparency of the decision making process and enhance communication among different functional departments within the company.
The binomial tree offers many advantages for evaluation in the pharmaceutical industry because it is simple, straightforward and easy to apply. In addition, the binomial tree method reflects the structure of the decision making process and the information revelation process of the project. More sophisticated aspects may be added to the model in order to reflect reality of the project development. However, one will always face the trade-off between the level of realism and the cost associated with it, i.e. the more complicated the model, the more time-consuming and costly the process becomes. Management needs to determine the level of accuracy that needs to be satisfied.
With the many changes in regulations recently and the expansion in operating scale of foreign pharmaceutical companies, competition has become more severe, forcing companies to change. The recent trend of merger and acquisition in this industry also indicates the importance of R&D, i.e., investing intensively in R&D is the only way to survive in the future. When investment increases in scale, the evaluation of investment opportunities becomes more critical.
Being an affiliate of a global pharmaceutical company, Nihon Schering is closely depen- dant on the decision making of the parent company. However, although the final decision is made a t headquarters, it is based on specific information from the local country. Local project teams a t Nihon Schering review their Japan projects on a yearly basis. If a cer- tain project proves to be detrimental for the company, the project team can propose to headquarters not to proceed.
Estimation of expected cash-flows or expenses could be complex, especially in cross-
Copyright © by ORSJ. Unauthorized reproduction of this article is prohibited.
398 N. T. Trang, N. Takezawa & N. Takezawa
border projects. Applying real-options evaluation to projects would help enhance the trans- parency of the decision making process and the communication between the parent and its affiliates. I t is also worth emphasizing that the risk associated with a drug development project is corporate specific unique risk.'
The empirical research conducted on the R & D projects in the pharmaceutical industry has confirmed the fact that real option evaluation proves to be effective in compensating the shortcoming of the net-present-value analysis even in the Japanese market1'.
Acknowledgment The authors thank Norio Hibiki, editor of the special issue, Ushio Suinita, Soichiro Moridaira, and the two anonymous referees for their insightful comments and encouragement. We are especially grateful to Nihon Schering for their support on this project.
Appendix Notation Abbreviations used in the tables should be read as follows: Sales refer to Sales using NHI prices. YID refers to Year in Development. DM is Distribution Margin, that is the percentage of Sales at NHI paid to distributors. N. Sales is Net Sales, equals Sales at NHI net of Distribution Margin. PVNS is the Present Value of Net Sales. COGS is Costs of Goods Sold. G. Profit is Gross Profit, equals Net Sales minus Cost of Goods Sold. PVGP is the Present Value of Gross Profit. D. Mkt is the Direct Marketing costs. PMS is the cost for Post Marketing Surveillance, which includes adverse reaction reporting
of the drug being sold. MR is the cost associated with the activities of Medical Representatives. Distr. refers to Distribution costs, which equal the sum of Direct Marketing costs, PMS
costs and MR costs. R&D is the cost of research and development of the drug. Op. Ex. refers to Operating Expenses, which are the sum of Distribution costs and R&D
costs. PVOE is the Present Value of Operating Expenses. NPV99 is the net-present value of project Y valued in year 1999. prob. is the expected probability of success in each period. NPV92 is the net-present value of project Y valued in year 1992.
In addition, in the following tables: 0 All discounting continuously compounded, based on an annual rate of 12%. 0 Net Present Value of the underlying asset is the Net Income before Income tax. 0 All figures are in million yen unless specified otherwise.
^art of this risk may not be replicated via tradable securities. In this paper, however, the risk is unique to the project (often referred to as private risk). Smith and Nau [21], for example, have provided some insights on the issue, yet further research to clarify these issues is still required .
"Such analysis has been used by overseas corporations such as Eli Lilly, Merck and Genentech. (Real Options Group Academic Conference 2001 held a t UCLA ( LA, CA, USA))
Copyright © by ORSJ. Unauthorized reproduction of this article is prohibited.
Real Options
Table 1: Assumptions on R & D cost allocation (strike for abandonment option)
Phase D. Point YID Year R&D
1992 P2 1 1992 4
Phase I P 3 2 1993 41 Phase I1 P4 3 1994 41
4 1995 41 5 1996 4 1 6 1997 4 1 7 1998 4 1
Phase I11 P 5 8 1999 67 9 2000 85
10 2001 85 11 2002 65 12 2003 2 9
Submission P6 13 2004 5 2 Launch P7 14 2005 14
Total 649
Copyright © by ORSJ. Unauthorized reproduction of this article is prohibited.

Tab
le 2
: P
roje
ct Y
's v
alue
at
the
begi
nnin
g of
the
dev
elop
men
t pr
oces
s: Y
ear
1992
Ph
ase
Sale
s at
NI-1
1 D
M
Net
Sal
es
PVN
S C
OG
S G
.Pro
fit
PV
GP
D
istr
. R
&D
O
per.
Ex.
Pr
ob.
PV
OE
N
PV92
Pr
e-C
l. 19
92
0 -4
-4
10
0%
-4
Phas
e I
1993
Ph
ase
I1
1994
19
95
1996
19
97
1998
Ph
ase
111
1999
20
00
2001
20
02
2003
Su
bmis
sion
20
04
Lau
nch
2005
Sa
les
2006
20
07
2008
20
09
2010
20
11
2012
20
13
2014
20
15
2016
20
17
2018
20
19
2020
20
2 1
2022
20
23
2024
20
25
Copyright © by ORSJ. Unauthorized reproduction of this article is prohibited.

Real Options
Table 3: The binomial tree of project Y's value with real options embedded
Upper values: underlying asset Lower values: option value Underline: threshold of exercise boundary
Strike: 4 41 41 41 4 1 41 4 1 67 85 85
Phase : I I1 I l l 29 52 14
Subm. Launch?
Copyright © by ORSJ. Unauthorized reproduction of this article is prohibited.
N. T. Trang, N. Ta keza wa & N. Takeza wa
References
[I] R. A. Brealey and S. C. Myers: Principles of Corporate Finance, 6th edition (Mcgraw- Hill, 2000).
[2] T. Copeland and P. Keenan: Making real options real. The McKinsey Quarterly, 2 (1998) 38-49.
31 J. C. Cox, S. A. Ross, and M. Rubinstein: Option pricing: A simplified approach. Journal of Financial Economics, 7 (1979) 229-263.
[4] R. Geske: The valuation of compound options. Journal of Financial Economics, 7 (1979) 63-81.
[5] S. D. Howell, A. Stark, D. P. Newton, D. A. Paxson, and M. Cavus: Real Options, An Introduction for Executives, volume 1 (Pearson Education Limited, UK, 2001).
[6] A. Huchzermeier and C. H. Loch: Project management under risk: Using the real options approach to evaluate flexibility in R&D. Management Science, 47 (2001) 85- 101.
[7] J . C. Hull: Options, Futures and Other Derivatives (Prentice-Hall, NJ, 2000). [8] A. J. Jagle: Shareholder value, Real options, and innovation in technology-intensive
companies. R&D Management, 29 (1999) 271-287. [9] D. Kellogg and J. M. Charnes: Real-options valuation for a biotechnology company.
Financial Analysts Journal, 56 (2000) 76-84. [lo] 0 . Lint: Retrospective insights from real options in R&D. WWW Page. Eindhoven
Centre for Innovation Studies. Working paper, Sept. (2000). [ll] 0. Lint and E. Pennings: R&D as an option on market introduction. R&D Management,
28 (1998) 279-287. [12] 0 . Lint and E. Pennings: An option approach to the new product developnlent process:
A case study a t Philips Electronics. R&D Management 31 (2001) 163-173. [13] D. P. Newton and A. W. Pearson: Application of option pricing theory to R&D. R&D
Management 24 (1994) 83-89. [14] Interviews with project manager a t Nihon Schering K. K., conducted in February-
March, 2001. Conducted a t the company's headquarters. Osaka, Japan, Mar. 2001. [15] Interviews with financial manager a t Dainabot Co., Ltd. Conducted a t the company's
headquarters. Osaka, Japan, Feb. 2001. [16] Interview with sales manager a t Pfizer Inc. Conducted at International University of
Japan. Niigata, Japan, Feb. 2001. [17] N. A. Nichols: Scientific management at Merck: An interview with CFO Judy Lewent.
h a r d Business Review 72 (1994) 89-105. [l8] E. Pennings and 0. Lint: The option value of advanced R&D. European Journal of
Operational Research, 103 (1997) 83-94. [19] M. Perlitz, T. Peske, and R. Schrank: Real options valuation: The new frontier in R&D
project evaluation? R&D Management 29 (1999) 255-269. [20] A survey of the pharmaceutical industry. The Economist Special edition , Feb. (1998)
3-16 . [21] J. E. Smith, R. F. Nau: Valuing risky projects: Option pricing theory and decision
analysis. Management Science, 4 1 (1995) 795-81 6. [22] L. Trigeorgis: Real Options-Managerial Flexibility and Strategy in Resource Alloca-
tion. (The MIT Press, Cambridge, 1996).
Copyright © by ORSJ. Unauthorized reproduction of this article is prohibited.

Real Options
Naoya Takezawa School of International Management International University of Japan Yamato-machi, Minami Uonuma-gun Niigata, Japan 949-7277 E-mail: ntakezawQiu j . ac . jp
Copyright © by ORSJ. Unauthorized reproduction of this article is prohibited.