real estate markets in asia before/after the subprime crisis vs government macro economy tools by...
TRANSCRIPT

Real Estate Markets in Asia before/after tReal Estate Markets in Asia before/after the Subprime Crisis vs Government Macrhe Subprime Crisis vs Government Macr
o Economy Tools o Economy Tools
ByBy
Dr. Cheng-Few LeeDr. Cheng-Few Lee
Distinguished Professor, Rutgers University, USA Distinguished Professor, Rutgers University, USA
Distinguished Professor, National Chiao Tung University, TaiwanDistinguished Professor, National Chiao Tung University, Taiwan
Editor, Review of Quantitative Finance and AccountingEditor, Review of Quantitative Finance and Accounting
Editor, Review of Pacific Basin Financial Markets and PoliciesEditor, Review of Pacific Basin Financial Markets and Policies
Outline Outline
1.1. IntroductionIntroduction
2.2. Subprime Crisis Subprime Crisis
3.3. Securitized mortgaged creditSecuritized mortgaged credit
3.1 Benefits of mortgage securitization3.1 Benefits of mortgage securitization
3.2 The dark side of mortgage securitization3.2 The dark side of mortgage securitization
4.4. Government Macro Economy ToolsGovernment Macro Economy Tools
5.5. SummarySummary

Figure 1Figure 1 :: Federal Funds RateFederal Funds Rate
The federal funds rate published for April 30, 2010, should have been 0.20 The federal funds rate published for April 30, 2010, should have been 0.20 SourceSource :: US Federal Reserve Board, May 2008US Federal Reserve Board, May 2008
0
1
2
3
4
5
6
7
2000
2001
2002
2003
2004
2005
2006
2007
2008
year
%

Figure 2-1Figure 2-1 :: Homeownership Rate Q1 2010 Homeownership Rate Q1 2010
The homeownership rThe homeownership rate declined to 67.1%. ate declined to 67.1%. This is the lowest leveThis is the lowest level since Q1 2000. l since Q1 2000.
Note: graph starts at 6Note: graph starts at 60% to better show the 0% to better show the change.change.
The homeownership rThe homeownership rate increased in the '90ate increased in the '90s and early '00s becauss and early '00s because of changes in demoge of changes in demographics and "innovatioraphics and "innovations" in mortgage lendinns" in mortgage lending. The increase due to g. The increase due to demographics (older pdemographics (older population) will probabopulation) will probably stick, so I've been ely stick, so I've been expecting the rate to dexpecting the rate to decline to the 66% to 67cline to the 66% to 67% range - and not all t% range - and not all the way back to 64% to he way back to 64% to 65%. 65%.
Source: Posted by CalculatedRisk on 4/26/2010 10:00:00 AM at http://www.calculatedriskblog.com/2010/04/q1-2010-homeownership-rate-lowest-since.html

Figure 2-2Figure 2-2 :: Homeownership Rate Q1 2010Homeownership Rate Q1 2010
The homeowner vacaThe homeowner vacancy rate was 2.6% in ncy rate was 2.6% in Q1 2010.Q1 2010.
A normal rate for receA normal rate for recent years appears to be nt years appears to be about 1.7%. about 1.7%.
This leaves the homeoThis leaves the homeowner vacancy rate abowner vacancy rate about 0.9% above normal. ut 0.9% above normal. This data is not perfecThis data is not perfect, but based on the appt, but based on the approximately 75 million roximately 75 million homeowner occupied homeowner occupied homes, we can estimathomes, we can estimate that there are close te that there are close to 675 thousand excess o 675 thousand excess vacant homes.vacant homes.
Source: Posted by CalculatedRisk on 4/26/2010 10:00:00 AM at http://www.calculatedriskblog.com/2010/04/q1-2010-homeownership-rate-lowest-since.html

Figure 2-3Figure 2-3 :: Homeownership Rate Q1 2010Homeownership Rate Q1 2010 The rental vacancy rate The rental vacancy rate
was 10.6% in Q1 2010.was 10.6% in Q1 2010.
It's hard to define a "normIt's hard to define a "normal" rental vacancy rate basal" rental vacancy rate based on the historical series, ed on the historical series, but we can probably expebut we can probably expect the rate to trend back toct the rate to trend back towards 8%. According to twards 8%. According to the Census Bureau there arhe Census Bureau there are close to 41 million rental e close to 41 million rental units in the U.S. If the rentunits in the U.S. If the rental vacancy rate declined fral vacancy rate declined from 10.6% to 8%, there woom 10.6% to 8%, there would be 2.6% X 41 million uld be 2.6% X 41 million units or over 1 million uniunits or over 1 million units absorbed. ts absorbed.
This suggests there are stilThis suggests there are still about 1.7 million excess l about 1.7 million excess housing units, and these ehousing units, and these excess units will keep pressxcess units will keep pressure on housing starts, renture on housing starts, rents and house prices for soms and house prices for some time. e time.
Source: Posted by CalculatedRisk on 4/26/2010 10:00:00 AM at http://www.calculatedriskblog.com/2010/04/q1-2010-homeownership-rate-lowest-since.html

Figure 3Figure 3 : : TTrend and Forecast rend and Forecast of U.S. House Pricesof U.S. House Prices
SourceSource :: S&P/Case-Shiller Indices S&P/Case-Shiller Indices [8][8]
[8][8] 20082008 年至年至 20122012 年之走勢預測係根據芝加哥期貨交易所年之走勢預測係根據芝加哥期貨交易所 (CME)(CME) 房價指數期貨報價。房價指數期貨報價。
020406080
100120140160180200
1987
1989
1991
1993
1995
1997
1999
2001
2003
2005
2007
2009
2011
-15%
-10%
-5%
0%
5%
10%
15%
20%

Figure 4Figure 4 :: US Home sale annual rate (JanuaUS Home sale annual rate (January 2008 to May 2010)ry 2008 to May 2010)
Source: Bloomberg, Source: Bloomberg, CompiledCompiled by by Grand Cathay Securities CorporationGrand Cathay Securities Corporation
(Million units)
(Year)

Table 1: 2008-2010 Major financial eventsTable 1: 2008-2010 Major financial events
2008/1/22 The largest rate cut since October 1984 by the U.S. Federal Reserve.
2008/3/16 Shotgun wedding of Bear Stearns to J.P. Morgan for $2 a share, a bargain-basement $236.2 million. Federal Reserve bank to provide financing for the deal.
2008/7/14 Fannie Mae & Freddie Mac posted losses, stock prices both drop approximately 80%.
2008/9/15 Lehman expected to file for bankruptcy protection, the largest failure of an investment bank since the collapse of Drexel Burnham Lambert 18 years ago.
2008/9/17 Fed agreed to take over the insurance giant AIG, an unprecedented $US85 billion bail-out.

Table 1: 2008-2010 Major financial events (coTable 1: 2008-2010 Major financial events (continued)ntinued)
2008/10/3 The first $350 billion of TARP-Troubled Asset Relief Program was released. TARP is created to curb the ongoing financial crisis of 2007-2008. The TARP gives the U.S. Treasury purchasing power of $700 billion to buy up mortgage backed securities (MBS) from institutions across the country.
2009/3/9 The stock market plunged to a 12-year closing low: 6,547.
2009/3/23 The United States Federal Deposit Insurance Corporation (FDIC), the Federal Reserve, and the United States Treasury Department announced the Public-Private Investment Program for Legacy Assets. The program is designed to provide liquidity for so-called "toxic assets“ on the balance sheets of financial institutions.
2009/5/10/ Europe’s leaders finally passed The nearly $1 trillion bailout package, arranged over the weekend, is intended to head off Greece’s default and stop the crisis from dragging under other weak economies — Portugal, Spain, Ireland and Italy are all vulnerable.
2010/4/26 The stock market rose to a 54-week high: 11309

Figure 5Figure 5 :: 1934-2010 US financial market vs 1934-2010 US financial market vs bank failurebank failure
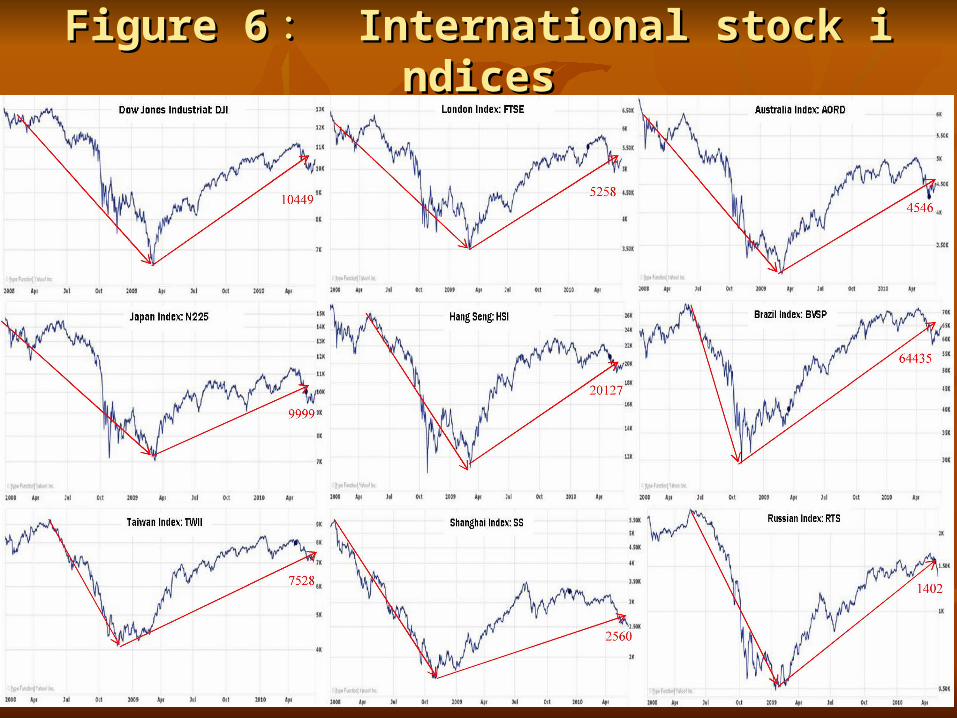
Figure 6Figure 6 :: International stock indicesInternational stock indices

Figure 7Figure 7 :: 2000-2010 Currency Marke2000-2010 Currency Markett

Figure 8Figure 8 :: GDPGDP

Figure 9Figure 9 :: 1980-2010 CPI1980-2010 CPI

Figure 10Figure 10 :: Outstanding level of US debtOutstanding level of US debt