real convergence and european integration
TRANSCRIPT

EUROPEAN INTEGRATION AND INCOME CONVERGENCELessons For Central And Eastern European Countries
Carmela Martín,
Francisco J. Velázquez,
and Bernard Funck
May 2001


iii
Contents
Foreword ........................................................................................................................................ ivAbstract ........................................................................................................................................... vAcknowledgements ........................................................................................................................viExecutive Summary ........................................................................................................................ 11. Economic Integration and Real Convergence: Survey of the Theoretical Literature ................ 32. Real Convergence: Measurement and Empirical Evidence ...................................................... 73. Real Convergence within the Eu: The Case of the Cohesion Countries .................................... 94. The Experience of the Central and Eastern European Candidates........................................... 235. Concluding Remarks ................................................................................................................ 29Methodological Appendix............................................................................................................. 30References ..................................................................................................................................... 33
Figures
Figure 1: Per Capita GDP at Current Exchange Rates, 1960-2000 ........................................ 7Figure 2: Per Capita GDP at PPS, 1960-2000........................................................................ 8Figure 3: Decomposition of Per Capita GDP Growth............................................................11Figure 4: Technological Spillovers, percent of GDP, 1996 ...................................................14Figure 5: Foreign Direct Investment Inflows, percent of GDP..............................................15Figure 6: Share of Technology Intensive Sectors ..................................................................16Figure 7: Telecommunication and Internet Infrastructure in July 2000.................................17Figure 8: CEEC and CIS Per Capita GDP at PPP: 1991-99, percent of EU average ...........22Figure 9: CEECs: Per Capita GDP at PPS: 1990-2000, compared to EU average ..............23
Tables
Table 1: Decomposition of GDP per Capita Growth, 1980-1998, percent ............................10Table 2: Endowments in Various Forms of Capital ...............................................................12Table 3: Cohesion Countries: Key Macroeconomic Indicators ............................................18Table 4: EU Budget – Net Balances with Member Countries, percent of GDP ....................19Table 5: CEECs: Labor Productivity in Industry, base year = 100.......................................22Table 6: CEECs: Sources of Technological Spillovers.........................................................24Table 7: CEECs: Factors Conducive to Real Convergence ..................................................25
iv
Foreword
The Poverty Reduction and Economic Management Unit in the World Bank’s Europe andCentral Asia Region has been undertaking a series of analytical works on issues pertinent to theeconomies in the region. These issues include transition issues; issues of economic integrationpertinent for the Central and Eastern Europe countries which are candidates for accession to theEuropean Union; poverty issues; and other economic management issues. The analytical workhas been conducted by staff of the unit and other Bank staff, as well as specialists outside of theBank.
This technical paper series was launched to promote wider dissemination of this analyticalwork, with the objective of generating further discussion of the issues. The studies published inthe series should therefore be viewed as work in progress.
The findings, interpretations, and conclusions are the author’s own and should not beattributed to the World Bank, its Executive Board of Directors, or any of its member countries.
Pradeep K. MitraSector Director
Poverty Reduction and Economic Management UnitEurope and Central Asia Region
v
Abstract
The prospect of enlarging the EU to Central and Eastern European countries with incomelevels far below those of present members is raising questions as to how and when thecandidates’ aspiration to converge towards EU standards of living could possibly be fulfilled. Toaddress this question, this paper seeks (i) to assess of the convergence experience of the four lessdeveloped EU members (i.e., Spain, Portugal, Ireland and Greece), after joining the EU, in thelight of recent analytical developments; and (ii) to explore what lessons can be learned from thatexperience which may be useful for the CEEC candidates.
The discussion suggests that, while theoretically possible, there is little empirical reason tofear that European integration would cause economies to diverge. Rather than beingspontaneous, however, real convergence would seem to depend crucially on the capacity ofcountries to tap international technological spillovers, particularly through foreign directinvestment. Macroeconomic stability, effective competition on goods and factor markets, and agood human capital endowment are essential to harness these benefits. Nonetheless, lingeringworries about the possibility that integration would lead to real divergence between countries orregions of Europe has led to the creation of large transfers under the EU’s Regional Policy.Pending more conclusive evidence of their effectiveness, the candidate countries would seemwise to put greater store by those domestic policies than by EU grants to fuel their convergence.
Acknowledgements
Carmela Martín ([email protected]) is the Director of the European Economy Groupat Universidad Complutense de Madrid and Head of Programme on European Studies atFUNCAS. Francisco J. Velázquez ([email protected]) is a member of the European EconomyGroup at the Universidad Complutense de Madrid and FUNCAS. Bernard Funck is a LeadEconomist in the Poverty Reduction and Economic Management Unit of the World Bank’sEurope and Central Asia Region. The authors wish to thank Bill Easterly, CostasMichalopoulos, Jerald Schiff, and Maurice Schiff as well as other colleagues for their insightfulcomments on an earlier draft. The view expressed in this paper remain theirs however, and donot necessarily reflect those of the World Bank.
1
Executive Summary
Standard international trade theory, based on neoclassical growth models, predicts thatthe lifting of barriers to trade and to the free movement of factors across countries not onlyenhances the general economic welfare of the integrating area as a whole, but would also causesincome per capita to converge among its member countries (real convergence). Recent growthand geography models have cast doubts as to the general applicability of these optimisticconclusions. Rather, these models suggest that, under certain circumstances (differences inproduction technologies, increasing return to scale, positive agglomeration externalities andtransport costs), economic integration may lead to an increasingly uneven spatial distribution ofeconomic welfare (real divergence). Compounding these theoretical uncertainties, a debate hasset in the empirical literature, as to the proper way to define and measure real convergence.When all is said and done, however, most of the theoretical and empirical literature leans in favorthe proposition that some form or the other of real convergence is the most likely outcome ofeconomic integration.
There is also widespread agreement that the integration of Europe led to substantialeconomic benefits for the European Union, as a whole. Lingering worries about the possibilitythat integration would lead to real divergence between countries or regions of Europe howeverconstitute the main rationale for the large transfers under the EU’s Regional Policy. Moreover,the prospect of enlarging the EU to Central and Eastern European countries (CEECs), withincome levels far lower level of development than that of present members, is raising questionsas to how and when the candidates’ aspiration to converge towards EU standards of living couldpossibly be fulfilled.
In this context, the main purpose of this study is (i) to assess of the convergenceexperience of the four less developed EU members (i.e., Spain, Portugal, Ireland and Greece),after joining the EU, in the light of recent analytical developments; and (ii) to explore whatconclusion could be inferred from that experiences that may be useful for the CEEC candidates.
The discussion suggests that, while theoretically possible, there is little empirical reasonto fear that European integration would cause economies to diverge. Rather than beingspontaneous, however, real convergence would seem to depend crucially on the capacity ofcountries to tap international technological spillovers, particularly through foreign directinvestment. Macroeconomic stability, effective competition on goods and factor markets, and agood human capital endowment are essential to harness these benefits. Pending more conclusiveevidence of their effectiveness, CEECs would be well advised to put more store by thosepolicies, than by EU grants, to fuel their convergence.
In discussing these points, we will begin (chapter 1) by summarizing what theory tells usabout convergence prospects, including what can be learned from the recent endogenous growthand new geography models. Then, in chapter 2, we will probe further measurement issues, offera critical survey of the most common methods used in empirical research, and highlights majorfindings. Against this analytical background, chapter 3 explores, first, the nature and trends ofreal convergence of the four less developed EU members using the measures proposed before

2
and, second, the explanatory factors that may account for their varying performances. Specialemphasis is placed on the role of different capital stocks, both physical and intangible. Chapter 4discusses the extent to which the experience of those EU member states is useful for the designof an appropriate strategy for the candidate countries from the CEECs, taking into account notonly the different catch-up experiences of the four cohesion countries, but also what we knowabout incipient trends among Central and Eastern European candidates. Finally, chapter 5 offerssome concluding remarks.

3
1. Economic Integration and Real Convergence: Survey of the Theoretical Literature
Broadly speaking, economic convergence in an area formed by different countries(regions) is understood to mean the increasing alignment of the economic variables considered,due to more rapid advances in the less favored countries (regions) than in the average of the area.Two types of economic convergence are usually considered: nominal and real. Nominalconvergence refers to the tendency towards a greater uniformity of nominal variables (thoseindicative of macroeconomic stability). Real convergence expresses the approximation of thelevels of economic welfare, generally proxied by per capita GDP1. This paper focused on realconvergence, and deals with nominal convergence only to the extent that it influences the latter.
Standard neoclassical growth models2 predict that open economies (i.e., countries,regions) should converge. Assuming that technologies are identical and exogenous, thedynamics of convergence rest on decreasing returns to scale to capital: countries (regions) withlow capital stocks and per capita income should have a higher marginal product and return tocapital. Consequently, opening up the country (region) –as happens in the framework of anintegration process- should trigger a convergence process, as capital should flow to capital-scarce countries (regions) to take advantage from higher returns. This should lead to more rapidcapital accumulation and faster growth in poorer countries (regions) than in rich ones. Alongwith capital/labor ratios, labor productivity and per capita income would then converge acrosscountries.
This line of reasoning has actually formed the basis of conventional theories of economicintegration developed since the pioneering work of Viner (1950).3 Thus, those models - sharingthe assumptions of neoclassical growth theory - generate a tendency for prices, costs, and incomelevels to converge, with trade and international factor mobility acting as the convergencemechanisms. This process of real convergence is further stimulated in the case of monetaryunion by the reduction of transaction costs (including the elimination of foreign-exchangeuncertainty) associated with trade and factor movements.
These standard conclusions have however been challenged. First, a number of authorshave pointed out that, the welfare effects of economic integration are more ambiguous (even inthe neo-classical setting) when, as in the case that occupies us (i.e., European integration), tradeopening is only partial and takes the form of preferential trading agreements (see Panagariya,2000). Obviously, the wider the preferential trading zone (e.g., with EU enlargement), the morelikely it is to approximate the effects of fully multilateral regime.
Furthermore, new models have emerged in the last fifteen years, notably under the aegisof the new growth theory, which (contrary to the neoclassical paradigm) do not predict thatincome convergence between rich and poor countries (regions) is the only possible outcome of 1 Martín and Velázquez (2001) argue that per capita GDP has some shortcomings as a proxy for economic welfare.In this sense, they propose the use of other complementary variables that can somehow capture the differences inincome inequality. However they also admit that they are difficult to put into practice, due to the paucity ofinternationally homogenous income distribution data.2 As in Solow (1956) and his following versions, for example Mankiw, Romer, and Weil (1992).3 Hine (1994) and Baldwin and Venables (1995) offer revisions of the theory and summarize the results of the mainempirical studies.
4
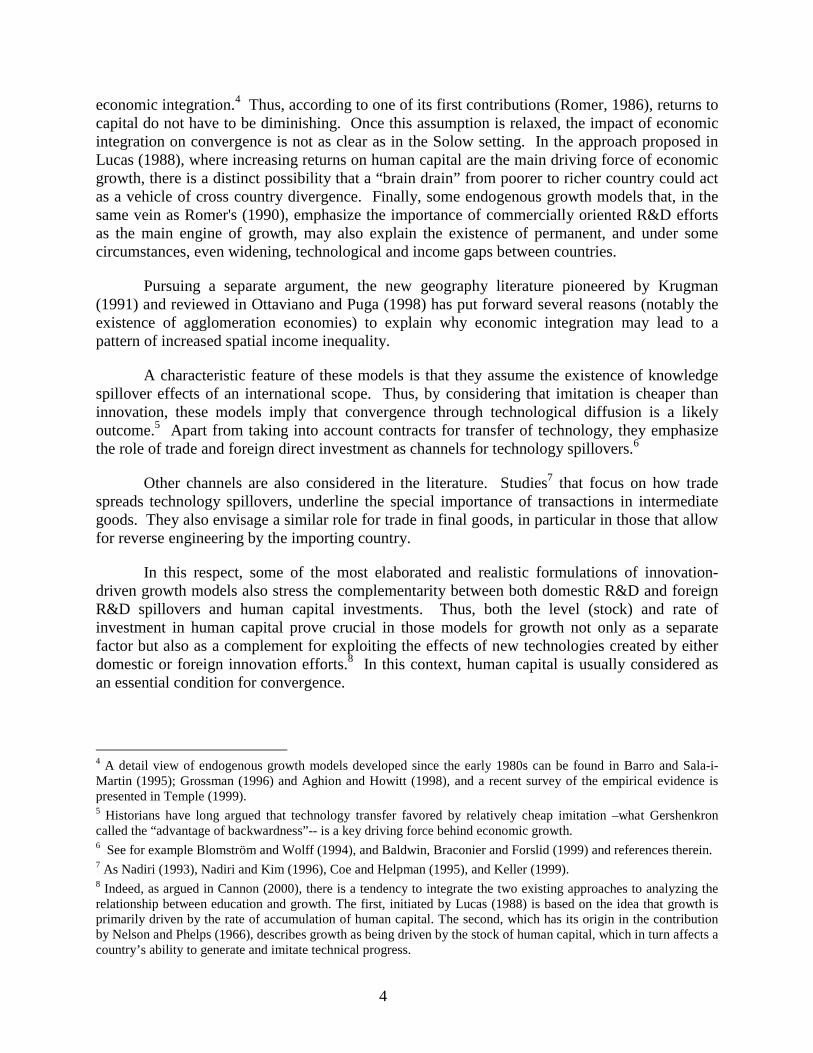
economic integration.4 Thus, according to one of its first contributions (Romer, 1986), returns tocapital do not have to be diminishing. Once this assumption is relaxed, the impact of economicintegration on convergence is not as clear as in the Solow setting. In the approach proposed inLucas (1988), where increasing returns on human capital are the main driving force of economicgrowth, there is a distinct possibility that a “brain drain” from poorer to richer country could actas a vehicle of cross country divergence. Finally, some endogenous growth models that, in thesame vein as Romer's (1990), emphasize the importance of commercially oriented R&D effortsas the main engine of growth, may also explain the existence of permanent, and under somecircumstances, even widening, technological and income gaps between countries.
Pursuing a separate argument, the new geography literature pioneered by Krugman(1991) and reviewed in Ottaviano and Puga (1998) has put forward several reasons (notably theexistence of agglomeration economies) to explain why economic integration may lead to apattern of increased spatial income inequality.
A characteristic feature of these models is that they assume the existence of knowledgespillover effects of an international scope. Thus, by considering that imitation is cheaper thaninnovation, these models imply that convergence through technological diffusion is a likelyoutcome.5 Apart from taking into account contracts for transfer of technology, they emphasizethe role of trade and foreign direct investment as channels for technology spillovers.6
Other channels are also considered in the literature. Studies7 that focus on how tradespreads technology spillovers, underline the special importance of transactions in intermediategoods. They also envisage a similar role for trade in final goods, in particular in those that allowfor reverse engineering by the importing country.
In this respect, some of the most elaborated and realistic formulations of innovation-driven growth models also stress the complementarity between both domestic R&D and foreignR&D spillovers and human capital investments. Thus, both the level (stock) and rate ofinvestment in human capital prove crucial in those models for growth not only as a separatefactor but also as a complement for exploiting the effects of new technologies created by eitherdomestic or foreign innovation efforts.8 In this context, human capital is usually considered asan essential condition for convergence.
4 A detail view of endogenous growth models developed since the early 1980s can be found in Barro and Sala-i-Martin (1995); Grossman (1996) and Aghion and Howitt (1998), and a recent survey of the empirical evidence ispresented in Temple (1999).5 Historians have long argued that technology transfer favored by relatively cheap imitation –what Gershenkroncalled the “advantage of backwardness”-- is a key driving force behind economic growth.6 See for example Blomström and Wolff (1994), and Baldwin, Braconier and Forslid (1999) and references therein.7 As Nadiri (1993), Nadiri and Kim (1996), Coe and Helpman (1995), and Keller (1999).8 Indeed, as argued in Cannon (2000), there is a tendency to integrate the two existing approaches to analyzing therelationship between education and growth. The first, initiated by Lucas (1988) is based on the idea that growth isprimarily driven by the rate of accumulation of human capital. The second, which has its origin in the contributionby Nelson and Phelps (1966), describes growth as being driven by the stock of human capital, which in turn affects acountry’s ability to generate and imitate technical progress.

5
In addition, some studies9 underscore the importance of public capital in general, andmore specifically the endowment of infrastructure, because of their significant positiveexternalities on productivity. Those externalities seem to be particularly large in the case of thetransport and communication infrastructure.10
Finally, this brief overview of the recent literature on convergence and related issueswould not be complete without mentioning the studies that have analyzed the relationshipbetween nominal and real convergence. This topic has recently drawn considerable andincreasing attention in view of the quite large number of countries that have experienced rapidand non-inflationary growth accompanied by a significant generation of employment in aframework of a stringent fiscal policy.11 In a context of increasing globalization, the key factorhere would be the credibility effect associated with strict stabilization policies, as it translates ina reduction of the country risk premium on interest rates.
Summing up, the literature is less than fully conclusive as to whether or not economicintegration on its own generates real convergence. Indeed, when the stricter assumptions of thepure neoclassical growth model are relaxed (particularly that production technologies areidentical and exogenous across countries), opening up to trade and factor mobility may become asource of divergence. Indeed, in some versions of endogenous growth models integration,although still leading to aggregate welfare gains, may potentially result in income polarizationprocesses. To clarify the debate, Boldrin and Canova (2000) proposes to distinguish the variousavailable models according to whether they embody:12
(a) A strong version of the convergence hypothesis which states that due to decreasingreturn on capital “in the long run, a common level of economic well-being beachieved, independently of initial conditions and independently of the detail of[national] policies, as long as the diffusion and adoption of technological innovationis not seriously restrained.”
(b) A weak version which emphasizes the determining role of initial conditions,endowments in immobile factors, and national policies in the adoption oftechnologies.
(c) A strong non-convergence hypothesis under which, due to high fixed costs,widespread increasing returns and external effects (e.g., agglomeration effects),“any increase in the degree of trade openness is likely to send the most productive
9 See as an example Aschauer 1989, 2000; Munnell 1990; Easterly and Rebelo, 1993 and Argimon et al. (1997)10 See Easterly and Rebelo 1993; Roller and Waverman, 1994. Studies have also shown how important, as fortelecommunication and Internet infrastructures are for the technological upgrading of the whole productive system(Crandall, 1997 and Koski and Majumdar, 2000).11 See Perotti (1996) and Alesina and Perotti (1995,1996).12 The significance of those disagreements should however be not misunderstood. What is therefore suggested inmost “non-convergence” studies, is not the advantage of autarky, but rather the need for poorer countries to enlargeand improve their endowments in those capital assets which are deemed to have a special influence on growth (bethey technology, human capital and infrastructure). In addition, most of those models argue that the existence ofinternational technological spillovers make it possible for countries to implement a strategy of growth based onimitation of foreign innovations, provided they have a good enough human capital endowment to do so.

6
factors flowing towards the advanced regions, where their return is higher, leavingthe disadvantaged area further behind.” (id.)
(d) A weak non-convergence hypothesis (akin to the infant industry argument) whichargues that “some minimum absolute level of the externalities-inducing factorsmust be obtained” for global convergence to set in. Absent this, such models arelikely to generate “club convergence,” (id.) under which countries with similarendowments in the strategic factors tend to converge into clusters.

7
2. Real Convergence: Measurement and Empirical Evidence
In the circumstances however, it befalls on empirical analysis to arbitrate amongconflicting theoretical claims. Although not free of ambiguity itself, the current researchgenerally would seem to lean towards associating economic integration with some version of theconvergence hypothesis (be it weak or conditional). Before getting to that conclusion, however,the various authors working in the field first had to clarify what the word “convergence” meantin practice in the way that can be tested empirically.
The specialized literature has come up with a wealth of different measures and openlydebated on their relative merits.13 The simplest indicator for assessing real convergence betweencountries (regions) within an area is to test whether the per capita GDP of a country (region) or aset of countries is approaching the average of the area. The two most popular measures are thebeta-convergence and sigma-convergence. The former implies that the poor countries (regions)grow faster than the richer ones and it is generally tested by regressing the growth in per capitaGDP on its initial level for a given cross-section of countries (regions). In turn, this beta-convergence covers two types of convergence: absolute and conditional (on a factor or a set offactors in addition to the initial level of per capita GDP). In contrast, sigma-convergencedesignates the reduction in the dispersion of per capita GDPs within a sample of countries(regions).14
The methodology proposed by Barro and Sala-i-Martin to test beta-convergence has beencriticized for producing biased results. Quah (1993, 1995, and 1996) argues that thismethodology largely neglects the dynamics of changing national (regional) income distributionsand proposes the use of a complex method based on the use of Markov chains to capture thedynamics of the entire cross-county distribution. More recently, Boyle and McCarthy (1997 and1999) have suggested the use of the Kendall index of rank concordance –referred to as gamma-convergence- in addition to sigma-convergence in testing for beta-convergence. That measureseems, therefore, more adequate to capture the possible mobility of countries (regions) within thedistribution of income levels over time.
None of the existing measurement procedures mentioned above is generally accepted asinherently superior to the others in any circumstances. Probably because of its intuitive appeal,the first approach (i.e., beta-convergence) remains the most commonly used. It is also the one towhich we will refer in the remainder of this paper.
Although methodological debates have been fierce, they have generated little empiricalevidence to support the idea that economic integration would lead to “real divergence.”Subsequent research has nonetheless tempered much of Barro and Sala-i-Martin’s initialoptimism15 about powerful convergence forces might be. Quah (1996) for instance suggests thatthe cross-country distribution of income may have a tendency to evolve towards “twin peaks”pattern, so that the world appears to polarize into distinct classes of income. In other words,
13 See Baumol, Nelson and Wolff (1994), Barro and Sala-i-Martin (1995), Quah (1993, 1996) and Grossman (1996)for references.14 See Barro and Sala-i-Martin (1995:11) for further details.15 Which suggested that income per capita might be converging at a rate of 2 percent per year.

8
countries seem to follow different growth paths and to converge to distinct steady states andcluster around different levels of per capita GDP.
In one of the most comprehensive study to date, Ben-David (2000) concludes that levelsof income per capita have been diverging across countries over the period 1960-8516 -- or at anyrate, they would not have converged (if weighted by population).17 Worse, the study findsevidence of club-convergence at the bottom end of the distribution, due not to any welfareimprovement but to the downfall of countries initially better off. The study however findsconvincing evidence of convergence among those countries which have opened up tointernational trade; the more so the more the latter countries actually trade among themselves.
16 Confirming similar findings by Pritchett (1997) over a longer timeframe.17 Many thanks to Peter Klenow from the Federal Reserve of Minneapolis for pointing that out.
9
3. Real Convergence within the Eu: The Case of the Cohesion Countries
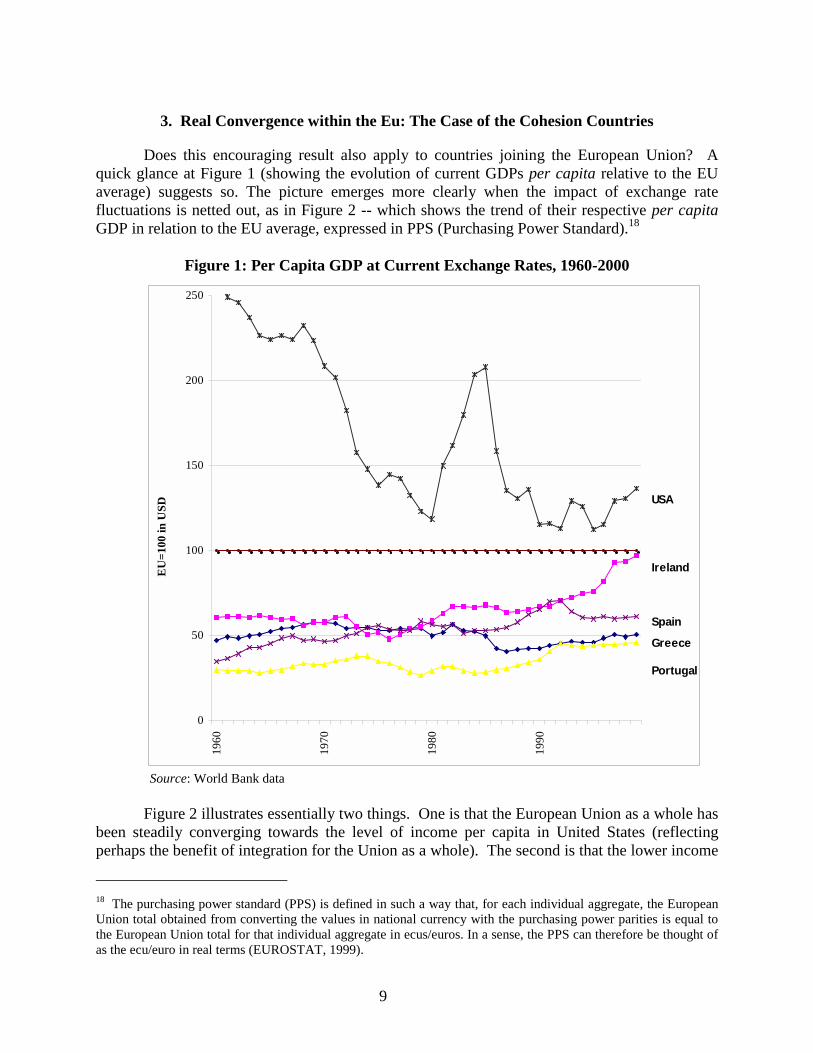
Does this encouraging result also apply to countries joining the European Union? Aquick glance at Figure 1 (showing the evolution of current GDPs per capita relative to the EUaverage) suggests so. The picture emerges more clearly when the impact of exchange ratefluctuations is netted out, as in Figure 2 -- which shows the trend of their respective per capitaGDP in relation to the EU average, expressed in PPS (Purchasing Power Standard).18
Figure 1: Per Capita GDP at Current Exchange Rates, 1960-2000
Source: World Bank data
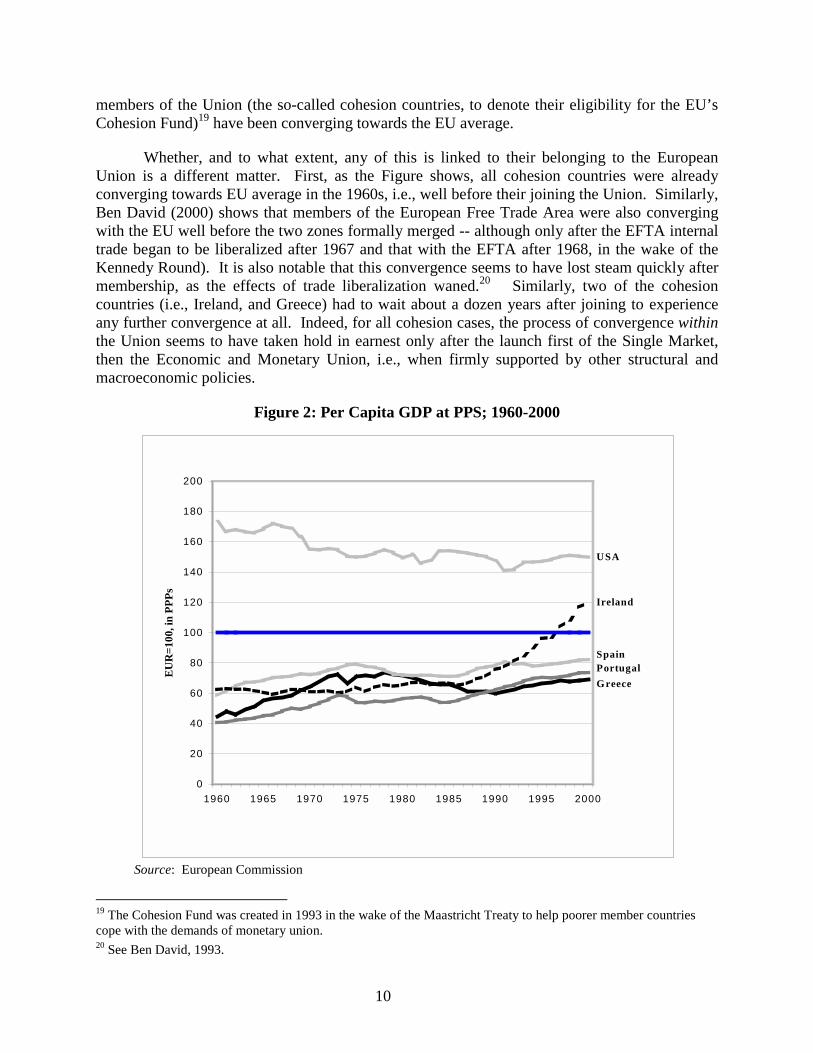
Figure 2 illustrates essentially two things. One is that the European Union as a whole hasbeen steadily converging towards the level of income per capita in United States (reflectingperhaps the benefit of integration for the Union as a whole). The second is that the lower income
18 The purchasing power standard (PPS) is defined in such a way that, for each individual aggregate, the EuropeanUnion total obtained from converting the values in national currency with the purchasing power parities is equal tothe European Union total for that individual aggregate in ecus/euros. In a sense, the PPS can therefore be thought ofas the ecu/euro in real terms (EUROSTAT, 1999).
0
50
100
150
200
250
1960
1970
1980
1990
EU
=100
in U
SD
Portugal
Greece
Spain
Ireland
USA
10
members of the Union (the so-called cohesion countries, to denote their eligibility for the EU’sCohesion Fund)19 have been converging towards the EU average.
Whether, and to what extent, any of this is linked to their belonging to the EuropeanUnion is a different matter. First, as the Figure shows, all cohesion countries were alreadyconverging towards EU average in the 1960s, i.e., well before their joining the Union. Similarly,Ben David (2000) shows that members of the European Free Trade Area were also convergingwith the EU well before the two zones formally merged -- although only after the EFTA internaltrade began to be liberalized after 1967 and that with the EFTA after 1968, in the wake of theKennedy Round). It is also notable that this convergence seems to have lost steam quickly aftermembership, as the effects of trade liberalization waned.20 Similarly, two of the cohesioncountries (i.e., Ireland, and Greece) had to wait about a dozen years after joining to experienceany further convergence at all. Indeed, for all cohesion cases, the process of convergence withinthe Union seems to have taken hold in earnest only after the launch first of the Single Market,then the Economic and Monetary Union, i.e., when firmly supported by other structural andmacroeconomic policies.
Figure 2: Per Capita GDP at PPS; 1960-2000
Source: European Commission
19 The Cohesion Fund was created in 1993 in the wake of the Maastricht Treaty to help poorer member countriescope with the demands of monetary union.20 See Ben David, 1993.
0
20
40
60
80
100
120
140
160
180
200
1960 1965 1970 1975 1980 1985 1990 1995 2000
EUR
=100
, in
PPPs
USA
Ireland
Greece
SpainPortugal
11
This actually points to a larger question: what do we actually mean by “integrating withthe EU”? While adhesion can be dated with precision,21 integration is a more diffuse notion. Aswould be the case later for CEECs, trade integration (for industrial goods) often started wellahead of membership under association agreements.22 Furthermore, the Union itself has beenintegrating only gradually. While a common trade policy was essentially achieved by the late1960s, one had to await the late 1980s to see a single market in goods, services and factors beginto emerge, and until the late 1990s for the monetary union to firm up. It is difficult in thecircumstances to ascribe convergence to any specific policy event.
This being said, Ben-David (2000) provides convincing evidence that trade liberalization(before and after membership) was, if not a sufficient condition, at least an importantcontributing factor leading to convergence, and that the periods of most intense progress in thefield were also associated with such convergence accelerating.23 In contrast, in his seminal paperon the convergence experience of the founding six members of the EU (1993), the same authorfound no sign of convergence among a reference group of other countries with incomes percapita covering the same range as that of the founding members.
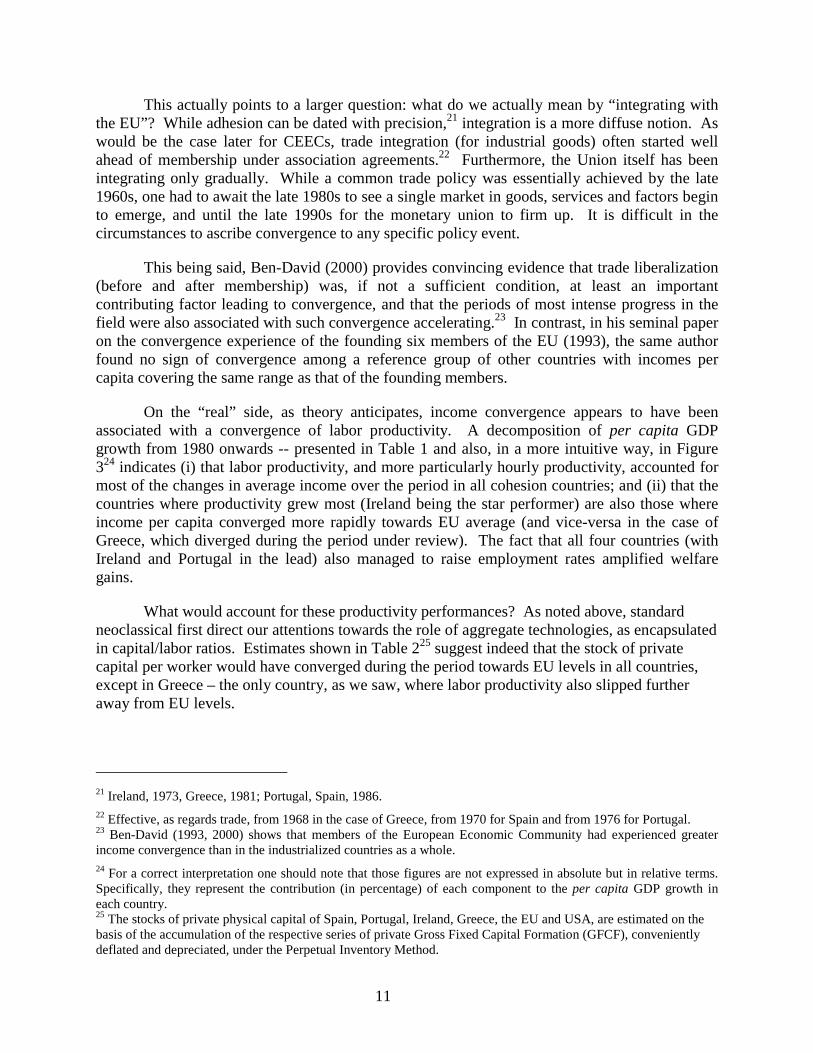
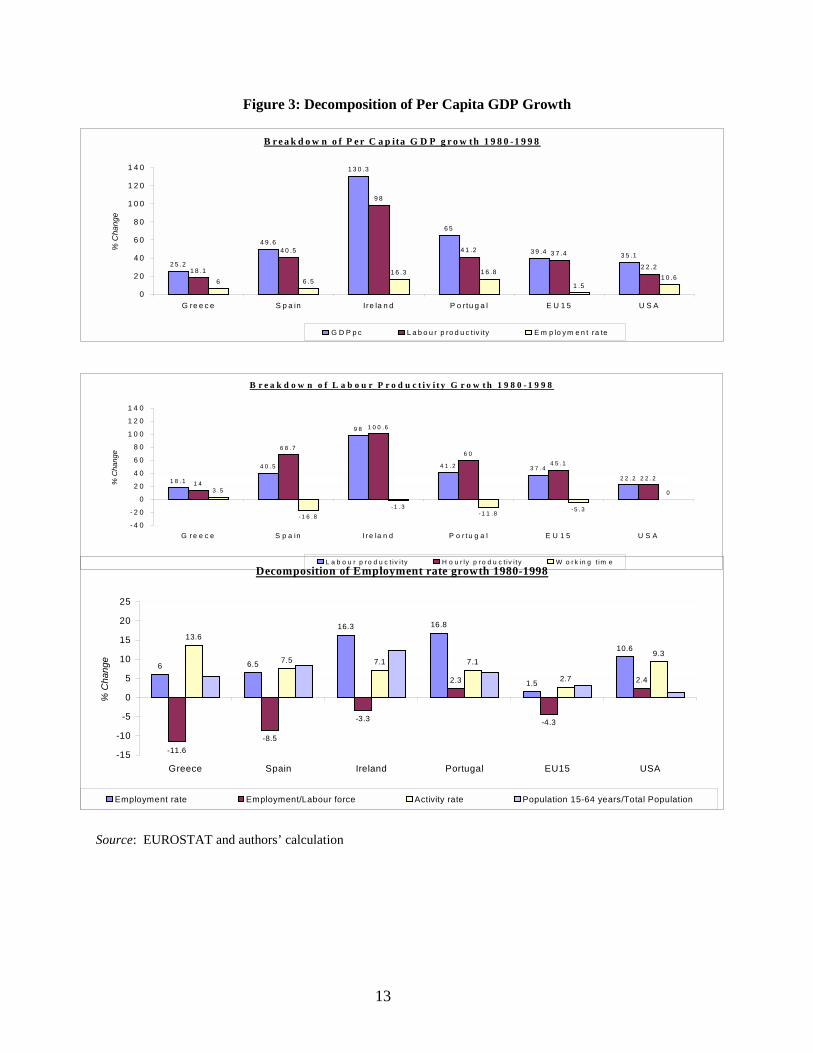
On the “real” side, as theory anticipates, income convergence appears to have beenassociated with a convergence of labor productivity. A decomposition of per capita GDPgrowth from 1980 onwards -- presented in Table 1 and also, in a more intuitive way, in Figure324 indicates (i) that labor productivity, and more particularly hourly productivity, accounted formost of the changes in average income over the period in all cohesion countries; and (ii) that thecountries where productivity grew most (Ireland being the star performer) are also those whereincome per capita converged more rapidly towards EU average (and vice-versa in the case ofGreece, which diverged during the period under review). The fact that all four countries (withIreland and Portugal in the lead) also managed to raise employment rates amplified welfaregains.
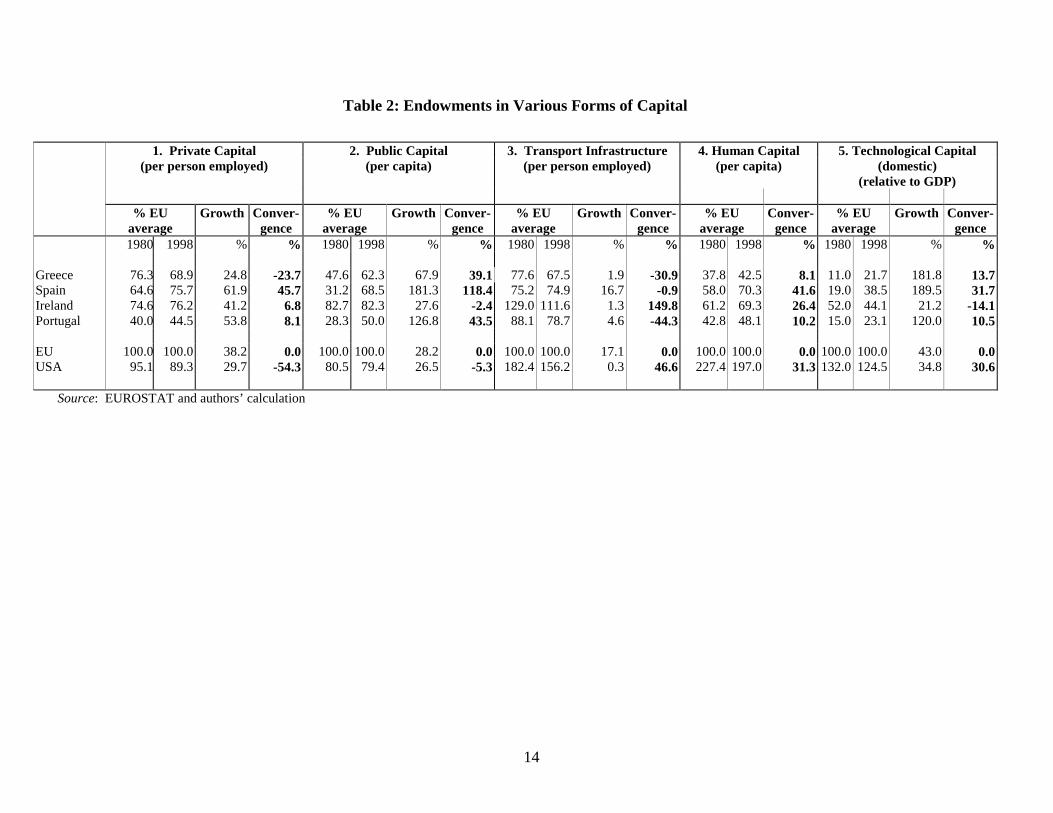
What would account for these productivity performances? As noted above, standardneoclassical first direct our attentions towards the role of aggregate technologies, as encapsulatedin capital/labor ratios. Estimates shown in Table 225 suggest indeed that the stock of privatecapital per worker would have converged during the period towards EU levels in all countries,except in Greece – the only country, as we saw, where labor productivity also slipped furtheraway from EU levels.
21 Ireland, 1973, Greece, 1981; Portugal, Spain, 1986.22 Effective, as regards trade, from 1968 in the case of Greece, from 1970 for Spain and from 1976 for Portugal.23 Ben-David (1993, 2000) shows that members of the European Economic Community had experienced greaterincome convergence than in the industrialized countries as a whole.24 For a correct interpretation one should note that those figures are not expressed in absolute but in relative terms.Specifically, they represent the contribution (in percentage) of each component to the per capita GDP growth ineach country.25 The stocks of private physical capital of Spain, Portugal, Ireland, Greece, the EU and USA, are estimated on thebasis of the accumulation of the respective series of private Gross Fixed Capital Formation (GFCF), convenientlydeflated and depreciated, under the Perpetual Inventory Method.

12
Table 1: Decomposition of GDP per Capita Growth, 1980-1998,percent
Greece Spain Ireland PortugalEuropean
UnionUnited States
GDP per capita 100,0 100,0 100,0 100,0 100,0 100,0
Labor productivity 75,1 86,2 85,7 71,0 96,1 67,7
Hourly productivity 60,1 114,1 86,8 88,4 108,9 67,7
Pure hourly growth effect 15,9 112,3 111,1 63,4 96,1 73,2 Structural change effect in hourly productivity growth
48,1 20,4 3,9 47,0 28,5 23,5
Residual effect -3,9 -18,6 -28,2 -22,0 -15,7 -29,0
Working Hours 15,0 -27,9 -1,1 -17,4 12,8 0,0
Employment rate 24,9 13,8 14,3 29,0 3,9 32,3
Employment/Labor force -38,0 -16,1 -2,9 4,2 -10,5 7,5 Activity rate 44,6 14,2 6,3 12,8 6,6 28,8 Population 15-64 years/Total population 18,3 15,7 10,9 12,0 7,8 -4,0
Memo itemGDP per capita growth 25.2 49.6 130.3 65.0 39.4 35.1Source: EUROSTAT and author’s calculation
13
Figure 3: Decomposition of Per Capita GDP Growth
Source: EUROSTAT and authors’ calculation
B r e a k d o w n o f P e r C a p ita G D P g r o w th 1 9 8 0 -1 9 9 8
2 5 .2
4 9 .6
1 3 0 .3
6 5
3 9 .4 3 5 .14 0 .5
9 8
4 1 .2 3 7 .4
2 2 .2
6 6 .51 6 .3 1 6 .8
1 .51 0 .6
1 8 .1
0
2 0
4 0
6 0
8 0
1 0 0
1 2 0
1 4 0
G re e c e S p a in Ire la n d P o rtu g a l E U 1 5 U S A
% C
hang
e
G D P p c L a b o u r p ro d u c t iv ity E m p lo y m e n t ra te
B r e a k d o w n o f L a b o u r P r o d u c t i v i t y G r o w t h 1 9 8 0 - 1 9 9 8
1 8 . 1
4 0 . 5
9 8
4 1 .2 3 7 .42 2 .2
6 8 .7
1 0 0 .6
6 04 5 . 1
2 2 . 2
3 . 5
- 1 6 . 8- 1 .3
- 1 1 .8- 5 .3
01 4
- 4 0
- 2 0
0
2 0
4 0
6 0
8 0
1 0 0
1 2 0
1 4 0
G r e e c e S p a in I r e la n d P o r t u g a l E U 1 5 U S A
% C
hang
e
L a b o u r p r o d u c t iv i t y H o u r ly p r o d u c t iv i t y W o r k in g t im eDecomposition of Employment rate growth 1980-1998
6 6.5
16.3 16.8
1.5
10.6
-8.5
-3.3
2.3
-4.3
2.4
13.6
7.5 7.1 7.1
2.7
9.3
-11.6-15
-10
-5
0
5
10
15
20
25
Greece Spain Ireland Portugal EU15 USA
% C
hang
e
Employment rate Employment/Labour force Activity rate Population 15-64 years/Total Population
14
Table 2: Endowments in Various Forms of Capital
1. Private Capital 2. Public Capital 3. Transport Infrastructure 4. Human Capital(per person employed) (per capita) (per person employed) (per capita)
5. Technological Capital(domestic)
(relative to GDP)
% EUaverage
Growth Conver-gence
% EUaverage
Growth Conver-gence
% EUaverage
Growth Conver-gence
% EUaverage
Conver-gence
% EUaverage
Growth Conver-gence
1980 1998 % % 1980 1998 % % 1980 1998 % % 1980 1998 % 1980 1998 % %
Greece 76.3 68.9 24.8 -23.7 47.6 62.3 67.9 39.1 77.6 67.5 1.9 -30.9 37.8 42.5 8.1 11.0 21.7 181.8 13.7Spain 64.6 75.7 61.9 45.7 31.2 68.5 181.3 118.4 75.2 74.9 16.7 -0.9 58.0 70.3 41.6 19.0 38.5 189.5 31.7Ireland 74.6 76.2 41.2 82.7 82.3 27.6 -2.4 129.0 111.6 1.3 149.8 61.2 69.3 26.4 52.0 44.1 21.2 -14.1Portugal 40.0 44.5 53.8
6.88.1 28.3 50.0 126.8 43.5 88.1 78.7 4.6 -44.3 42.8 48.1 10.2 15.0 23.1 120.0 10.5
EU 100.0 100.0 38.2 0.0 100.0 100.0 28.2 0.0 100.0 100.0 17.1 0.0 100.0 100.0 0.0 100.0 100.0 43.0 0.0USA 95.1 89.3 29.7 -54.3 80.5 79.4 26.5 -5.3 182.4 156.2 0.3 46.6 227.4 197.0 31.3 132.0 124.5 34.8 30.6
Source: EUROSTAT and authors’ calculation

15
What about those other factors whose roles new models emphasize? Figures in Table 2would seem to suggest that the advances countries have made in building their stock of humancapital 26 could have played a role in lifting productivity (the counter-performance of Greeceagain confirming the rule). In contrast, there is little prima facie evidence that the accumulationof other forms of physical capital --public capital and infrastructure -- 27 would have generatedmuch external effects (e.g., agglomeration effect). The country that did most in this respect, i.e.,Spain, has not been rewarded with any particularly impressive growth performance (it ranks thirdon this score among the four cohesion countries), while the country which exhibit stellar growthperformance, Ireland, did not progress towards EU levels of public capital. Furthermore, if itsdensity of transport infrastructure did converge towards EU levels, that convergence was actually“downwards,” i.e., from above average.28
The contribution of technological capital seems also at first ambiguous.29 Table 2 showslittle correlation between the efforts countries have made in R&D and their growthperformances. The two countries which put more of their resources into expanding domestictechnological capital (i.e., Spain and Greece) actually grew more slowly than the others did.
As mentioned in chapter 1, however, the recent growth literature has not only emphasizedthe importance of domestic R&D and human capital investments, but also that of theinternational diffusion of technology, through a variety of channels. In addition to the mostconventional and direct channel, the international contracts for transfer of technology, newmodels have stressed two other indirect ways for international diffusion of technology throughknowledge spillover effects: trade and foreign direct investment. Consequently, in these models,given a level of domestic stock of technological and human capital, the processes of opening upand trade integration will tend to raise a country’s rates of growth.
26 The best procedure for estimating the stock of human capital is the one followed in Barro and Lee (1993 and1996), i.e., to approach the human stock of a country in terms of the level of training of its working-age populationaccording to the years of schooling at all levels of education. This is, therefore, the method followed here.However, we will introduce an improvement trying to overcome the criticisms that the Barro and Lee (1993 and1996) estimates have received, namely: not taking into the consideration the likely differences of quality across theEducation Systems of the countries. Consequently, our estimated series of human capital stock introduce acorrection, based on data on the cross country differences in education expenditure per student at every level ofteaching, in an attempt to get data in terms of the same quality standard.27 The stocks of public capital have been obtained by applying the same procedure to the corresponding series ofpublic GFCF. The transport infrastructure endowment of each country has been estimated by calculating thearithmetic mean of the availability of kilometers of “standard motorway” per square km. and per capita.28 In their detailed analysis of disaggregated data at the NUTS-2 level, Boldrin and Canova (2000) similarly findlittle correlation between accumulation of public and transport infrastructure and regional growth performance.29 As for the stock of technological capital, there is a wide consensus in considering that it can be reasonablyapproached by the accumulation of the R&D spending following the perpetual inventory method. We have,therefore, applied this method to the series of data of R&D provided by the OECD since 1973, using as a deflatorthat of Gross Fixed Capital Formation and assuming a depreciation rate of 10%. The use of the R&D expendituresas an indicator for the technological development has received two kinds of criticism. On the one hand, it has beenclaimed that R&D spending is an overstated measure of the efforts in technological activities in view of the highrates of failures that are likely to occur in R&D projects. On the other hand, others have argued its understatement,because it does not include the payments for imports of technology.

16
Available evidences seem much stronger in favor of that line of reasoning. To test thisassumption, we have proceeded in the following fashion. First, we have assumed that the OECDwas the relevant area of origin of all the cohesion countries’ knowledge spillovers, as this wheremost of their imports of goods and technology as well as their direct investment inflows comefrom. This being posited, we have estimated the extent of technological spillovers coming fromtechnological imports by accumulating their external technological payments under the perpetualinventory method. As for the spillovers incorporated in the direct investment inflows, we havecalculated a weighted average of the stock of technological capital of each of the OECD membercountries using as weights the stocks of foreign capital received from each of them. Finally,technological spillovers through imports of goods have been estimated by the same procedure,using as weights the share of their imports coming from each of the OECD countries.30
Figure 4: Technological Spilloverspercent of GDP, 1996
Source: OECD, IMF, EUROSTAT and author’s calculation
The results obtained (see Figure 4) show (i) considerable differences in the countries’abilities to harness technological spillovers; and (ii) an extraordinary correlation between thelatter and their productivity performance. Indeed, Ireland’s capacity to tap such technologicalspillovers seems to have by far offset any disadvantages lower R&D efforts may have created.Apart from the significant role of imports in all countries, the most salient feature is, in ourview31, the extraordinary contribution of foreign direct investment in Ireland and also, althoughto a lesser degree, in Spain and Portugal. In contrast, the scarcity of inward investment flows in
30 More details about the data sources and the procedure used for the measurement of these spillovers are providedin the Methodological Appendix31 It should be noted that the impact of international technological spillovers on the economic growth of a countrydepends not only on its magnitude but also on its output elasticity. In this sense, Braconier and Sjöholm (1998)examine two potential channels for R&D spillovers -foreign direct investments and trade- for a group of OECDcountries, obtaining a higher elasticity associated with the spillovers transmitted through foreign direct investments.In addition, Martín, Velázquez and Crespo (2001) evaluate the impact of the international technological spilloverschanneled by imports on the economic growth of all the OECD countries and find that elasticity for such spilloversis quite low.
0
1
2
3
4
5
6
7
Greece Spain Ireland Portugal EU USA
Foreign Capital Imports of goods Imported technological capital
17
Greece is likely to have contributed the rather poor performance of this country as regards laborproductivity.
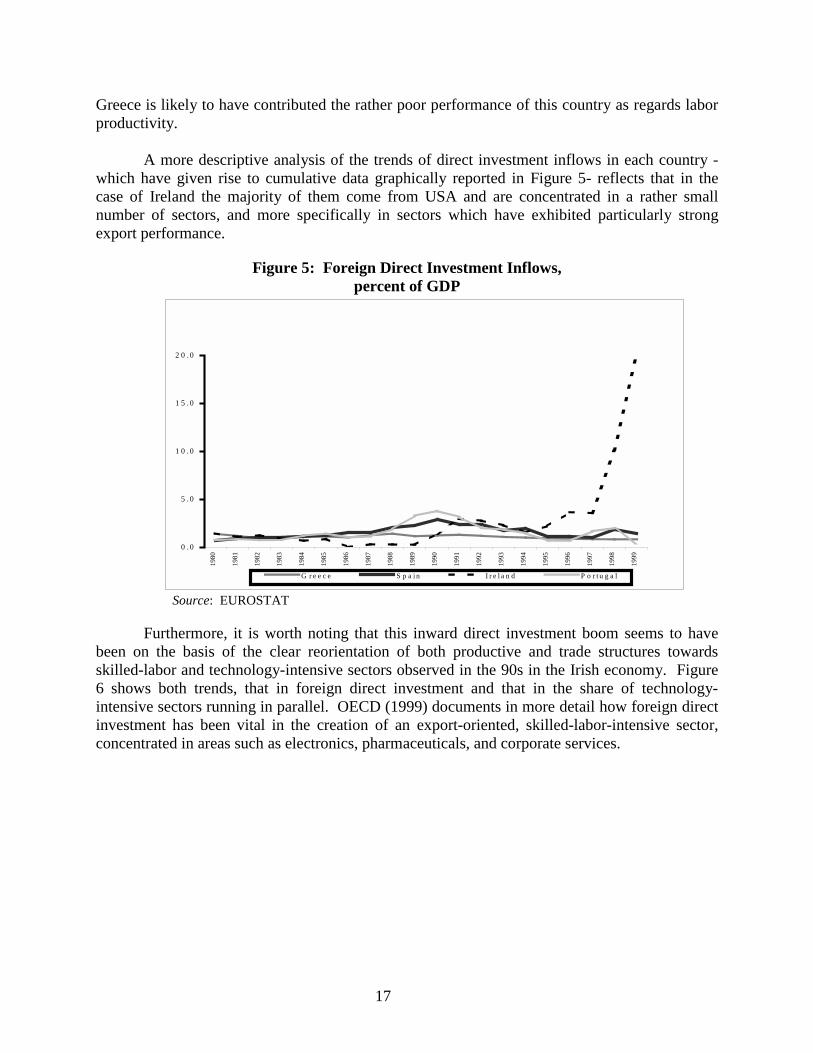
A more descriptive analysis of the trends of direct investment inflows in each country -which have given rise to cumulative data graphically reported in Figure 5- reflects that in thecase of Ireland the majority of them come from USA and are concentrated in a rather smallnumber of sectors, and more specifically in sectors which have exhibited particularly strongexport performance.
Figure 5: Foreign Direct Investment Inflows,percent of GDP
Source: EUROSTAT
Furthermore, it is worth noting that this inward direct investment boom seems to havebeen on the basis of the clear reorientation of both productive and trade structures towardsskilled-labor and technology-intensive sectors observed in the 90s in the Irish economy. Figure6 shows both trends, that in foreign direct investment and that in the share of technology-intensive sectors running in parallel. OECD (1999) documents in more detail how foreign directinvestment has been vital in the creation of an export-oriented, skilled-labor-intensive sector,concentrated in areas such as electronics, pharmaceuticals, and corporate services.
0 . 0
5 . 0
1 0 . 0
1 5 . 0
2 0 . 0
1980
1981
1982
1983
1984
1985
1986
1987
1988
1989
1990
1991
1992
1993
1994
1995
1996
1997
1998
1999
G r e e c e S p a i n I r e l a n d P o r t u g a l

18
Figure 6: Share of Technology Intensive Sectors (*)
(*) Chemical products, office and data processing machines, electrical goods and communication servicesSource: OECD, EUROSTAT and author’s calculation.
These observation, of course, do not deny any role for public infrastructure, transportnetworks or domestic R&D, including in attracting foreign direct investment. It might well bethat (as under a weak convergence hypothesis) a minimum absolute level of them is needed to beable to take advantage of technological spillovers. The fact that absolute levels of endowmentsin public capital and even more so in transport infrastructures are larger in those cohesioncountries that have been more successful in raising their per capita GDP toward the EU averagemay be a sign that certain absolute threshold may need to be crossed to exploit fullytechnological spillovers.
Another area where such thresholds may exist is telecommunications. The set oftelecommunication and Internet infrastructure indicators reported in Figure 7 would seem rathereloquent in this respect: Ireland's figures are in all cases very close to the EU average and insome of them even above. On this score again, Greece is the laggard.
0.00
1.00
2.00
3.00
4.00
5.00
6.00
7.00
8.00
9.00
1980 1981 1982 1983 1984 1985 1986 1987 1988 1989 1990 1991 1992 1993 1994 1995 1996 1997 1998
% o
f Em
ploy
men
t
Portugal Ireland Greece Spain

19
Figure 7: Telecommunication and Internet Infrastructure in July 2000Digital telephone lines
335
418
410
433
647
522
0 100 200 300 400 500 600 700
Greece
Portugal
Spain
Ireland
EU
USA
per 1000 inhabitants
Source: EUROSTAT, OECD and United Nations
Cellular mobile subscribers
267
383
273
283
272
300
0 50 100 150 200 250 300 350 400 450
Greece
Portugal
Spain
Ireland
EU
USA
per 1000 inhabitants
Source: EUROSTAT, OECD and United Nations
Deployment of fibre optic cable
1,25
1,20
1,40
16,07
4,12
136,66
0 20 40 60 80 100 120 140 160
Greece
Portugal
Spain
Ireland
EU
USA
Km per 1000 inhabitants
Source: OECD and United Nations
Disponsable internet hosts
2.3
2.5
4.6
7.2
29.1
7.7
0 5 10 15 20 25 30 35
Greece
Portugal
Spain
Ireland
EU
USA
per 1000 inhabitants
Source: OECD, Network Wizards, Internet Society
Web servers
0,2
0,3
1,4
1,8
17,9
1,8
0 2 4 6 8 10 12 14 16 18 20
Greece
Portugal
Spain
Ireland
EU
USA
per 1000 inhabitants
Source: OECD, Netcraft and Internet Society
Secure web servers for electronic commerce
6.0
16.0
181.7
2.6
46.8
26.4
0 20 40 60 80 100 120 140 160 180 200
Greece
Portugal
Spain
Ireland
EU
USA
per 1.000.000 inhabitants
Source: OECD, Netcraft and Internet Society
Source: EUROSTAT, OECD, UN, Network Wizards, Internet Society, Netcraft and author’s calculation
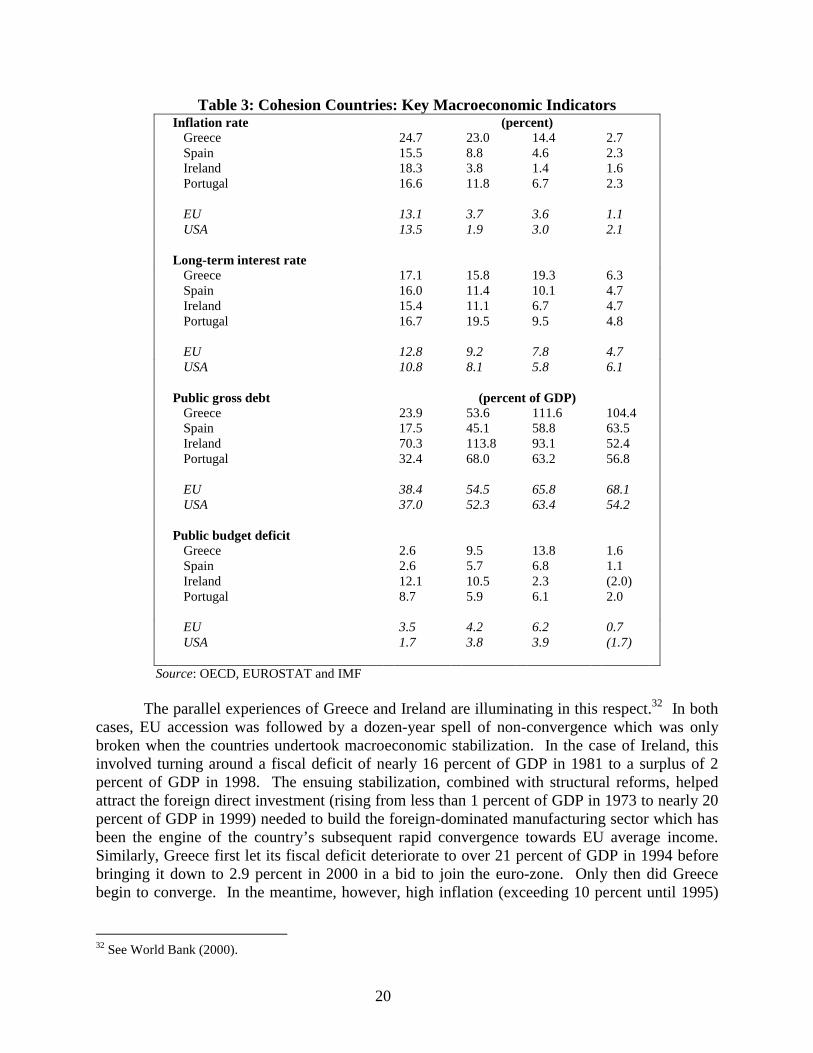
Additionally, as discussed in chapter 1, the increasing globalization of internationalmarkets has heightened the importance of macroeconomic stability as a condition for economicgrowth and consequently for real convergence (both through its impact on the efficiency ofresource allocation and on the volume of investment, including from foreign sources). Table 3reveals in concrete terms the degree of parallelism, which exist between these two dimensions.
20
Table 3: Cohesion Countries: Key Macroeconomic IndicatorsInflation rate (percent)
Greece 24.7 23.0 14.4 2.7Spain 15.5 8.8 4.6 2.3Ireland 18.3 3.8 1.4 1.6Portugal 16.6 11.8 6.7 2.3
EU 13.1 3.7 3.6 1.1USA 13.5 1.9 3.0 2.1
Long-term interest rateGreece 17.1 15.8 19.3 6.3Spain 16.0 11.4 10.1 4.7Ireland 15.4 11.1 6.7 4.7Portugal 16.7 19.5 9.5 4.8
EU 12.8 9.2 7.8 4.7USA 10.8 8.1 5.8 6.1
Public gross debt (percent of GDP)Greece 23.9 53.6 111.6 104.4Spain 17.5 45.1 58.8 63.5Ireland 70.3 113.8 93.1 52.4Portugal 32.4 68.0 63.2 56.8
EU 38.4 54.5 65.8 68.1USA 37.0 52.3 63.4 54.2
Public budget deficitGreece 2.6 9.5 13.8 1.6Spain 2.6 5.7 6.8 1.1Ireland 12.1 10.5 2.3 (2.0)Portugal 8.7 5.9 6.1 2.0
EU 3.5 4.2 6.2 0.7USA 1.7 3.8 3.9 (1.7)
Source: OECD, EUROSTAT and IMF
The parallel experiences of Greece and Ireland are illuminating in this respect.32 In bothcases, EU accession was followed by a dozen-year spell of non-convergence which was onlybroken when the countries undertook macroeconomic stabilization. In the case of Ireland, thisinvolved turning around a fiscal deficit of nearly 16 percent of GDP in 1981 to a surplus of 2percent of GDP in 1998. The ensuing stabilization, combined with structural reforms, helpedattract the foreign direct investment (rising from less than 1 percent of GDP in 1973 to nearly 20percent of GDP in 1999) needed to build the foreign-dominated manufacturing sector which hasbeen the engine of the country’s subsequent rapid convergence towards EU average income.Similarly, Greece first let its fiscal deficit deteriorate to over 21 percent of GDP in 1994 beforebringing it down to 2.9 percent in 2000 in a bid to join the euro-zone. Only then did Greecebegin to converge. In the meantime, however, high inflation (exceeding 10 percent until 1995)
32 See World Bank (2000).
21
inhibited productivity (see Table 1), in part due to its deterrent effect on foreign directinvestment (which languished at only about 1 percent of GDP per annum).
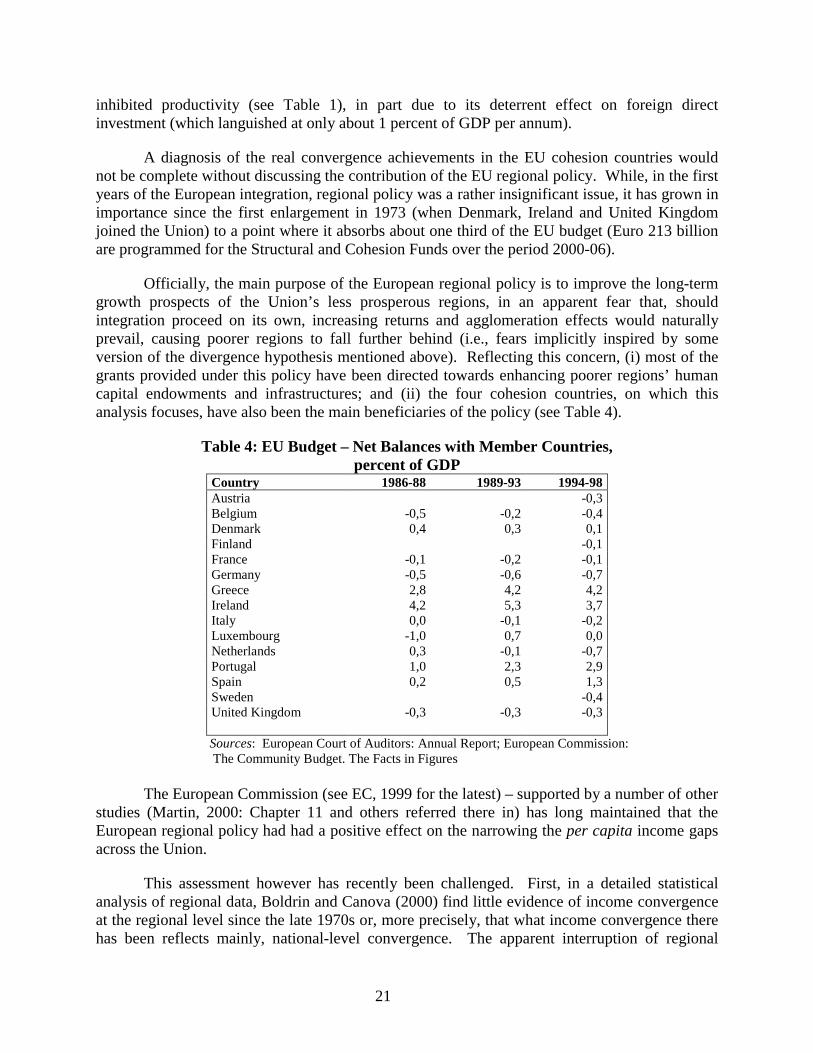
A diagnosis of the real convergence achievements in the EU cohesion countries wouldnot be complete without discussing the contribution of the EU regional policy. While, in the firstyears of the European integration, regional policy was a rather insignificant issue, it has grown inimportance since the first enlargement in 1973 (when Denmark, Ireland and United Kingdomjoined the Union) to a point where it absorbs about one third of the EU budget (Euro 213 billionare programmed for the Structural and Cohesion Funds over the period 2000-06).
Officially, the main purpose of the European regional policy is to improve the long-termgrowth prospects of the Union’s less prosperous regions, in an apparent fear that, shouldintegration proceed on its own, increasing returns and agglomeration effects would naturallyprevail, causing poorer regions to fall further behind (i.e., fears implicitly inspired by someversion of the divergence hypothesis mentioned above). Reflecting this concern, (i) most of thegrants provided under this policy have been directed towards enhancing poorer regions’ humancapital endowments and infrastructures; and (ii) the four cohesion countries, on which thisanalysis focuses, have also been the main beneficiaries of the policy (see Table 4).
Table 4: EU Budget – Net Balances with Member Countries,percent of GDP
Country 1986-88 1989-93 1994-98Austria -0,3Belgium -0,5 -0,2 -0,4Denmark 0,4 0,3 0,1Finland -0,1France -0,1 -0,2 -0,1Germany -0,5 -0,6 -0,7Greece 2,8 4,2 4,2Ireland 4,2 5,3 3,7Italy 0,0 -0,1 -0,2Luxembourg -1,0 0,7 0,0Netherlands 0,3 -0,1 -0,7Portugal 1,0 2,3 2,9Spain 0,2 0,5 1,3Sweden -0,4United Kingdom -0,3 -0,3 -0,3
Sources: European Court of Auditors: Annual Report; European Commission: The Community Budget. The Facts in Figures
The European Commission (see EC, 1999 for the latest) – supported by a number of otherstudies (Martin, 2000: Chapter 11 and others referred there in) has long maintained that theEuropean regional policy had had a positive effect on the narrowing the per capita income gapsacross the Union.
This assessment however has recently been challenged. First, in a detailed statisticalanalysis of regional data, Boldrin and Canova (2000) find little evidence of income convergenceat the regional level since the late 1970s or, more precisely, that what income convergence therehas been reflects mainly, national-level convergence. The apparent interruption of regional
22
convergence after the late 1970s would be associated with a drying up of migration flows out ofpoorer regions (which had been the main engine of convergence up to then). Furthermore, theseauthors do not find that the availability of either EU aid or of the targeted public goods wouldhave any statistically discernable impact on the performance of beneficiary regions. Suchfindings lead Boldrin and Canova (2000) to wonder whether the true purpose for the EU regionalpolicy would not be, rather than to stimulate regional growth, to redistribute income in a bid todiscourage migration.
It might also be the case, as Hervé (1999)33 suggests, that rather than leading to anincrease in the level of targeted public expenditures (e.g., on human capital and infrastructure),EU funding would instead have made it easier for countries to undertake non-targetedexpenditures (the fungibility argument familiar to donor agencies). In this case, the positiveimpacts reported by Martin and others might be due more the relaxation of external constraints,which regional transfers make possible, than to supply-side effects. Given the amounts at stake,further empirical investigation would seem warranted on this topic.
This brief analysis of the real convergence patterns of the four less developed countriesin the EU concludes therefore that, if all countries growth have benefited from trade integrationwith the European Union, their capacity to exploit the opportunities so created greatly dependedon their own domestic policies, particularly in the areas of macroeconomic stabilization, humancapital development, and openness to foreign investment.
Indeed, one cannot but be impressed by the extraordinary importance of direct investmentinflows. The capacity of the Irish economy to attract capital from abroad clearly stands out evenwith relation to the other EU cohesion countries, Spain and Portugal, which have also been veryattractive for foreign investors. At the other end of the spectrum, the meagerness of foreigndirect investment in Greece probably goes a long way towards explaining that country’s stagnantcapital\labor ratio as well as its mediocre productivity performance. This being said, it is entirelypossible that the growth strategy followed by Ireland -greatly based on developing humancapital and harnessing international spillovers- would not have probably been as successful inthe absence of a good endowment in domestic R&D and network infrastructures
Finally, as far as the likely implications of EU membership, we noted the positive rolewhich seem to have played the Single Market and the European Monetary Union, as well as thedebates concerning the contribution of EU regional policy.
The respective stories of the four less developed EU members, with all theircommonalties as well as their striking differences, constitutes a real-life experiment of howconvergence actually operates in the framework of an ambitious regional integration process. Assuch it presents interesting lessons for the current candidates to accession. This is the subject ofthe next section.
33 Expanding on Hervé and Holzmann, 1998.

23
4. The Experience of the Central and Eastern European Candidates
For the ten CEECs (Bulgaria, the Czech Republic, Estonia, Hungary, Latvia, Lithuania,Poland, Romania, the Slovak Republic and Slovenia), the process of integration with the EUbegan with the signing of the European Association Agreements (EAs) with the EU34 and iscontinuously expanding as candidate countries endeavor to adopt the European acquiscommunautaire (as the body of European law is known) ahead of their full membership in theUnion.35
Alongside clear differences (the process of transition being one), the experience of thenew candidates presents also many similarities with that of the cohesion countries. Taken as agroup, the CEECs have grown in the 1990s at a somewhat higher rate than their future EUpartners. Convergence may have been slow and the remaining gap between CEEC per capitaGDP and that of the EU often substantial, the contrast is nonetheless striking with the experienceof that other group of country going through transition at the same time (see Figure 8).36 Whilethe average income per capita (at PPP) of CEECs lagged 20 percent behind that of the CIS at thebeginning of the 1990s, it exceeded it by 50 percent as the decade drew to a close. As a result,the relative size of total GDP (at PPP) of candidate countries in Central and Eastern Europeexpanded from about one to about two third of that of the CIS over that decade.
This is not to say, of course, that EU integration could, on its own, account for suchdifferent trajectories. But integration with the EU undoubtedly helped, not only because of theaccess the candidate have gained to EU markets made their export-led recovery possible, but alsobecause the process of preparing for EU membership in itself has provided a framework and theimpetus for countries to forge ahead with the structural reforms and stabilization, whichmembership embodied.
34 The EAs were signed on the following dates: Czechoslovakia, Hungary and Poland (December, 1991); Romania(February, 1993); Bulgaria (March, 1993); the Czech and Slovak Republic (October, 1993) Estonia, Latvia andLithuania (June, 1995); and Slovenia (June, 1996).35 Under this process, CEECs have gained access to EU markets through mutual tariff reduction for industrial goods(for industrial goods: immediate access to EU market against gradual elimination (by January 1, 2002 ) of tariffduties on EU imports into CEECs, a process now expanding to agricultural goods (double-zero approach), and non-tariff barriers (“single market” agreements). Already around 80 percent of industrial imports tariffs-free by 1999.Furthermore, the EA process has spurred more general trade liberalization more generally through a web ofcomplementary free trade agreements, CEECs have very low tariffs on industrial imports from preferential(accession and non-accession) partners. Around 85 percent of all industrial imports from these partners were duty-free in 1999. EAs have also helped CEECs attract direct investment, by with provisions on the mutual right ofestablishment of firms, the liberalization of capital flows, the movement of workers, and approximation of nationallaws with EU law (e.g., in the areas of competition, company, accounting; banking law; mergers, state aid;intellectual property)36 To allow comparison, this figure uses World Bank data at Purchasing Power Parity (for which series exist for theCIS), instead of Eurostat ones at Purchasing Power Standard as in the rest of the paper.

24
Figure 8: CEEC and CIS Per Capita GDP at PPP: 1991-99percent of EU average
Source: World Bank calculations.
Looking beyond regional averages reveals indeed a wide variety of country experiences(see Figure 9), and directs attention towards, one, the different dynamics of productivity, and,two, the role of domestic policies in stimulating it. As in cohesion countries, the successfulinstances of growth recovery among CEECs have largely been driven by improvements in laborproductivity (see Table 5).
Table 5: CEECs: Labor Productivity in Industry,base year = 100
1989 1990 1991 1992 1993 1994 1995 1996 1997 1998
Bulgaria 100.0 91.4 86.6 83.9 81.5 91.8 98.5 101.8 98.0 n.a.Czech Republic 100.0 99.6 78.7 76.6 75.2 78.9 87.6 96.0 106.7 112.7Hungary 100.0 100.4 82.4 91.2 107.9 115.8 128.4 140.0 160.0 181.3Poland 100.0 78.9 69.5 81.3 92.1 105.0 112.3 123.5 138.5 147.2Romania 100.0 75.9 59.4 53.1 58.7 64.7 77.6 87.0 87.9 101.9Slovak Republic 100.0 99.0 81.0 78.9 81.8 89.4 94.1 96.5 100.4 112.0
Estonia n.a. n.a. n.a. 100.0 101.1 107.9 108.3 112.3 141.9 145.1Latvia n.a. n.a. n.a. 100.0 77.4 84.8 83.9 91.1 116.6 118.9Lithuania n.a. n.a. n.a. 100.0 77.6 68.2 76.4 82.9 89.2 99.0
Slovenia n.a. n.a. n.a. n.a. 100.0 111.8 121.2 129.3 135.1 142.4n.a.: Not applicableNote: The indices have different base years because of differences in data availability for the different countries.Source: World Bank calculations based on data from EBRD Transition Report, various issues.
20
25
30
35
40
45
1991 1992 1993 1994 1995 1996 1997 1998 1999GD
P pe
r cap
ita a
t PPP
, EU
ave
rage
=10
0
CEEC CIS
25
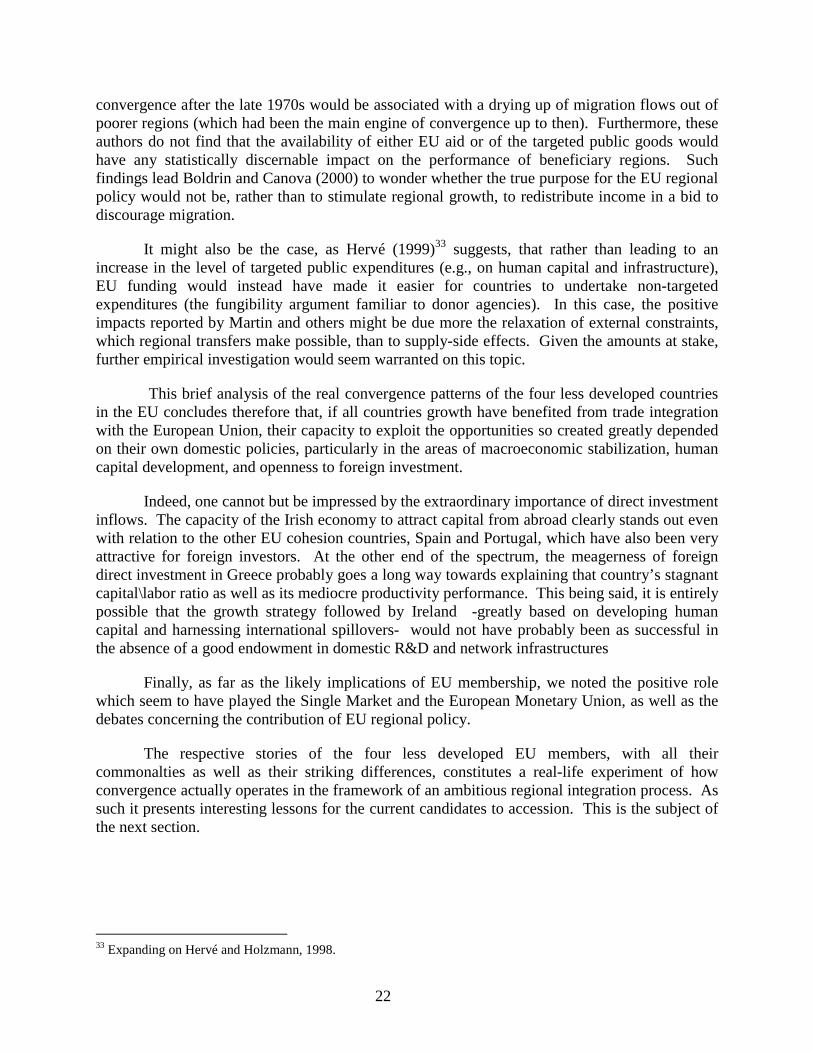
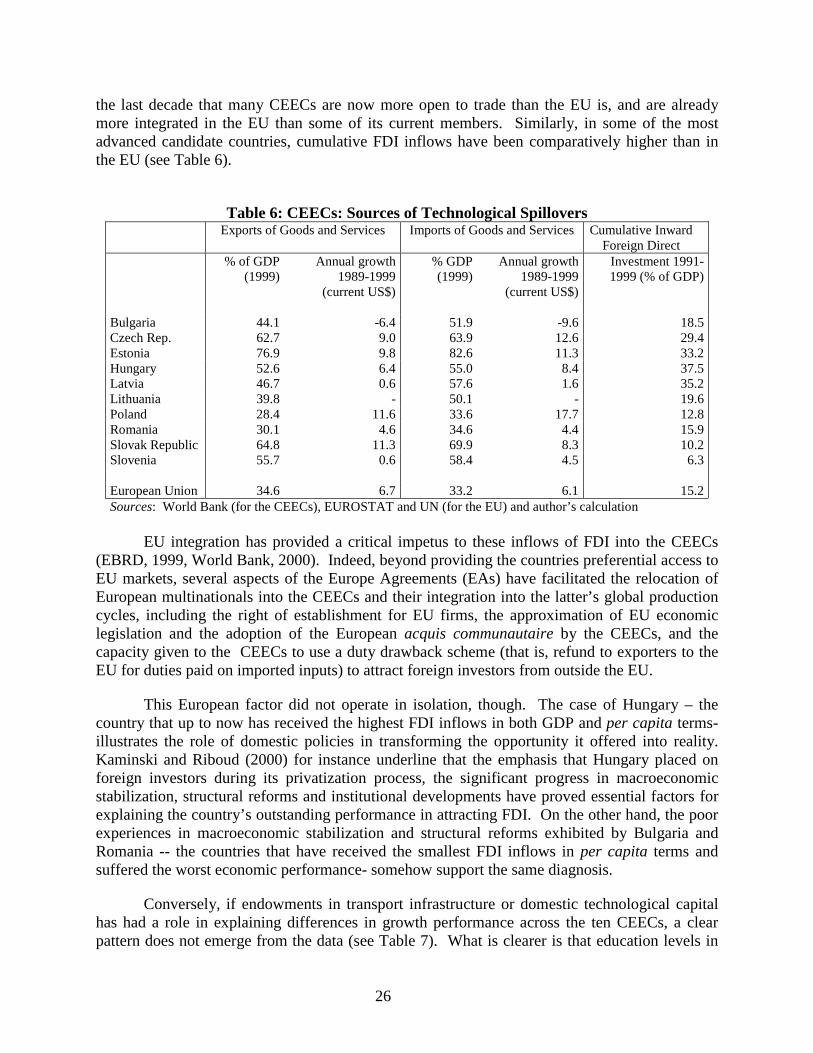
Figure 9: CEECs: Per Capita GDP at PPS: 1990-2000,compared to EU average
Source: EUROSTAT; Figures for 1990-94, and for 2000 are extrapolated based on constant price data in local currency.
While the transition to the market system undoubtedly played a part, open trade togetherwith considerable amounts of foreign direct investments (FDI) have been also been key factors inlifting labor productivity. Not only have trade and FDI contributed to a redirection of exportsfrom the CMEA to the EU markets, they have been the main driving forces of the changes in thepatterns of industrial specialization of the CEECs (particularly Hungary and Estonia) away fromunskilled labor-intensive goods toward high-skilled, labor-intensive and technology-basedproducts (see World Bank, 2000 and references therein). Among the sources of technologicalspillovers identified above, trade in goods and services has experienced such rapid growth over
20
30
40
50
60
70
80
1991 1992 1993 1994 1995 1996 1997 1998 1999 2000
EU=1
00
Slovenia
Czech Rep.
Hungary
Slovak Rep.
CC-10PolandEstonia
LithuaniaLatviaRomania
Bulgaria
26
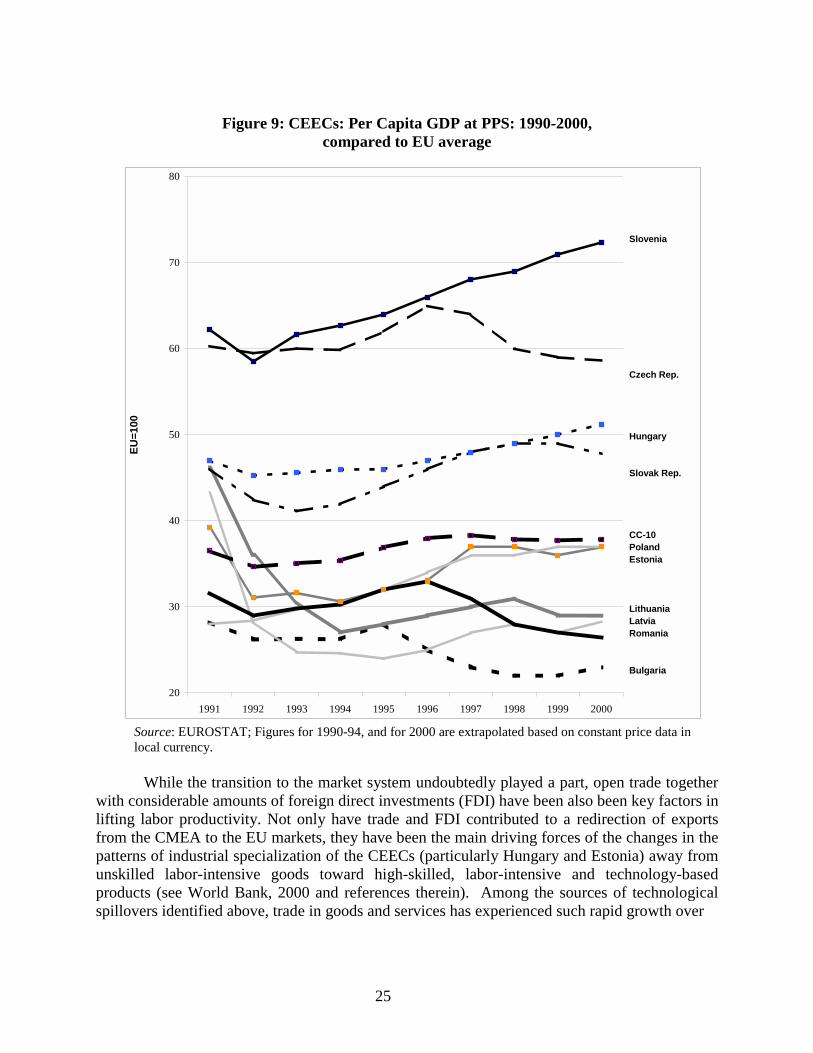
the last decade that many CEECs are now more open to trade than the EU is, and are alreadymore integrated in the EU than some of its current members. Similarly, in some of the mostadvanced candidate countries, cumulative FDI inflows have been comparatively higher than inthe EU (see Table 6).
Table 6: CEECs: Sources of Technological SpilloversExports of Goods and Services Imports of Goods and Services Cumulative Inward
Foreign Direct% of GDP
(1999)Annual growth
1989-1999(current US$)
% GDP(1999)
Annual growth1989-1999
(current US$)
Investment 1991-1999 (% of GDP)
Bulgaria 44.1 -6.4 51.9 -9.6 18.5Czech Rep. 62.7 9.0 63.9 12.6 29.4Estonia 76.9 9.8 82.6 11.3 33.2Hungary 52.6 6.4 55.0 8.4 37.5Latvia 46.7 0.6 57.6 1.6 35.2Lithuania 39.8 - 50.1 - 19.6Poland 28.4 11.6 33.6 17.7 12.8Romania 30.1 4.6 34.6 4.4 15.9Slovak Republic 64.8 11.3 69.9 8.3 10.2Slovenia 55.7 0.6 58.4 4.5 6.3
European Union 34.6 6.7 33.2 6.1 15.2Sources: World Bank (for the CEECs), EUROSTAT and UN (for the EU) and author’s calculation
EU integration has provided a critical impetus to these inflows of FDI into the CEECs(EBRD, 1999, World Bank, 2000). Indeed, beyond providing the countries preferential access toEU markets, several aspects of the Europe Agreements (EAs) have facilitated the relocation ofEuropean multinationals into the CEECs and their integration into the latter’s global productioncycles, including the right of establishment for EU firms, the approximation of EU economiclegislation and the adoption of the European acquis communautaire by the CEECs, and thecapacity given to the CEECs to use a duty drawback scheme (that is, refund to exporters to theEU for duties paid on imported inputs) to attract foreign investors from outside the EU.
This European factor did not operate in isolation, though. The case of Hungary – thecountry that up to now has received the highest FDI inflows in both GDP and per capita terms-illustrates the role of domestic policies in transforming the opportunity it offered into reality.Kaminski and Riboud (2000) for instance underline that the emphasis that Hungary placed onforeign investors during its privatization process, the significant progress in macroeconomicstabilization, structural reforms and institutional developments have proved essential factors forexplaining the country’s outstanding performance in attracting FDI. On the other hand, the poorexperiences in macroeconomic stabilization and structural reforms exhibited by Bulgaria andRomania -- the countries that have received the smallest FDI inflows in per capita terms andsuffered the worst economic performance- somehow support the same diagnosis.
Conversely, if endowments in transport infrastructure or domestic technological capitalhas had a role in explaining differences in growth performance across the ten CEECs, a clearpattern does not emerge from the data (see Table 7). What is clearer is that education levels in

27
CEECs generally approach EU standards,37 and that if any threshold effect exist in that area (as anecessary condition for convergence), candidate countries should be well position to pass it. Theexperience of cohesion countries suggested that continued efforts in building human capital is anessential for sustaining growth and real convergence.
Table 7: CEECs: Factors Conducive to Real ConvergenceKm of motorways in 1999 (2)Expenditure for
R&D in 1996(% GDP) (1)
Mean school years in1998 of the population
15-64 years (3)
Internet connectionsper 1000 inhabitants
in 1999 (2)Per 1000 km2 of
surfacePer 10000
inhabitants
Bulgaria 0.57 8.4 3.2 2.92 3.95Czech Republic 1.11 10.0 19.4 6.31 4.84Estonia 0.57 9.0 18.3 1.91 6.01Hungary 0.68 10.6 13.6 4.45 4.82Latvia 0.48 9.1 3.4 - -Lithuania 0.70 8.9 - 6.39 11.27Poland 0.77 11.0 2.6 0.86 0.69Romania 0.72 9.1 0.6 0.48 0.50Slovak Republic 1.05 7.7 7.2 6.02 5.47Slovenia 1.46 9.9 9.9 19.68 20.09
European Union 1.80 9.1 44.0 15.36 13.22Source: (1) OECD, (2) European Commission, (3) Author’s calculation on the basis of UNESCO, OECD and
EUROSTAT data
Indeed, while some of the CEECs have not yet fully taken advantage of the opportunitiestrade integration with the EU is offering them, the main issue for the most advanced ones is morehow to sustain the incipient convergence towards EU levels of income. As noted above, theexperience of earlier entrants seem to indicate that trade integration may provide only atemporary boost to the countries’ growth rate, after which the latter would settle back towardsthe regional average rate, with little further gain in terms of convergence. Taking the CEECs asa whole, Figures 8 and 9 show indeed little convergence of late. Whether and to what extent,this is a reflection of the acceleration of growth within the EU itself during the period, and/or to adrying out of the initial trade liberalization effect, it is probably too early to tell. What theprecedent of the cohesion countries suggests however is that, over the medium term, thecandidates may need to depend, more than anything, on Single Market and Economic andMonetary Union policies to give a second wind to their initial advances towards the higherstandard of living of the EU. Similarly, when it comes to reducing internal regional disparities,the candidates may be wise to put greater store by removing obstacles to labor mobility (e.g.,uniform minimum wages, rigidities in housing markets), than by EU subsidies.
37 It should be noted, however, that such an indicator of human capital endowments does not take into considerationthe significant differences that seem to exist in the quality of education systems between the CEECs and the currentEU members.

29
5. Concluding Remarks
The theoretical and empirical discussions above seem therefore to yield a few generallessons which current candidates may want to incorporate in their accession strategies. Here aresome of the main ones:
(a) Although theory envisages this possibility, there seems to be little reason to fearthat trade integration, per se, would cause economies to diverge. As predicted bystandard models, a main effect of European economic integration has been tofacilitate a diffusion of technologies, as encapsulated by converging capital/laborratios, which in turn has fueled real convergence;
(b) Real convergence is not a foregone conclusion however. Whether it happens or notdepends crucially on a number of other factors. In particular, the experience of thecohesion countries supports the emphasis placed in the recent growth literature onthe crucial role of human capital for achieving real convergence.
(c) Similarly, the experiences of Greece and Ireland provide real-life confirmation thatlittle can compensate for the lack of a stable, growth-promoting environment. Inthat sense, other common European policies, such as the Single Market and theEconomic and Monetary Union, might be just as important as trade in sustainingincome convergence over the long haul.
(d) It is possible for integrating countries to take advantage of internationaltechnological spillovers to overcome “technological backwardness” (in the words ofGershenkron), foreign direct investment being one of the main channel of diffusion.Macroeconomic stability and a good human capital endowment are essential toharness these benefits.
(e) Pending further empirical analysis, candidate countries may be ill advised to putexcessive store by EU regional to fuel their convergence. The fact that the topbeneficiary of EU funds, Ireland, also has the most outstanding convergence, shouldnot conceal that Greece, the number two recipient had, until recently, much less toshow for it. At a minimum, what this suggests, is that other factors(macroeconomic and institutional framework, competition, labor mobility) will beessential in determining the outcomes (of EU transfers).
In brief, while EU integration can be propitious for income convergence, it is not asubstitute for the domestic policies necessary to achieve the latter.

30
Methodological Appendix
Decomposition of GDP Growth
In this respect, on the basis of a simple arithmetic exercise, it is possible break down the percapita GDP growth of every country into its components. Thus, it is shown that a country's percapita GDP growth hinges on an increase in labor productivity -which in turn can be brokendown into variations in working time and in hourly productivity- and on employment rategrowth.
Decomposition of the per capita GDP (GDPpc):
ErLpPop
LL
GDPPopGDP
GDPpc *===
where,
GDP:Gross Domestic ProductPop: PopulationL: EmploymentLp: Labor productivityEr: Employment rate
Decomposition of Labor productivity (Lp):
hHphhL
GDPL
GDPLp *
*===
where,
h: Working time (in yearly hours per person)Hp: Hourly productivity
Decomposition of the Employment rate (Er)
PopEap
EapLf
LfL
PopL
Er ==
where,
Lf: Labor forceEap: Economically active population
31
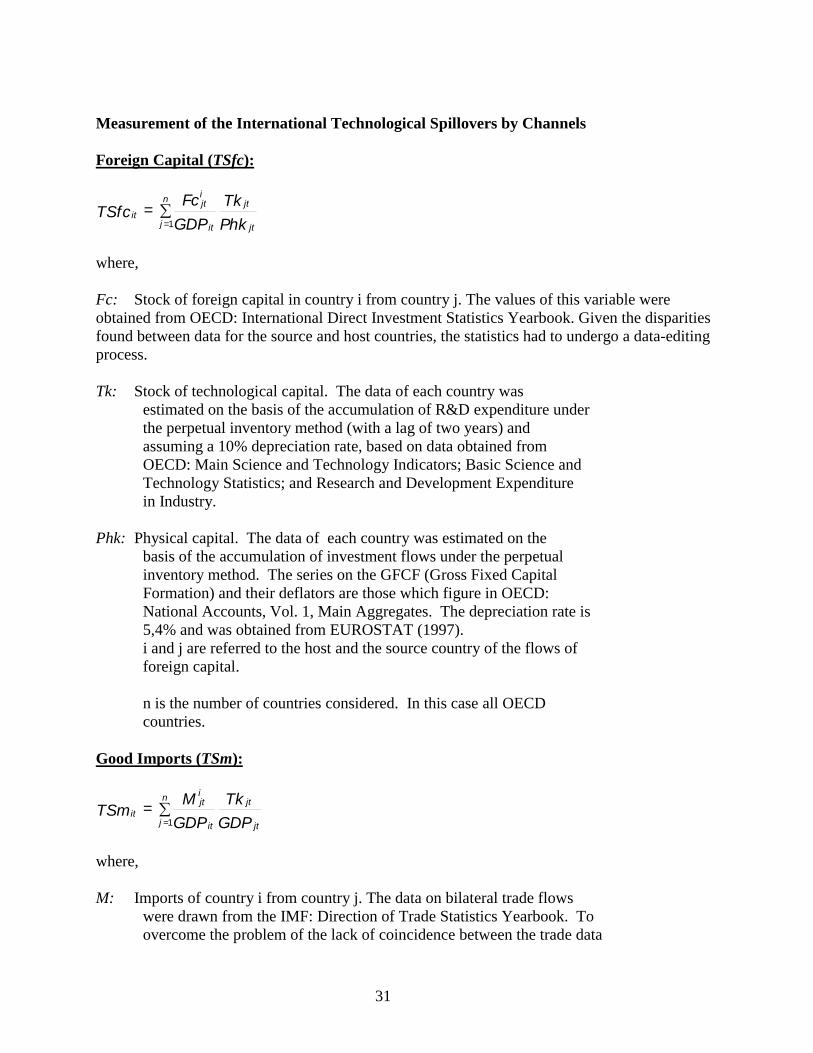
Measurement of the International Technological Spillovers by Channels
Foreign Capital (TSfc):
PhkTk
GDPFc
TSfcjt
jtn
j it
ijt
it �==1
where,
Fc: Stock of foreign capital in country i from country j. The values of this variable wereobtained from OECD: International Direct Investment Statistics Yearbook. Given the disparitiesfound between data for the source and host countries, the statistics had to undergo a data-editingprocess.
Tk: Stock of technological capital. The data of each country wasestimated on the basis of the accumulation of R&D expenditure underthe perpetual inventory method (with a lag of two years) andassuming a 10% depreciation rate, based on data obtained fromOECD: Main Science and Technology Indicators; Basic Science andTechnology Statistics; and Research and Development Expenditurein Industry.
Phk: Physical capital. The data of each country was estimated on thebasis of the accumulation of investment flows under the perpetualinventory method. The series on the GFCF (Gross Fixed CapitalFormation) and their deflators are those which figure in OECD:National Accounts, Vol. 1, Main Aggregates. The depreciation rate is5,4% and was obtained from EUROSTAT (1997).i and j are referred to the host and the source country of the flows offoreign capital.
n is the number of countries considered. In this case all OECDcountries.
Good Imports (TSm):
�==
n
j jt
jt
it
ijt
itGDPTk
GDPM
TSm1
where,
M: Imports of country i from country j. The data on bilateral trade flowswere drawn from the IMF: Direction of Trade Statistics Yearbook. Toovercome the problem of the lack of coincidence between the trade data
32
from the standpoint of imports (fob) and of exports (fob), thearithmetical mean between both of them was calculated.
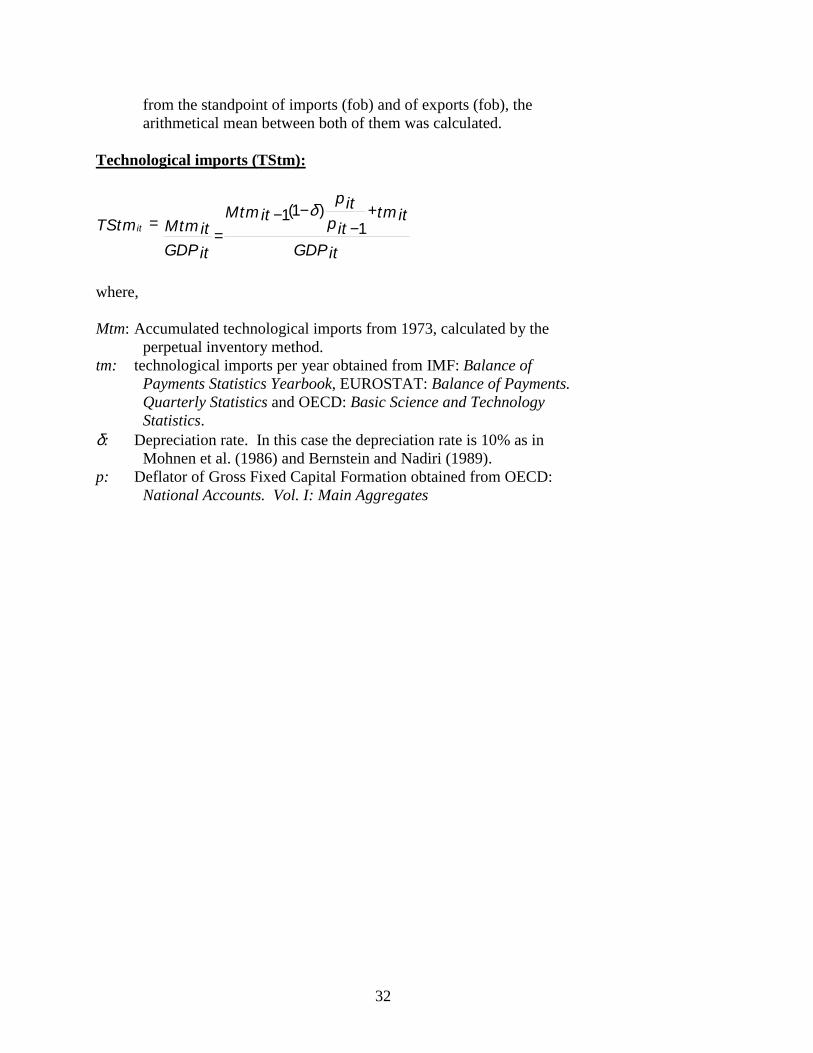
Technological imports (TStm):
GDP it
tmitpit
pitMtmit
GDP it
MtmitTStmit
+−
−−=
= 1)1(1 δ
where,
Mtm: Accumulated technological imports from 1973, calculated by theperpetual inventory method.
tm: technological imports per year obtained from IMF: Balance ofPayments Statistics Yearbook, EUROSTAT: Balance of Payments.Quarterly Statistics and OECD: Basic Science and TechnologyStatistics.
δ: Depreciation rate. In this case the depreciation rate is 10% as inMohnen et al. (1986) and Bernstein and Nadiri (1989).
p: Deflator of Gross Fixed Capital Formation obtained from OECD:National Accounts. Vol. I: Main Aggregates

33
References
Aghion, P., Caroli, E. and C. García Peñalosa. 1999 “Inequality and economic Growth: ThePerspective of the New Growth Theories,” Journal of Economic Literature, XXXVII: 1615-1660.
Aghion, P. and P. Howitt. 1998 Endogenous Growth Theory, The MIT Press, Massachusetts
Alesina, A. and R. Perotti. 1995 “Fiscal Expansions and Adjustments in OECD Countries,”Economic Policy, 21: 205-40.
Alesina, A. and R. Perotti. 1996 “Fiscal Adjustment,” Working Paper 96/70, InternationalMonetary Fund, Washington, DC.
Argimon, I., J.M. González Páramo, and J.M. Roldán. 1997 “Evidence of Public SpendingCrowding-out from a Panel of OECD Countries,” Applied Economics, 29: 1001-10.
Aschauer, D.A. 1989 “Is Public Expenditure Productive?” Journal of Monetary Economics, 23:177-200.
Aschauer, D.A. 2000 “Public Capital and Economic Growth: Issues of Quantity, Finance, andEfficiency,” Economic Development and Cultural Change, 48(2): 391-406.
Atkinson, A.B. 1999 “The distribution of income in the UK and OECD countries in the twentiethcentury,” Oxford Review of Economic Policy, 15: 56-75.
Baldwin, R.R.; H. Braconier and R. Forslid. 1999 “Multinationals, endogenous growth andtechnological spillovers: theory and evidence,” Working Paper 2155, CEPR, London.
Baldwin, R. and A. Venables. 1995 “Regional Economic Integration,” in G. M. Grossman and K.Rogoff (eds.): Handbook of International Economics, vol. 3: 1597-1644, Elsevier,Amsterdam.
Barro, R.J. and J.W. Lee. 1993 “International comparisons of educational attainment,” Journal ofMonetary Economics, 32, 363-394.
Barro, R.J. and J.W. Lee. 1996 “International Measures of Schooling Years and SchoolingQuality,” American Economic Review. Papers and Proceedings, 86(2): 218-23.
Barro, R. and X. Sala-i-Martin. 1995 Economic Growth, McGraw-Hill, Inc., USA.
Barry, F. (ed.) 1999 Understanding Ireland's Economic Growth, Macmillan, London.
Baumol, W.; R. Nelson, and E. Wolff. 1994 Convergence of Productivity: Cross-nationalStudies and Historical Evidence, Oxford University Press, Oxford.

34
Ben-David, D. 1993 “Equalizing Exchange Trade Liberalization and Income Convergence,”Quarterly Journal of Economics, 108: 653-79.
Ben-David, D. 2000 “Trade, Growth and Disparity Among Nations,” in Trade and Poverty,World Trade Organization, Geneva.
Bernstein, J.I. and M.I. Nadiri. 1989 “Rates of Return on Physical and R&D Capital andStructure of the Production Process: Cross section and Time Series Evidence,” in Raj, B.(ed.): Advances in Econometrics and Modeling: 169-187. Kluwer Academic Publishers,London.
Blomström, M. and E. Wolff. 1994 “Multinational Corporations and Productivity Convergencein Mexico,” in Baumol, W., Nelson, R. and Wolff, E. (eds.) Convergence of Productivity:Cross-national Studies and Historical Evidence, Oxford University Press, Oxford.
Boldrin, M. and Canova, F. 2000 “Inequality and Convergence: Reconsidering EuropeanRegional Policies,” Presentation to the 31st panel Meeting of “Economic Policy,” Lisbon.
Boyle, G.E. and T.G. McCarthy. 1997 “A Simple Measure of β-Convergence,” Oxford Bulletinof Economics and Statistics, 59(2): 257-264.
Boyle, G.E. and T.G. McCarthy. 1999 “Simple Measures of Convergence in per Capital GDP: aNote on Some Further International Evidence,” Applied Economics Letters, 6: 343-347.
Braconier, H. and Sjöholm, F. 1998 "National and International Spillovers form R&D:Comparing a Neoclassical and an Endogenous Growth Approach", WeltwirtschaftlichesArchiv, 134 (4): 638-663.
Bresnaham, T.F. and M. Trajtenberg. 1995 “General Purpose Technologies: Engines of Growth,”Journal of Econometrics, 65: 83-108.
Cannon, E. 2000 “Human capital: level versus growth effects,” Oxford Economic Papers 52:670-676.
Coe, D.T. and E. Helpman. 1995 “International R&D Spillovers,” European Economic Review,39 (5): 859-887.
Cowell, F. 1999 “Measurement of inequality,” in A.B. Atkinson and F. Bourguignon (eds.):Handbook of Income Distribution, North Holland, Amsterdam.
Crandall, R.W. 1997 “Are Telecommunications Facilities ‘Infrastructure’? If they are, so what?”,Regional Science and Urban Economics, 27: 161-179.
Easterly, W. and S. Rebelo. 1993 “Fiscal Policy and Economic Growth,” Journal of MonetaryEconomics, 32: 417-58.
35
Easterly, W. and R. Levine. 2000. “It’s not factor accumulation: stylized facts and growthmodels,” Mimeo, World Bank, Washington, DC.
European Commission. 1999 Sixth Periodic Report on the Social and Economic Situation andDevelopment of Regions in the European Union, European Commission, Luxembourg.
European Union Statistical Office 1997 “The Capital Stock in the European Union. StructuralDiagnosis and Analytical Aspects,” EUROSTAT, Luxembourg.
European Union Statistical Office 1999 “Purchasing power parities and related economicindicators. Results for 1995 and 1996,” EUROSTAT, Luxembourg.
Grossman, G.M. 1996 Economic Growth: Theory and Evidence, vol. I and II, Elgar Cheltenham.
Helpman, E. (ed.) 1998 General Purpose Technologies and Economic Growh, MIT Press, Massachusetts.
Hervé, Y: 1999. “EU regional transfers and macroeconomic fiscal reaction in cohesion countries:and empirical analysis,” mimeo, presentation at the World Bank, Washington, DC.
Hervé, Y and R. Holzmann 1998. “Fiscal Transfers and Economic Convergence in the EU: anAnalysis of Absorption Problems and an Evaluation of the Literature,” Nomos Baden-Baden.
Hine, R. 1994 “International Economic Integration,” in D. Greenaway and A. Winters (eds.),Surveys in International Trade, Blackwell, Oxford.
Kaminski, B. and M. Riboud. 2000 “Foreign Investment and Restructuring. The Evidence fromHungary,” Technical Paper 453, World Bank, Washington DC.
Keller, W. 1999 “How trade patterns and technology flows affect productivity growth,” WorkingPaper 6990, NBER, Cambridge, Massachusetts.
Koski, H.A. and S.K. Majumdar. 2000 “Convergence in Telecommunications InfrastructureDevelopment in OECD Countries,” Information Economics and Policy, 12: 111-131.
Krugman, P. 1991 Geography and Trade, MIT Press, Cambridge, Massachusetts.
Lucas, R.E. 1988 “On the Mechanics of Economic Development,” Journal of MonetaryEconomics, 22(1): 3-42.
Mankiw, N.G., D. Romer and D.N. Weil. 1992 “A Contribution to the Empirics of EconomicGrowth,” Quarterly Journal of Economics, 107 (2): 407-437.
Martín, C. 2000 The Spanish Economy in the New Europe, Macmillan, UK and St. Martin'sPress, USA.

36
Martín, C. and Velázquez, F.J. 2001 "An assessment of real convergence of less developed EUmembers: lessons for the CEEC candidates", Working Paper n. 5, European EconomyGroup (EEG), Universidad Complutense de Madrid.
Martín, C.; Velázquez, F.J. and Crespo 2001 "The role of International Technological Spilloversin the Economic Growth of the OECD Countries", Working Paper n. 6, EuropeanEconomy Group (EEG), Universidad Complutense de Madrid.
Mohnen, P.A.; Nadiri, M.I. and Prucha, I.R. 1986 “R&D, production structure and rates of returnin the U.S., Japanese and German manufacturing sectors,” European Economic Review,30: 749-771.
Munnell, A. 1990 “How does public infrastructure affect regional economic performance?” in:Munnell, A. (ed.): Is there a shortfall in public capital investment?, Federal Reserve Bankof Boston, Boston.
Nadiri, M.I. 1993 “Innovations and Technological Spillovers,” NBER Working Paper 4423,Cambridge, Massachusetts.
Nadiri, M.I. and S. Kim. 1996 “International R&D Spillovers, Trade and Productivity in MajorOECD Countries,” NBER, Working Paper 5801, Cambridge, Massachusetts.
Nelson, R. and E. Phelps. 1966 “Investment in Humans, Technological Diffusion, and EconomicGrowth,” American Economic Review, 61: 69-75.
Organization for Economic Cooperation and Development. 1999 OECD Economic Surveys:Ireland, OECD, Paris.
Ottaviano and Puga. 1998 “Agglomeration in the global economy: a survey of the new economicgeography,” World Economy, 21.
Panagariya, A. 2000 “Preferential Trade Liberalization: the Traditional Theory and NewDevelopments,” in Journal of Economic Literature (June).
Perotti, R. 1996 “Fiscal Consolidation in Europe: Composition Patterns,” American EconomicReview, 86(2): 105-10.
Pritchett, L. 1997 “Divergence, Big Time,” Journal of Economic Perspectives (U.S.), 11(3): 17.
Quah, D.T. 1993 “Galton's Fallacy and Tests of the Convergence Hypothesis,” The ScandinavianJournal of Economics, 95: 427-43.
Quah, D. T. 1995 “Empirics for Economic Growth and Convergence,” London School ofEconomics, Economics Department, Mimeo.
37
Quah, D. T. 1996 “Convergence Empirics Across Economies with Some Capital Mobility,”Journal of Economic Growth, 1(1): 95-124.
Roller, L.H. and L. Waverman. 1994 The impact of telecommunications infrastructure oneconomic growth and development, OECD, Paris.
Romer, P. 1986 “Increasing returns and long run growth,” Journal of Political Economy, 94,1002-1037.
Romer, P.M. 1990 “Endogenous Technological Change,” Journal of Political Economy, 98: 5-21.
Slesnick, D.T. 1998 “Empirical Approaches to the Measurement of Welfare,” Journal ofEconomic Literature, vol. XXXVI: 2108-2165.
Solow, R.M. 1956 “A Contribution to the Theory of Economic Growth,” Quarterly Journal ofEconomics, 70(1): 65-94.
Temple, J. 1999 “The New Growth Evidence,” Journal of Economic Literature, XXXVII: 112-156.
Viner, J. 1950 The Customs Union Issue. Carnegie Endowment for International Peace, NewYork.
World Bank 2000 Progress toward the Unification of Europe, World Bank, Washington, DC.