readout no.43e 14 product introduction - horiba · 2016-04-22 · product introduction technical...
TRANSCRIPT

65English Edition No.43 May 2015
Technical ReportsProduct Introduction
Laser Spectroscopic Motor Exhaust Analyzer QL-N2O
Kenji HARANitrous Oxide (N2O) emission reduction has gained large prominence recently
due to its contribution to the climate change as a greenhouse gas. The
United States Environment Protection Agency together with the United States
Department of Transport has already regulated the N2O emissions from Light-
Duty Vehicles and Heavy-Duty Engines. N2O measurement should be done
from sample storage bags. Performance requirement of the analyzer is to be
able to measure N2O gas concentration of sub-ppb order. N2O gas analyzer, QL-
N2O has been developed as one analyzer for integrated to MEXA-ONE. QL-
N2O is utilizing Quantum Cascade Laser and this analyzer can measure N2O
concentration of ten ppb order.
Introduction[1]
Recently, Nitrogen Oxides (NOx) that results from automobile exhaust emissions have become subject to regulations. With the r ise of global environmental consciousness, regulations on automobile exhaust emissions have become more stringent, demanding a further decrease in NOx emissions. In response, several different NOx after treatment systems are under research and development. To evaluate the performance of these after-treatment devices, analysis of NOx compounds should not only include NO and NO2, but also N2O and NH3. For example, NH3 measurement are integral for the optimization of urea injection rate in heavy-duty diesel vehicles using Selective Catalyst Reduction (SCR) with urea injection systems. In Europe, regulations have already been implemented for NH3 in the exhaust of SCR equipped vehicles. These regulations are scheduled to be further strengthened in the next term’s Euro VI emission standards. On the other hand, new regulations and the requirements for annual emission reports in the United States have resulted in an increased need for N2O measurement , due to it s Greenhouse Gas (GHG) properties.
N2O is a trace gas that exists naturally in the atmosphere with a level of about 300 ppb. It is the most common tropospheric nitrogen species aside from molecular nitrogen. Because it is a stable molecule, it has a very long
life time, which has been recorded as ranging from 130 to 170 years.[2] In addition, since N2O has an even greater propensity for absorbing infrared radiation than CO2, there is a possibility that N2O may contribute significantly to global warming.[3] The EPA/NHTSA has finalized GHGs emissions standards that will cap tailpipe N2O emissions for Light Duty Vehicles (LDV) at 0.010 g/mile, [4] and LDVs will be obligated to install sample storage bags for N2O measurements. For Heavy Duty Engines (HDE), the EPA has established N2O emission regulations of 0.10 g/bhp-hr. [5] The newest N2O reg-ulations for diesel engines will be implemented in 2017. Normally, emissions from HDEs can be measured directly from the exhaust or even after dilution, without the sample storage bags. Hence, in order to comply with exhaust emission regulations of both LDVs and HDEs, there is now a need for analyzer systems that are compatible with diluted exhaust gas bags and continuous measurement. To accurately calculate the values requested in these regulations, concentration readings must have a margin of error less than 50 ppb.
For N2O measurement, the most commonly used methods are Non-Dispersive Infrared detection (NDIR), Fourier Transform Infrared detection (FTIR), and Gas Chro-matography (GC). Although these are all accurate analysis methods, their measuring sensitivity and susceptibility to interference are not necessarily the most optimum to meet the measurement demands for current regulations.
66 English Edition No.43 May 2015
Product Introduction
Laser Spectroscopic Motor Exhaust Analyzer QL-N2O
Therefore in 2011, infrared spectroscopy method by using laser was defined as a viable measurement principle in the EPA regulations due to the potential of its laser which is able to improve sensitivity and reduce interference.
In 2012, the MEXA-1100QL-N2O system based on the Mid-Infrared Quantum Cascade Laser Spectroscopy (QCL-IR) was developed for measuring ultra-low concen-trations of N2O in automobile exhaust gas sampled in a sample storage bag.[6] This system can be utilized either independently, or integrated into the automobile exhaust analysis system MEXA-7000. The system conforms to the 40 CFR Part 1065/1066 GHG standards set by the U.S. EPA. This paper presents the Mid-Infrared Quantum Cas-cade Laser (QCL-Mid IR) Spectroscopic Motor Exhaust Gas analyzer unit, called MEXA-1100QL-N2O analyzer, which is a part of the integrated MEXA-ONE Motor Ex-haust Gas Analysis System, developed to provide one minute measurements corresponding to the current regu-latory requirements.
Measurement Principle
Quantum Cascade Laser (QCL) is being recently applied to a new method for laser detection, as an alternative to traditional diode lasers which could not emit light in the mid-infrared range. Due to the mid-infrared laser’s inherent properties, QCL-IR is able to scan in the micro-wavelength region
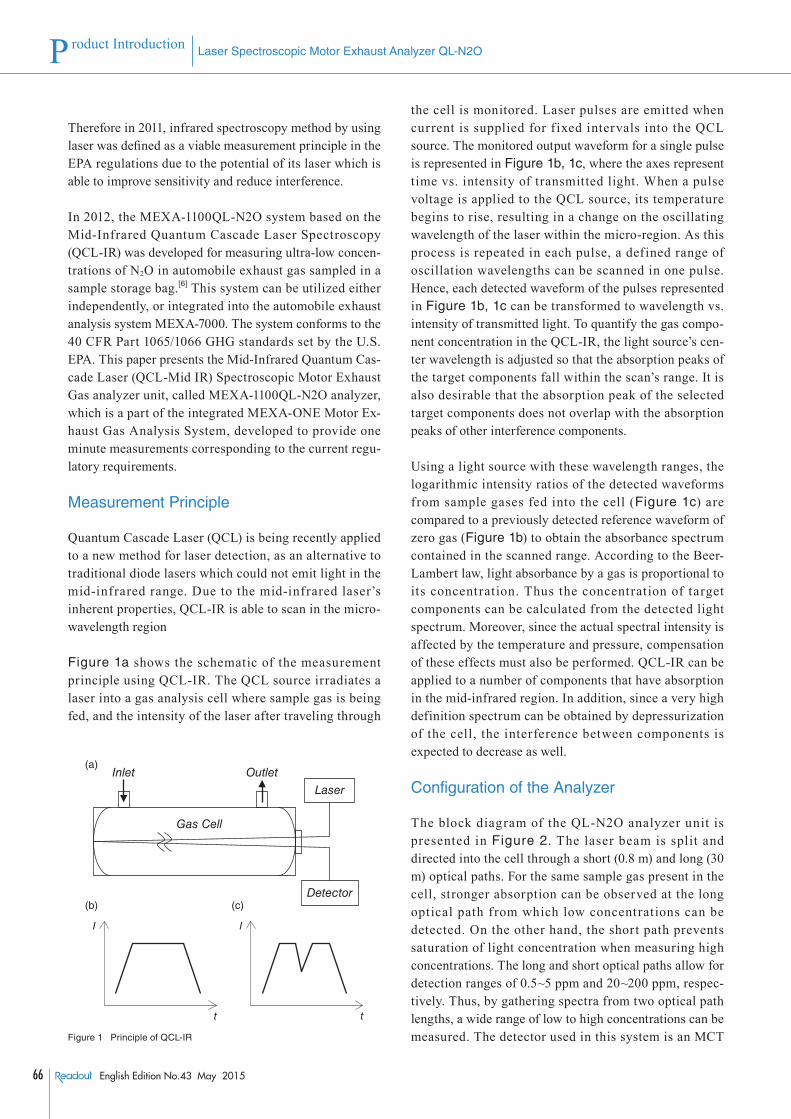
Figure 1a shows the schematic of the measurement principle using QCL-IR. The QCL source irradiates a laser into a gas analysis cell where sample gas is being fed, and the intensity of the laser after traveling through
the cell is monitored. Laser pulses are emitted when current is supplied for f ixed intervals into the QCL source. The monitored output waveform for a single pulse is represented in Figure 1b, 1c, where the axes represent time vs. intensity of transmitted light. When a pulse voltage is applied to the QCL source, its temperature begins to rise, resulting in a change on the oscillating wavelength of the laser within the micro-region. As this process is repeated in each pulse, a defined range of oscillation wavelengths can be scanned in one pulse. Hence, each detected waveform of the pulses represented in Figure 1b, 1c can be transformed to wavelength vs. intensity of transmitted light. To quantify the gas compo-nent concentration in the QCL-IR, the light source’s cen-ter wavelength is adjusted so that the absorption peaks of the target components fall within the scan’s range. It is also desirable that the absorption peak of the selected target components does not overlap with the absorption peaks of other interference components.
Using a light source with these wavelength ranges, the logarithmic intensity ratios of the detected waveforms from sample gases fed into the cell (Figure 1c) are compared to a previously detected reference waveform of zero gas (Figure 1b) to obtain the absorbance spectrum contained in the scanned range. According to the Beer-Lambert law, light absorbance by a gas is proportional to its concentration. Thus the concentration of target components can be calculated from the detected light spectrum. Moreover, since the actual spectral intensity is affected by the temperature and pressure, compensation of these effects must also be performed. QCL-IR can be applied to a number of components that have absorption in the mid-infrared region. In addition, since a very high definition spectrum can be obtained by depressurization of the cell, the interference between components is expected to decrease as well.
Configuration of the Analyzer
The block diagram of the QL-N2O analyzer unit is presented in Figure 2. The laser beam is split and directed into the cell through a short (0.8 m) and long (30 m) optical paths. For the same sample gas present in the cell, stronger absorption can be observed at the long optical path from which low concentrations can be detected. On the other hand, the short path prevents saturation of light concentration when measuring high concentrations. The long and short optical paths allow for detection ranges of 0.5~5 ppm and 20~200 ppm, respec-tively. Thus, by gathering spectra from two optical path lengths, a wide range of low to high concentrations can be measured. The detector used in this system is an MCT
(c)
(a)Inlet Outlet
Laser
Detector
Gas Cell
t
I
t
I
(b)
Figure 1 Principle of QCL-IR

67English Edition No.43 May 2015
Technical Reports
semiconductor infrared detector, which operates at room temperature.
Sample gas is supplied to the gas cell after passing through a preprocessing filter and a critical f low orifice (CFO). The CFO has the function to maintain a constant f low rate, and combined with the downstream vacuum pump, the cell is maintained at a constant absolute pres-sure of about 25 kPa. Generally, a sharper absorption peak can be ob tained by preserving the optical path in a vacuum state, thus facilitating the separation of spectra from other coexisting gas components, minimizing their interference.
System Configuration
In the MEXA-ONE system, the number of analyzer units
is minimized to achieve one minute measurements. The units are mounted on a 19 inch rack, along with a Multi-Gas Controller (MGC) and a Sample Handling System (SHS), supplied by a calibration and sample gas lines. (Figure 3)
Equipment Performance
Noise and detection sensitivityThe noise of the QL-N2O is defined at double standard deviations (2σ), with a reference zero point below 10 ppb. Figure 4 shows the results when switching N2O 10 ppb to zero gas (N2). The 2σ calculated from the data when supplying Zero gas is 0.5 ppb. At a 10 ppb concentration, the 2σ results in 0.8 ppb. The 10 ppb concentration difference here can be clearly seen.
Accuracy and linearityMeasured concentration is corrected by 21 cut points of 5 ppm and 200 ppm ranges, and accuracy is warranted at same 21 cut points. Linearity is evaluated by intercept, slope, and coefficient of determination (R2) as shown in Figure 5.
Zero/Spanfrom MGC
Measurefrom SHS
F: Filter
CFO: Orifice
DET: Detector
BS: Beam Splitter
PS: Pressure Sensor
TS: Temperature Sensor
REG: Vacuum Regulator
Gas Cell
Analyzer unit
Vacuum pump unit
FCFO
BS
PS TS
DE
T
Controlunit
Laser
DET
Exhaust
FREG
Figure 2 Block diagram of QL-N2O
QL-N2O: Analyzer unit
QL-N2O: Control unit
QL-N2O: Vacuum Pump unit
MEXA-ONE
MGC
SHS
Figure 3 MEXA-ONE with QL-N2O
Con
cent
ratio
n [p
pb]
15
10
5
0
-560 180 2400 120
Time [s]
Target = 10 ppbAverage = 10.4 ppb2σ= 0.8 ppb
Target = 0 ppbAverage = 0.2 ppb2σ= 0.5 ppb
Figure 4 Noise and detection limit
5 ppm range
y = 1.0001E+00x-2.4113E-04R2 = 9.9998E-01
5.02.01.0 4.00.0 3.0
Target Concentration [ppm]
5.0
4.0
3.0
2.0
1.0
0.0
Mea
sure
d C
once
ntra
tion
[ppm
]
Figure 5 Corrected linearization curve at 5 ppm range

68 English Edition No.43 May 2015
Product Introduction
Laser Spectroscopic Motor Exhaust Analyzer QL-N2O
Figure 6 shows measurement results for atmospheric concentration levels of N2O. Gases of 300 ppb and 306 ppb were measured, generated from a 600 ppb gas cylinder using a gas divider. The measured average concentrations were 299.8 ppb and 306.3 ppb, with a 2σ value of 0.5 ppb and 0.6 ppb, respectively. From these results it can be seen that N2O atmospheric concentration levels can be measured with high accuracy.
Effects of interferenceConcentrat ion calculat ion was performed f rom an absorption peak near 4.7 μm obtained by the QL-N2O. Since CO2 and H2O have absorption peaks near the 4.7 μm wavelength, interference from these gases was expected. However, the effects of interference from CO2 and H2O absorption peaks have been minimized in this spectrometer, to the specified values of ±10 ppb. The effects of interference from CO2 and H2O can be seen in Figure 7. The effects of interference were determined by the difference of the concentration averages when feeding interference component gases (CO2 and H2O) and Zero gas. Interference by CO2 was +3.3 ppb and interference by H2O was -0.6 ppb.
Experimental results of interference effects using a similar analyzer to the MEXA-1100QL-N2O are pre-sented in Figure 8. These results were provided by the Japan Automobile Research Institute. In this experiment, five gases (N2O, CH4; 100~200 ppm, CO; 100~250 ppm, H2O; 2.0~2.5%, CO2; 1.5~4.5%) were sampled in bags, from which six sampling bags were generated by mixing with a 0.4~1 ppm concentration of N2O. Concentration results from these six sampling bags obtained using GC-ECD and MEXA-1100QL-N2O were compared, giving a 1.0055 slope and 0.0008 intercept, showing excellent correlation between both tests.
Conclusions
This paper presents an outline of the Mid-Infrared Laser Absorption Spectroscope for Automobile Exhaust Emis-sions Analysis. The performance of the QL-N2O used in the MEXA-1100QL-N2O proved satisfactory for inte-gration into the one minute measurement MEXA-ONE system. Its features are outlined as follows:
(1) Highly sensitive measurements· Capable of concentration measurements at the 10 ppb level
· Measuring resolution for atmospheric concen-tration levels below 6 ppb
(2) Wide measurement range· 10 ppb (lower detection level) ~ 200 ppm (highest measurement range)
(3) Low interference· Interference of CO2 and H2O within ±10 ppb
Notes
Through this device, the applications of the MEXA-ONE systems were able to expand. This device is used to meet the GHG regulations according to the U.S. EPA, and will hopefully contribute to the solution of global environ-mental problems.
310
305
300
295
29030 90 1200 60
Time [s]
Con
cent
ratio
n [p
pm]
Average: 306.3 ppb2σ: 0.6 ppb
Average: 299.8 ppb2σ: 0.5 ppb
Figure 6 Measurement resolutions at atmospheric N2O concentration
35302520151050
-5-10-15
60 180 2400 120
Time [s]
Con
cent
ratio
n [p
pb]
H2O Intf. CO2 Intf.
CO2 5vol%: +3.9 ppbH2O 5vol%: -0.1 ppb N2: 0.5~0.6 ppb
Figure 7 Interference test of CO2 and H2O
1.2
1
0.8
0.6
0.4
0.21.20.60.40.2 10.8
GC-ECD [ppm]
ME
XA
-110
0QL-
N2O
[ppm
]
y = 1.0055x + 0.0008R2 = 0.9998
Gas compositionN2O : 0.4-1 ppmCH4 : 100-200 ppmCO : 100-250 ppmH2O : 2-2.5%CO2 : 1.5-4.5%
Figure 8 Correlation with GC-ECD in JARI (Standard gases)

69English Edition No.43 May 2015
Technical Reports
References
[ 1 ] Kenji Hara , Montaji r R AHMAN, “Automobile N2O exhaust emissions measurement using a Mid-Infrared Laser Absorption Spectroscopy Analyzer”, Readout, 40, 34 (2013)
[ 2 ] Ballantyne, V., Howes, P., and Stephanson, L.,“ Nitrous Oxide Emissions from Light Duty Vehicles,” SAE Technical Paper 940304, 1994, doi: 10. 4271/940304.
[ 3 ] IPCC/UNEP/OECD/IEA. Revised 1996 IPCC Guidelines for National Greenhouse Gas Inventories. Paris: Intergovernmental Panel on Climate Change, United Nations Environment Programme, Organization for Economic Co- Operation and Development, International Energy Agency (1997)
[ 4 ] Environmental Protection Agency“, Electronic Code of Federal Regulation, Title 40, Parts 85, 86, 600, 1033, 1036, 1037, 1039, 1065, 1066, and 1068.
[ 5 ] Environmental Protection Agency“, Electronic Code of Federal Regulation, Title 49, CFR Parts 523, 534, and 535.
[ 6 ] Montajir, R.,“ Development of an Ultra-Low Concentration N2O Analyzer Using Quantum Cascade Laser(QCL),” SAE Technical Paper 2010-01-1291, 2010, doi: 10. 4271/2010-01-1291.
Kenji HARAEnergy System Analysis R&D Dept.Application R&D Center, Research & Development DivisionHORIBA, Ltd.Ph. D