reading on grade level in third grade: how is it...
TRANSCRIPT
Reading on Grade Level in Third Grade: How Is It Related to High School Performance and College Enrollment?
A Longitudinal Analysis of Third-Grade Students in Chicago in 1996-97 and their Educational Outcomes
A Report to the Annie E. Casey Foundation
Joy Lesnick Robert M. Goerge Cheryl Smithgall Julia Gwynne
2010

Reading on Grade Level in Third Grade: How Is It Related to High School Performance and College Enrollment?
Joy Lesnick, Robert M. Goerge, and Cheryl Smithgall, Chapin Hall at the University of Chicago
Julia Gwynne, Consortium on Chicago School Research
Recommended Citation
Lesnick, J., Goerge, R., Smithgall, C., & Gwynne J. (2010). Lesnick, J., Goerge, R., Smithgall, C., & Gwynne J. (2010). Reading on Grade Level in Third Grade: How Is It Related to High School Performance and College Enrollment? Chicago: Chapin Hall at the University of Chicago
ISSN: 1097-3125
© 2010 Chapin Hall at the University of Chicago
Chapin Hall at the University of Chicago 1313 East 60th Street Chicago, IL 60637
773-753-5900 (phone) 773-753-5940 (fax)
www.chapinhall.org
Table of Contents
Executive Summary ...................................................................................................................................... 1
Introduction ................................................................................................................................................... 5
Methods......................................................................................................................................................... 8
Analytic Approach.................................................................................................................................. 12
Defining “On Grade Level” .................................................................................................................... 12
Comparing Reading Performance Over Time ........................................................................................ 14
Results ......................................................................................................................................................... 15
Relationships between Grade 3 Reading Level, High School Graduation, and College Enrollment..... 15
Using Third-Grade Performance to Predict Educational Outcomes....................................................... 17
Third-Grade Reading Level Is a Significant Predictor of Eighth-Grade Reading Performance ........ 18
Eighth-Grade Reading Achievement and Ninth-Grade School Effects Account for Many of the Differences in Ninth-Grade Student Performance.................................................................................. 20
Eighth-Grade Reading Achievement and Ninth-Grade School Effects Explain Differences in Graduation and College Enrollment Rates ............................................................................................. 24
Summary ..................................................................................................................................................... 27
References ................................................................................................................................................... 29
Appendix A: Statistical Models and Results.............................................................................................. 31
1
Executive Summary
Learning to read is one of the most important skills in modern society. Not only does reading serve as the
major foundational skill for school-based learning, but reading ability is strongly related to opportunities
for academic and vocational success. For children, a critical transition takes place during elementary
school: until the end of third grade, most students are learning to read. Beginning in fourth grade,
however, students begin reading to learn.1 Students who are not reading at grade level by third grade
begin having difficulty comprehending the written material that is a central part of the educational process
in the grades that follow. Meeting increased educational demands becomes more difficult for students
who struggle to read.
The study described here uses longitudinal administrative data to examine the relationship between third-
grade reading level and four educational outcomes: eighth-grade reading performance, ninth-grade
course performance, high school graduation, and college attendance. Using third-grade national percentile
rankings on the Iowa Tests of Basic Skills (ITBS) to place a focus cohort of 26,000 Chicago Public
Schools (CPS) students into below (0-24th national percentile), at (25th-74th national percentile) and above
grade level (75th-100th national percentile) groupings, we find correlational evidence that students who
were at and above grade level in third grade graduate and attend college at higher rates than their peers
who were below grade level in third grade.2 The results of this study do not examine whether low reading
performance causes low future educational performance, or whether improving a child’s reading
trajectory has an effect on future educational outcomes. Future research to investigate this question is
necessary.
1 This transition and the importance of early reading ability are highlighted in the Annie E. Casey Foundation’s 2010 Kids Count Special Report: Early Warning! Why Reading by the End of Third Grade Matters. 2 The focus cohort of students for this report is first-time third-grade students who took the reading portion of the ITBS test in the 1996–97 school year.
2
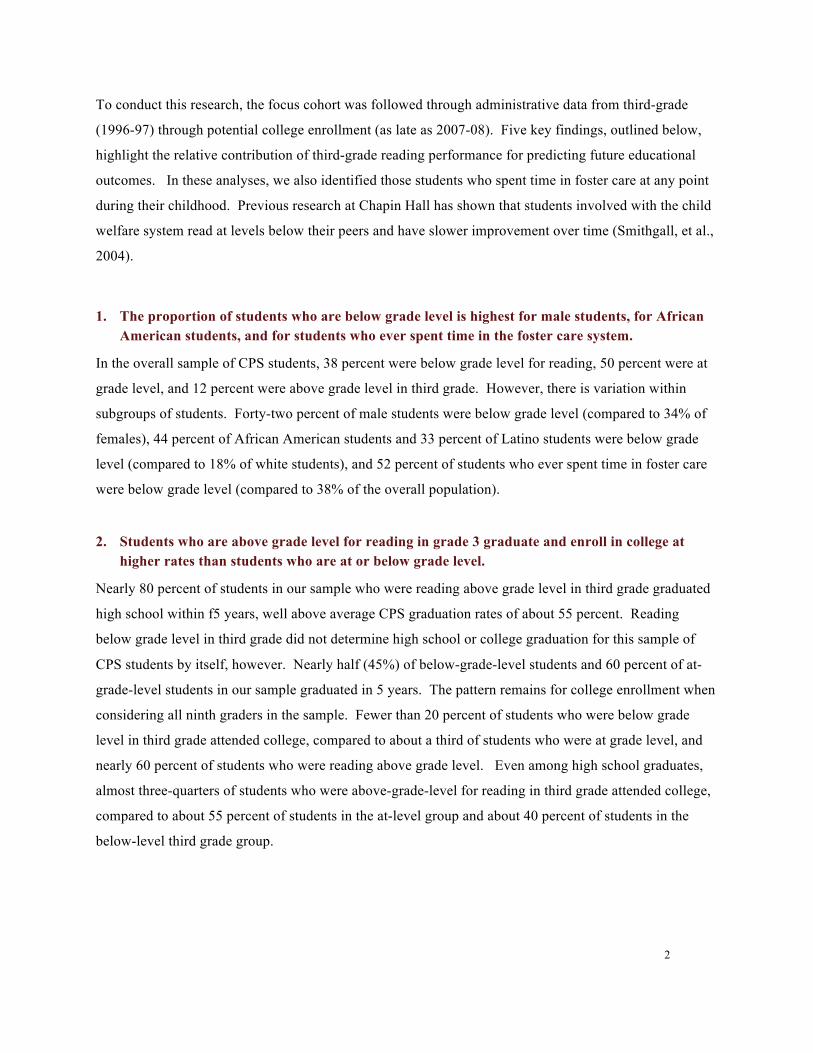
To conduct this research, the focus cohort was followed through administrative data from third-grade
(1996-97) through potential college enrollment (as late as 2007-08). Five key findings, outlined below,
highlight the relative contribution of third-grade reading performance for predicting future educational
outcomes. In these analyses, we also identified those students who spent time in foster care at any point
during their childhood. Previous research at Chapin Hall has shown that students involved with the child
welfare system read at levels below their peers and have slower improvement over time (Smithgall, et al.,
2004).
1. The proportion of students who are below grade level is highest for male students, for African American students, and for students who ever spent time in the foster care system.
In the overall sample of CPS students, 38 percent were below grade level for reading, 50 percent were at
grade level, and 12 percent were above grade level in third grade. However, there is variation within
subgroups of students. Forty-two percent of male students were below grade level (compared to 34% of
females), 44 percent of African American students and 33 percent of Latino students were below grade
level (compared to 18% of white students), and 52 percent of students who ever spent time in foster care
were below grade level (compared to 38% of the overall population).
2. Students who are above grade level for reading in grade 3 graduate and enroll in college at
higher rates than students who are at or below grade level.
Nearly 80 percent of students in our sample who were reading above grade level in third grade graduated
high school within f5 years, well above average CPS graduation rates of about 55 percent. Reading
below grade level in third grade did not determine high school or college graduation for this sample of
CPS students by itself, however. Nearly half (45%) of below-grade-level students and 60 percent of at-
grade-level students in our sample graduated in 5 years. The pattern remains for college enrollment when
considering all ninth graders in the sample. Fewer than 20 percent of students who were below grade
level in third grade attended college, compared to about a third of students who were at grade level, and
nearly 60 percent of students who were reading above grade level. Even among high school graduates,
almost three-quarters of students who were above-grade-level for reading in third grade attended college,
compared to about 55 percent of students in the at-level group and about 40 percent of students in the
below-level third grade group.

3
3. Third-grade reading level is a significant predictor of eighth-grade reading level.
Although third-grade reading level does not completely determine eighth-grade performance, there is a
strong correlation (r=0.67) between third- and eighth-grade ITBS reading scores. In other words, students
who were at or above grade level in third grade are more likely to be at or above grade level in eighth
grade. Of the students who were below grade level in third grade, about 40 percent were also below
grade level in eighth grade. Multilevel regression models that take into account third-grade school effects
and demographic characteristics of students affirm the importance of third-grade reading level. Even after
controlling for the covariates, the difference in eighth-grade performance of the three third-grade groups
(below, at, and above grade level) remain.
4. Eighth-grade reading achievement and the ninth-grade school that a student attends account for many of the differences in performance among the below, at, and above level groups in ninth grade.
Eighth-grade achievement is an important educational milestone for students. For students in this sample,
eighth-grade test scores play a large role in determining the high school they will attend. Students who
meet certain academic and attendance requirements are eligible to attend schools across the city,
regardless of where they live. As a result, high-performing students tend to attend high-performing high
schools. Similarly, low-performing students tend to enroll in lower-performing high schools. As a result
of this high school sorting process, eighth-grade performance is extremely important.
Multilevel regression models reveal that third-grade reading performance is related to ninth-grade course
performance (as measured by absences, number of course failures, and GPA), but that the difference in
ninth-grade performance of students who were in the below, at, and above grade reading levels in third
grade is mostly explained by a student’s eighth-grade reading test score and the ninth-grade school they
attend. Third-grade reading level is still a significant predictor of ninth-grade course performance, but the
majority of the differences between the ninth grade performance of students in the below, at, and above
level groups can be explained by eighth-grade reading achievement and the ninth-grade school they
attend. Conceptually, third-grade reading level is related to eighth-grade reading level, and eighth-grade
reading level is related to ninth-grade school enrollment and course performance.
5. Eighth-grade reading achievement and the ninth-grade school a student attends explain
differences in graduation and college enrollment rates.
Eighth-grade reading achievement, ninth-grade school characteristics and individual ninth-grade course
performance explain most of the differences in high school graduation and college enrollment rates for

4
students who were in the below, at, and above grade level groups in third grade. When ninth-grade
performance is included as a predictor in multilevel regression models, being above grade level in third
grade continued to have a significant relationship only when predicting college attendance among
graduates. Merely achieving at-grade-level status in third grade did not account for any additional
variance in predicting college attendance beyond ninth-grade course performance. In other words, for
students who were below- or at-grade-level in third grade, third-grade reading level influences eighth-
grade reading level, eighth-grade reading level influences ninth-grade course performance, and ninth-
grade course performance influences high school graduation rates and college attendance. However,
being above grade level in third grade was a significant predictor of college attendance. Compared to
below-grade-level students, students who were above-grade-level in third grade were more likely to
attend college, even after accounting for demographic characteristics, eighth-grade reading performance,
ninth-grade school effects, and ninth-grade course performance.
Results from this study support the idea that implementing programs that support struggling students
before high school is essential. Students who are better prepared for a successful ninth grade year are
more likely to have positive future outcomes, regardless of third grade reading status. The sooner that
struggling readers are targeted for supports, the easier it will be to ensure that students are progressing on
course toward strong performance in ninth grade, high school graduation, and college enrollment.
5
Introduction
Without question, learning to read is a necessity in our increasingly literate society. For children, it is
also a critical skill for success in school. The traditional age/grade progression of students from
elementary to middle to high school and beyond assumes that after a certain age (typically third or fourth
grade), all students will be able to read at increasingly higher levels of proficiency. As a result, students
who do not possess the expected reading skills for their grade level often fall behind their peers, making it
difficult to regain lost ground without intensive intervention.
When students have difficulty mastering reading concepts early in their schooling, they are at much
higher risk for reading difficulties later in their careers. Researchers have found that 75 percent of
students identified with reading problems in the third grade still struggle with reading in the ninth grade
(Francis, 1996; Shaywitz, Escobar, Shaywitz, Fletcher, & Makuch, 1992), and that students with poor
word identification skills in the third grade were unlikely to significantly improve their reading skills by
the end of eighth grade (Felton & Wood, 1992).
Falling behind in school has serious consequences for life outcomes. Adults with lower levels of literacy
and education are more likely than adults with higher levels of literacy and education to be unemployed
or to earn an income that falls below the poverty level (Kutner et al., 2007). Furthermore, adults without
a high school diploma or postsecondary education are more likely to be incarcerated than adults with
higher levels of education (Harlow, 2003). In short, literacy represents a key determinant of academic,
social, and economic success (Snow, Burns, & Griffin, 1998).
The Annie E. Casey Foundation’s 2010 Kids Count Special Report: Early Warning! Why Reading by the
End of Third Grade Matters highlights an important literacy learning transition that takes place during
elementary school: until the end of third grade, most children are learning to read. Beginning in fourth
grade, however, the focus shifts as students begin reading to learn. Not surprisingly, students who read
6
below grade level will have difficulty comprehending curriculum materials written for their grade level,
affecting their ability to keep pace with their on-level peers. Meeting increased educational demands as
they move from grade to grade is increasingly difficult for students who struggle with reading.
Reading serves as the major foundational skill for school-based learning, and is strongly related to future
opportunities for academic and vocational success. Research has found that, because of its visibility and
importance, when students have difficulty learning to read, their love of learning and motivation
diminishes rapidly (Stanovich, 1986). Similarly, longitudinal studies that have followed both good and
poor readers from kindergarten to adulthood have found that by the end of first grade, children who have
not been able to master reading skills at the same rate as their classmates experience substantial decreases
in their self-esteem, self-concept, and motivation to learn to read (Armbruster et al., 2001). As a
struggling reader progresses through elementary, middle, and high school, even otherwise bright students
may miss out on opportunities to learn science, math, history, and literature if they cannot read the grade-
level textbooks. By the later grades, the child’s potential—and motivation—for entering college is very
low, and motivation, self-esteem, and self-concept follow suit (Armbruster et al., 2001).
Early intervention can make a big difference for struggling readers. The research of Armbruster, Lehr,
and Osborn (2001) found that for 85 to 90 percent of poor readers, prevention and intervention programs
implemented before third grade can increase reading skills to the average grade levels. However, if
intervention is delayed until 9 years of age, approximately 75 percent of children will continue to have
difficulties learning to read throughout high school and their adult years. Because the critical time period
for supporting early reading occurs in the early grades, most commercial prevention efforts are focused on
grades K-3, when learning to read is the primary goal of schooling. For struggling readers in third grade
and higher, remedial intervention programs are less successful, but remain crucial supports for improving
current reading skills as well as future reading performance trajectories when implemented with fidelity
(Lesnick, 2006).
In this study, we examine whether third grade reading level can be used as an indicator of potential
performance on four future educational outcome measures: eighth-grade reading level, ninth-grade
course performance, high school graduation, and college attendance. Recognizing that there are a variety
of factors that influence student performance, we investigate whether third grade reading level can be a
proxy for understanding how all of the factors influencing a student’s performance may influence later
outcomes. We use administrative data from the Chicago Public Schools (CPS) to follow one focus cohort
of nearly 26,000 students from third grade through high school completion and into college to analyze the
effect of reading ability on future achievement. We define reading below grade level as the equivalent of

7
scoring at or below the 24th national percentile on the Iowa Tests of Basic Skills (ITBS), the annual
achievement test used by CPS in 1997.3 Reading at grade level is equivalent to earning a reading score
that falls between the 25th–74th national percentile, and reading above grade level is equivalent to a score
that falls at or above the 75th national percentile.
A special focus on students who ever spent time in foster care is included in the analyses because
previous research at Chapin Hall has shown that children in foster care test far behind their peers and are
more likely to drop out, repeat grades, be in special education classes, and be suspended or expelled
(Courtney et al., 2004). Furthermore, students who remained in foster care during their elementary years
were not only reading at levels below their third-grade peers, but also had growth trajectories that were
slower than other low-performing students (Smithgall et al., 2004). Because of these prior findings and
the higher prevalence of low performance, we consider students who ever spent time in foster care
separately, as well as part of the “all students” group.
In the next section, we describe the research methods employed for the study, including a description of
the sample, the analytic approach, and the ITBS test used for determining reading level. The results
section follows, describing the five key findings. Student performance on each of the educational
outcomes is presented as it occurred and adjusted for demographic characteristics, foster care
involvement, concentration of neighborhood poverty, and school-level effects. The final section provides
a summary of the research study and findings, highlighting the fact that our findings are consistent with
existing literature that emphasizes the importance of early reading ability for future educational success.
3 The Iowa Tests of Basic Skills (ITBS) was used to measure elementary student and school performance in the Chicago Public Schools (CPS) for several decades. In the late 1990s, schools were held accountable for their ITBS scores by being placed on or off probation based on the percentage of students who scored at or above national norms. ITBS scores were also used to determine which students needed to attend mandatory summer school and which were eligible for promotion to the next grade. During the 2005–2006 school year, the Illinois Standards Achievement Test (ISAT) replaced the ITBS as the primary standardized testing mechanism in CPS. (Easton, Correa, Luppescu, et al., 2003). The ITBS national percentiles used in these analyses result from a renorming of the test scores in 2000.
8
Methods
The work presented here is part of a larger research agenda aimed at understanding the importance of
reading at grade level in the early years. The primary research goal of this portion of the work is to
examine the relationship between a child’s third-grade reading level and subsequent educational
outcomes—specifically high school graduation and college attendance.
Students who were first-time third graders in Chicago Public Schools (CPS) during the 1996–97 school
year comprise the focus cohort for this research study. The third-largest school district in the United
States, CPS serves approximately 410,000 students in more than 600 schools. In the 2009-10 school year,
eighty-six percent of students in CPS were eligible for free or reduced-price lunch, and the majority of the
student population was either African American (45%) or Latino (41%). Historically, CPS students have
scored lower on standardized tests as compared to their national peers. For example, on the 2009
National Assessment of Education Progress (NAEP) administration of the Trial Urban District
Assessment, 16 percent of fourth-grade students and 17 percent of eighth-grade students in CPS scored at
or above the NAEP proficient level for reading, compared to 31 percent of fourth-grade students and 29
percent of eighth-grade students nationwide.4
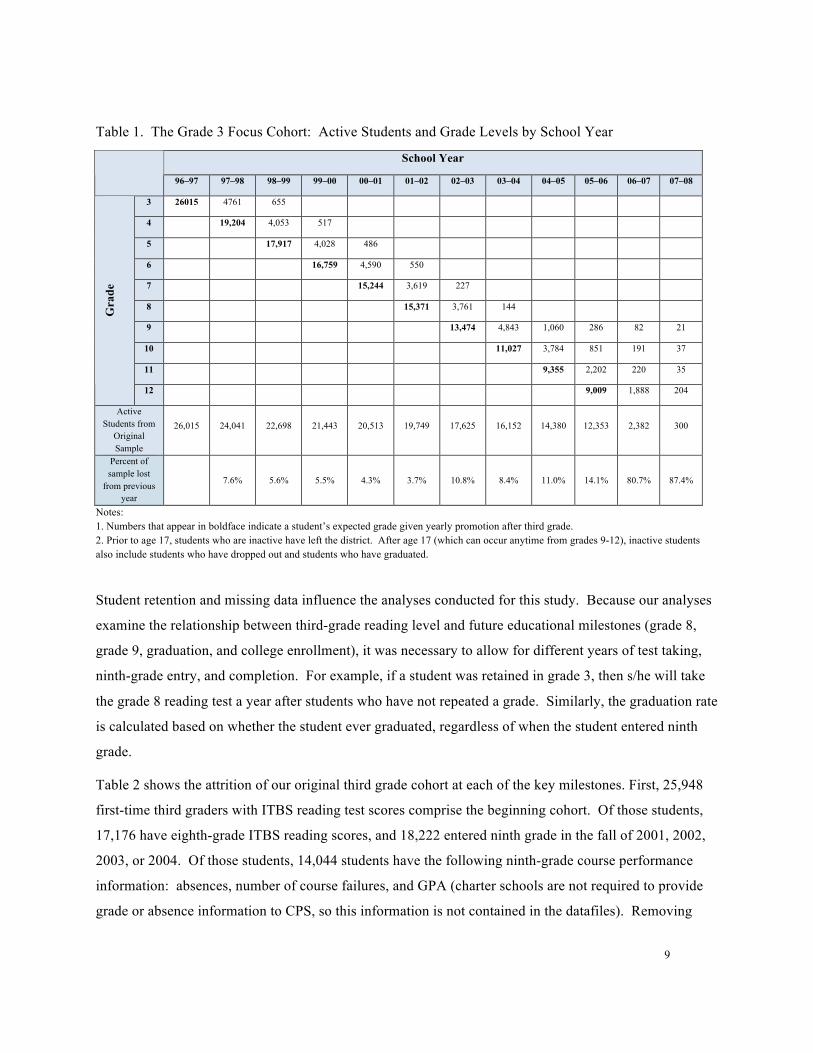
Table 1 shows the general grade progression for the focus cohort from the 1996–97 school year through
the 2007–08 school year. In addition, it shows how the number and percent of actively enrolled students
changes from year to year (bottom two rows).
4 http://nationsreportcard.gov/reading_2009
9
Table 1. The Grade 3 Focus Cohort: Active Students and Grade Levels by School Year
School Year
96–97 97–98 98–99 99–00 00–01 01–02 02–03 03–04 04–05 05–06 06–07 07–08
3 26015 4761 655
4 19,204 4,053 517
5 17,917 4,028 486
6 16,759 4,590 550
7 15,244 3,619 227
8 15,371 3,761 144
9 13,474 4,843 1,060 286 82 21
10 11,027 3,784 851 191 37
11 9,355 2,202 220 35
Gra
de
12 9,009 1,888 204
Active Students from
Original Sample
26,015 24,041 22,698 21,443 20,513 19,749 17,625 16,152 14,380 12,353 2,382 300
Percent of sample lost
from previous year
7.6% 5.6% 5.5% 4.3% 3.7% 10.8% 8.4% 11.0% 14.1% 80.7% 87.4%
Notes: 1. Numbers that appear in boldface indicate a student’s expected grade given yearly promotion after third grade. 2. Prior to age 17, students who are inactive have left the district. After age 17 (which can occur anytime from grades 9-12), inactive students also include students who have dropped out and students who have graduated.
Student retention and missing data influence the analyses conducted for this study. Because our analyses
examine the relationship between third-grade reading level and future educational milestones (grade 8,
grade 9, graduation, and college enrollment), it was necessary to allow for different years of test taking,
ninth-grade entry, and completion. For example, if a student was retained in grade 3, then s/he will take
the grade 8 reading test a year after students who have not repeated a grade. Similarly, the graduation rate
is calculated based on whether the student ever graduated, regardless of when the student entered ninth
grade.
Table 2 shows the attrition of our original third grade cohort at each of the key milestones. First, 25,948
first-time third graders with ITBS reading test scores comprise the beginning cohort. Of those students,
17,176 have eighth-grade ITBS reading scores, and 18,222 entered ninth grade in the fall of 2001, 2002,
2003, or 2004. Of those students, 14,044 students have the following ninth-grade course performance
information: absences, number of course failures, and GPA (charter schools are not required to provide
grade or absence information to CPS, so this information is not contained in the datafiles). Removing
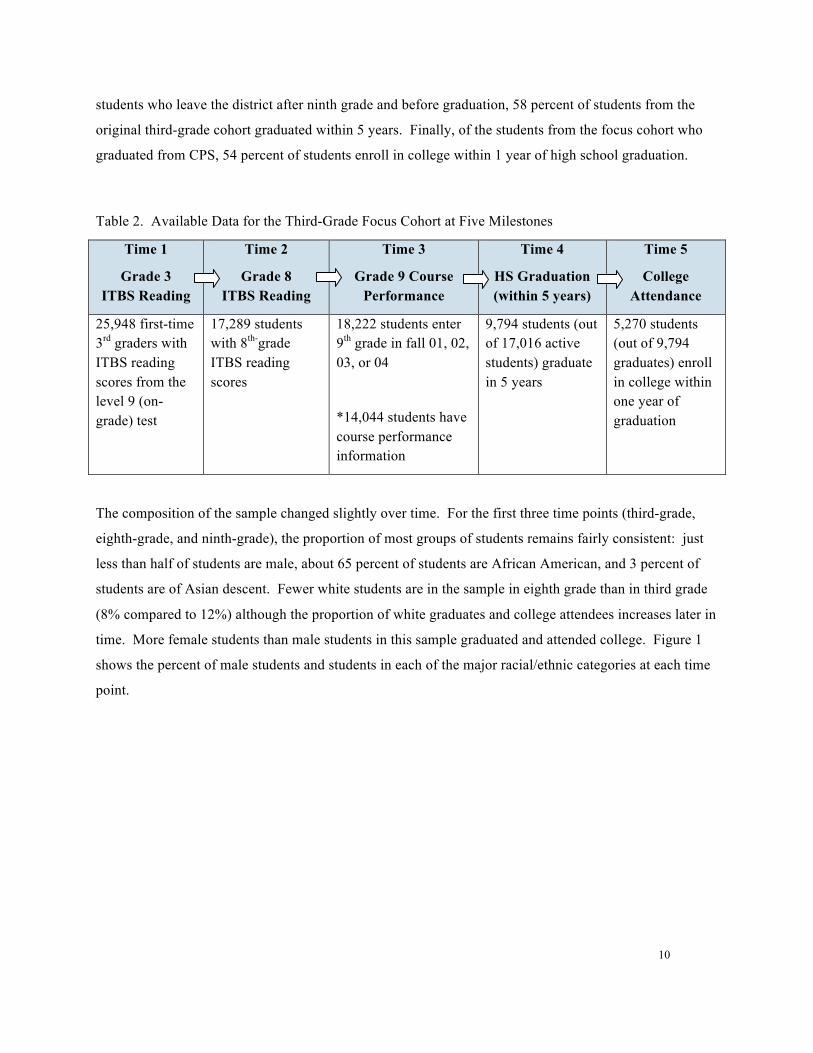
10
students who leave the district after ninth grade and before graduation, 58 percent of students from the
original third-grade cohort graduated within 5 years. Finally, of the students from the focus cohort who
graduated from CPS, 54 percent of students enroll in college within 1 year of high school graduation.
Table 2. Available Data for the Third-Grade Focus Cohort at Five Milestones
Time 1
Grade 3 ITBS Reading
Time 2
Grade 8 ITBS Reading
Time 3
Grade 9 Course Performance
Time 4
HS Graduation (within 5 years)
Time 5
College Attendance
25,948 first-time 3rd graders with ITBS reading scores from the level 9 (on-grade) test
17,289 students with 8th-grade ITBS reading scores
18,222 students enter 9th grade in fall 01, 02, 03, or 04
*14,044 students have course performance information
9,794 students (out of 17,016 active students) graduate in 5 years
5,270 students (out of 9,794 graduates) enroll in college within one year of graduation
The composition of the sample changed slightly over time. For the first three time points (third-grade,
eighth-grade, and ninth-grade), the proportion of most groups of students remains fairly consistent: just
less than half of students are male, about 65 percent of students are African American, and 3 percent of
students are of Asian descent. Fewer white students are in the sample in eighth grade than in third grade
(8% compared to 12%) although the proportion of white graduates and college attendees increases later in
time. More female students than male students in this sample graduated and attended college. Figure 1
shows the percent of male students and students in each of the major racial/ethnic categories at each time
point.
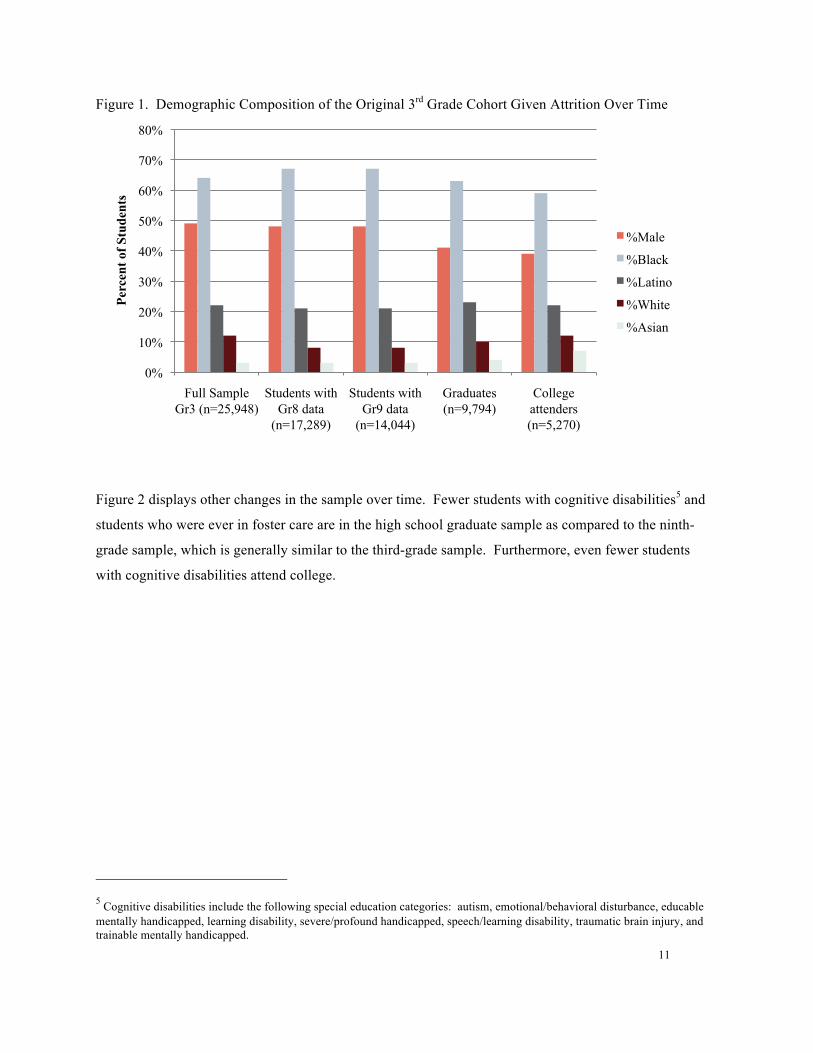
11
Figure 1. Demographic Composition of the Original 3rd Grade Cohort Given Attrition Over Time
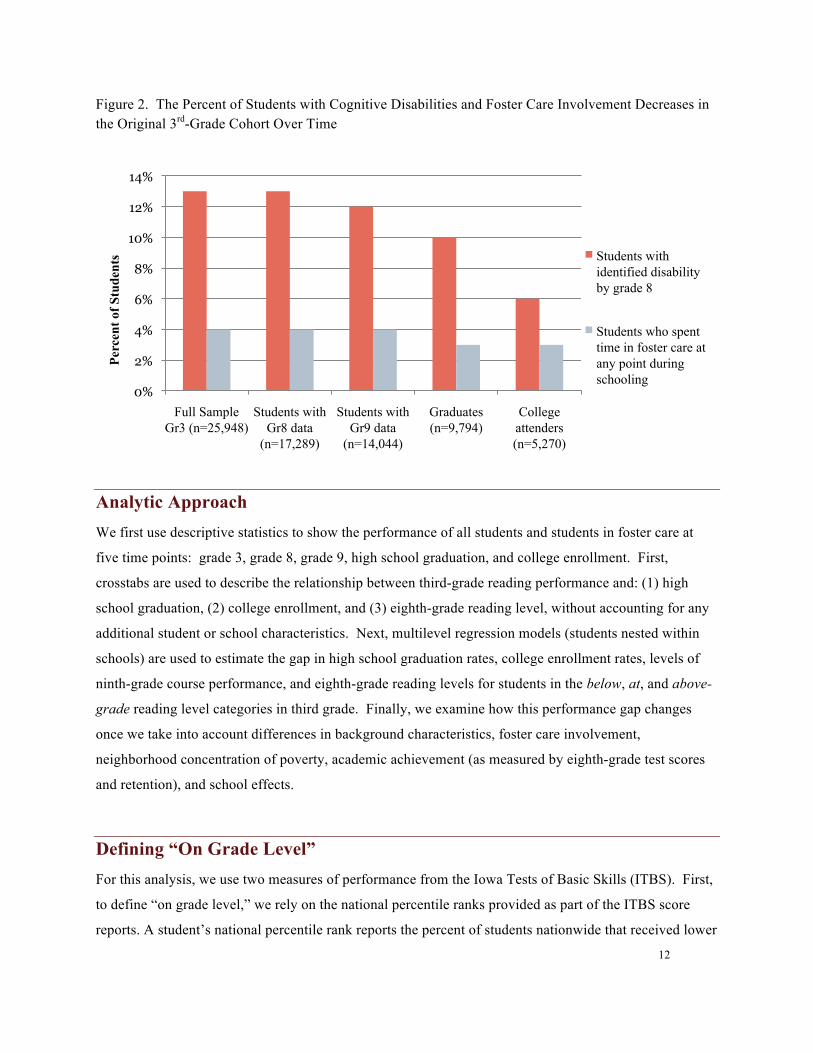
Figure 2 displays other changes in the sample over time. Fewer students with cognitive disabilities5 and
students who were ever in foster care are in the high school graduate sample as compared to the ninth-
grade sample, which is generally similar to the third-grade sample. Furthermore, even fewer students
with cognitive disabilities attend college.
5 Cognitive disabilities include the following special education categories: autism, emotional/behavioral disturbance, educable mentally handicapped, learning disability, severe/profound handicapped, speech/learning disability, traumatic brain injury, and trainable mentally handicapped.
0%
10%
20%
30%
40%
50%
60%
70%
80%
Full Sample Gr3 (n=25,948)
Students with Gr8 data
(n=17,289)
Students with Gr9 data
(n=14,044)
Graduates (n=9,794)
College attenders (n=5,270)
Perc
ent o
f Stu
dent
s
%Male
%Black
%Latino
%White
%Asian
12
Figure 2. The Percent of Students with Cognitive Disabilities and Foster Care Involvement Decreases in the Original 3rd-Grade Cohort Over Time
Analytic Approach We first use descriptive statistics to show the performance of all students and students in foster care at
five time points: grade 3, grade 8, grade 9, high school graduation, and college enrollment. First,
crosstabs are used to describe the relationship between third-grade reading performance and: (1) high
school graduation, (2) college enrollment, and (3) eighth-grade reading level, without accounting for any
additional student or school characteristics. Next, multilevel regression models (students nested within
schools) are used to estimate the gap in high school graduation rates, college enrollment rates, levels of
ninth-grade course performance, and eighth-grade reading levels for students in the below, at, and above-
grade reading level categories in third grade. Finally, we examine how this performance gap changes
once we take into account differences in background characteristics, foster care involvement,
neighborhood concentration of poverty, academic achievement (as measured by eighth-grade test scores
and retention), and school effects.
Defining “On Grade Level” For this analysis, we use two measures of performance from the Iowa Tests of Basic Skills (ITBS). First,
to define “on grade level,” we rely on the national percentile ranks provided as part of the ITBS score
reports. A student’s national percentile rank reports the percent of students nationwide that received lower
0%
2%
4%
6%
8%
10%
12%
14%
Full Sample Gr3 (n=25,948)
Students with Gr8 data
(n=17,289)
Students with Gr9 data
(n=14,044)
Graduates (n=9,794)
College attenders (n=5,270)
Perc
ent o
f Stu
dent
s Students with identified disability by grade 8
Students who spent time in foster care at any point during schooling
13
raw scores. It shows the student’s relative performance to a group of students who were in the same
grade and who were tested at the same time of year as the student. Table 3 shows that students whose
performance was lower than 75 percent of third graders nationwide (below the 25th percentile) were
defined as below grade level. Students who fell in the middle or average range of national performance
(25th-74th percentile) were defined as at grade level. Students scoring better than three-quarters of their
peers on the level 9 version of the ITBS test were defined as above grade level.
Table 3. Defining Third-Grade Performance Using National Percentile Rankings
National Percentile Ranking
Grade Level Definition
Percent of All Students in Grade 3 Focus
Cohort* (n=25,489)
Percent of Students in Foster Care in Grade 3
Focus Cohort* (n=1,103)
0-24 Below 38% 52% 25-74 At 50% 42%
75-100 Above 12% 6% *Percentages do not add to 100% because of rounding.
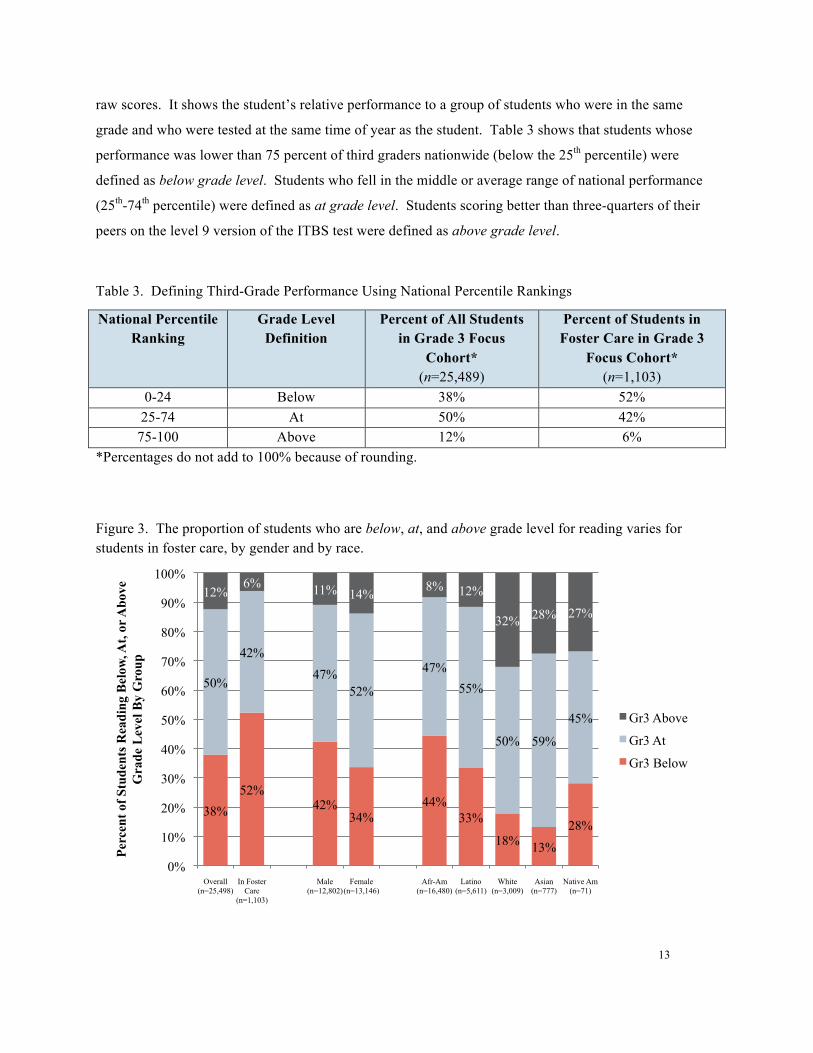
Figure 3. The proportion of students who are below, at, and above grade level for reading varies for students in foster care, by gender and by race.
38% 52%
42% 34%
44% 33%
18% 13% 28%
50%
42% 47%
52%
47% 55%
50% 59%
45%
12% 6% 11% 14% 8% 12%
32% 28% 27%
0%
10%
20%
30%
40%
50%
60%
70%
80%
90%
100%
Overall (n=25,498)
In Foster Care
(n=1,103)
Male (n=12,802)
Female (n=13,146)
Afr-Am (n=16,480)
Latino (n=5,611)
White (n=3,009)
Asian (n=777)
Native Am (n=71)
Perc
ent o
f Stu
dent
s Rea
ding
Bel
ow, A
t, or
Abo
ve
Gra
de L
evel
By
Gro
up
Gr3 Above
Gr3 At
Gr3 Below
14
Although the number of actively enrolled students and the availability of data at key milestones decreases
over time, and the proportion of students who are below, at, and above grade level is different by
subgroup (Figure 3), the proportion of students who are below, at, and above grade level who remain in
the sample is consistent. Students leave the district from the below, at, and above reading level groups in
fairly equal proportions. It is not until students leave as dropouts that the proportions of below, at, and
above level active students begins to change.
Comparing Reading Performance Over Time The second way that reading performance is measured in this work is by converting ITBS reading scores
into Rasch scores. Rasch scores provide a more precise estimation of student performance and are in a
scale that allows the measurement of academic growth over time. Rasch scores are independent of grade
level, and range from third grade to eighth grade. Table 4 displays average student performance in Rasch
scores. Rasch scores are in logits and difficult to interpret, but just by comparing the two means, it is
clear that students in eighth grade are performing at a much higher level than students in third grade.
Table 4. Measuring Reading Performance using Rasch Scores
Mean SD Min Max
Grade 3 Rasch Reading Score -1.314 0.982 -3.958 3.161
Grade 8 Rasch Reading Score 1.397 1.155 -5.564 5.904
Unfortunately, we are unable to align ITBS scores with NAEP (National Assessment of Educational
Progress) levels of proficiency in this work due to differences in test objectives, design, and scoring.
ITBS is a battery of norm-referenced multiple choice tests given to students grades 3-8. Scores are based
on the number of correct answers. NAEP tests contain both multiple choice and constructed response
items given to a national sample of students in grades four and eight. Proficiency is based on criteria on
which experts agree and define as an “overall achievement goal for American students,” not “at grade”
performance, according to the National Assessment Governing Board (NAGB), which oversees NAEP
policies. The tests overlap in content, but are not aligned.
15
Results
Relationships between Grade 3 Reading Level, High School Graduation, and
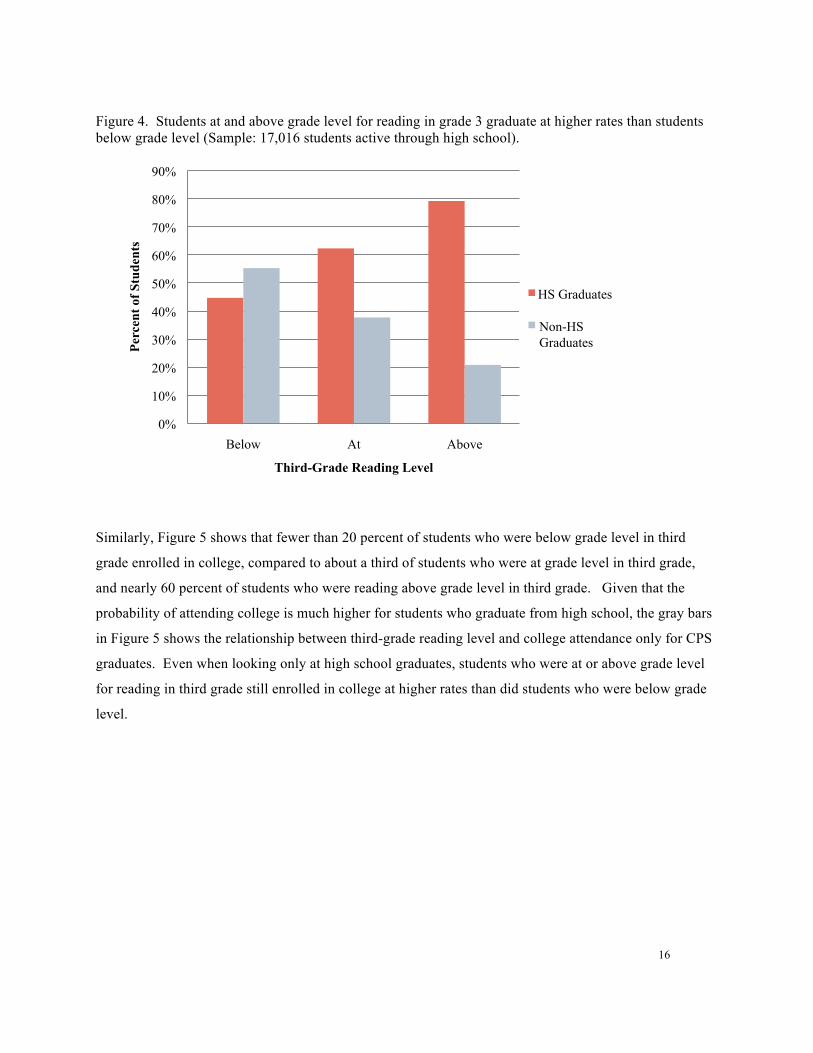
College Enrollment We began by looking descriptively at the experiences of third graders in our focus cohort to identify
patterns of high school graduation and college attendance. Each set of bars in Figure 4 represents one of
the three groups of students by third-grade reading level: students reading below grade level, at grade
level, or above grade level and their outcomes for high school graduation. The first two bars on the left
contain all of the students who were reading below grade level in third grade who were still in CPS as
high school students. Approximately 45 percent of third-grade below-grade level students graduated in 5
years, compared to more than 60 percent of students who read at grade level in third grade and nearly 80
percent of students who read above grade level in third grade (orange bars). Nearly 55 percent of third-
below-grade level students, 38 percent of at-grade-level students, and 20 percent of above-grade-level
students did not graduate (gray bars).
16
Figure 4. Students at and above grade level for reading in grade 3 graduate at higher rates than students below grade level (Sample: 17,016 students active through high school).
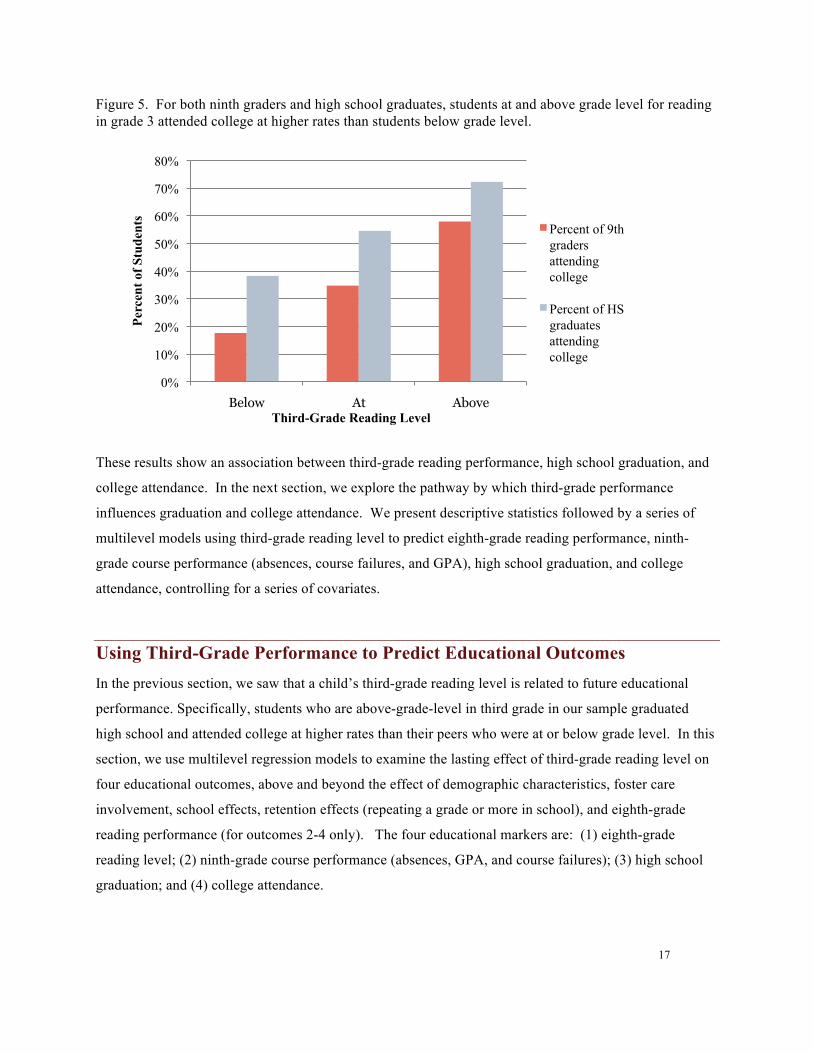
Similarly, Figure 5 shows that fewer than 20 percent of students who were below grade level in third
grade enrolled in college, compared to about a third of students who were at grade level in third grade,
and nearly 60 percent of students who were reading above grade level in third grade. Given that the
probability of attending college is much higher for students who graduate from high school, the gray bars
in Figure 5 shows the relationship between third-grade reading level and college attendance only for CPS
graduates. Even when looking only at high school graduates, students who were at or above grade level
for reading in third grade still enrolled in college at higher rates than did students who were below grade
level.
0%
10%
20%
30%
40%
50%
60%
70%
80%
90%
Below At Above
Perc
ent o
f Stu
dent
s
Third-Grade Reading Level
HS Graduates
Non-HS Graduates
17
Figure 5. For both ninth graders and high school graduates, students at and above grade level for reading in grade 3 attended college at higher rates than students below grade level.
These results show an association between third-grade reading performance, high school graduation, and
college attendance. In the next section, we explore the pathway by which third-grade performance
influences graduation and college attendance. We present descriptive statistics followed by a series of
multilevel models using third-grade reading level to predict eighth-grade reading performance, ninth-
grade course performance (absences, course failures, and GPA), high school graduation, and college
attendance, controlling for a series of covariates.
Using Third-Grade Performance to Predict Educational Outcomes In the previous section, we saw that a child’s third-grade reading level is related to future educational
performance. Specifically, students who are above-grade-level in third grade in our sample graduated
high school and attended college at higher rates than their peers who were at or below grade level. In this
section, we use multilevel regression models to examine the lasting effect of third-grade reading level on
four educational outcomes, above and beyond the effect of demographic characteristics, foster care
involvement, school effects, retention effects (repeating a grade or more in school), and eighth-grade
reading performance (for outcomes 2-4 only). The four educational markers are: (1) eighth-grade
reading level; (2) ninth-grade course performance (absences, GPA, and course failures); (3) high school
graduation; and (4) college attendance.
0%
10%
20%
30%
40%
50%
60%
70%
80%
Below At Above
Perc
ent o
f Stu
dent
s
Third-Grade Reading Level
Percent of 9th graders attending college
Percent of HS graduates attending college
18
Third-Grade Reading Level Is a Significant Predictor of Eighth-Grade Reading
Performance Although third-grade reading level does not determine eighth-grade performance, students in our sample
who were at or above grade level in third grade were more likely to be at or above grade level in eighth
grade. Of the students who were below grade level in third grade, about 40 percent were also below
grade level in eighth grade. Correlational analyses between third- and eighth-grade reading scores reveal
similar findings. Third- and eighth-grade Rasch reading scores for students in this sample are correlated
at r=0.67. In other words, students with higher third-grade scores also have higher eighth-grade scores,
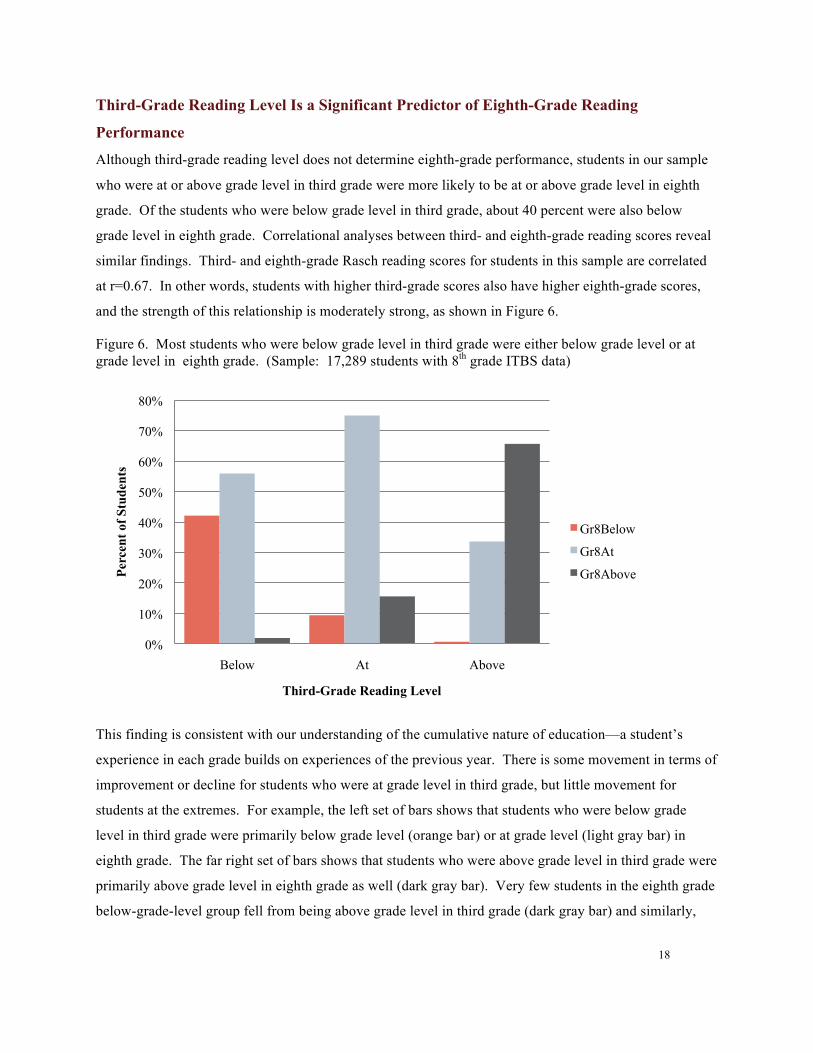
and the strength of this relationship is moderately strong, as shown in Figure 6.
Figure 6. Most students who were below grade level in third grade were either below grade level or at grade level in eighth grade. (Sample: 17,289 students with 8th grade ITBS data)
This finding is consistent with our understanding of the cumulative nature of education—a student’s
experience in each grade builds on experiences of the previous year. There is some movement in terms of
improvement or decline for students who were at grade level in third grade, but little movement for
students at the extremes. For example, the left set of bars shows that students who were below grade
level in third grade were primarily below grade level (orange bar) or at grade level (light gray bar) in
eighth grade. The far right set of bars shows that students who were above grade level in third grade were
primarily above grade level in eighth grade as well (dark gray bar). Very few students in the eighth grade
below-grade-level group fell from being above grade level in third grade (dark gray bar) and similarly,
0%
10%
20%
30%
40%
50%
60%
70%
80%
Below At Above
Perc
ent o
f Stu
dent
s
Third-Grade Reading Level
Gr8Below
Gr8At
Gr8Above
19
very few students who were below grade level in third grade were above grade level in eighth grade
(orange bar).
The next set of analyses utilized multilevel regression models with students clustered within schools.
Using this approach, we found that third grade reading level is a significant predictor of eighth grade
reading level even after controlling for demographic characteristics (sex, race, cognitive disability status,
and foster care involvement) and the clustering of students in the school they attended in third grade.
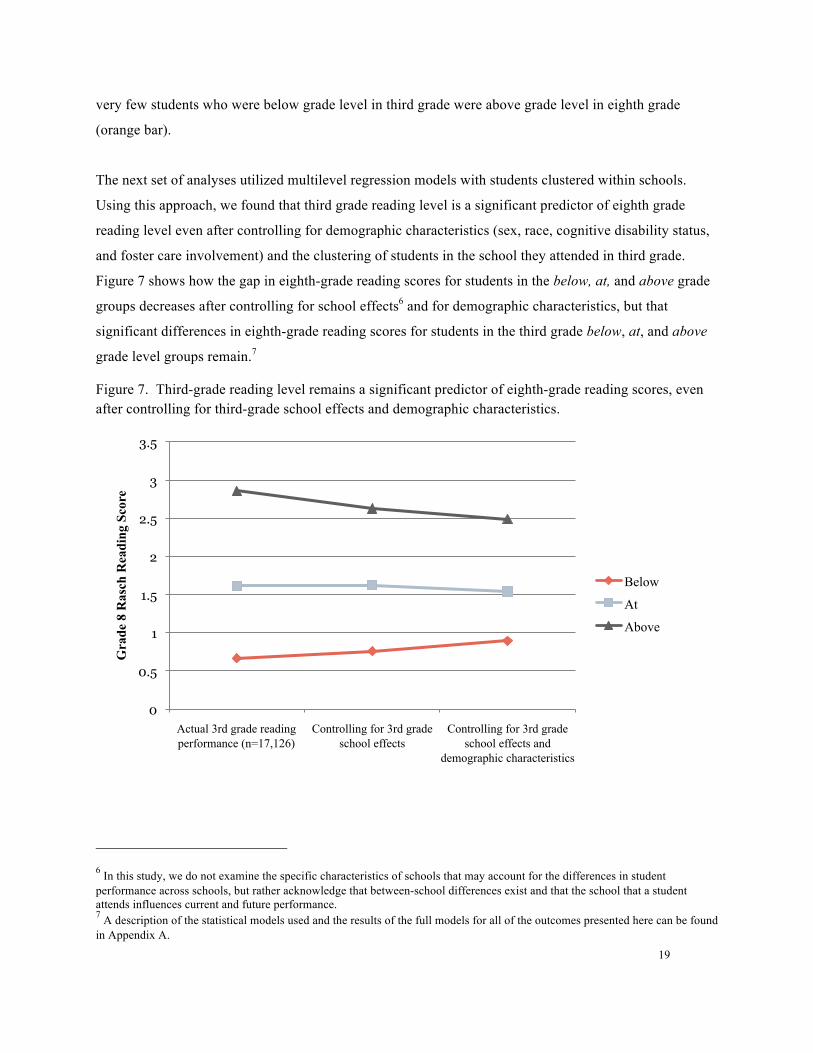
Figure 7 shows how the gap in eighth-grade reading scores for students in the below, at, and above grade
groups decreases after controlling for school effects6 and for demographic characteristics, but that
significant differences in eighth-grade reading scores for students in the third grade below, at, and above
grade level groups remain.7
Figure 7. Third-grade reading level remains a significant predictor of eighth-grade reading scores, even after controlling for third-grade school effects and demographic characteristics.
6 In this study, we do not examine the specific characteristics of schools that may account for the differences in student performance across schools, but rather acknowledge that between-school differences exist and that the school that a student attends influences current and future performance. 7 A description of the statistical models used and the results of the full models for all of the outcomes presented here can be found in Appendix A.
0
0.5
1
1.5
2
2.5
3
3.5
Actual 3rd grade reading performance (n=17,126)
Controlling for 3rd grade school effects
Controlling for 3rd grade school effects and
demographic characteristics
Gra
de 8
Ras
ch R
eadi
ng S
core
Below
At
Above

20
Eighth-Grade Reading Achievement and Ninth-Grade School Effects Account
for Many of the Differences in Ninth-Grade Student Performance.
Eighth-grade achievement is an important educational milestone for students. For students in this sample,
eighth-grade test scores play a large role in determining which high school a student attends. Students
who meet certain academic and attendance requirements are eligible to attend schools across the city,
regardless of where they live. As a result, high-performing students (regardless of their elementary
school location) tend to attend high-performing high schools. Similarly, low-performing students tend to
enroll in lower-performing high schools. As a result of this high school sorting process, eighth-grade
performance is extremely important.
In the next set of analyses, we show that third-grade reading performance is related to ninth-grade course
performance, but differences in ninth-grade performance of students who were in the below-, at-, and
above-grade reading levels in third grade can be explained by a student’s eighth-grade reading test score
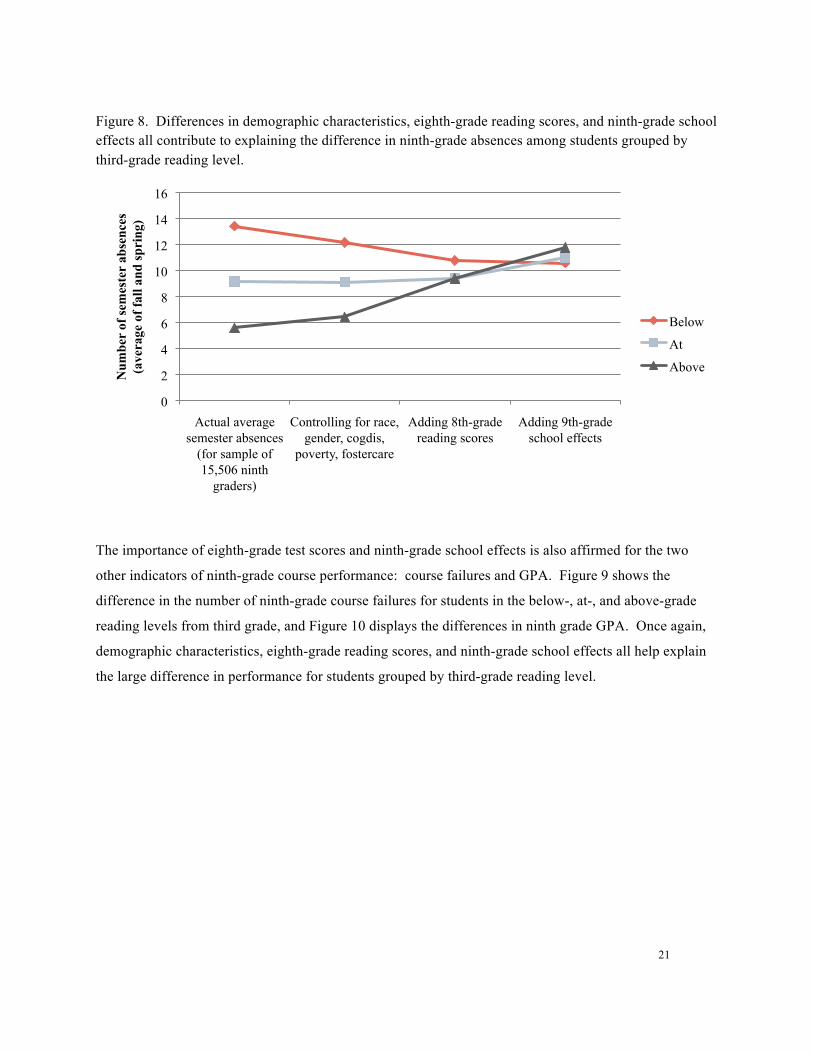
and the ninth-grade school they attend. Figure 8 shows the differences in ninth-grade absences for
students according to their third-grade reading level. Students who were reading below grade level in
third grade (first orange diamond) missed an average of 15 days of school (or 3 weeks) per semester in
ninth grade. Students who were on grade level in third grade (first light gray square) missed an average
of 9 days per semester (about 2 weeks), and students who were above grade level in third grade (first dark
gray triangle) missed an average of 1 week per semester. After we adjust these absence rates for
demographic characteristics, the gap between the groups decreases slightly (second set of points).
However, once we account for eighth-grade test performance, the gap in the number of absences between
groups nearly disappears (third set of points), and once we account for ninth-grade school effects (the far
right set of points), the difference between third-grade groups is completely explained.
21
Figure 8. Differences in demographic characteristics, eighth-grade reading scores, and ninth-grade school effects all contribute to explaining the difference in ninth-grade absences among students grouped by third-grade reading level.
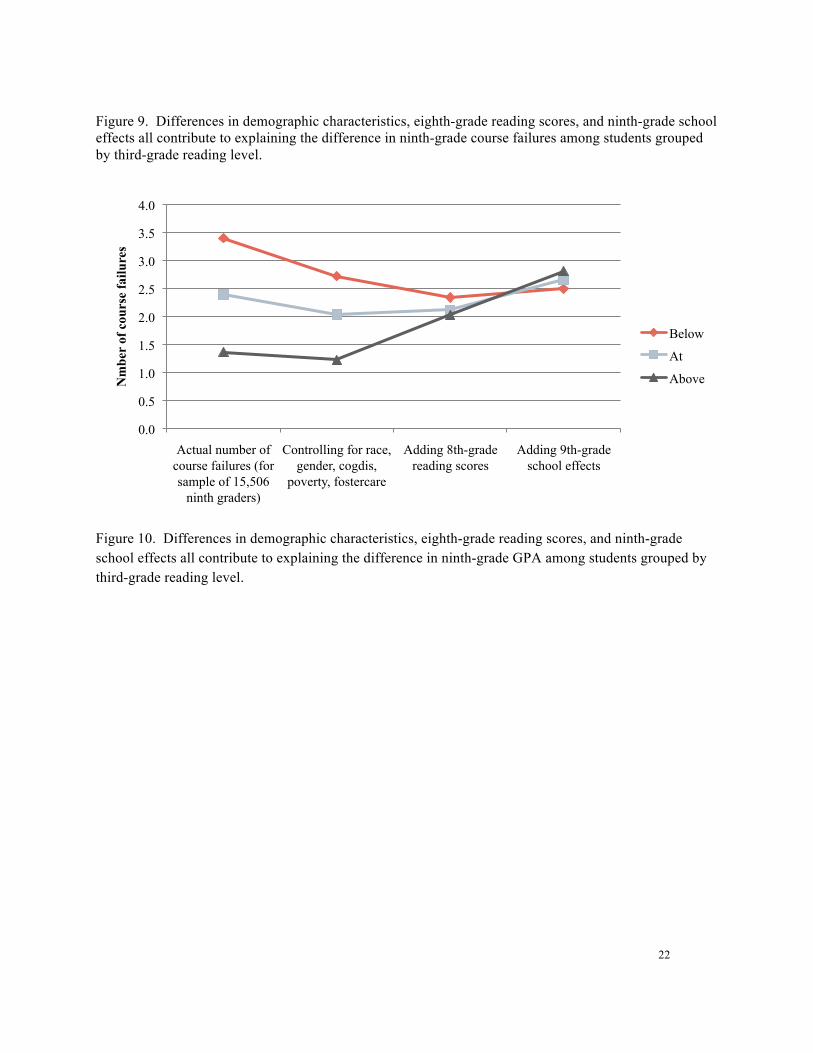
The importance of eighth-grade test scores and ninth-grade school effects is also affirmed for the two
other indicators of ninth-grade course performance: course failures and GPA. Figure 9 shows the
difference in the number of ninth-grade course failures for students in the below-, at-, and above-grade
reading levels from third grade, and Figure 10 displays the differences in ninth grade GPA. Once again,
demographic characteristics, eighth-grade reading scores, and ninth-grade school effects all help explain
the large difference in performance for students grouped by third-grade reading level.
0
2
4
6
8
10
12
14
16
Actual average semester absences
(for sample of 15,506 ninth
graders)
Controlling for race, gender, cogdis,
poverty, fostercare
Adding 8th-grade reading scores
Adding 9th-grade school effects
Num
ber
of se
mes
ter
abse
nces
(a
vera
ge o
f fal
l and
spri
ng)
Below
At
Above
22
Figure 9. Differences in demographic characteristics, eighth-grade reading scores, and ninth-grade school effects all contribute to explaining the difference in ninth-grade course failures among students grouped by third-grade reading level.
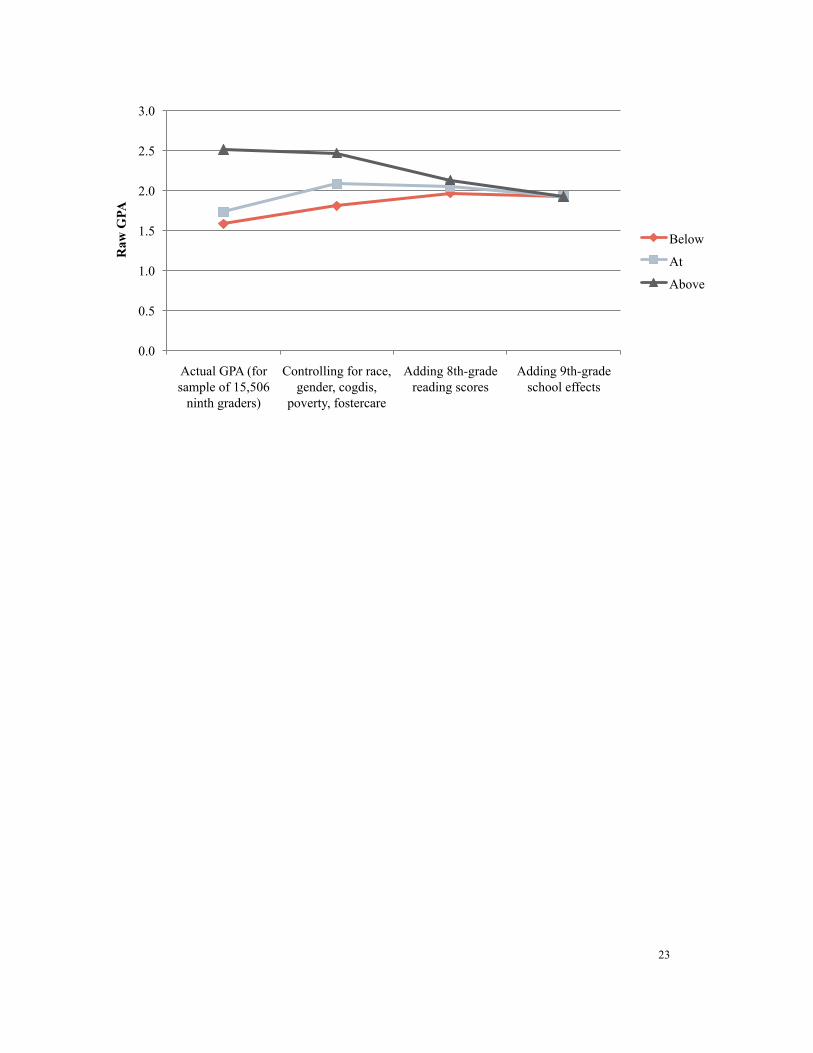
Figure 10. Differences in demographic characteristics, eighth-grade reading scores, and ninth-grade school effects all contribute to explaining the difference in ninth-grade GPA among students grouped by third-grade reading level.
0.0
0.5
1.0
1.5
2.0
2.5
3.0
3.5
4.0
Actual number of course failures (for sample of 15,506
ninth graders)
Controlling for race, gender, cogdis,
poverty, fostercare
Adding 8th-grade reading scores
Adding 9th-grade school effects
Nm
ber
of c
ours
e fa
ilure
s
Below
At
Above
23
0.0
0.5
1.0
1.5
2.0
2.5
3.0
Actual GPA (for sample of 15,506
ninth graders)
Controlling for race, gender, cogdis,
poverty, fostercare
Adding 8th-grade reading scores
Adding 9th-grade school effects
Raw
GPA
Below
At
Above
24
Eighth-Grade Reading Achievement and Ninth-Grade School Effects Explain
Differences in Graduation and College Enrollment Rates
Thus far, we have followed the path of student educational experiences through high school completion
and postsecondary education to show that third-grade reading level influences eighth-grade reading
performance, and that eighth-grade reading performance influences ninth-grade course performance. In
this section, we show that ninth-grade course performance influences high school graduation rates and
college enrollment.
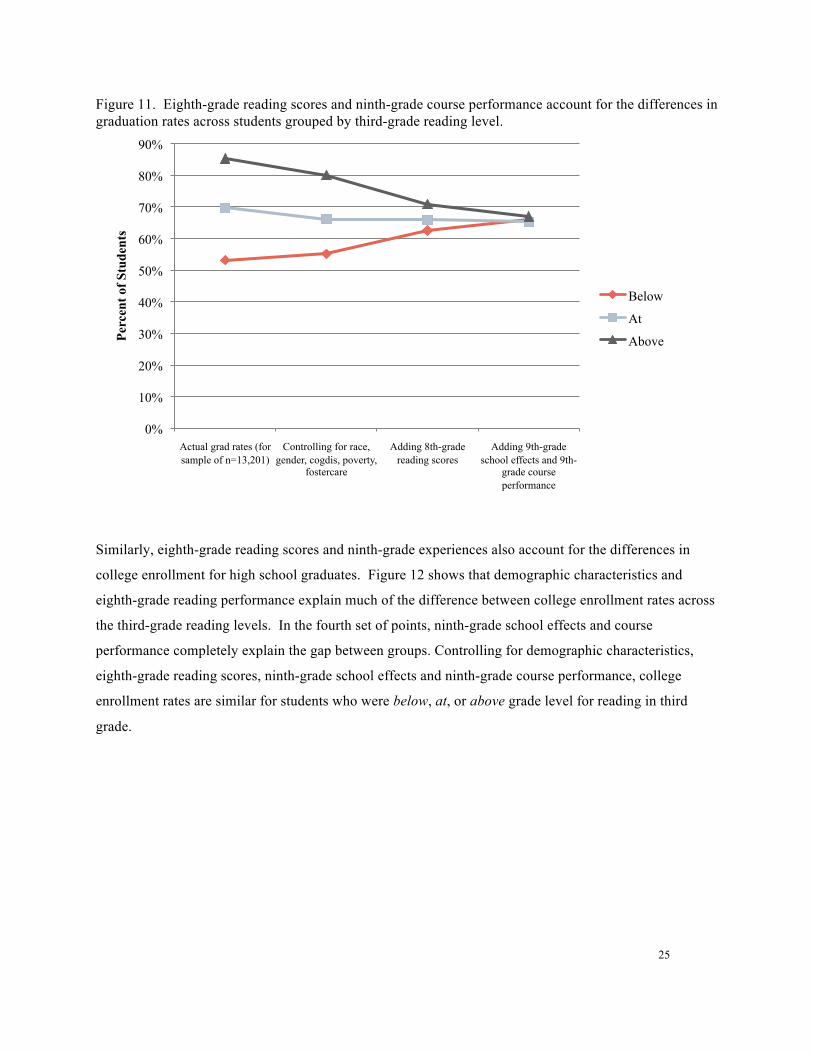
Figure 11 shows the results of four models that examine how graduation rates are adjusted after
controlling for a series of covariates. The first points indicate the graduation rates for students by third-
grade reading level. Consistent with the descriptive results presented above, students in the below, at, and
above grade level reading groups in third grade have significantly different graduation rates. Even after
controlling for demographic characteristics (second set of points) and eighth-grade reading scores (third
set of points), the difference in graduation rates remains. Only the addition of ninth-grade school effects
and ninth-grade course performance completely explains the difference in graduation rates of students in
these groups.
25
Figure 11. Eighth-grade reading scores and ninth-grade course performance account for the differences in graduation rates across students grouped by third-grade reading level.
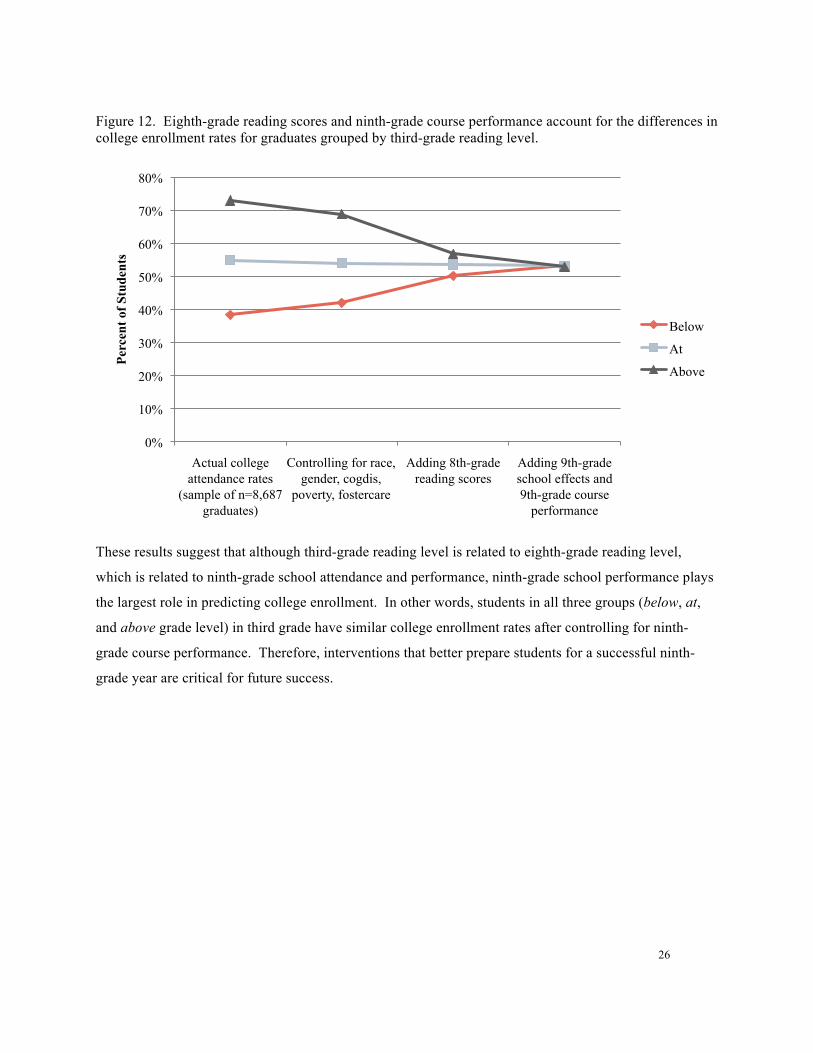
Similarly, eighth-grade reading scores and ninth-grade experiences also account for the differences in
college enrollment for high school graduates. Figure 12 shows that demographic characteristics and
eighth-grade reading performance explain much of the difference between college enrollment rates across
the third-grade reading levels. In the fourth set of points, ninth-grade school effects and course
performance completely explain the gap between groups. Controlling for demographic characteristics,
eighth-grade reading scores, ninth-grade school effects and ninth-grade course performance, college
enrollment rates are similar for students who were below, at, or above grade level for reading in third
grade.
0%
10%
20%
30%
40%
50%
60%
70%
80%
90%
Actual grad rates (for sample of n=13,201)
Controlling for race, gender, cogdis, poverty,
fostercare
Adding 8th-grade reading scores
Adding 9th-grade school effects and 9th-
grade course performance
Perc
ent o
f Stu
dent
s
Below
At
Above
26
Figure 12. Eighth-grade reading scores and ninth-grade course performance account for the differences in college enrollment rates for graduates grouped by third-grade reading level.
These results suggest that although third-grade reading level is related to eighth-grade reading level,
which is related to ninth-grade school attendance and performance, ninth-grade school performance plays
the largest role in predicting college enrollment. In other words, students in all three groups (below, at,
and above grade level) in third grade have similar college enrollment rates after controlling for ninth-
grade course performance. Therefore, interventions that better prepare students for a successful ninth-
grade year are critical for future success.
0%
10%
20%
30%
40%
50%
60%
70%
80%
Actual college attendance rates
(sample of n=8,687 graduates)
Controlling for race, gender, cogdis,
poverty, fostercare
Adding 8th-grade reading scores
Adding 9th-grade school effects and 9th-grade course
performance
Perc
ent o
f Stu
dent
s
Below
At
Above
27
Summary
Findings from this study are consistent with existing literature that emphasizes the importance of early
reading ability for future educational success. Third-grade reading level was shown to be significant
predictor of eighth-grade reading level and ninth-grade course performance even after accounting for
demographic characteristics and how a child’s school influences their individual performance. Third-
grade reading level was also shown to be a predictor of graduation and college attendance, even when
demographic characteristics were included as controls. However, the effect of third-grade reading level
operates through eighth- and ninth-grade performance. When ninth-grade performance was included as a
predictor, being below- or at-grade-level was no longer a significant predictor of high school graduation
or college attendance. In terms of third grade reading level, only the above-grade-level group enrolled in
college at significantly higher rates than below-grade-level students. Merely being at-grade level in third
grade did not account for any additional variance in predicting college attendance beyond ninth- grade
course performance. Furthermore, whether or not a student was ever in foster care had a small but
significantly negative impact on eighth grade reading level, ninth grade course performance, and high
school graduation. Even after considering background characteristics, poverty level, prior achievement
and school effects, students who ever spent time in foster care—regardless of timing of entry, duration in
care, or any other specification of that experience—have lower educational outcomes than their peers.
Although the findings presented here suggest a relationship between early performance and later
outcomes, the results of this study are correlational, and therefore cannot determine whether low reading
performance in third grade causes low future educational performance. Rather, it is more likely that other
individual, family, and community factors contribute to both low reading performance and future
educational outcomes for students, as suggested by the significant effect of foster care status on predicting
student outcomes.

28
Future research should investigate the extent to which getting students to at- or above-grade reading
levels in third grade is able to change the trajectory of student performance. Given the importance of
ninth-grade performance in predicting graduation and college enrollment, children who are below grade
level in third grade but catch up by ninth grade have a good prognosis for their future educational
outcomes. Studying which interventions best help students prepare for a successful ninth grade year is
therefore extremely important.
29
References
Armbruster, B. B., Lehr, F., & Osborn, J. (2001). Put reading first: The research building blocks for
teaching children to read. Kindergarten through grade 3.
Bandeira de Mello, V., Blankenship, C. and McLaughlin, D.H. (2009). Mapping state proficiency
standards onto NAEP scales: 2005-2007 (NCES 2010-456). Washington, DC: National Center for
Education Statistics, Institute of Education Sciences, U.S. Department of Education.
Courtney, M. E., Roderick, M., Smithgall, C., Gladden, R. M. & Nagaoka, J. (2004, December). Issue
brief: The educational status of foster children. Chicago, IL: Chapin HallCenter for Children at the
University of Chicago.
Easton, J., Correa, M., Luppescu, S., Park, H., Ponisciak, S., Rosenkranz, T. & Sporte, S. (2003,
February). How do they compare? ITBS and ISAT reading and mathematics in the Chicago Public
Schools, 1999-2002. Chicago: Consortium on Chicago School Research.
Felton, R. H. & Wood, F. B. (1992). A reading level match study of nonword reading skills in poor
readers with varying IQ. Journal of Learning Disabilities, 25(5), 318-326.
Francis, D. J. (1996). Developmental lag versus deficit models of reading disability: A longitudinal,
individual growth curves analysis. Journal of Educational Psychology, 88 (1), 3-17.
Harlow, C. (2003). Education and correctional populations. Bureau of Justice Statistics Special Report.
Washington, DC: U.S. Department of Justice.
Kutner, M., Greenberg, E., Jin, Y., Boyle, B., Hsu, Y., and Dunleavy, E. (2007). Literacy in Everyday
Life: Results From the 2003 National Assessment of Adult Literacy (NCES 2007-480). National
Center for Education Statistics, Institute of Education Sciences, U.S. Department of Education.
Washington, DC.
30
Lesnick, J. (2006). A mixed-method multi-level randomized evaluation of the implemetnationa dn impact
of an audio-assisted reading program for struggling readers. (Unpublished doctoral dissertation).
Philadelphia: University of Pennsylvania
Shaywitz, S. E., Escobar, M. D., Shaywitz, B. A., Fletcher, J. M., & Makuch, R. (1992). Distribution and
temporal stability of dyslexia in an epidemiological sample of 414 children followed longitudinally.
New England Journal of Medicine, 326, 145-150.
Smithgall, C., Gladden, R. M., Howard, E., Goerge, R., & Courtney, M. (2004) Educational experiences
of children in out-of-home care. Chicago: Chapin Hall Center for Children at the University of
Chicago.
Snow, C., Burns, S., & Griffin, P. (Eds.) (1998). Preventing reading difficulties in young children.
Washington, DC: National Academies Press.

31
Appendix A: Statistical Models and Results
We use a series of non-nested and nested models to estimate the gap among students in the below-, at-,
and above-grade-level groups for a total of six outcomes: 1) eighth-grade reading performance, 2) ninth-
grade absences, 3) ninth-grade course failures, 4) ninth-grade GPA (Grade Point Average), 5) high school
graduation, and 6) college enrollment.
First, for the outcome of eighth-grade reading performance (Figure 7), a non-nested regression model was
used to estimate the initial gap among third-grade reading level groups for predicting eighth-grade reading
level. Two two-level hierarchical linear models (HLM), where students are nested within third-grade
schools, were then used to estimate the gap among third-grade reading level groups after accounting for
third-grade school effects and demographic characteristics (race, gender, poverty, cognitive disability, and
foster care). Next, for the second, third, and fourth outcomes of ninth-grade absences, course failures, and
GPA (Figures 8 -10), non-nested regression models were used to estimate the initial gap among third-
grade reading level groups; the gap that remains once we take into account background characteristics;
and the remaining gap after taking into account eighth-grade test scores. A two-level HLM, where
students are nested in high schools, was then used to take into account ninth-grade school effects.
For the fifth outcome of high school graduation (Figure 11), logistic regression models were used in the
same way described above for outcomes 2-4, with the addition of ninth-grade course performance
variables included in the final HLM. Finally, for the sixth outcome of college enrollment (Figure 12), the
same models were used as for high school graduation, but only high school graduates were included in the
sample.

32
The HLM models included the same variables used in the non-nested models—including dummy
variables identifying gender, race, cognitive disability classification during high school, and whether the
student was ever in foster care. Other variables included neighborhood poverty and (for models 4 and 5)
variables describing ninth-grade absences, course failures, and GPA. In addition, eighth-grade ITBS
scores in reading (in Rasch units) are included to estimate the gap after taking into account prior
achievement. For the models predicting outcomes 5-6, a Bernoulli HLM model was used to estimate the
results due to the binary values of the outcome variables. All of the variables in the HLM models were
grand mean centered. Only the intercept was allowed to vary randomly at Level 2. Tables 5-7 display the
coefficients from the full models predicting each of the six outcomes.
33
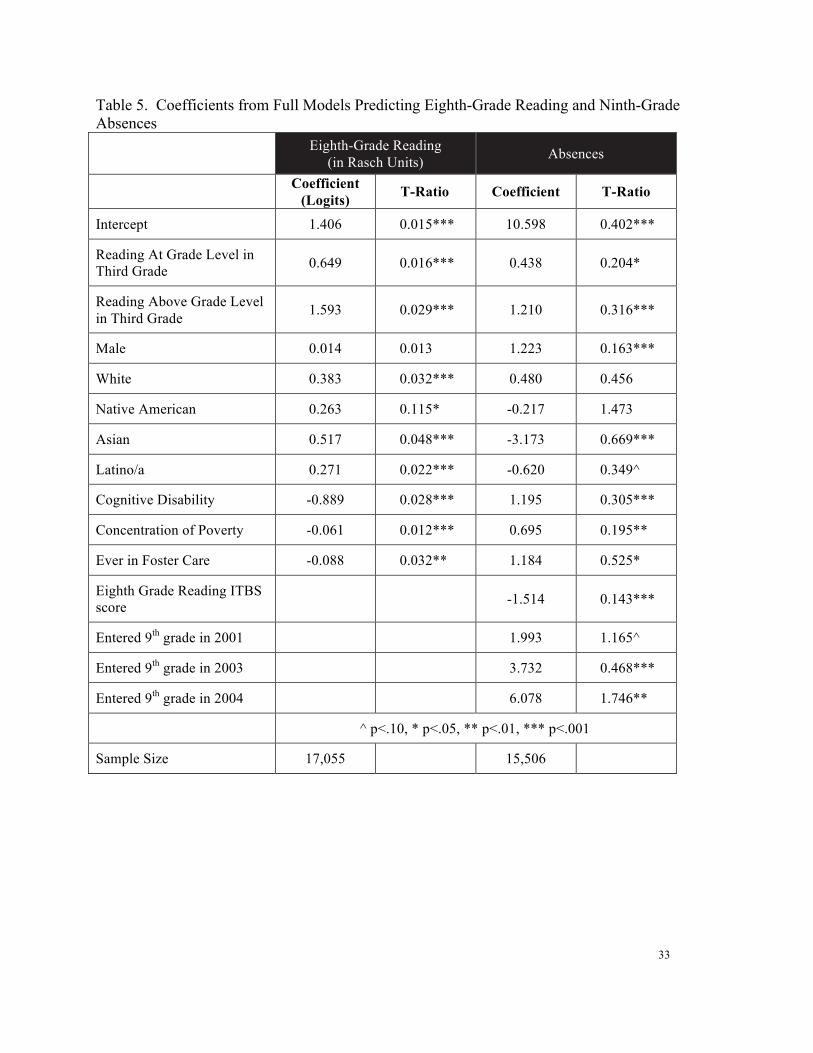
Table 5. Coefficients from Full Models Predicting Eighth-Grade Reading and Ninth-Grade Absences
Eighth-Grade Reading (in Rasch Units) Absences
Coefficient (Logits) T-Ratio Coefficient T-Ratio
Intercept 1.406 0.015*** 10.598 0.402***
Reading At Grade Level in Third Grade 0.649 0.016*** 0.438 0.204*
Reading Above Grade Level in Third Grade 1.593 0.029*** 1.210 0.316***
Male 0.014 0.013 1.223 0.163***
White 0.383 0.032*** 0.480 0.456
Native American 0.263 0.115* -0.217 1.473
Asian 0.517 0.048*** -3.173 0.669***
Latino/a 0.271 0.022*** -0.620 0.349^
Cognitive Disability -0.889 0.028*** 1.195 0.305***
Concentration of Poverty -0.061 0.012*** 0.695 0.195**
Ever in Foster Care -0.088 0.032** 1.184 0.525*
Eighth Grade Reading ITBS score -1.514 0.143***
Entered 9th grade in 2001 1.993 1.165^
Entered 9th grade in 2003 3.732 0.468***
Entered 9th grade in 2004 6.078 1.746**
^ p<.10, * p<.05, ** p<.01, *** p<.001
Sample Size 17,055 15,506
34
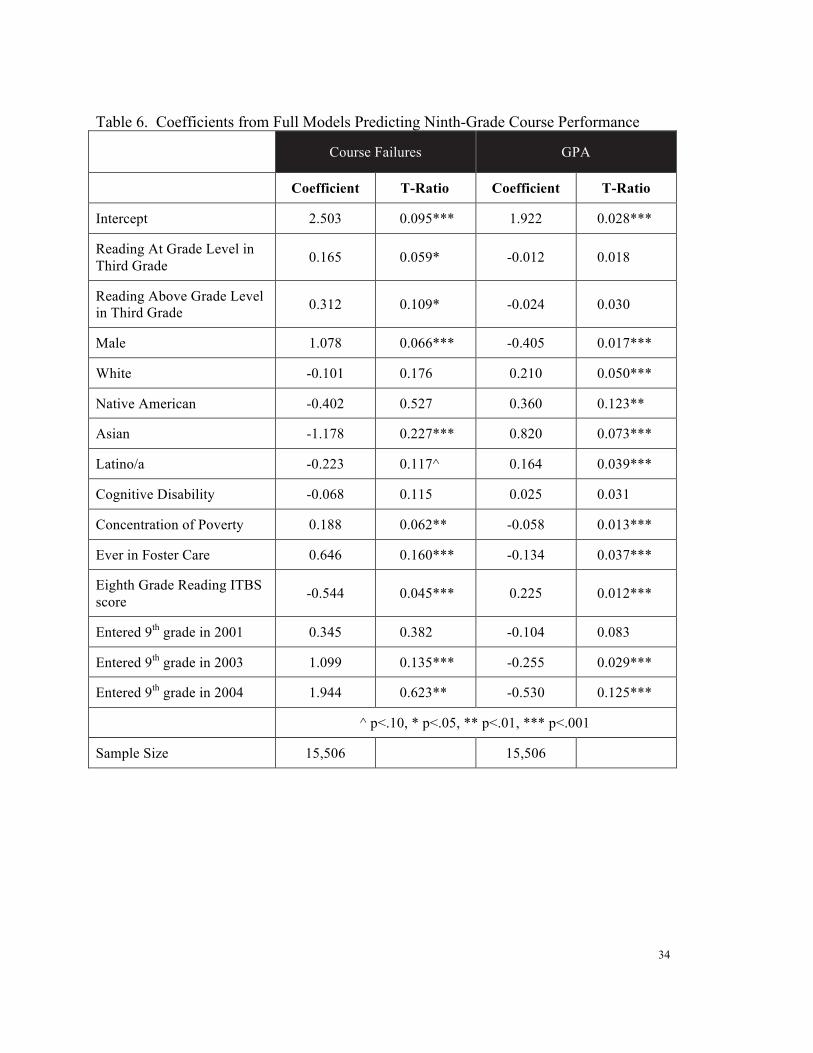
Table 6. Coefficients from Full Models Predicting Ninth-Grade Course Performance
Course Failures GPA
Coefficient T-Ratio Coefficient T-Ratio
Intercept 2.503 0.095*** 1.922 0.028***
Reading At Grade Level in Third Grade 0.165 0.059* -0.012 0.018
Reading Above Grade Level in Third Grade 0.312 0.109* -0.024 0.030
Male 1.078 0.066*** -0.405 0.017***
White -0.101 0.176 0.210 0.050***
Native American -0.402 0.527 0.360 0.123**
Asian -1.178 0.227*** 0.820 0.073***
Latino/a -0.223 0.117^ 0.164 0.039***
Cognitive Disability -0.068 0.115 0.025 0.031
Concentration of Poverty 0.188 0.062** -0.058 0.013***
Ever in Foster Care 0.646 0.160*** -0.134 0.037***
Eighth Grade Reading ITBS score -0.544 0.045*** 0.225 0.012***
Entered 9th grade in 2001 0.345 0.382 -0.104 0.083
Entered 9th grade in 2003 1.099 0.135*** -0.255 0.029***
Entered 9th grade in 2004 1.944 0.623** -0.530 0.125***
^ p<.10, * p<.05, ** p<.01, *** p<.001
Sample Size 15,506 15,506
35
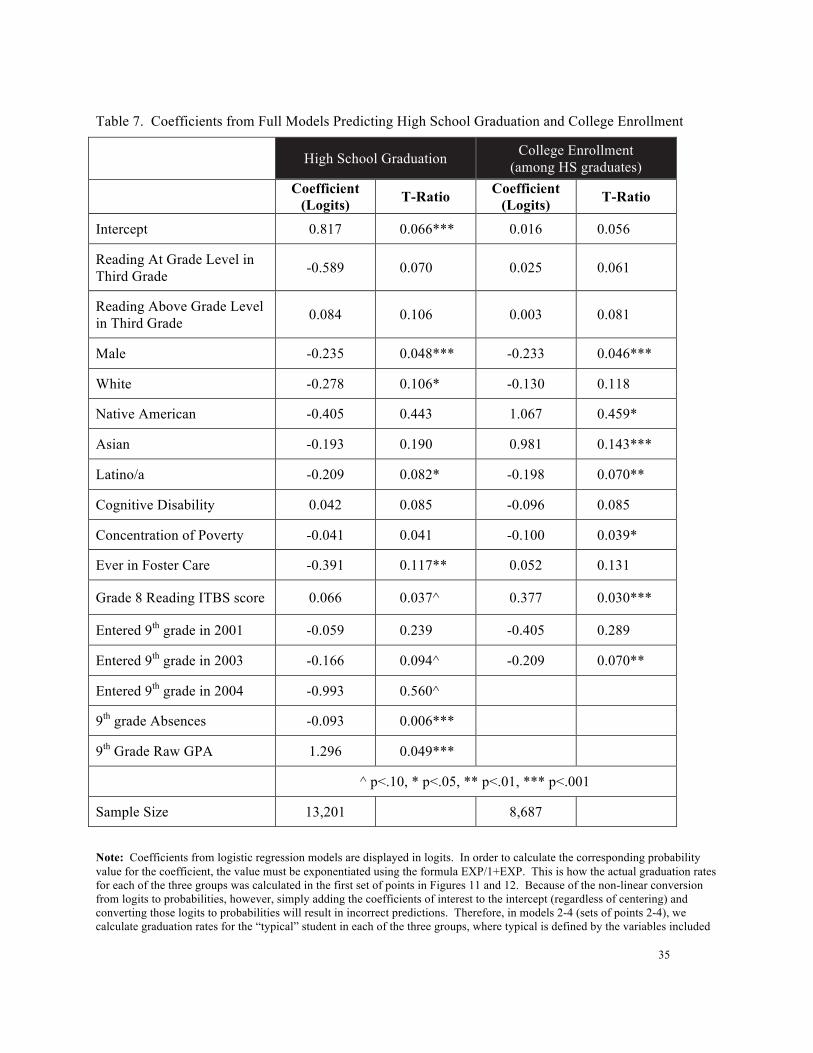
Table 7. Coefficients from Full Models Predicting High School Graduation and College Enrollment
High School Graduation College Enrollment (among HS graduates)
Coefficient (Logits) T-Ratio Coefficient
(Logits) T-Ratio
Intercept 0.817 0.066*** 0.016 0.056
Reading At Grade Level in Third Grade -0.589 0.070 0.025 0.061
Reading Above Grade Level in Third Grade 0.084 0.106 0.003 0.081
Male -0.235 0.048*** -0.233 0.046***
White -0.278 0.106* -0.130 0.118
Native American -0.405 0.443 1.067 0.459*
Asian -0.193 0.190 0.981 0.143***
Latino/a -0.209 0.082* -0.198 0.070**
Cognitive Disability 0.042 0.085 -0.096 0.085
Concentration of Poverty -0.041 0.041 -0.100 0.039*
Ever in Foster Care -0.391 0.117** 0.052 0.131
Grade 8 Reading ITBS score 0.066 0.037^ 0.377 0.030***
Entered 9th grade in 2001 -0.059 0.239 -0.405 0.289
Entered 9th grade in 2003 -0.166 0.094^ -0.209 0.070**
Entered 9th grade in 2004 -0.993 0.560^
9th grade Absences -0.093 0.006***
9th Grade Raw GPA 1.296 0.049***
^ p<.10, * p<.05, ** p<.01, *** p<.001
Sample Size 13,201 8,687
Note: Coefficients from logistic regression models are displayed in logits. In order to calculate the corresponding probability value for the coefficient, the value must be exponentiated using the formula EXP/1+EXP. This is how the actual graduation rates for each of the three groups was calculated in the first set of points in Figures 11 and 12. Because of the non-linear conversion from logits to probabilities, however, simply adding the coefficients of interest to the intercept (regardless of centering) and converting those logits to probabilities will result in incorrect predictions. Therefore, in models 2-4 (sets of points 2-4), we calculate graduation rates for the “typical” student in each of the three groups, where typical is defined by the variables included

36
in the model. To do so, we used the Level 1 residual file from each model to created an adjustment for each group’s fitted value that takes into account the proportion that each group (below, at, above) represents of the full sample.


About Chapin Hall
Established in 1985, Chapin Hall is an independent policy research center whose mission is to build knowledge that improves policies and programs for children and youth, families, and their communities.
Chapin Hall’s areas of research include child maltreatment prevention, child welfare systems and foster care, youth justice, schools and their connections with social services and community organizations, early childhood initiatives, community change initiatives, workforce development, out-of-school time initiatives, economic supports for families, and child well-being indicators.

1313 East 60th Street Chicago, IL 60637
T: 773.256.5100 F: 773.753.5940
www.chapinhall.org