reading gps time series plots shelley olds unavco adapted from roger groom, unavco master...
TRANSCRIPT

Reading GPS Time Series Plots
Shelley Olds
UNAVCO
adapted from Roger Groom, UNAVCO Master Teaching-in-Residence
04/18/23 2
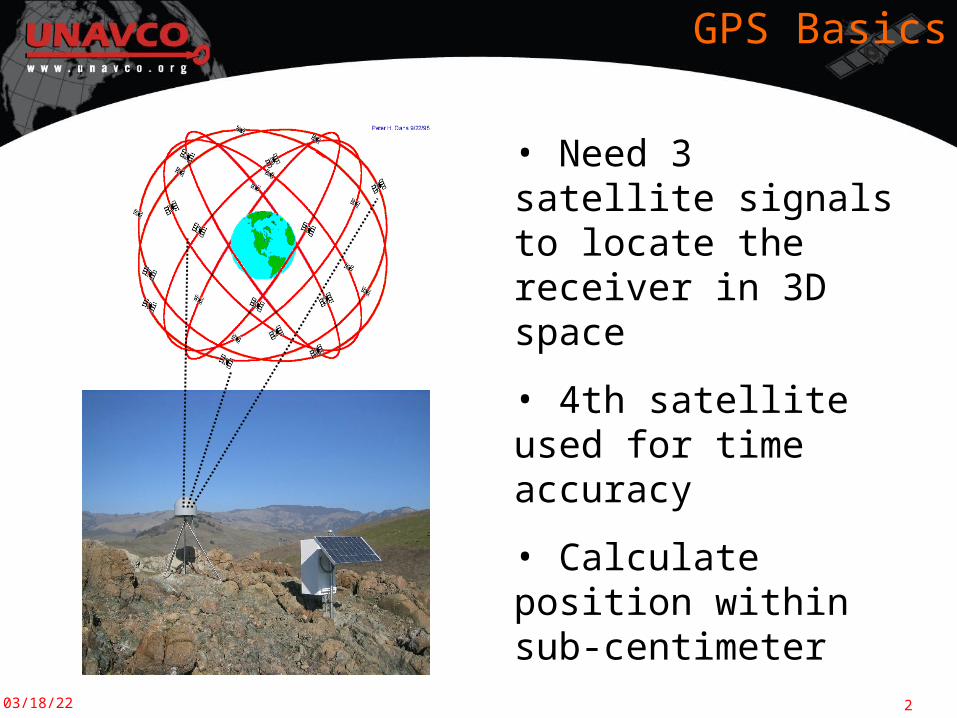
GPS Basics
• Need 3 satellite signals to locate the receiver in 3D space
• 4th satellite used for time accuracy
• Calculate position within sub-centimeter
04/18/23 3
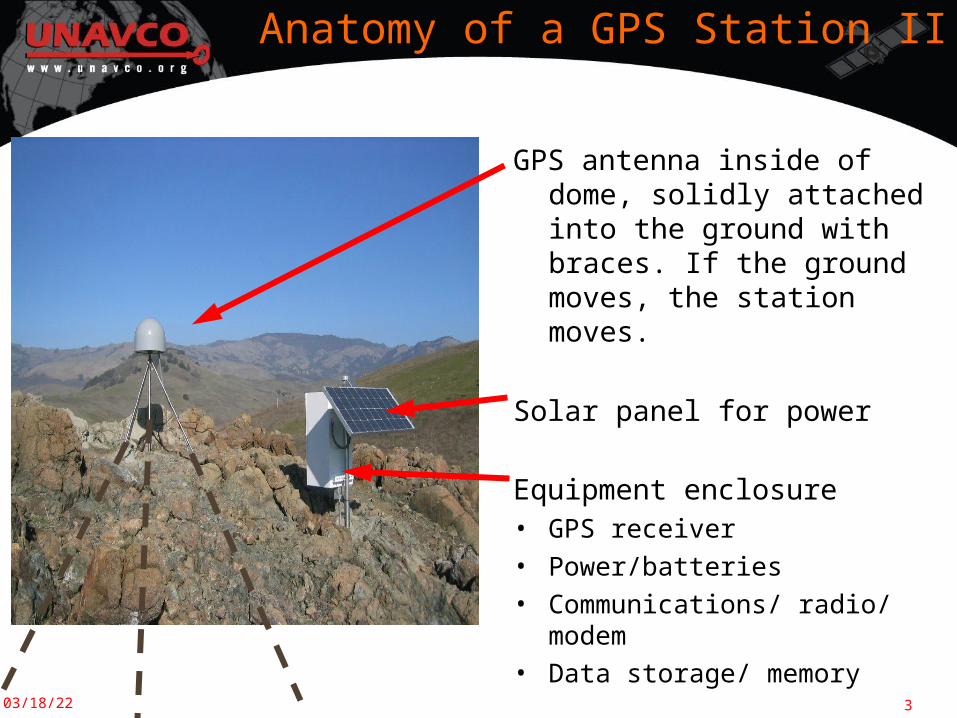
Anatomy of a GPS Station II
GPS antenna inside of dome, solidly attached into the ground with braces. If the ground moves, the station moves.
Solar panel for power
Equipment enclosure
• GPS receiver• Power/batteries• Communications/ radio/ modem• Data storage/ memory
04/18/23 4
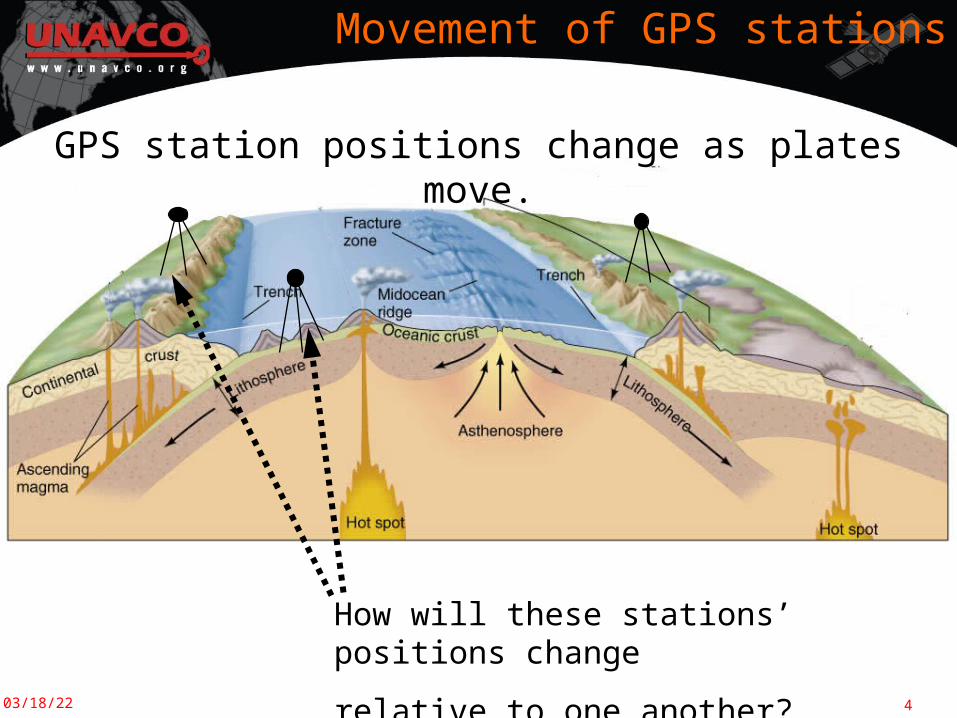
Movement of GPS stations
GPS station positions change as plates move.
How will these stations’ positions change
relative to one another?
04/18/23 5
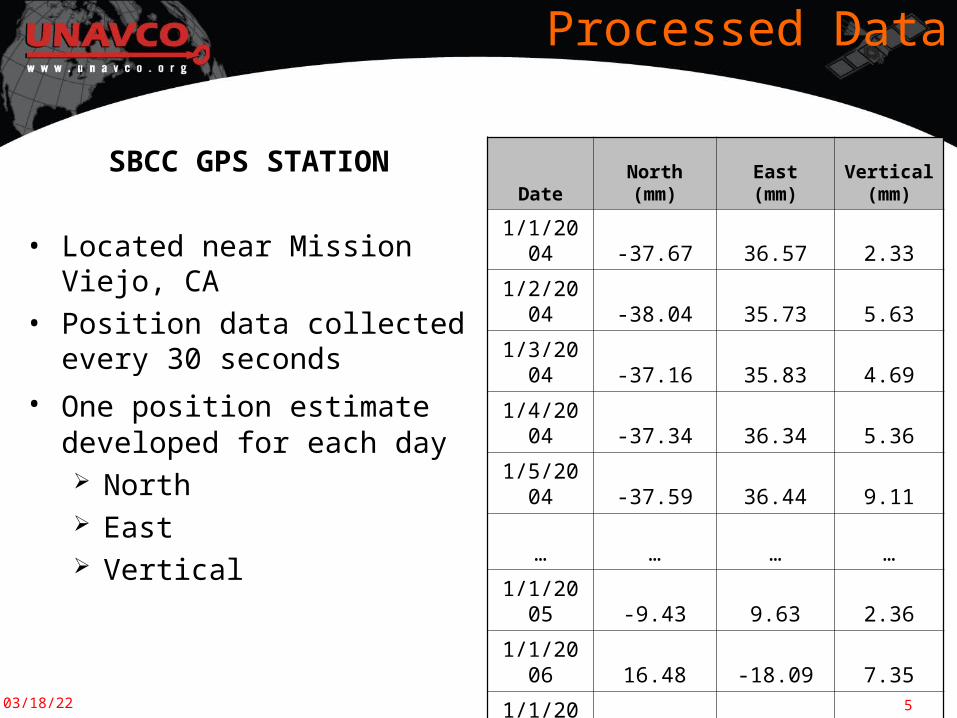
Processed Data
SBCC GPS STATION
• Located near Mission Viejo, CA
• Position data collected every 30 seconds
• One position estimate developed for each day North East Vertical
Date North (mm) East (mm)Vertical
(mm)
1/1/2004 -37.67 36.57 2.33
1/2/2004 -38.04 35.73 5.63
1/3/2004 -37.16 35.83 4.69
1/4/2004 -37.34 36.34 5.36
1/5/2004 -37.59 36.44 9.11
… … … …
1/1/2005 -9.43 9.63 2.36
1/1/2006 16.48 -18.09 7.35
1/1/2007 45.98 -43.42 -6.43
04/18/23 6
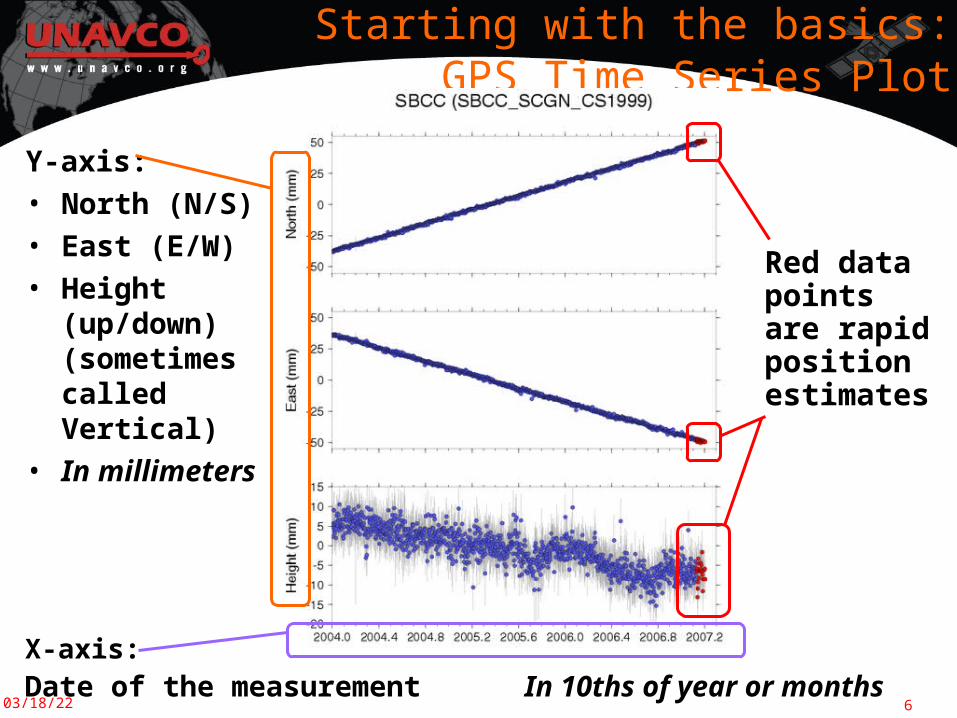
Starting with the basics: GPS Time Series Plot
Y-axis:
• North (N/S)
• East (E/W)
• Height (up/down) (sometimes called Vertical)
• In millimeters
X-axis: Date of the measurement In 10ths of year or months
Red data points are rapid position estimates
04/18/23 7
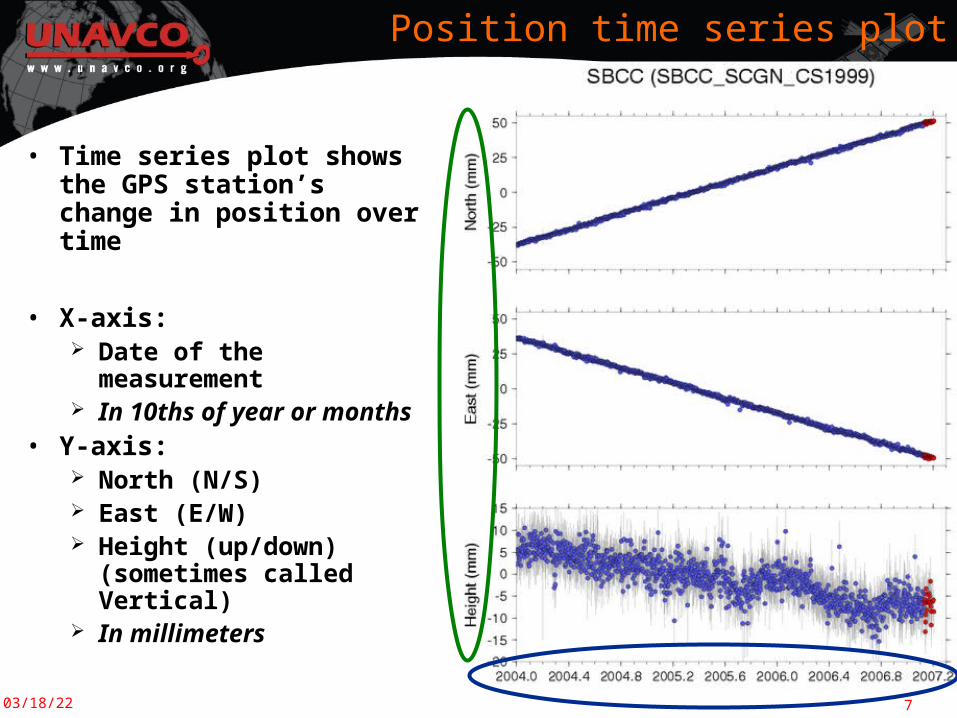
Position time series plot
• Time series plot shows the GPS station’s change in position over time
• X-axis: Date of the measurement In 10ths of year or
months• Y-axis:
North (N/S) East (E/W) Height (up/down)
(sometimes called Vertical)
In millimeters
04/18/23 8
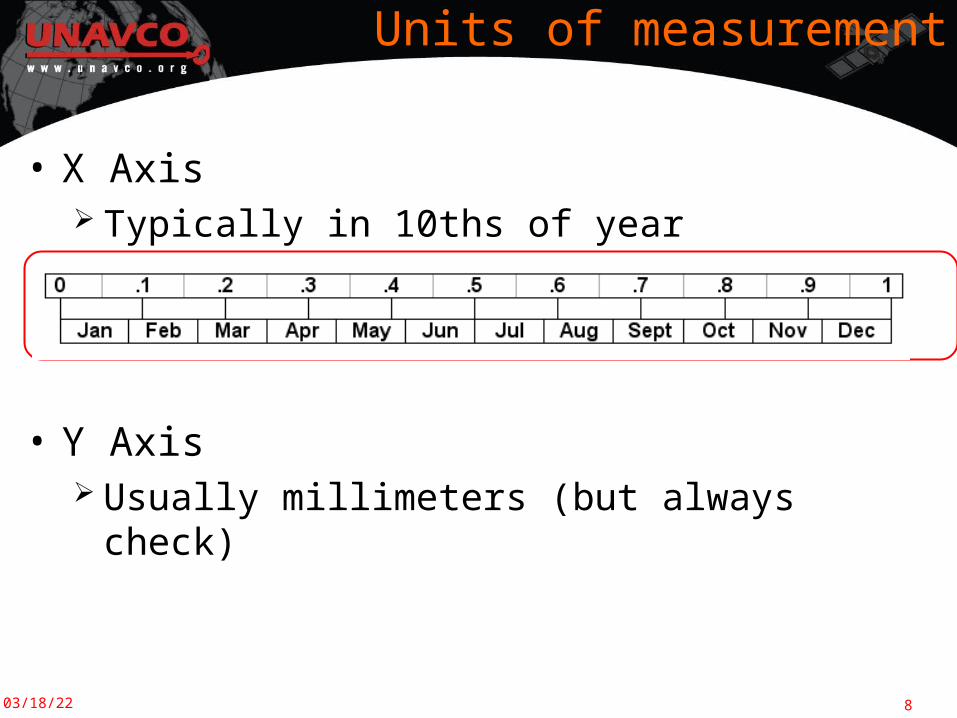
Units of measurement
• X Axis Typically in 10ths of year
• Y Axis Usually millimeters (but always check)
04/18/23 9
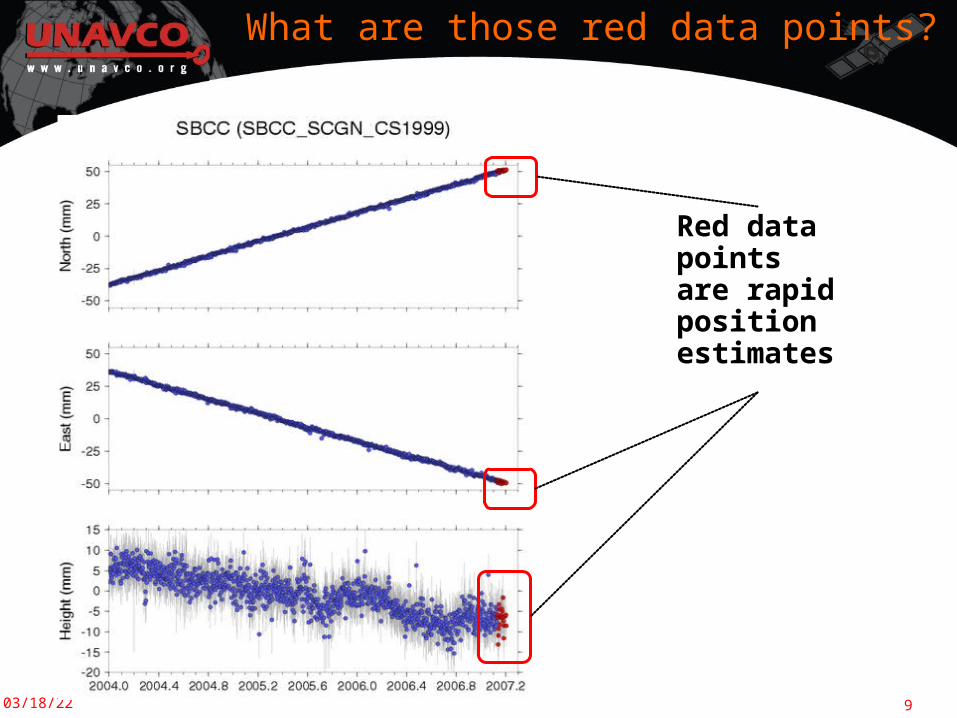
What are those red data points?
Red data points are rapid position estimates
04/18/23 10
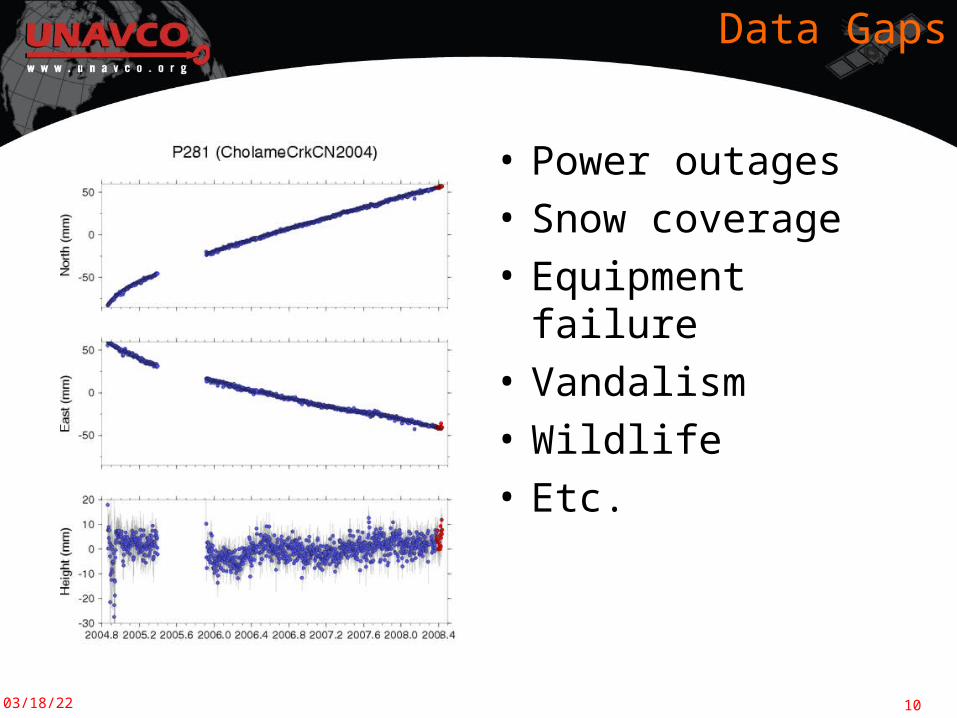
Data Gaps
• Power outages
• Snow coverage
• Equipment failure
• Vandalism
• Wildlife
• Etc.
04/18/23 11
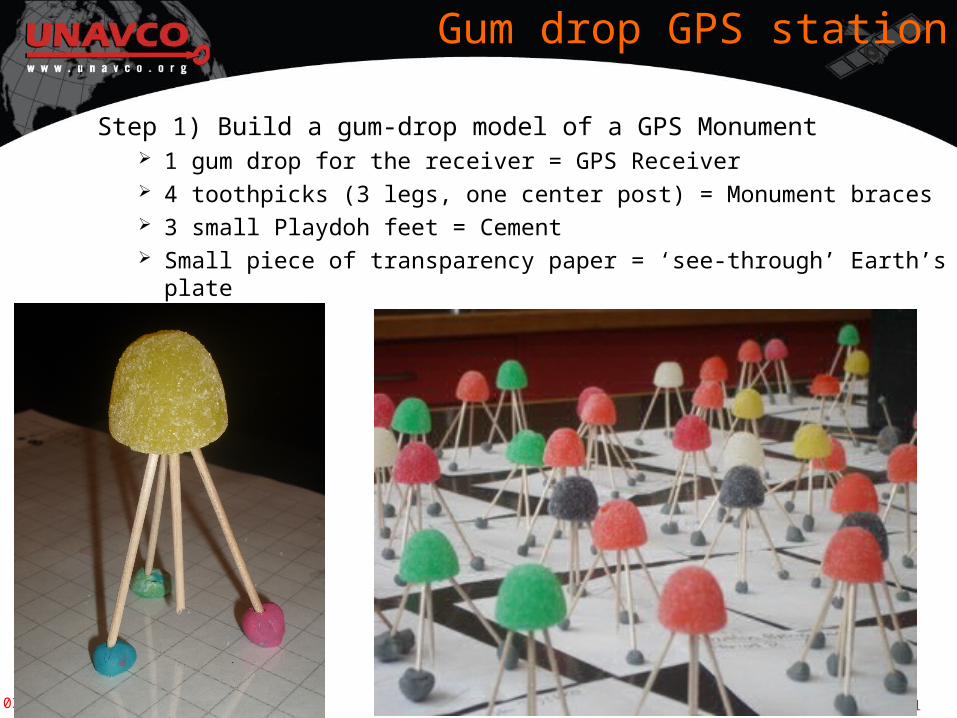
Gum drop GPS station
Step 1) Build a gum-drop model of a GPS Monument 1 gum drop for the receiver = GPS Receiver 4 toothpicks (3 legs, one center post) = Monument braces 3 small Playdoh feet = Cement Small piece of transparency paper = ‘see-through’ Earth’s plate
04/18/23 12
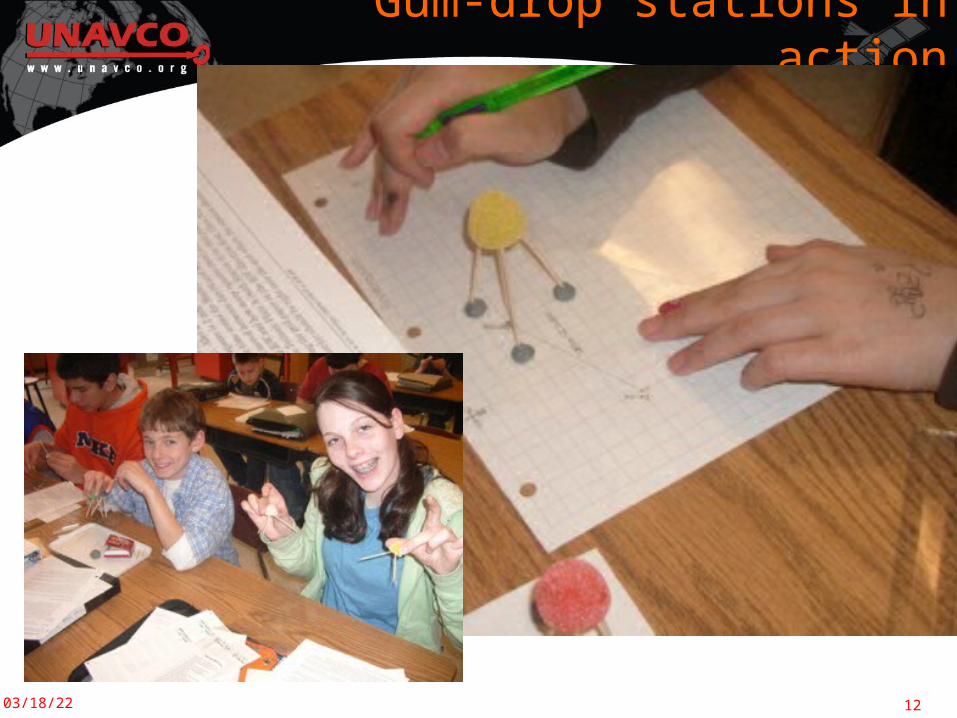
Gum-drop stations in action
04/18/23 13
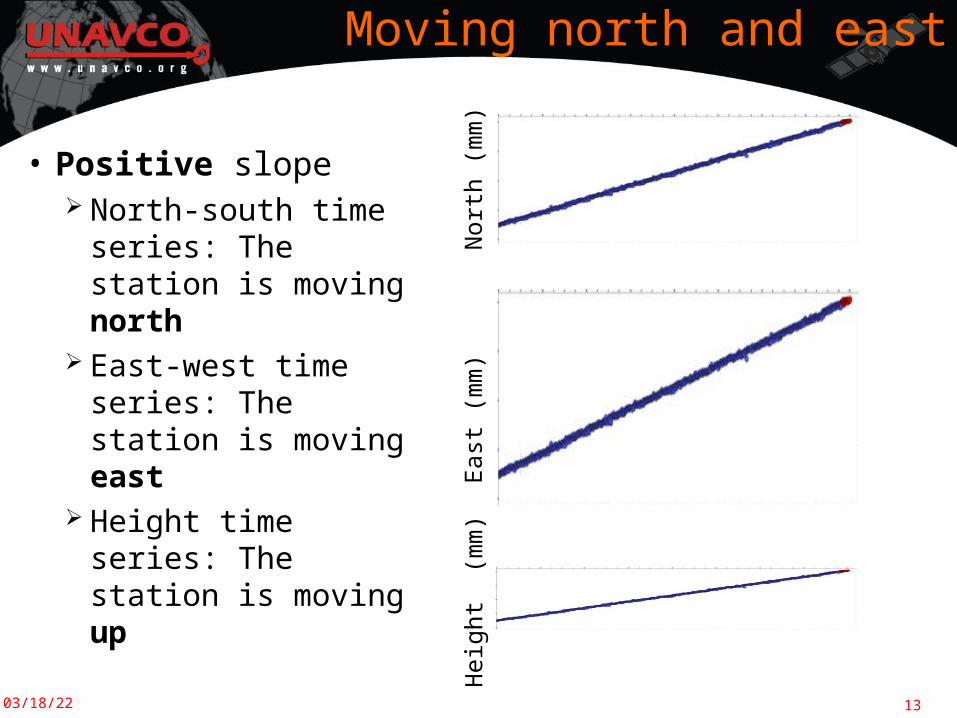
Moving north and east
• Positive slope North-south time
series: The station is moving north
East-west time series: The station is moving east
Height time series: The station is moving up
Nor
th (
mm
)E
ast
(mm
)H
eigh
t (
mm
)
04/18/23 14
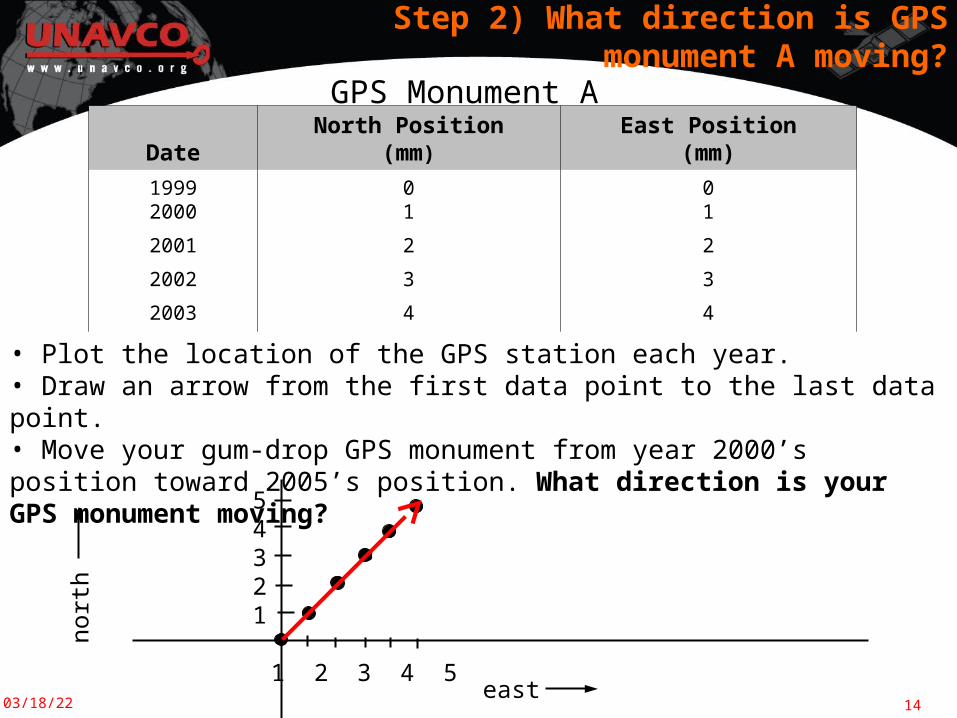
DateNorth Position
(mm)East Position
(mm)
19992000
01
01
2001 2 2
2002 3 3
2003 4 4
2005 5 5… … …
Step 2) What direction is GPS monument A moving?
GPS Monument A
• Plot the location of the GPS station each year. • Draw an arrow from the first data point to the last data point.• Move your gum-drop GPS monument from year 2000’s position toward 2005’s position. What direction is your GPS monument moving?
54321
1 2 3 4 5
nort
h
east
04/18/23 15
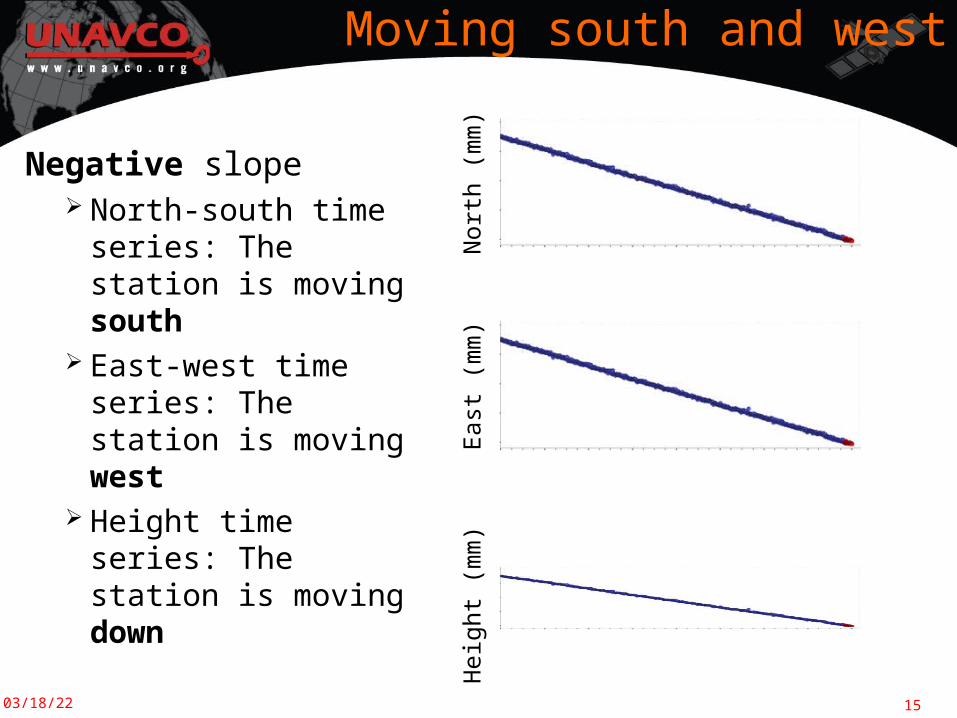
Moving south and west
Negative slope North-south time
series: The station is moving south
East-west time series: The station is moving west
Height time series: The station is moving down
Nor
th (
mm
)E
ast
(mm
)H
eigh
t (m
m)
04/18/23 16
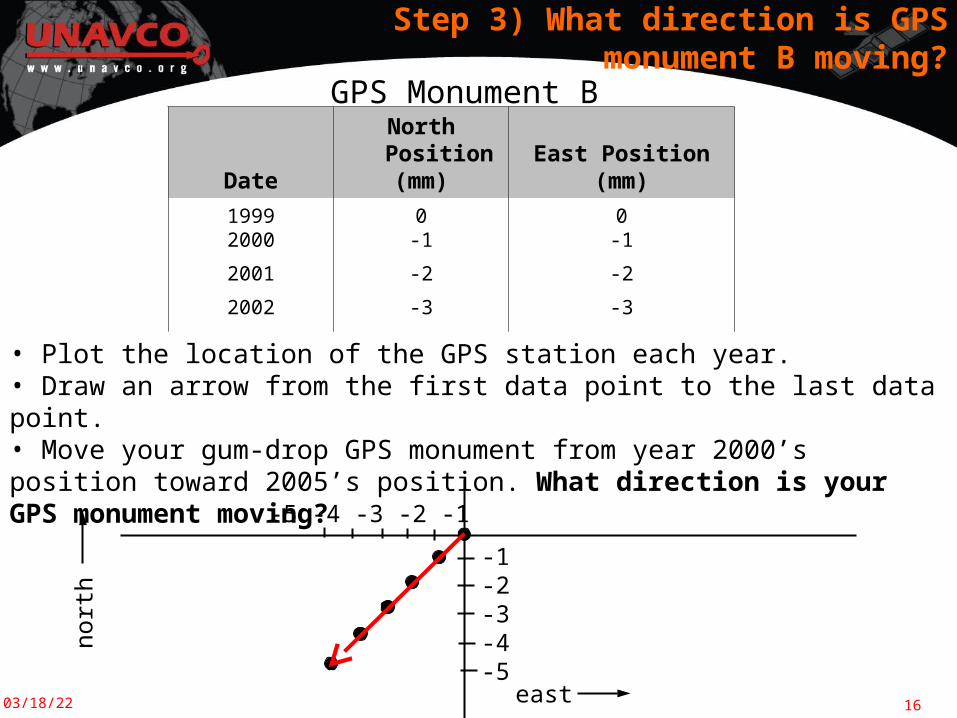
Step 3) What direction is GPS monument B moving?
DateNorth Position
(mm)East Position
(mm)
19992000
0-1
0-1
2001 -2 -2
2002 -3 -3
2003 -4 -4
… … …
• Plot the location of the GPS station each year. • Draw an arrow from the first data point to the last data point.• Move your gum-drop GPS monument from year 2000’s position toward 2005’s position. What direction is your GPS monument moving?
GPS Monument B
-1-2-3-4-5
-5 -4 -3 -2 -1
nort
h
east
04/18/23 17
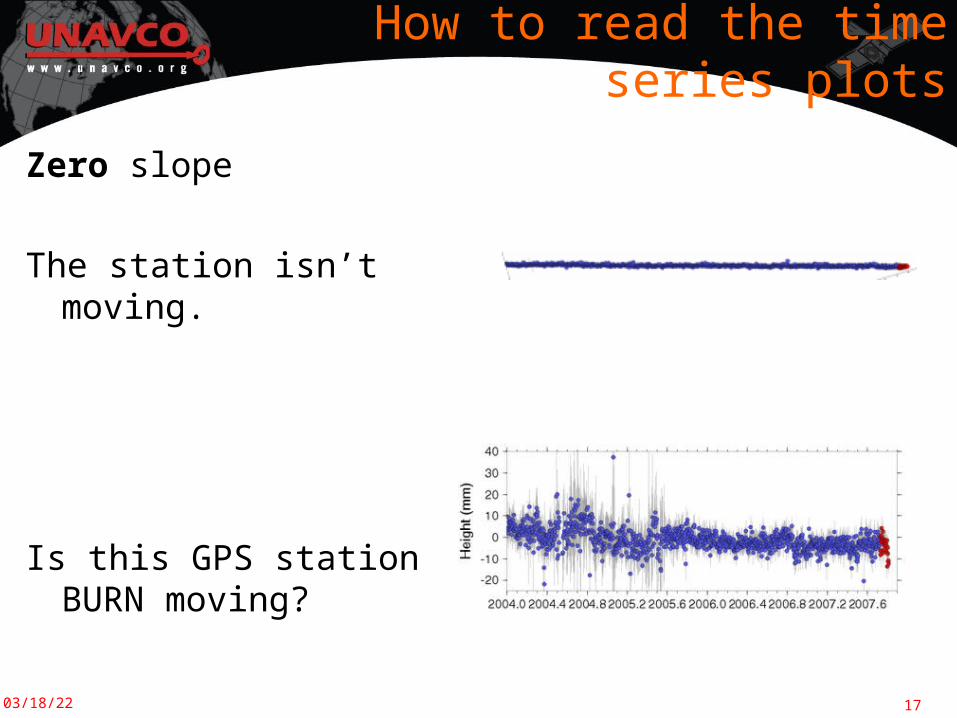
How to read the time series plots
Zero slope
The station isn’t moving.
Is this GPS station BURN moving?
04/18/23 18
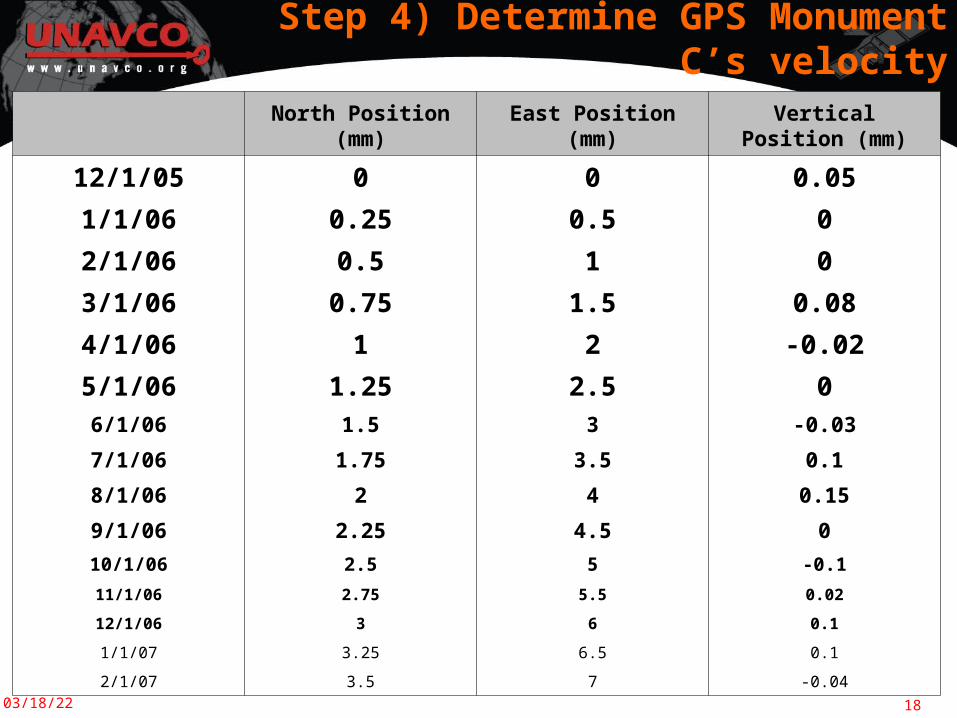
Step 4) Determine GPS Monument C’s velocity
North Position (mm) East Position (mm)Vertical Position
(mm)
12/1/05 0 0 0.05
1/1/06 0.25 0.5 0
2/1/06 0.5 1 0
3/1/06 0.75 1.5 0.08
4/1/06 1 2 -0.02
5/1/06 1.25 2.5 06/1/06 1.5 3 -0.03
7/1/06 1.75 3.5 0.1
8/1/06 2 4 0.15
9/1/06 2.25 4.5 0
10/1/06 2.5 5 -0.1
11/1/06 2.75 5.5 0.02
12/1/06 3 6 0.1
1/1/07 3.25 6.5 0.1
2/1/07 3.5 7 -0.04
04/18/23 19
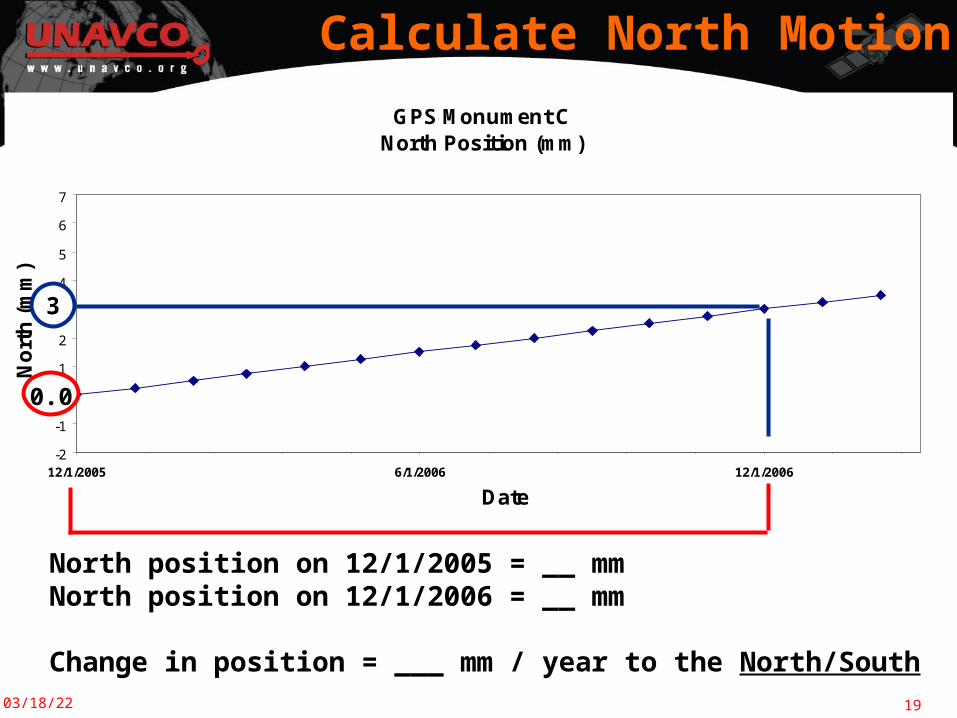
Calculate North Motion
North position on 12/1/2005 = __ mmNorth position on 12/1/2006 = __ mm
Change in position = ___ mm / year to the North/South
GPS Monument CNorth Position (mm)
-2
-1
0
1
2
3
4
5
6
7
12/1/2005 6/1/2006 12/1/2006
Date
No
rth
(m
m)
0.0
3

04/18/23 20
Calculate North Motion
North position on 12/1/2005 = 0 mmNorth position on 12/1/2006 = 3 mm
Change in position = 3.0 mm / year to the North
GPS Monument CNorth Position (mm)
-2
-1
0
1
2
3
4
5
6
7
12/1/2005 6/1/2006 12/1/2006
Date
No
rth
(m
m)
0.0
3
04/18/23 21
GPS Monument CEast Position (mm)
-2
-1
0
1
2
3
4
5
6
7
12/1/2005 6/1/2006 12/1/2006Date
Ea
st
(mm
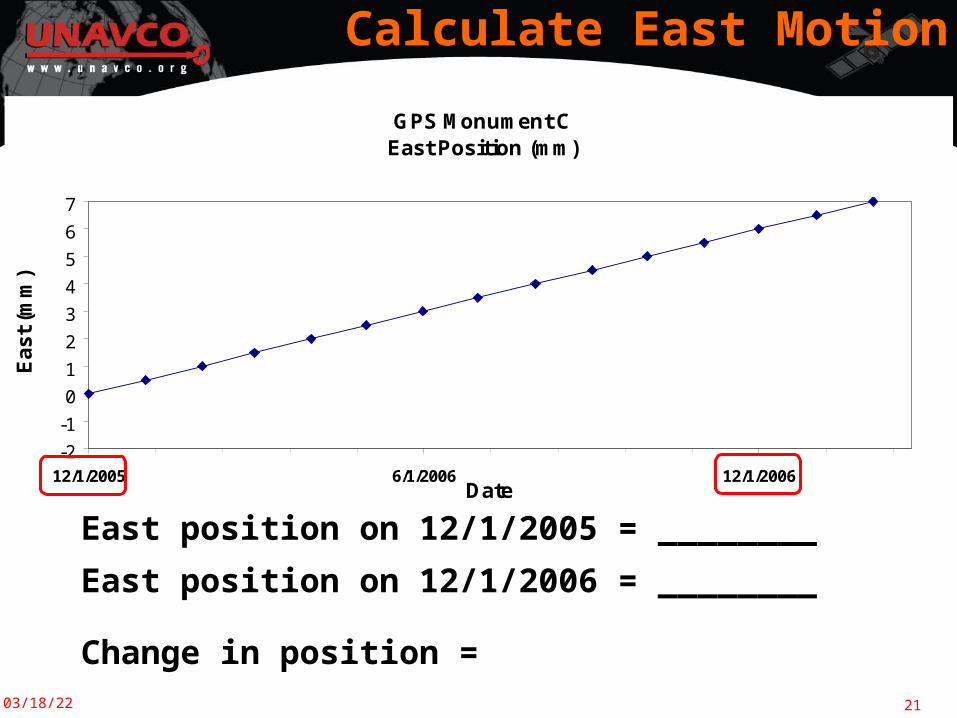
)Calculate East Motion
East position on 12/1/2005 = ________
East position on 12/1/2006 = ________
Change in position =
04/18/23 22
GPS Monument CEast Position (mm)
-2
-1
0
1
2
3
4
5
6
7
12/1/2005 6/1/2006 12/1/2006Date
Ea
st
(mm
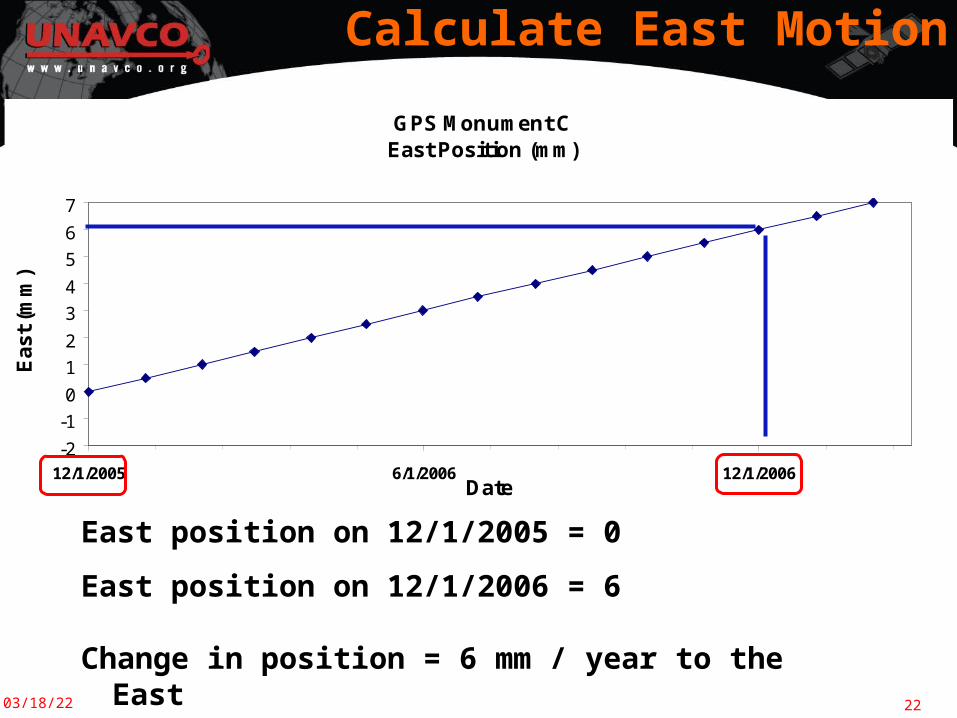
)Calculate East Motion
East position on 12/1/2005 = 0
East position on 12/1/2006 = 6
Change in position = 6 mm / year to the East
04/18/23 23
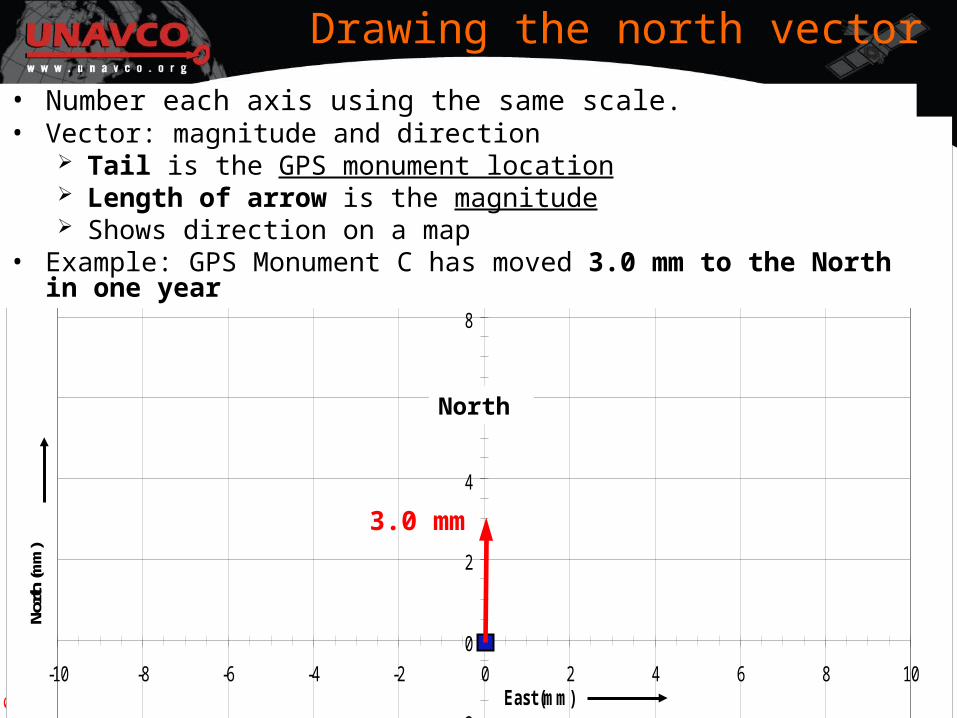
Drawing the north vector
GPS Velocity Vectors
-10
-8
-6
-4
-2
0
2
4
6
8
10
-10 -8 -6 -4 -2 0 2 4 6 8 10East (mm)
North
(mm
)
North
3.0 mm
• Number each axis using the same scale.• Vector: magnitude and direction
Tail is the GPS monument location Length of arrow is the magnitude Shows direction on a map
• Example: GPS Monument C has moved 3.0 mm to the North in one year
04/18/23 24
GPS Velocity Vectors
-10
-8
-6
-4
-2
0
2
4
6
8
10
-10 -8 -6 -4 -2 0 2 4 6 8 10East (mm)
North
(mm
)
North
3.0 mm
6.0 mm
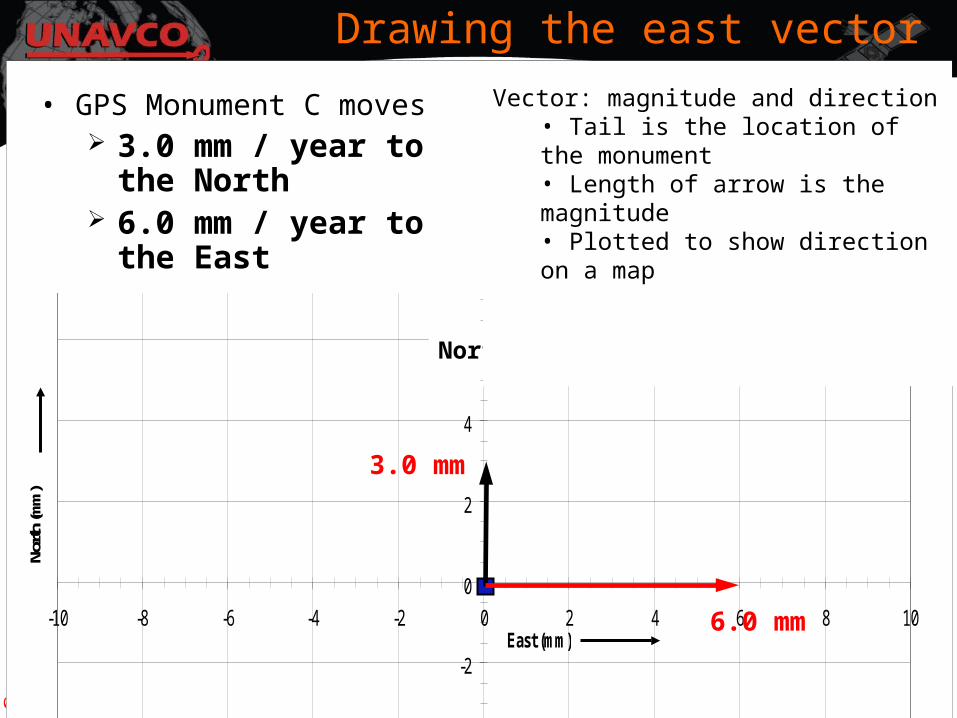
Drawing the east vector
• GPS Monument C moves 3.0 mm / year to the
North 6.0 mm / year to the
East
Vector: magnitude and direction• Tail is the location of the monument• Length of arrow is the magnitude• Plotted to show direction on a map
04/18/23 25
GPS Velocity Vectors
-10
-8
-6
-4
-2
0
2
4
6
8
10
-10 -8 -6 -4 -2 0 2 4 6 8 10East (mm)
North
(mm
)
North
3.0 mm
6.0 mm
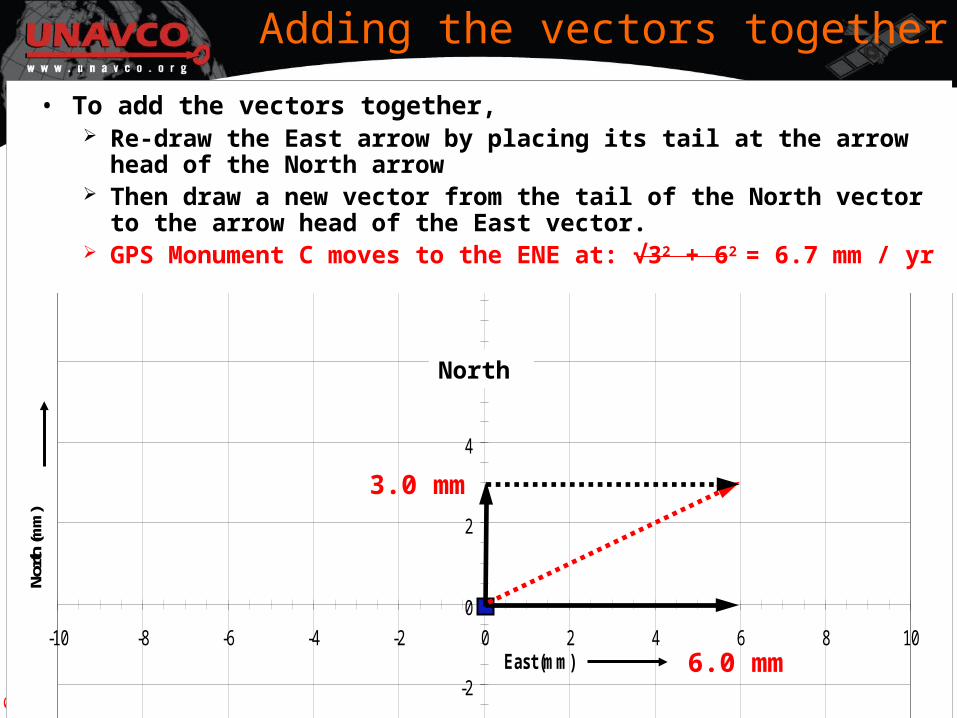
Adding the vectors together
• To add the vectors together, Re-draw the East arrow by placing its tail at the arrow head of the
North arrow Then draw a new vector from the tail of the North vector to the
arrow head of the East vector. GPS Monument C moves to the ENE at: √32 + 62 = 6.7 mm / yr

04/18/23 26
Now let’s try a real life example…
Contact info:Shelley Olds
olds unavco.org303-381-7496