readiness for action
TRANSCRIPT

READINESS FOR ACTIONREADINESS FOR ACTIONTHE BASELINE AND SITUATIONAL ANALYSIS REPORTTHE BASELINE AND SITUATIONAL ANALYSIS REPORT
FOR FOR PHASE I OF THE CARICOM HRD 2030 STRATEGYPHASE I OF THE CARICOM HRD 2030 STRATEGY
READINESS FOR ACTIONTHE BASELINE AND SITUATIONAL ANALYSIS REPORT
FOR PHASE I OF THE CARICOM HRD 2030 STRATEGY

TABLE OF CONTENTS
MESSAGE FROM THE PARTNERS ..............................................1
BASELINE REPORT ...................................................... 3
EXECUTIVE SUMMARY ............................................................4OVERVIEW ...........................................................................5ACCESS AND PARTICIPATION ..................................................8EQUITY ..............................................................................10QUALITY ............................................................................. 12RELEVANCE ........................................................................14CROSS-SECTORAL ENABLERS ................................................16CONCLUSION .................................................................... 18
SITUATIONAL ANALYSIS REPORT .................... 21
MEMBERS OF THE REGIONAL NETWORK OF PLANNING OFFICERS ......................................22LIST OF ACRONYMS ............................................................23LIST OF CHARTS ..................................................................24LIST OF TABLES ....................................................................25EXECUTIVE SUMMARY .........................................................27BACKGROUND ....................................................................28CONCLUSION ...................................................................60APPENDICIES ......................................................................62
READINESS FOR ACTION: THE BASELINE AND SITUATIONAL ANALYSIS REPORT FOR PHASE I OF THE CARICOM HRD 2030 STRATEGY

Prepared by The CARICOM Secretariat in collaboration
with the Caribbean Development Bank (CDB)
and the Regional Network of Planning Officers
CARICOM Secretariat (2019)
Georgetown, Guyana

READINESS FOR ACTION: THE BASELINE AND SITUATIONAL ANALYSIS REPORT FOR PHASE I OF THE CARICOM HRD 2030 STRATEGY 1
MESSAGE FROM THE PARTNERSThe Caribbean Community (CARICOM) Secretariat and the Caribbean Development Bank (COB) present for the consideration of CARICOM citizens, the Regional Baseline Report for Phase One of the Implementation of the CARICOM Human Resource Development (HRD) 2030 Strategy. This report was endorsed by the Ministers of Education at the Thirty-Eighth Meeting of the Council for Human and Social Development, which was held during the period October 23-24, 2019 in Georgetown, Guyana.
In July 2017, Heads of Government for CARICOM demonstrated their commitment to the principles of integration for development when they approved the implementation of the CARICOM Human Resource Development 2030 Strategy. The strategy is a roadmap for seamless quality educational delivery aimed at supporting sustainable economic resilience while maximising the potential of CARICOM citizens to contribute to the quality of life for themselves, their family, their nations and the CARICOM Region.
The Baseline Report highlights the readiness of CARICOM to monitor and report on the key performance indicators for Phase One of the Regional Action Plan which was approved at Council on Human and Social Development in 2018. More than a statement on how the region is performing across the Basic Education, Skills for Lifelong Learning and Tertiary Education sectors, the report is a demonstration of a regional good practice in educational collaboration, mentoring and capacity-building through the work of the Regional Network of Education Planning Officers.
As our citizens, stakeholders and international partners read the report, areas of national and regional strengths will be identified and areas where increased attention is needed will be articulated. Significantly, the recommendations present a clarion call for radical transformation in educational delivery and increased investments in education for development, to enable an adequate response to the economic, social, environmental and technological demands of the 21st Century.
The CARICOM Secretariat and COB are encouraged by the outcomes of this partnership; it promotes a paradigm shift for the region, in promoting evidence-based interventions that are monitored and evaluated for impact at the level of the citizenry. We look forward to receiving and sharing the annual reports from Member States as they report on the status of meeting the agreed regional targets.
Dr. Douglas Slater Assistant Secretary General Directorate of Human and Social Development CARICOM Secretariat
February 10, 2020
Ms. Monica La Bennett Vice President, Operations Caribbean Development Bank

2 READINESS FOR ACTION: THE BASELINE AND SITUATIONAL ANALYSIS REPORT FOR PHASE I OF THE CARICOM HRD 2030 STRATEGY

READINESS FOR ACTION: THE BASELINE AND SITUATIONAL ANALYSIS REPORT FOR PHASE I OF THE CARICOM HRD 2030 STRATEGY 3
BASELINE REPORTREADINESS FOR ACTION
4 READINESS FOR ACTION: THE BASELINE AND SITUATIONAL ANALYSIS REPORT FOR PHASE I OF THE CARICOM HRD 2030 STRATEGY
EXECUTIVE SUMMARYThe Baseline Report (BR) is intended to be used as a guide for policy dialogue on the development of regional targets for the CARICOM Human Resource Development 2030 Strategy (C-HRD 2030 S), as well as the actions that are required to achieve them. The report provides a snapshot of the region’s readiness to report on Key Performance Indicators (KPIs) for Phase One of the Regional Action Plan (RAP) for implementation 2017-2021. It presents regional baselines and recommended targets for measuring access and participation, quality, equity, and relevance in Basic Education (BE), Skills for Life-Long Learning (SLL) and the Tertiary Education (TE) sectors. Targets for these indicators, including the cross-sectoral enablers that are envisaged as critical to successful strategy implementation, are also proposed.
Significantly, 17 Member States (MS) submitted responses to the baseline survey (Situational Analysis Matrix – SAM), indicating a growing regional commitment to evidence-based policy action. However, no MS was able to complete the survey in its entirety, which highlights challenges with data management and reporting in the region that will undermine the ability to measure progress on the C-HRD 2030 S if not addressed.
As it relates to the three sectors emphasised in the C-HRD 2030 S, MS appear more ready to report on indicators in the BE sector. There are concerns, however, for the apparent underdeveloped capacity to measure strategic imperatives in the SLL and TE Sectors.
Across the region, MS demonstrate challenges in reporting on equity. In line with Sustainable Development Goal (SDG) 4, MS need to take steps to remove barriers that constrain access, quality, and relevance, for vulnerable populations. They also need to help improve data management for various equity groups (e.g. socio-economic, gender, special needs, geographic locations, non-native speakers, migrants, ethnic groups, etc.).
Inadequate student attainment in literacy and numeracy signals the continued struggle to achieve high quality BE and training. Further, difficulties encountered by MS in reporting on indicators for relevance, limits an assessment of regional developments in this regard. Hence, there is a need to harmonise approaches, not only to engender quality and relevance at all levels, but also, to monitor the same. For example, how concepts such as “career guidance”, “apprenticeships” and “continuous professional development” are operationalised and measured must be standardised to increase the utility of these indicators to assess regional quality and relevance in Human Resource Development (HRD).
Critically, the successful rate of implementation for the C-HRD 2030 S rests with MS and with the coordinating support of the CARICOM Secretariat. As such, there is an urgency in the region for rapid and relevant responses so that it may move from aspiration to action and realise the vision of the C-HRD 2030 S.
READINESS FOR ACTION: THE BASELINE AND SITUATIONAL ANALYSIS REPORT FOR PHASE I OF THE CARICOM HRD 2030 STRATEGY 5
OVERVIEW
1 The details of the findings are documented in a report entitled: The Caribbean Community (CARICOM) Human Resource Development Strategy 2030: Situational Analysis Report (2019).
This Report emanates from the Situational Analysis Survey (SAS) for the C-HRD 2030 S that was undertaken between September 2018 and June 2019, and outlines MS’ status with respect to the key performance indicators identified to monitor and evaluate strategy implementation. 1 The report first provides a broad picture of MS’ capacity to report on the indicators being measured as a part of Phase One of the RAP for implementing the C-HRD 2030 S, which have been selected both for their ability to capture progress toward strategy objectives and their general availability across the region.
Then, and in line with the four imperatives identified in the C-HRD 2030 S – access and participation, equity, relevance and quality – the Report presents baseline data for indicators in Phase One of the RAP and proposes regional targets for consideration by the Thirty-Eighth Meeting of the COHSOD – Education, October 23-24, 2019. Importantly, proposed targets were derived by considering the differences in pace of strategy implementation among MS, the political imperatives for action for progression towards C-HRD 2030 S, and the global commitments of MS and the wider region to the United Nations (UN) SDGs.
For each imperative, an analysis of regional strengths and challenges is offered, along with recommended areas for action, to increase the pace of strategy implementation and strengthen data management at both the regional and MS levels. Where possible and appropriate, qualitative evidence is used as good practice examples in MS at it relates to particular imperatives.
REGION’S READINESS TO REPORT ON THE C-HRD 2030 S
The ability to measure and report on Phase One Indicators is foundational to successful monitoring and evaluation of the C-HRD 2030 S implementation. As illustrated in Figure 1, MS are at varying levels of readiness to do so.
The growing investment in results-based management and improved education management information systems is evidenced by the encouraging response rate to the survey, with 17 CARICOM countries submitting at least partial responses. What is significant, however, is that no MS submitted a complete data set for the survey. This reality is one immediate indication that there are constraints, which must be addressed at national and regional levels, in managing the data required to monitor strategy implementation.
Notwithstanding the differences among MS, the region is best positioned to measure access and participation, and to a lesser extent, quality and relevance, governance, and equity, in the BE sector. Collectively, fewer MS are able to provide reliable data across imperatives in the TE and SLL sectors. While broadened and deepened access to high quality and relevant basic education is a cornerstone of effective strategy implementation and must, therefore, be strategically monitored, the success of the C-HRD 2030 S also hinges on key transformational initiatives in Continuing and Higher Education. Thus, enhanced capacity of MS to better measure and report on key performance indicators in these sectors is essential.

6 READINESS FOR ACTION: THE BASELINE AND SITUATIONAL ANALYSIS REPORT FOR PHASE I OF THE CARICOM HRD 2030 STRATEGY
FIGURE 1 - PREPAREDNESS OF MEMBER STATES TO REPORT ON INDICATORS
A&B BAH B/DOS BEL BVI DOM GND GUY HAI JAM MSR SKN SLU SVG SUR TCI T&T TOTAL
Participation rate in organised learning of children one year before the official primary entry age, by sex • • • • • • • • • • • • • • • • 16
Net Enrolment at primary • • • • • • • • • • • • • • • 15
Net Enrolment at secondary • • • • • • • • • • • • • • • • 16
Primary Completion Rate • • • • • • • • • • • • • • • 15
Primary Survival Rate • • • • • • • • • • • • • • 14
Secondary Completion Rate • • • • • • • • • • • • • • • 15
Secondary Survival Rate • • • • • • • • • • • • • • 14
Gender Parity Index • • • • • • • • • • • • • • • • • 17
Geographic Parity Index • • • • • 5
Proportion of children and young people (a) in grade 2 or 3 (b) at the end of primary education (c) at the end of lower secondary achieving at least a minimum proficiency level in reading and mathematics, by sex • • • • • • • • • • • • • • 14
Percentage of trained teachers (a) pre-primary (b) primary and (c) secondary (SDG 4.c.1) • • • • • • • • • • • • • • • • 16
Proportion of secondary school students who attain at least five (5) subjects, including Mathematics and English or other official language • • • • • • • • • • • • • • • 15
Proportion of secondary school students who attain two (2) or more STEM subjects • • • • • • • • • • • • 12
Percentage of secondary school students in fifth form or equivalent, participating in apprenticeships and school-to-work programmes • • • • • • 6
Percentage of students in the final year secondary, exposed to career guidance opportunities (career education) • • • • • • • • • • • 11
Existence of second-chance learning or alternative learning programmes for out-of-school youth and adults (2.6HRD) • • • • • • • • • 9
Percentage of TVET instructors/teachers trained in competency-based programmes (3.10HRD) • • • • • • • 7
Existence of curricula and/or programmes for youth and adults, which address personal health and family, and other skills-based development (4.8 HRD) • • • • • • • 7
Percentage of students enrolled in STEM programmes at the tertiary education level • • • • • • • • • • 10
Gender Parity Index (GPI) at tertiary level • • • • • • • • 8
Existence of national education planning committees to support implementation of C-HRD 2030 S (5.7HRD) • • • • • • 6
Per Capita expenditure according to levels/subsectors • • • • • • • • 8

READINESS FOR ACTION: THE BASELINE AND SITUATIONAL ANALYSIS REPORT FOR PHASE I OF THE CARICOM HRD 2030 STRATEGY 7
FIGURE 1 - PREPAREDNESS OF MEMBER STATES TO REPORT ON INDICATORS
A&B BAH B/DOS BEL BVI DOM GND GUY HAI JAM MSR SKN SLU SVG SUR TCI T&T TOTAL
Participation rate in organised learning of children one year before the official primary entry age, by sex • • • • • • • • • • • • • • • • 16
Net Enrolment at primary • • • • • • • • • • • • • • • 15
Net Enrolment at secondary • • • • • • • • • • • • • • • • 16
Primary Completion Rate • • • • • • • • • • • • • • • 15
Primary Survival Rate • • • • • • • • • • • • • • 14
Secondary Completion Rate • • • • • • • • • • • • • • • 15
Secondary Survival Rate • • • • • • • • • • • • • • 14
Gender Parity Index • • • • • • • • • • • • • • • • • 17
Geographic Parity Index • • • • • 5
Proportion of children and young people (a) in grade 2 or 3 (b) at the end of primary education (c) at the end of lower secondary achieving at least a minimum proficiency level in reading and mathematics, by sex • • • • • • • • • • • • • • 14
Percentage of trained teachers (a) pre-primary (b) primary and (c) secondary (SDG 4.c.1) • • • • • • • • • • • • • • • • 16
Proportion of secondary school students who attain at least five (5) subjects, including Mathematics and English or other official language • • • • • • • • • • • • • • • 15
Proportion of secondary school students who attain two (2) or more STEM subjects • • • • • • • • • • • • 12
Percentage of secondary school students in fifth form or equivalent, participating in apprenticeships and school-to-work programmes • • • • • • 6
Percentage of students in the final year secondary, exposed to career guidance opportunities (career education) • • • • • • • • • • • 11
Existence of second-chance learning or alternative learning programmes for out-of-school youth and adults (2.6HRD) • • • • • • • • • 9
Percentage of TVET instructors/teachers trained in competency-based programmes (3.10HRD) • • • • • • • 7
Existence of curricula and/or programmes for youth and adults, which address personal health and family, and other skills-based development (4.8 HRD) • • • • • • • 7
Percentage of students enrolled in STEM programmes at the tertiary education level • • • • • • • • • • 10
Gender Parity Index (GPI) at tertiary level • • • • • • • • 8
Existence of national education planning committees to support implementation of C-HRD 2030 S (5.7HRD) • • • • • • 6
Per Capita expenditure according to levels/subsectors • • • • • • • • 8

8 READINESS FOR ACTION: THE BASELINE AND SITUATIONAL ANALYSIS REPORT FOR PHASE I OF THE CARICOM HRD 2030 STRATEGY
ACCESS AND PARTICIPATION
2 For some MS, this can refer to Science, Technology, Engineering and Mathematics (STEM) or Science, Technology, Reading, Engineering and Mathematics (STREM) or Science, Technology, Engineering, Arts and Mathematics (STEAM).
Through broadened and deepened access and participation in education in MS, the C-HRD 2030 S aims to empower the people of the region, and contribute towards the development of the attributes of the ideal caribbean person. This imperative seeks to ensure universal access to, and improved support services in BE, as well as to increase enrolment in the TE sector. It also seeks to enhance skills offering and digital learning modalities. The baseline survey assessed participation rates in organised learning in early childhood education, net enrolment rates and survival rates of students in primary and secondary schools, the percentage of students enrolled in STEM 2 programmes at the tertiary level, and the participation of adults in education and training. The results are summarised in Table 1 below.
As it relates to broadened and deepened access and participation in BE, the region appears to be performing adequately, with admirable enrolment and completion rates at the primary and, to a lesser extent, secondary levels. More investment is needed in the early childhood sector to ensure that enrolment and completion rates remain high. Of significant concern is the region’s performance in the SLL and TE sectors. Greater attention is needed for data management in these sectors to ensure that policy makers can make strategic interventions in these areas.
TABLE 1: ACCESS AND PARTICIPATION
Indicator
Regional Baselines %
Regional Indicative Targets
– by 2030 %
Global Targets (SDG-2030) %
RA RA
1.1 Participation rates in organised learning of children who are one year below the official age for entry into the primary system (SDG 4.2.2)
62.79 80 100
1.1 Net Enrolment Rates 100
• Primary 88.79 95 100
• Secondary 71.37 85 100
1.1 Survival Rates
• Primary 89.14 100 100
• Secondary 76.32 85 100
1.6 Percentage of students enrolled in STEM programmes at the tertiary education level 37.96 50 100

READINESS FOR ACTION: THE BASELINE AND SITUATIONAL ANALYSIS REPORT FOR PHASE I OF THE CARICOM HRD 2030 STRATEGY 9
AREAS FOR ACTION
` MS should identify, analyse and address the local barriers to improving access and participation rates at early childhood, primary and secondary levels, SLL and TE sectors, including the low completion rate of boys and vulnerable populations.
` All MS should increase their capacity to report on access and participation in SLL and TE sectors.

10 READINESS FOR ACTION: THE BASELINE AND SITUATIONAL ANALYSIS REPORT FOR PHASE I OF THE CARICOM HRD 2030 STRATEGY
EQUITYThe C-HRD 2030 S takes cognisance of the need for provisions that call for a diversity of educational opportunities appropriate for learners who have differing learning styles and/or who may not be able to learn effectively in traditional arrangements. It envisages that changes in equity will be achieved through the adoption of relevant policies and resource commitments that are aimed at addressing disparities in basic education, improved second chance opportunities, and increased enrolment of males in tertiary education. The indicators for the equity imperative were selected to assess the situation with gender parity and geographic parity. The findings are summarised in Table 2.
It is evident that proportionally, there are more females than males in the BE and TE sectors, with the phenomenon much more pronounced in higher education. Based on the few MS that currently capture location parity data, access and participation is greater in urban areas than in rural areas. However, as indicated in the Situational Analysis Matrix Report, the overwhelming majority of MS were particularly challenged to disaggregate data-based location differences, making the determination of location parity problematic. This reality has significant implications for measuring the provision of education and training for equity groups across all sectors, thereby, threatening attainment of the vision of the C-HRD 2030 S for the development of an equitable education system in the region.
AREAS FOR ACTION
` All MS must be able to disaggregate data for access and participation, quality, and rel-evance based on their peculiar vulnerable populations (e.g. SEN, gender, at risk youth, geography, socio-economic status, non-native speakers, migrant, ethnic grouping).
` MS should identify, analyse and address the local barriers to improving equity across all sectors, including gender parity in BE, SLL and TE.
TABLE 2: EQUITY
Indicator Regional Baselines
Regional Indicative Targets – by 2030
Global Targets (SDG-2030)
2.2 Gender Parity Index for Basic Education (SDG4.5.1)
• Gender Parity Pre-Primary Level 1 1 1
• Gender Parity Primary Level 1 1 1
Gender Parity Secondary Level 1.07 1 1
2.8 Gender Parity Index at Tertiary Level 2.17 1 1
2.3 Location (Geographic) Parity Index for Basic Education
• Location Parity Pre-Primary Level 0.85 1 1
• Location Parity Primary Level 0.98 1 1
• Location Parity Secondary Level 0.57 1 1

READINESS FOR ACTION: THE BASELINE AND SITUATIONAL ANALYSIS REPORT FOR PHASE I OF THE CARICOM HRD 2030 STRATEGY 11

12 READINESS FOR ACTION: THE BASELINE AND SITUATIONAL ANALYSIS REPORT FOR PHASE I OF THE CARICOM HRD 2030 STRATEGY
QUALITY
The Strategy recognises the need for excellence that embraces total quality management in all HRD sectors including:
` innovations in teaching and leadership
` competency-based curricula that address 21st century literacies and skills and linkages to the workplace and the community
` availability of adequate educational and institutional resources
` quality assurance and certification of skills, competencies and attitudes
The baseline for the quality imperative was measured by:
` minimum proficiency levels in reading and mathematics at key stages in basic education
` the percentage of trained teachers
` the proportion of students attaining at least five CXC CSEC subjects, including Mathematics and English or other official language
` the percentage of TVET instructors trained in CBET
` the status of the proposed CARICOM Tertiary Education Accreditation Framework
` the number of National Accreditation Agencies registered on the CARICOM Quality Assurance Register
The results are shown in Table 3.

READINESS FOR ACTION: THE BASELINE AND SITUATIONAL ANALYSIS REPORT FOR PHASE I OF THE CARICOM HRD 2030 STRATEGY 13
Quality is a key marker for maturing and matured educational systems. Acknowledging individual strengths and challenges among MS, regionally quality has been elusive, as indicated above by inadequate student attainment in key areas such as literacy and numeracy development. Initiatives for quality need to be harmonised and made more sustainable. Greater investments are needed to support quality in teaching and learning at all sectors, as this will have a defining impact on quality education delivery and experiences in the region.
AREAS FOR ACTION
` Establish regional standards for determining, assessing and benchmarking teaching quality.
` Establish regional standards for determining, assessing and benchmarking literacy and numeracy attainment levels within MS, or agree on a suitable proxy.
` Increase capacity in MS to design curricula and deliver BE, SLL and TE programmes that are competency based and that develop 21st century skills.
` Establish policies and procedures to enhance learning outcomes in SLL programmes.
` Increase capacity to design curricula (BE, SLL, TE) to impart the full range of desirable skills, knowledge and attitudes.
TABLE 3: QUALITY
IndicatorRegional Baselines %
Regional Indicative Targets – by 2030 %
Global Targets (SDG-2030) %
Reading and Mathematics
3.4 Proportion of children and young people a) in grade 2 or 3 achieving at least a minimum proficiency level in reading, by sex 59.26 75 100
3.4 Proportion of children and young people a) in grade 2 or 3 achieving at least a minimum proficiency level in mathematics, by sex 53.96 75 100
3.4 Proportion of children and young people at the end of primary education achieving at least a minimum proficiency level in reading, by sex 63 75 100
3.4 Proportion of children and young people at the end of primary education achieving at least a minimum proficiency level in mathematics, by sex 50.76 75 100
3.4 Proportion of children and young people at the end of lower secondary education achieving at least a minimum proficiency level in reading, by sex 51.89 75 100
3.4 Proportion of children and young people at the end of lower secondary education achieving at least a minimum proficiency level in mathematics, by sex 36.53 75 100
3.6 Percentage of Trained Teachers (SDG 4.c.1) 75.81 85 100
• Percentage of trained teachers in the pre-primary system 62.92 85 100
• Percentage of trained teachers in the primary system 80.66 85 100
• Percentage of trained teachers in the secondary system 67.77 85 100
3.10 Percentage of TVET instructors/teachers trained in competency-based programmes (3.10HRD) 31.35 65 100
3.4 Proportion of secondary school students who attain at least five (5) subjects, including Mathematics and English or other official language 36.85 65 100
14 READINESS FOR ACTION: THE BASELINE AND SITUATIONAL ANALYSIS REPORT FOR PHASE I OF THE CARICOM HRD 2030 STRATEGY
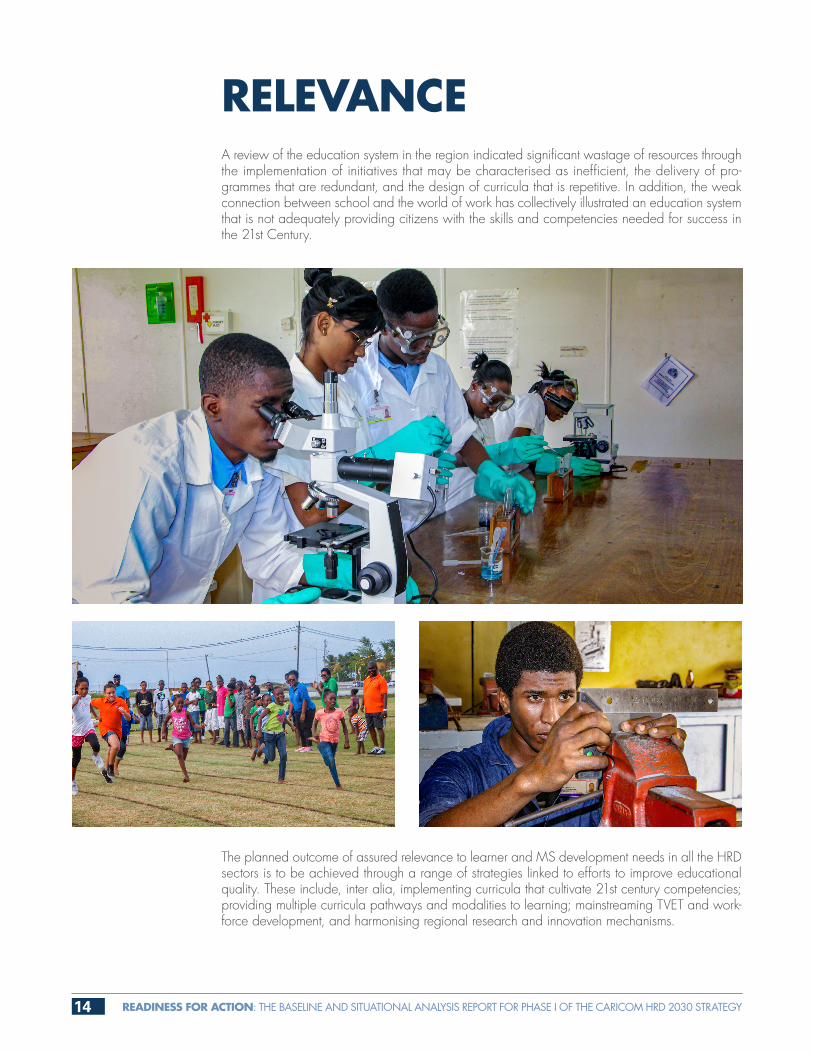
RELEVANCEA review of the education system in the region indicated significant wastage of resources through the implementation of initiatives that may be characterised as inefficient, the delivery of pro-grammes that are redundant, and the design of curricula that is repetitive. In addition, the weak connection between school and the world of work has collectively illustrated an education system that is not adequately providing citizens with the skills and competencies needed for success in the 21st Century.
The planned outcome of assured relevance to learner and MS development needs in all the HRD sectors is to be achieved through a range of strategies linked to efforts to improve educational quality. These include, inter alia, implementing curricula that cultivate 21st century competencies; providing multiple curricula pathways and modalities to learning; mainstreaming TVET and work-force development, and harmonising regional research and innovation mechanisms.

READINESS FOR ACTION: THE BASELINE AND SITUATIONAL ANALYSIS REPORT FOR PHASE I OF THE CARICOM HRD 2030 STRATEGY 15
The indicators for this imperative measured performance of secondary school students in STEM; participation in school-to-work programmes and career guidance opportunities; the existence of programmes for youth and adults that address personal health, and the status of the proposed CARICOM TE Accreditation Framework.
The results are shown in Table 4.
As Figure 1 earlier indicated, making sense of educational relevance in the region is constrained by MS’ ability to systematically report on this area. While examples of good practice to enhance relevance exist across the region, there remains the need for increased standardisation among MS. This is particularly urgent if the region is to arrest the impact of limited curric-ulum offerings, outdated design and delivery of curricula that do not address workforce development and societal needs, as well as the implementation of programmes that are not sufficiently effective in addressing personal health and family development and career guidance.
AREAS FOR ACTION
` The region needs to clearly define what is meant by “career guidance opportunities”, “apprenticeship and school-to-work programmes”, and “second chance/alternative learning programmes”, in order to support data collection to measure progress in these areas.
` All MS need to increase their capacity to deliver STEM/ STEAM/STREAM related subjects.
` MS need to increase capacity to deliver SLL programmes.
TABLE 4: RELEVANCE
IndicatorRegional Baselines
%
Regional Indicative
Targets – by 2030 %
Global Targets
(SDG-2030) %
4.1. Proportion of secondary school students who attain two or more STEM subjects 49.24 65 100
4.3 Percentage of secondary school students in fifth form or equivalent participating in apprenticeships and other school-to-work programmes 52.68 75 100
4.6 Percentage of students in the final year secondary exposed to career guidance opportunities 98.90 100 100
4.6. a. Existence of curricula that address personal health and family and other skills-based development (4.8 HRD) 42.2 MS 100 100
4.6. b. Existence of programmes for youths and adults that address personal health and family and other skills-based development (4.8 HRD) 42.2 MS 70 100
4.10 CARICOM TE accreditation framework established N/A N/A N/A

16 READINESS FOR ACTION: THE BASELINE AND SITUATIONAL ANALYSIS REPORT FOR PHASE I OF THE CARICOM HRD 2030 STRATEGY
CROSS-SECTORAL ENABLERSCross-sectoral enablers provide the policy, infrastructural, and regulatory environment needed to sustain the practices that will realise the comprehensive vision that is the C-HRD 2030 S. They are critical to the successful implementation of the Strategy in the region. Planned outcomes are:
` sustainable efficiencies
` knowledge creation
` knowledge sharing
` a harmonised data management and accountability system
` increased linkages between regional and national development plans
` the coordination of financing modalities and use of accountability systems
The indicators for this section focused on the status of national education planning committees to support implementation of C-HRD 2030 S; progress with aligning national sector plans; per capita expenditure in education, and the C-HRD 2030 S communication strategy. The indicators in this section are both qualitative and quantitative. The results are summarised in Table 5 below.
TABLE 5A: CROSS SECTORAL ENABLERS
Indicator Regional Baselines
Regional Indicative Targets – by 2030 %
Global Targets (SDG-2030) %
5.1 Existence of national education planning committees to support implementation of C-HRD 2030 S 41.18 % 100 100
15.8 Per capita expenditure on education per level (US$)
Early Childhood 1268 N/A N/A
Primary 697 N/A N/A
Secondary 2947 N/A N/A
Tertiary 2451 N/A N/A
3. Percentage of MS plans for which the strategies are aligned to the C-HRD 2030 S by sector and imperatives (5.1HRD) 17.6 % 100 100
1 8 of the 17 responding MS were able to disaggregate expenditures on education to show disbursements by levels. Targets are not ap-plicable to this indicator as there is no optimal expenditure that can be proposed for expenditure for any education sub-sector. Rather, the indicator gives a general idea of the level of investment per capita and would partly explain why some of the other indicators are as they are (NER, level of certified teachers, access to resources, and % of students in STEM, etc.). Further, it may point to particular sub-sectors where more investment is obviously needed (such as for ECD services). So, it does allow for intra-sector comparison of expenditure (ECD vs Tertiary) and inter-sector comparison, such as expenditure in ECD in country X compared to country Y.

READINESS FOR ACTION: THE BASELINE AND SITUATIONAL ANALYSIS REPORT FOR PHASE I OF THE CARICOM HRD 2030 STRATEGY 17
TABLE 5B 3: CROSS SECTORAL ENABLERS
Indicator Current Status Regional Indicative Targets – by 2030
5.7 An operationalised C-HRD 2030 S communication strategy In draft to be reviewed Implemented & operationalised across all MS
3.14 CARICOM Tertiary Education Accreditation Framework established To be designed Implemented & operationalised
across all MS
3.14 Number of National Accreditation Agencies registered on CARICOM Quality Assurance Register (CQAR) In draft Implemented & operationalised
across all MS
3 These are the responsibility of the CARICOM Secretariat- development of Regional Public Goods.
Cross-sectoral enabler indicators are challenging. They are highly dependent on increased invest-ment across systems – nationally and regionally (finance, capacity, policies); political will, and an uncompromising recognition of the importance of investing in education and training to respond to, and enhance social, economic and environmental security and resiliency. The development of a seamless education system is prefigured by the harmonisation and adoption of the regulatory and policy infrastructure needed to sustain the vision that is theC-HRD 2030 S.
AREAS FOR ACTION
` MS must convene the mechanism of the National COHSODs, comprised of cross-sectoral stakeholders to align sectoral plans to the C-HRD 2030 S, and promote the coordination and harmonisation of education and training delivery.
` Increased capacity in programme budgeting for education so that MS are better able to plan for, and monitor expenditure on education.
` Increased investment in the finances and capacity at the CARICOM Secretariat, Human Resources Development Unit to accelerate the pace of implementation of regional initiatives.

18 READINESS FOR ACTION: THE BASELINE AND SITUATIONAL ANALYSIS REPORT FOR PHASE I OF THE CARICOM HRD 2030 STRATEGY
CONCLUSIONThere needs to be:
1 An understanding of the status of MS in achieving the outcomes of the C-HRD 2030 S
2 Consideration for the inherent challenges related to data management and reporting in the Region
3 Recognition of the impact adequate data management will have on the successful implementation, monitoring and evaluation of the C-HRD 2030 S
4 Commitment to increased investment in data management and programme budgeting
5 Acknowledgment of the need to establish procedures and policies to support successful data management and monitoring of, and reporting on, indicators
6 Further acknowledgment of the need to build regional consensus for determining, assessing, and benchmarking literacy and numeracy attainment levels within MS
7 Knowledge of the need for increased political will and encouragement of MS to enhance engagement with National Statistical Offices in order to provide credible single age intercensal population estimates (disaggregated by sex, geographic regions)
8 Encouragement for MS to make the investments needed to build capacity to report on all indicators, in accordance with the UIS methodology.

READINESS FOR ACTION: THE BASELINE AND SITUATIONAL ANALYSIS REPORT FOR PHASE I OF THE CARICOM HRD 2030 STRATEGY 19


READINESS FOR ACTION: THE BASELINE AND SITUATIONAL ANALYSIS REPORT FOR PHASE I OF THE CARICOM HRD 2030 STRATEGY 21
SITUATIONAL ANALYSIS
REPORT
READINESS FOR ACTION
22 READINESS FOR ACTION: THE BASELINE AND SITUATIONAL ANALYSIS REPORT FOR PHASE I OF THE CARICOM HRD 2030 STRATEGY
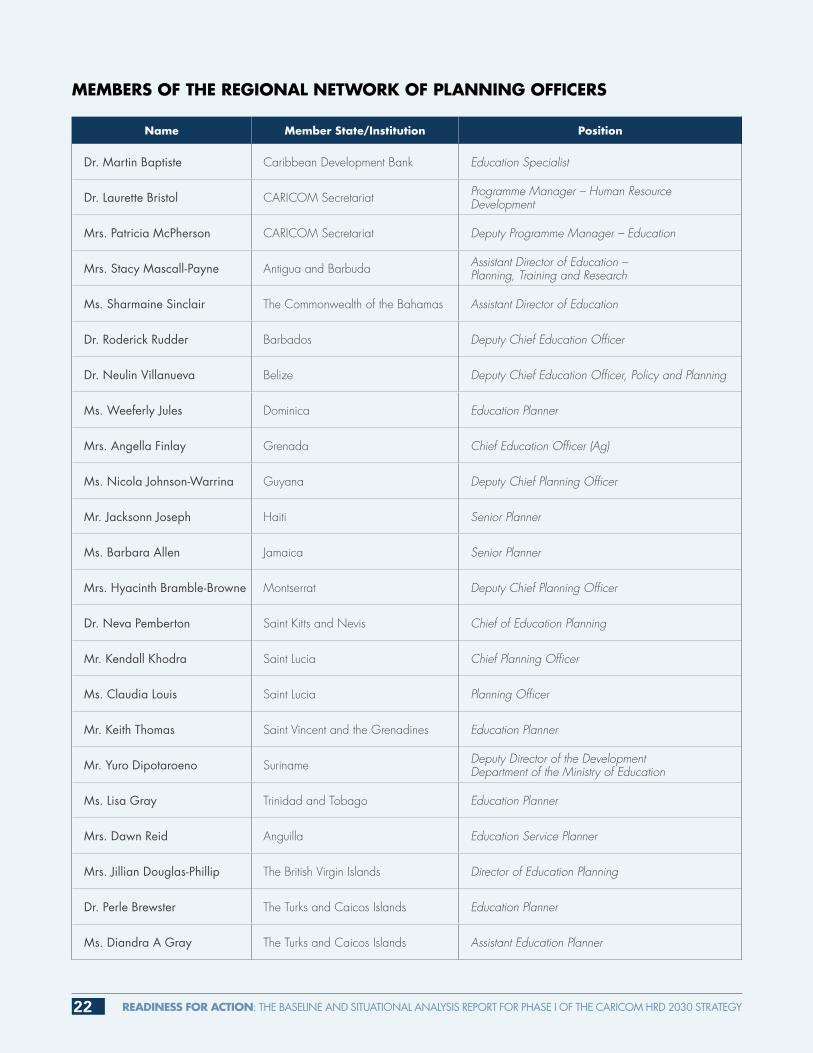
MEMBERS OF THE REGIONAL NETWORK OF PLANNING OFFICERS
Name Member State/Institution Position
Dr. Martin Baptiste Caribbean Development Bank Education Specialist
Dr. Laurette Bristol CARICOM Secretariat Programme Manager – Human Resource Development
Mrs. Patricia McPherson CARICOM Secretariat Deputy Programme Manager – Education
Mrs. Stacy Mascall-Payne Antigua and Barbuda Assistant Director of Education – Planning, Training and Research
Ms. Sharmaine Sinclair The Commonwealth of the Bahamas Assistant Director of Education
Dr. Roderick Rudder Barbados Deputy Chief Education Officer
Dr. Neulin Villanueva Belize Deputy Chief Education Officer, Policy and Planning
Ms. Weeferly Jules Dominica Education Planner
Mrs. Angella Finlay Grenada Chief Education Officer (Ag)
Ms. Nicola Johnson-Warrina Guyana Deputy Chief Planning Officer
Mr. Jacksonn Joseph Haiti Senior Planner
Ms. Barbara Allen Jamaica Senior Planner
Mrs. Hyacinth Bramble-Browne Montserrat Deputy Chief Planning Officer
Dr. Neva Pemberton Saint Kitts and Nevis Chief of Education Planning
Mr. Kendall Khodra Saint Lucia Chief Planning Officer
Ms. Claudia Louis Saint Lucia Planning Officer
Mr. Keith Thomas Saint Vincent and the Grenadines Education Planner
Mr. Yuro Dipotaroeno Suriname Deputy Director of the Development Department of the Ministry of Education
Ms. Lisa Gray Trinidad and Tobago Education Planner
Mrs. Dawn Reid Anguilla Education Service Planner
Mrs. Jillian Douglas-Phillip The British Virgin Islands Director of Education Planning
Dr. Perle Brewster The Turks and Caicos Islands Education Planner
Ms. Diandra A Gray The Turks and Caicos Islands Assistant Education Planner

READINESS FOR ACTION: THE BASELINE AND SITUATIONAL ANALYSIS REPORT FOR PHASE I OF THE CARICOM HRD 2030 STRATEGY 23
LIST OF ACRONYMS
CBET Competency Based Education and Training
CARICOM Caribbean Community
CBO Community Based Organisation
CVQ Caribbean Vocational Qualification
CXC Caribbean Examinations Council
ECE Early Childhood Education
CCS Caribbean Community Secretariat
HRDS Human Resource Development Strategy
MSR Montserrat
SAM Situational Analysis Matrix
SDGs Sustainable Development Goals
SAS Situation Analysis Survey
STEM Science Technology Engineering and Mathematics
SVG Saint Vincent and the Grenadines
TCI Turks and Caicos Islands
RNPO Regional Network of Planning Officers
RAP Regional Action Plan
UN United Nations
RFA Regional Framework for Action
SLL Skills for Lifelong Learning
TE Tertiary Education
BE Baseline Education.
24 READINESS FOR ACTION: THE BASELINE AND SITUATIONAL ANALYSIS REPORT FOR PHASE I OF THE CARICOM HRD 2030 STRATEGY
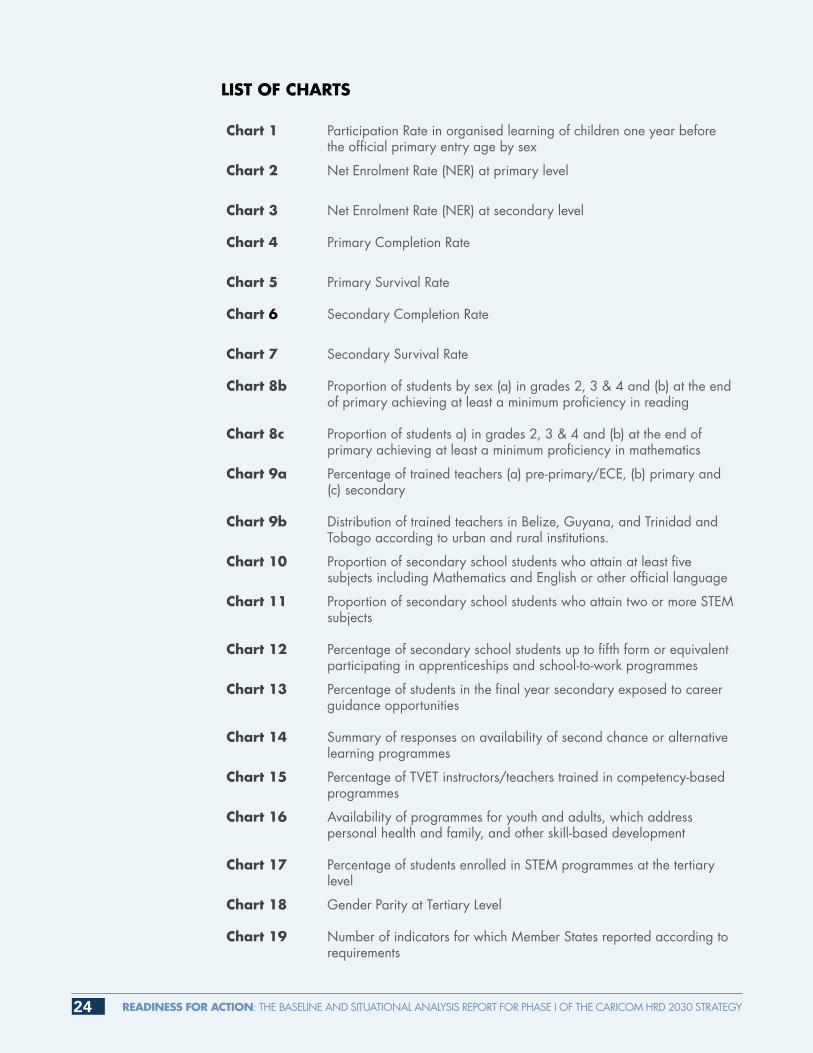
LIST OF CHARTS
Chart 1 Participation Rate in organised learning of children one year before the official primary entry age by sex
Chart 2 Net Enrolment Rate (NER) at primary level
Chart 3 Net Enrolment Rate (NER) at secondary level
Chart 4 Primary Completion Rate
Chart 5 Primary Survival Rate
Chart 6 Secondary Completion Rate
Chart 7 Secondary Survival Rate
Chart 8b Proportion of students by sex (a) in grades 2, 3 & 4 and (b) at the end of primary achieving at least a minimum proficiency in reading
Chart 8c Proportion of students a) in grades 2, 3 & 4 and (b) at the end of primary achieving at least a minimum proficiency in mathematics
Chart 9a Percentage of trained teachers (a) pre-primary/ECE, (b) primary and (c) secondary
Chart 9b Distribution of trained teachers in Belize, Guyana, and Trinidad and Tobago according to urban and rural institutions.
Chart 10 Proportion of secondary school students who attain at least five subjects including Mathematics and English or other official language
Chart 11 Proportion of secondary school students who attain two or more STEM subjects
Chart 12 Percentage of secondary school students up to fifth form or equivalent participating in apprenticeships and school-to-work programmes
Chart 13 Percentage of students in the final year secondary exposed to career guidance opportunities
Chart 14 Summary of responses on availability of second chance or alternative learning programmes
Chart 15 Percentage of TVET instructors/teachers trained in competency-based programmes
Chart 16 Availability of programmes for youth and adults, which address personal health and family, and other skill-based development
Chart 17 Percentage of students enrolled in STEM programmes at the tertiary level
Chart 18 Gender Parity at Tertiary Level
Chart 19 Number of indicators for which Member States reported according to requirements

READINESS FOR ACTION: THE BASELINE AND SITUATIONAL ANALYSIS REPORT FOR PHASE I OF THE CARICOM HRD 2030 STRATEGY 25
LIST OF TABLES
Table 1 Number of students in Trinidad and Tobago who attempted 5 or more subjects including Mathematics and English in the 2017 Caribbean Secondary Education Certificate (CSEC) Examinations
Table 2 Gender Parity Indices for Member States
Table 3 Location/Geographic Parity Index
Table 4 Proportion of children in lower secondary achieving at least minimum proficiency level in reading and mathematics
Table 5 Comparison of values for males and females in STEM
Table 6 Status of C-HRD 2030 S National Committee
Table 7 Per Capita Cost of Education According to Sectors
Table 8.1 Summary of Frequency of Responses
Table 8.2 Summary of Mean Aggregate Values

26 READINESS FOR ACTION: THE BASELINE AND SITUATIONAL ANALYSIS REPORT FOR PHASE I OF THE CARICOM HRD 2030 STRATEGY

READINESS FOR ACTION: THE BASELINE AND SITUATIONAL ANALYSIS REPORT FOR PHASE I OF THE CARICOM HRD 2030 STRATEGY 27
EXECUTIVE SUMMARY The Caribbean Community (CARICOM) Human Resource Development 2030 Strategy (C-HRD 2030 S) was approved by CARICOM Heads of Government in 2017. It aims at ensuring that all education and training across three sectors – Basic Education (BE), Skills for Lifelong Learning (SLL) and Tertiary Education (TE) – are relevant to the needs of 21st Century economies and societies. It promotes the development of a seamless education system with multiple pathways and modalities to enhance social, environmental and economic security and resilience. The C-HRD 2030 S is the regional roadmap that guides the development of the education sector and provides direction for the Region’s response to the United Nations (UN) Sustainable Development Goals (SDGs). It is envisaged that during the period 2018-2030, the objectives of CARICOM will be realised through the implementation of forty-one (41) strategies, thirteen (13) Cross-Sectorial Enablers and the delivery of seventy-one (71) outputs as set out in the C-HRD 2030 S.
The Situational Analysis Survey (SAS) was undertaken between October 2018 and June 2019 after finalisation of the proposed indicators for Phase One of the Regional Action Plan (RAP) for Implementation and the development of the Situational Analysis Matrix (SAM). Both the finalisation of the indicators and the SAM were completed in collaboration with the Regional Network of Planning Officers (RNPO) who serve as the focal points for the C-HRD 2030 S, the Caribbean Development Bank (CDB) and the CARICOM Secretariat.
The SAS results suggest that the proposed indicators on which Member States are best prepared to report are those that are listed under BE. Even then, the quality of the submissions was diverse and despite a nine-month timetable for submission, no Member State submitted a complete response to the SAM. Only eight indicators were able to attract reports from fifteen (15) or more Member States and there were challenges with baseline values for males and female, an issue that is likely to impact regional interest in gender-sensitive reporting. The reports on baseline values for urban and rural populations, where applicable, were even more deficient and in general, there is a dearth of data for SLL, TE and Cross-Sectoral Enablers. The paucity of data to inform baseline values makes a case for further dialogue with countries that offered limited reports.

28 READINESS FOR ACTION: THE BASELINE AND SITUATIONAL ANALYSIS REPORT FOR PHASE I OF THE CARICOM HRD 2030 STRATEGY
BACKGROUNDResponding to regional imperatives, and in line with UN SDGs 4 and 8, in 2017 CARICOM Heads of Government approved the C-HRD 2030 S as a long-term development policy to mobilise regional and national actors to deliver effective sustainable strategies that will:
` empower Caribbean people and contribute to the development of the attributes of the Ideal Caribbean Person
` establish a globally competitive system comprising three distinct sectors – BE, SLL and TE
` eliminate inefficiencies in the planning, management and delivery of Human Resource Development (HRD) sectors
These goals are to be achieved through targeted interventions at all levels in accordance with the Strategy’s four (4) imperatives: broadened and deepened access and participation; strengthened equity in access; improved quality in the delivery of HRD; assured relevance in HRD and through a number of strategic cross-sectoral enabling interventions.
The implementation approach for the C-HRD 2030 S treats the strategy as a 14-year master plan that is organised into three discrete RAP cycles consisting of three discrete phases. Phase 1 will end in 2020 while Phase 2 is scheduled for 2021-2024. Phase 3 will end in 2029 and will be followed by a strategy review and design activity carded for 2029-2030. Action planning, monitoring, and evaluation of the C-HRD 2030 S are guided by a gender-sensitive, results-based management system and the Theory of Change Model that captures different levels of expected outcomes to be monitored by Key Performance Indicators (KPIs) for each phase of strategy implementation.
The C-HRD 2030 S provides a blueprint for Member States to align their HRD sector plans, for regional institutions to devise their strategic plans, and for all parties to develop corresponding implementation plans. It is intended that implementation be actioned at the level of Member States while the CARICOM Secretariat will exercise oversight, responsibility and coordination at the regional level. Implementation of the strategy commenced at the regional level in May 2018, on the approval of the indicators for the RAP – Phase 1 at the Thirty-fourth Meeting of the Council for Human and Social Development (COHSOD) – Education. It assumes effective mobilisation of key actors who have ownership in the fulfilment of the Key Transformational Initiatives (KTIs) in the Regional Framework for Action (RFA).
PURPOSE OF THE REPORT
Utilising a results-based management model and evaluating the effectiveness and efficiency of strategy implementation on an iterative basis is best practice. As such, the establishment of cred-ible reference points against which the impact of the interventions is measured, is the first critical step. Thus, the purpose of the SAM Report is to provide quantitative and qualitative information on the status of the Region with respect to C-HRD 2030 S implementation, as measured by the KPIs agreed to for Phase 1. Specifically, the SAM captures the following:

READINESS FOR ACTION: THE BASELINE AND SITUATIONAL ANALYSIS REPORT FOR PHASE I OF THE CARICOM HRD 2030 STRATEGY 29
` baseline data for all Member States of CARICOM
` the extent to which the requisite data is accessible for each indicator
` the opportunities for data disaggregation
` the nature of variations among Member States
The descriptions contained herein are intended to inform decisions at regional and national levels with respect to the investments, capacity building initiatives, and data management practices needed to support successful strategy implementation.
ORGANISATION OF THE REPORT
With the background on the C-HRD 2030 S, as well as the purpose of the report established in the Introduction, the next section describes the methodology for the baseline survey. The presentation of results follows, which has been organised by education sectors and sequenced to mirror the structure of the SAM completed by Member States. The report concludes with an analysis of regional readiness to report and the implications for the implementation, monitoring and evaluation of the C-HRD 2030 S. Annexes A-D are offered to provide additional details on the data.
METHODOLOGY
The preparatory work for the survey entailed a collaborative effort to identify and give meaning to priority KPIs for Phase 1 of the C-HRD-2030 S. The main actors were the representative from CDB, staff of the CARICOM Secretariat (CCS), the consultant for the Baseline Survey, and the RNPO. The group took guidance from the C-HRD 2030 S, UNESCO’s Education Indicators Technical Guidelines (UNESCO, 2009) for SDG 4 and SDG 8 (goals and targets), and other supporting documents. Following the finalisation of a SAM instrument that was designed to collect gender-sensitive information, the planners collected and reported the data from their Member States over a nine-month period ending June 2019. Numerous opportunities were provided to Member States to re-submit, clarify and validate the data submitted. The consultant was charged with coordinating data collection, analysis, and report preparation.
Following a review of the results, the above-mentioned actors determined that the SAM should be revised by shortening the list of indicators, revisiting definitions, and including provisions for qualitative data. This decision was taken, given the peculiarities of education systems in the Region and the variations in the capacity of the Member States to collect and report on the data 4.
4 All averages in the report are calculated as geometric means.

30 READINESS FOR ACTION: THE BASELINE AND SITUATIONAL ANALYSIS REPORT FOR PHASE I OF THE CARICOM HRD 2030 STRATEGY
BASELINE INFORMATION FOR ALL CARICOM MEMBER STATES
5 It is worth noting that the Basic Education system in Suriname is structured differently from that of most Member States. Students commence primary education at 6 years and transition between 11 years and 12 years. Further, lower secondary school is comprised of years 1-4 with examinations at the end of year 4. Meanwhile, upper secondary is comprised of five streams: academic, pre-academic, tech-nical, administrative/economics, and the pedagogical institute that prepares teachers for the primary system. The duration of these upper secondary programmes varies according to option. For example, the academic section requires 3 years for completion while the pre-academic can be completed in 2 years. In contrast to these, each of the other three sections requires 4 years, and Suriname pursues Science, Technology, Reading, Engineering and Mathematics as opposed to Science, Technology, Engineering and Mathematics as is being implemented in other Member States.
This section is organised according to the three sectors of the education system – BE, SLL and TE. Data was received from fifteen Member States and two Associate Member States, with a total submission from seventeen countries. No data was received for Anguilla, Bermuda and The Cayman Islands.
SECTION 1 – Basic Education 5
The C-HRD 2030 S defines BE as those education related activities that are undertaken during organised learning of students at pre-primary or early childhood education and schooling at both the primary and secondary levels. This section addresses the submissions of Member States for BE.
1. Participation Rate in organised learning of children, one year before the official primary entry, by sex (SCG4.2.2)
This indicator measures children’s exposure to organised learning activities in the year prior to the start of primary school. The age will vary by country depending on the official age for entry to primary education.
The responses to the SAM suggest that sixteen Member States are positioned to provide data on the aggregate baseline value for this indicator, while fifteen can report on the related values for males and females. The aggregate baseline values ranged from 30.04 % in St Lucia to 97 % in St Kitts and Nevis with an average of 62.79%. The average for males and females were 59.67 % and 58.76% respectively.
Belize, Guyana and Suriname provided disaggregated data on rural and urban residents. Baseline values for urban residents ranged from 62.7 % in Guyana to 99% in Suriname and averaged 79.32%. While the figures are lower for rural residents, the ranking of the three Member States was the same. The values ranged from 55% to 88.3% and averaged 67.24%.

0
10
20
30
40
50
60
70
80
90
100
110
Turk &
Caico
s
Surina
meSV
G
St. Lu
cia
St. Ki
tts
Montser
rat
Jamaic
aHait
i
Grenada
Dominic
aBVI
Belize
Barba
dos
Baham
as
Antigua
Chart 1: Participation Rate in organised learning of children one year before the official primary entry age by sex
Baseline Value Males
% P
artic
ipat
ion
Baseline Value Females Aggregated Baseline Value
READINESS FOR ACTION: THE BASELINE AND SITUATIONAL ANALYSIS REPORT FOR PHASE I OF THE CARICOM HRD 2030 STRATEGY 31
Jamaica submitted the aggregate value for this indicator, and Trinidad and Tobago reported that the national population of children who are 12 months below the official age for enrolment in the primary level was unavailable. However, Trinidad and Tobago noted that registration for this group takes place at institutions recognised as Early Childhood Education (ECE) providers, as well as at some primary schools. Further, the report explained that for 2016/17, enrolment at Government, Government Assisted, SERVOL, and ECE centres totalled 5,065 with females accounting for 49.26%. The report also acknowledged that the aforementioned enrolment figure does not include data from approximately 600 private ECE centres and that the population of children aged 4 years was unavailable at the time of reporting. The results are summarised in Chart 1.

0
10
20
30
40
50
60
70
80
90
100
110
Turk &
Caico
s
Surina
meSV
G
St. Lu
cia
St. Ki
tts
Montser
rat
Jamaic
aHait
i
Grenada
Dominic
aBVI
Belize
Barba
dos
Baham
as
Antigua
Baseline Value Males
% E
nrol
lmen
t
Baseline Value Females Aggregated Baseline Value
Chart 2: Net Enrollment Rate (NER) at Primary level
32 READINESS FOR ACTION: THE BASELINE AND SITUATIONAL ANALYSIS REPORT FOR PHASE I OF THE CARICOM HRD 2030 STRATEGY
2. Net Enrolment Rate (NER) at primary level
*The NER is the enrolment of the official age group for a given level of education expressed as a percentage of the corresponding population. Its purpose is to show the extent of coverage in a given level of education of children and youth belonging to the official age group corresponding to the given level of education.
Fifteen respondents to the SAM provided data on the baseline values for males and females and the aggregate baseline values. The aggregate values ranged from 67.1% in the BVI to a reported 104% in the Turks and Caicos Islands. The average for the aggregate baseline values was cal-culated as 88.79% while those for males and females were 88.71 % and 88.68%, respectively.
Belize, Guyana and Suriname disaggregated their data to address the variables that represent urban 6 and rural residents. The values for urban residents ranged from 88.1% in Belize to 91.2 % in Suriname and averaged 89.76%. In the case of rural residents, Guyana reported its NER at primary as 100% while the figure for Belize was 77.1 %. The average baseline values for urban residents and rural residents in respect of the three Member States were 89.76% and 88.20%, respectively. In the case of Trinidad and Tobago the report noted the primary school enrolment of children aged 5-11 years as 112,534 (98%) out of a total primary enrolment of 113,898.
6 For the purposes of this situational analysis, rural and urban areas are defined as communities that are so categorised by the Member State. However, it must be noted that some members of the RNPO have opined that the urban/rural designation does not apply to their small island states.
0
10
20
30
40
50
60
70
80
90
100
110
Turk &
Caico
s
Surina
meSV
G
St. Lu
cia
St. Ki
tts
Montser
rat
Jamaic
aHait
i
Grenada
Guyana
Dominic
aBVI
Belize
Barba
dos
Baham
as
Antigua
Baseline Value Males
% E
nrol
lmen
t
Baseline Value Females Aggregated Baseline Value
Chart 3: Net Enrollment Rate (NER) at Secondary level
READINESS FOR ACTION: THE BASELINE AND SITUATIONAL ANALYSIS REPORT FOR PHASE I OF THE CARICOM HRD 2030 STRATEGY 33
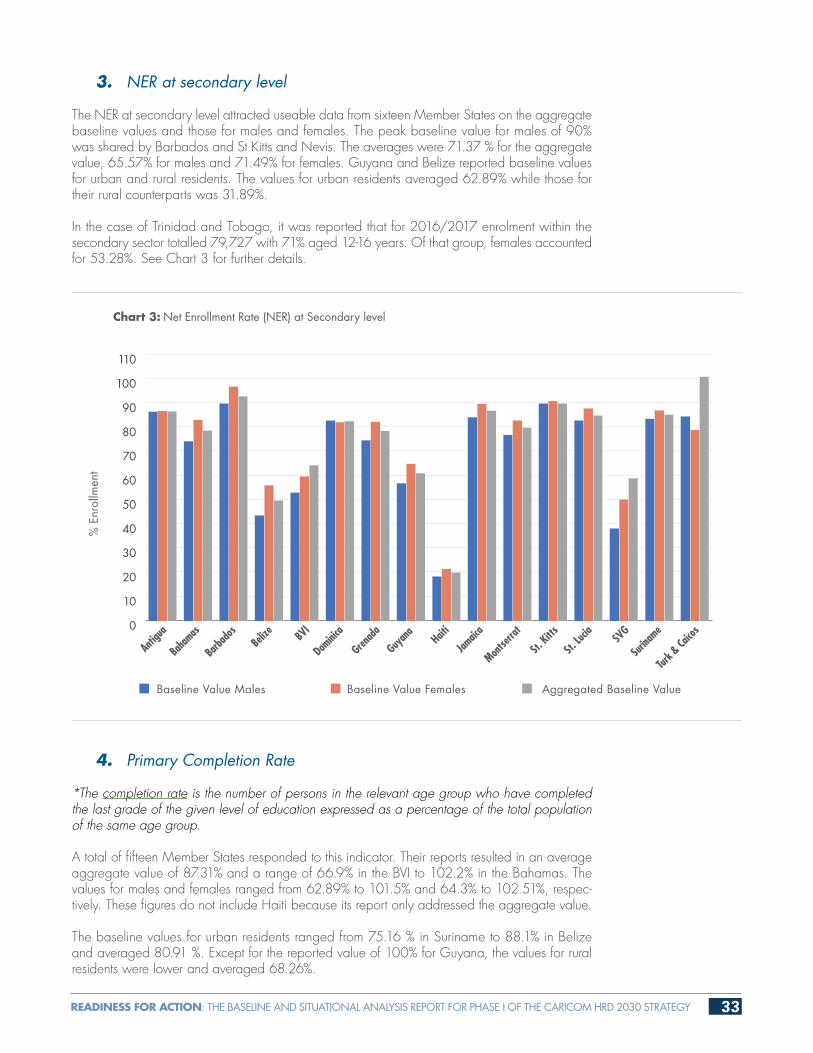
3. NER at secondary level
The NER at secondary level attracted useable data from sixteen Member States on the aggregate baseline values and those for males and females. The peak baseline value for males of 90% was shared by Barbados and St Kitts and Nevis. The averages were 71.37 % for the aggregate value, 65.57% for males and 71.49% for females. Guyana and Belize reported baseline values for urban and rural residents. The values for urban residents averaged 62.89% while those for their rural counterparts was 31.89%.
In the case of Trinidad and Tobago, it was reported that for 2016/2017 enrolment within the secondary sector totalled 79,727 with 71% aged 12-16 years. Of that group, females accounted for 53.28%. See Chart 3 for further details.
4. Primary Completion Rate
*The completion rate is the number of persons in the relevant age group who have completed the last grade of the given level of education expressed as a percentage of the total population of the same age group.
A total of fifteen Member States responded to this indicator. Their reports resulted in an average aggregate value of 87.31% and a range of 66.9% in the BVI to 102.2% in the Bahamas. The values for males and females ranged from 62.89% to 101.5% and 64.3% to 102.51%, respec-tively. These figures do not include Haiti because its report only addressed the aggregate value.
The baseline values for urban residents ranged from 75.16 % in Suriname to 88.1% in Belize and averaged 80.91 %. Except for the reported value of 100% for Guyana, the values for rural residents were lower and averaged 68.26%.

Turk &
Caico
s
Surina
meSV
G
St. Lu
cia
St. Ki
tts
Montser
rat
Jamaic
aHait
i
Grenada
Guyana
Dominic
aBVI
Belize
Barba
dos
Baham
as
Antigua
Baseline Value Males
% S
tude
nts
Baseline Value Females Aggregated Baseline Value
Chart 4: Primary Completion Rate
0
10
20
30
40
50
60
70
80
90
100
110
120
130
140
34 READINESS FOR ACTION: THE BASELINE AND SITUATIONAL ANALYSIS REPORT FOR PHASE I OF THE CARICOM HRD 2030 STRATEGY
Grenada reported that data was unavailable. Meanwhile, Trinidad and Tobago responded to the indicator by reporting that 96% of the students who attempted the Secondary Entrance Examinations in 2017 were placed in secondary schools. The results are summarised in Chart 4.
5. Primary Survival Rate
*The survival rate is the percentage of a cohort of students enrolled in the first grade of a given level or cycle of education in a given school year who are expected to reach successive grades, regardless of repetition. It is calculated by dividing the total number of pupils belonging to a school cohort who reached each successive grade of the specified level of education by the number of pupils in the school cohort i.e. those originally enrolled in the first grade and multiplying the result by 100. The survival rate is calculated based on the reconstructed cohort method, which uses data on enrolment and repeaters for two consecutive years.
The submissions from fifteen Member States resulted in an average of 89.14% for the aggregate value and a range of 71% in the case of the BVI, to 99.5% in the Turks and Caicos Islands. The baseline values for males averaged 88.54% with a range of 67% in the BVI to 100% in the Turks and Caicos Islands. Despite fluctuations in baseline values for females, these averaged 89.92% with a range of 74% in BVI to 100% in the Turks and Caicos Islands.
Information on urban and rural residents was only reported by Guyana and Turks and Caicos Islands. The latter reported 100% for each category while Guyana reported 92% for urban residents and 93% for their rural counterparts.

Turk &
Caico
s
Surina
meSV
G
St. Lu
cia
St. Ki
tts
Montser
rat
Jamaic
aHait
i
Grenada
Guyana
Dominic
aBVI
Belize
Baham
as
Baseline Value Males 0 N/A
% S
tude
nts
Baseline Value Females 0 N/A Aggregated Baseline Value 0 N/A
Chart 5: Primary survival rate
0
10
20
30
40
50
60
70
80
90
100
110
READINESS FOR ACTION: THE BASELINE AND SITUATIONAL ANALYSIS REPORT FOR PHASE I OF THE CARICOM HRD 2030 STRATEGY 35
Barbados reported data for performance of students at the Barbados Secondary School Entrance Examination (BSSEE) for 2017 and showed that the aggregate success rate was 87%, with females accounting for 89% and males 86%.
The results for responses that were compliant with the requirements for the indicator are summa-rised in Chart 5.
6. Secondary Completion Rate
Fifteen respondents reported aggregate baseline values and values for males and females. These resulted in an aggregate baseline value that ranged from 37.29% in Haiti to 111% in Dominica and an average of 71% for those fifteen Member States. Generally, the values for females sur-passed those for males with a range of 38.5% in Haiti to 121% in Dominica and an average of 76.25%. The values for males ranged from 30.2% in Haiti to 102% in Dominica and averaged 62.36%. With regard to urban and rural residents, data was submitted by Belize and Guyana. The averages were 51.72% for urban residents and 28.78% for those in rural communities. The baseline value for urban residents as reported by Belize was more than 35% above the average and more than twice that for Guyana. These results are summarised in Chart 6 below.

Turk &
Caico
sSV
G
St. Lu
cia
St. Ki
tts
Montser
rat
Jamaic
aHait
i
Grenada
Guyana
Dominic
aBVI
Belize
Baham
as
Antigua
Baseline Value Males
% C
ompl
etio
n
Baseline Value Females Aggregated Baseline Value
Chart 6: Secondary Completion Rate
0
10
20
30
40
50
60
70
80
90
100
110
120
130
36 READINESS FOR ACTION: THE BASELINE AND SITUATIONAL ANALYSIS REPORT FOR PHASE I OF THE CARICOM HRD 2030 STRATEGY
The report from Trinidad and Tobago summarised the attempts and attainment levels for five or more subjects, including Mathematics and English, in the 2017 Caribbean Secondary Education Certificate (CSEC) Examinations. This is included below as Table 1.
TABLE 1: Number of students in Trinidad and Tobago who attempted 5 or more subjects including Mathematics and English in the 2017 Caribbean Secondary Education Certificate (CSEC) Examinations
Location
Number of Secondary School students who at-tained 5 or more passes including Mathematics and English
Number of Secondary School students who attempted 5 or more subjects including Mathematics & English
Proportion of Secondary School students who attained 5 or more subjects including Mathematics and English
Male Female Total Male Female Total Male Female Total
URBAN 2460 3520 5980 4901 5983 10884 50% 59% 55%
RURAL 136 214 350 583 751 1334 23% 28% 26%
TRINIDAD AND TOBAGO 2596 3734 6330 5484 6734 12218 47% 55% 52%
Source: Division of Educational Research and Evaluation, Ministry of Education

0
10
20
30
40
50
60
70
80
90
100
110
Turk &
Caico
s
Surina
meSV
G
St. Lu
cia
St. Ki
tts
Montser
rat
Jamaic
aHait
i
Grenada
Guyana
Dominic
aBVI
Belize
Baham
as
Chart 7: Secondary Survival Rate
Baseline Value Males Baseline Value Females Aggregated Baseline Value
READINESS FOR ACTION: THE BASELINE AND SITUATIONAL ANALYSIS REPORT FOR PHASE I OF THE CARICOM HRD 2030 STRATEGY 37
7. Secondary Survival Rate
The average aggregate data was 76.32% with a range of 41% in Guyana to 100 % in the Turks and Caicos Islands. The average baseline values for females was 78.04% while values for individual Member States ranged from 52% in Guyana to 100% in the Turks and Caicos Islands. Baseline values for males were slightly lower with a range of 32% in Guyana to 100 % in the Turks and Caicos Islands and an average of 69.28%. The results are summarised in Chart 7.
8. Gender Parity Index (SDG4.5)
The Gender Parity Index (GPI) is used to measure the relative access to education of males and females and in its simplest form, it is calculated as the quotient of the number of females by the number of males enrolled in each stage of education. The results indicate that the GPI for access in the early childhood subsector ranges from 0.57 to 1.21 and average 1 or parity at the regional level. In the primary system the range is narrower, meaning there is less diversity among Member States, and again the regional average of 1 suggest parity at that level. However, the situation is changed in favour of girls at the secondary level and the regional average is 1.07. The results are summarised in Table 2.

38 READINESS FOR ACTION: THE BASELINE AND SITUATIONAL ANALYSIS REPORT FOR PHASE I OF THE CARICOM HRD 2030 STRATEGY
TAB
LE 2
: G
ende
r Pa
rity
Indi
ces
for
Mem
ber
Stat
es
A
&B
BA
HB/
DO
SBEL
BVI
DO
MG
ND
GU
YH
AI
JAM
MSR
SKN
SLU
SVG
SUR
TCI
T &
T
Parti
cipa
tion
rate
in o
rgan
ised
lear
ning
of c
hild
ren
one
year
be
fore
the
offic
ial p
rimar
y en
try
age
by s
ex
1.04
1.06
1.03
1.03
1.21
0.98
0.99
0.98
1.06
N/
A0.
570.
971.
060.
990.
951.
16N
/A
Net
Enr
olm
ent a
t prim
ary
1.02
1.06
1.02
0.96
0.99
0.99
N/
A0.
981.
011
0.95
0.99
1.02
1.04
10.
93N
/A
Net
Enr
olm
ent a
t sec
onda
ry1
1.12
1.08
1.15
1.13
0.99
1.13
1.14
1.17
1.07
1.08
1.01
1.06
1.04
N/
A0.
93N
/A
READINESS FOR ACTION: THE BASELINE AND SITUATIONAL ANALYSIS REPORT FOR PHASE I OF THE CARICOM HRD 2030 STRATEGY 39
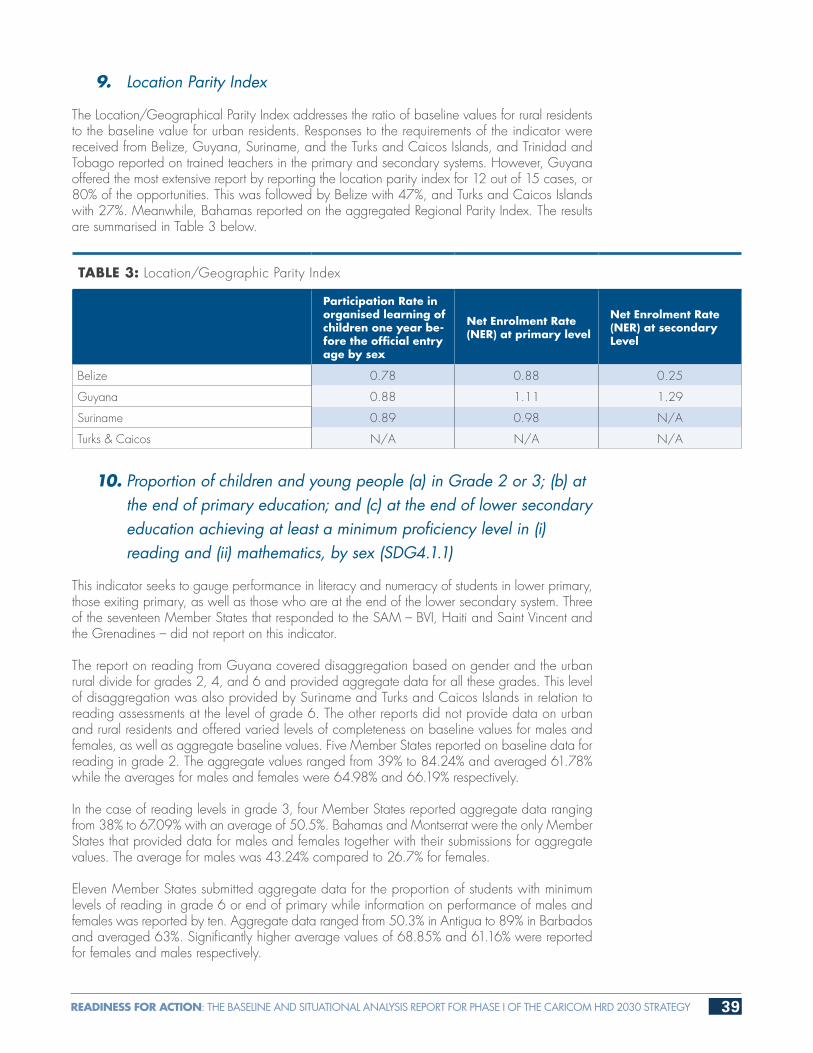
9. Location Parity Index
The Location/Geographical Parity Index addresses the ratio of baseline values for rural residents to the baseline value for urban residents. Responses to the requirements of the indicator were received from Belize, Guyana, Suriname, and the Turks and Caicos Islands, and Trinidad and Tobago reported on trained teachers in the primary and secondary systems. However, Guyana offered the most extensive report by reporting the location parity index for 12 out of 15 cases, or 80% of the opportunities. This was followed by Belize with 47%, and Turks and Caicos Islands with 27%. Meanwhile, Bahamas reported on the aggregated Regional Parity Index. The results are summarised in Table 3 below.
10. Proportion of children and young people (a) in Grade 2 or 3; (b) at the end of primary education; and (c) at the end of lower secondary education achieving at least a minimum proficiency level in (i) reading and (ii) mathematics, by sex (SDG4.1.1)
This indicator seeks to gauge performance in literacy and numeracy of students in lower primary, those exiting primary, as well as those who are at the end of the lower secondary system. Three of the seventeen Member States that responded to the SAM – BVI, Haiti and Saint Vincent and the Grenadines – did not report on this indicator.
The report on reading from Guyana covered disaggregation based on gender and the urban rural divide for grades 2, 4, and 6 and provided aggregate data for all these grades. This level of disaggregation was also provided by Suriname and Turks and Caicos Islands in relation to reading assessments at the level of grade 6. The other reports did not provide data on urban and rural residents and offered varied levels of completeness on baseline values for males and females, as well as aggregate baseline values. Five Member States reported on baseline data for reading in grade 2. The aggregate values ranged from 39% to 84.24% and averaged 61.78% while the averages for males and females were 64.98% and 66.19% respectively.
In the case of reading levels in grade 3, four Member States reported aggregate data ranging from 38% to 67.09% with an average of 50.5%. Bahamas and Montserrat were the only Member States that provided data for males and females together with their submissions for aggregate values. The average for males was 43.24% compared to 26.7% for females.
Eleven Member States submitted aggregate data for the proportion of students with minimum levels of reading in grade 6 or end of primary while information on performance of males and females was reported by ten. Aggregate data ranged from 50.3% in Antigua to 89% in Barbados and averaged 63%. Significantly higher average values of 68.85% and 61.16% were reported for females and males respectively.
TABLE 3: Location/Geographic Parity Index
Participation Rate in organised learning of children one year be-fore the official entry age by sex
Net Enrolment Rate (NER) at primary level
Net Enrolment Rate (NER) at secondary Level
Belize 0.78 0.88 0.25
Guyana 0.88 1.11 1.29
Suriname 0.89 0.98 N/A
Turks & Caicos N/A N/A N/A

Turk &
Caico
s
Surina
me
St. Lu
cia
St. Ki
tts
Montser
rat
Jamaic
a
Guyana
Dominic
a
GrenadaBe
lize
Barba
dos
Baham
as
Antigua
Chart 8a: Proportion of students in (a) grades 2, 3 & 4 and (b) at the end of primary acheiving at least a minimum proficiency in reading and mathematics
Grade 2 Assessment Literacy
% S
tude
nts
0 Numeracy Grade 3 Assessment Literacy
Grade 4 Assessment Literacy 0 Numeracy
0 Numeracy
0 NumeracyGrade 6 Assessment Literacy
0
10
20
30
40
50
60
70
80
90
100
40 READINESS FOR ACTION: THE BASELINE AND SITUATIONAL ANALYSIS REPORT FOR PHASE I OF THE CARICOM HRD 2030 STRATEGY
The requirements for mathematics appeared to have posed even greater challenges for Member States. Three submitted incomplete reports for grade 2 and in the case of grade 3 there were four reports with two limited to aggregate values. Mean aggregate values were 58.49% in grade 2 and 55.52% in grade 3 with girls outperforming boys by an average of ten points. But in the case of grade 6, eight Member States reported on aggregate baseline data while seven submitted data on values for males and females. The Turks and Caicos Islands was the only country to report on performance of urban and rural residents. The average aggregate baseline value was 54.46% and that for girls was 64.08%. Boys registered an average of 52.10% or twelve points below the girls.
The reports for reading and mathematics are summarised in Charts 8a, 8b, 8c and Table 4. The latter summarises the useable data that Member States submitted for the lower secondary level. It illustrates that Guyana reported on reading and Suriname reported on mathematics.

Chart 8b: Proportion of students by sex (a) in grades 2, 3 & 4 and (b) at the end of primary acheiving at least a minimum proficiency in reading
% o
f Stu
dent
s
Grade 2 Assessment M0 FGrade 3 Assessment M
Grade 4 Assessment M0 F
0 F
0 FGrade 6 Assessment M
0
10
20
30
40
50
60
70
80
90
100
Antig
ua
Baha
mas
Barb
ados
Dom
inica
Gren
ada
Guya
na
Jam
aica
Mon
tser
rat
St. K
itts
and
Nevi
s
St. L
ucia
Surin
ame
Turk
&
Caico
s
0 0 0 54 78.2 39 0 64 0 46.9 0 0
0 0 0 69 90.28 39 0 76 0 68.8 0 0
0 62.34 0 0 0 0 0 30 0 0 0 0
0 71.92 0 0 0 0 0 45 0 0 0 0
0 0 0 70 54.4 27 0 50 44 55.1 0 0
0 0 0 85.6 77 41 0 79 55 71.6 0 0
40.67 57.83 85 70.2 57.21 47 78 83 52 0 23.67 76.7
60 73.37 92 88.7 82.63 67 90.9 84 63 0 25.35 89.7
READINESS FOR ACTION: THE BASELINE AND SITUATIONAL ANALYSIS REPORT FOR PHASE I OF THE CARICOM HRD 2030 STRATEGY 41
Finally, Trinidad and Tobago indicated that assessment practices in that Member State up to 2016 include a National Test for grade 2 (standard 1) and grade 4 (standard 3) as well as the National Certificate of Secondary Education at the level of form 3. Data for Standard 1(Grade 2) students in National Test 2016 indicated that 46% of students obtained the national literacy standard and 56% achieved the numeracy standard.
The data on the National Certificate of Secondary Education for 2016/17 indicated that 37% of males and 60% of females achieved the national literacy standard with an aggregate of 49% overall achieving this standard. With respect to numeracy 35% of males and 51% of females achieved the standard with an aggregate of 43% overall achieving this standard.

Chart 8c: Proportion of students by sex in (a) grades 2, 3 & 4 and (b) at the end of primary acheiving at least a minimum level of proficiency in mathematics
% o
f Stu
dent
s
0
10
20
30
40
50
60
70
80
90
100
Grade 2 Assessment M0 FGrade 3 Assessment M
Grade 4 Assessment M0 F
0 F
0 FGrade 6 Assessment M
Antig
ua
Baha
mas
Barb
ados
Dom
inica
Gren
ada
Jam
aica
Mon
tser
rat
St. K
itts
St. L
ucia
Turk
&
Caico
s
0 0 0 32 67.67 0 0 0 51.2 0
0 0 0 37 78.64 0 0 0 60.7 0
0 56.86 0 0 0 0 52 0 0 0
0 64.59 0 0 0 0 67 0 0 0
0 0 0 31.9 31.9 0 0 65 50.4 0
0 0 0 33.1 42.7 0 0 58 60.8 0
47.3 29.41 71 64.3 60.7 60.2 0 52 0 51.9
59.67 37.71 79 79.5 75.68 72.7 0 57 0 72.8
42 READINESS FOR ACTION: THE BASELINE AND SITUATIONAL ANALYSIS REPORT FOR PHASE I OF THE CARICOM HRD 2030 STRATEGY
TABLE 4: Proportion of children in lower secondary achieving at least minimum proficiency level in reading and mathematics
Proportion of children in lower secondary achieving at least minimum proficiency in reading
Proportion of children in lower secondary achieving at least minimum proficiency in mathematics
Member State
Baseline Value Males
Baseline Value Females
Baseline Value Urban Residents
Baseline Value Rural Residents
Aggre-gated Baseline Value
Baseline Value Males
Baseline Value Females
Baseline Value Urban Residents
Baseline Value Rural Residents
Aggre-gated Baseline Value
Guyana 31 45 43 11 38 N/A N/A N/A N/A N/A
Suriname N/A N/A N/A N/A N/A 74.01 62.28 68.5 40.22 66.72

Turk &
Caico
sTrin
idad
& Tobag
oSur
iname
St. Lu
cia SVG
St. Ki
tts
Montser
rat
Jamaic
aHait
i
Dominic
a
GrenadaBe
lize BVI
Barba
dos
Baham
as
Antigua
0
10
20
30
40
50
60
70
80
90
100
110
Chart 9a: Percentage of trained teachers (a) pre-primary/ECE, (b) primary and (c) secondary
ECE
% T
rain
ed T
each
ers
Primary Secondary
0 0 0 0 0
READINESS FOR ACTION: THE BASELINE AND SITUATIONAL ANALYSIS REPORT FOR PHASE I OF THE CARICOM HRD 2030 STRATEGY 43
11. Percentage of trained teachers (a) pre-primary/ECE, (b) primary and (c) secondary (SDG4.c.1)
The indicator seeks to identify the number of teachers that are classified as trained at the level of each sector; namely early childhood, primary, and secondary and to have these disaggregated according to males and females. Where possible respondents were expected to disaggregate the numbers to demonstrate the number of trained teachers in urban communities compared with those in rural communities.
There were significant variations in the degree of completeness of individual reports. Fifteen Member States provided data on the aggregate values for teachers in the primary and secondary sectors and twelve reported on the pre-primary sector. The average aggregate values were 62.90% for pre-primary, 80.66% for the primary and 67.77% for the secondary sector. Although some countries operate an all-female staff in the ECE sector, the average value of 60.37% for trained male teachers compared favourably with 66.47% for female teachers.
In the primary sector trained female teachers averaged 78.74% compared with 66.01% in the secondary sector. The scores for individual Member States ranged from 52.61% in Antigua to 91.6% in the Turks and Caicos Islands. The figures for their male counterparts were 43.15% among primary teachers with a range of 6% in St Kitts to 100% in Turks and Caicos Islands and 57.60 % at the secondary level where the range is 16% in St Kitts to 91.5% in Turks and Caicos Islands.
The results are summarised in Charts 9a and 9b.

Chart 9b: Distribution of trained teachers in Belize, Guyana and Trinidad & Tobago according to urban and rural instittutions
% o
f Tea
cher
s C
lass
ified
as
Trai
ned
ECE Primary Secondary
Belize Guyana Trinidad
0
10
20
30
40
50
60
70
80
90
100
110
RURURU
44 READINESS FOR ACTION: THE BASELINE AND SITUATIONAL ANALYSIS REPORT FOR PHASE I OF THE CARICOM HRD 2030 STRATEGY
12. Proportion of secondary school students who attain at least five (5) subject, including Mathematics and English, or other official language.
This indicator seeks to measure the number of secondary students certified as attaining passing grades in five or more subjects including the official language and mathematics, expressed as a percentage of the number of students participating in the recognised exit examinations. For Member States taking CSEC, pass grades are Grades 1, II, & III and English A applies. In terms of official language French and Dutch apply to Haiti and Suriname, respectively.
The indicator sought to secure baseline information on the performance of secondary students at the officially recognised exit examinations. These are the Caribbean Secondary Education Certificate offered by the Caribbean Examinations Council (CXC), the Bahamas General Certificate of Secondary Education, and the corresponding examinations in Haiti and Suriname. Fifteen Member States submitted responses on the aggregate baseline value with a range of 12% in Saint Kitts and Nevis to 87.59% in Haiti and an average of 36.85%.
Nine Member States were able to disaggregate their data to show the performance of males and females while Guyana reported complete disaggregation by the addition of performance in urban and rural communities. Belize and Turks and Caicos Islands were only able to report on aggregated values. The average performance of males among the respondents was 29.52% while that for females was 34.36%. There were no reports from Barbados, BVI and Jamaica. The results are summarised below.

Turk &
Caico
sTrin
idad
Surina
me
St. Lu
cia SVG
St. Ki
tts
Montser
rat
Jamaic
aHait
i
Dominic
a
Grenada
Guyana
Belize
Baham
as
Antigua
Chart 10: Proportion of secondary school students who attain at least five subjects including Mathematics and English or other official language
Baseline Values Males
% o
f Stu
dent
s
Baseline Values Females Aggregated Values Values
0
10
20
30
40
50
60
70
80
90
100
READINESS FOR ACTION: THE BASELINE AND SITUATIONAL ANALYSIS REPORT FOR PHASE I OF THE CARICOM HRD 2030 STRATEGY 45
13. Proportion of secondary school students who attain two (2) or more STEM subjects
This indicator sought to gauge the number of students attaining pass grades in two or more sub-jects that are classified as Science, Technology, Engineering and Mathematics (STEM); expressed as a percentage of the number of students participating in the STEM examinations.7
Data was received from eleven Member States or 65% of the respondents. Eight Member States were able to disaggregate their data based on sex and three were only able to report on the aggregate baseline value. There were no reports on urban and rural values.
The aggregate values for Member States range from 27.3% in Antigua and Barbuda to 71.4 % in Saint Lucia and averaged 49.24%. The baseline values for females ranged from 22.6% to 76% and averaged 52.39% compared to a range of 33.3% to 74.6% for males and a slightly lower average of 49.51%. The results are summarised in Chart 11 and Table 5.
7 It should be noted that Suriname uses Science Technology Reading Engineering and Mathematics as opposed to Science, Technology, Engineering and Mathematics

Turk &
Caico
sTrin
idad
& Tobag
oSur
iname
St. Lu
cia SVG
St. Ki
tts
Montser
rat
Jamaic
a
Dominic
a
Guyana
Belize
Antigua
0
10
20
30
40
50
60
70
80
Chart 11: Proportion of secondary school students who attain two or more STEM subjects
Baseline Values Males
% o
f Stu
dent
s
Baseline Values Females Aggregated Values Values
46 READINESS FOR ACTION: THE BASELINE AND SITUATIONAL ANALYSIS REPORT FOR PHASE I OF THE CARICOM HRD 2030 STRATEGY
14. Percentage of secondary school students in fifth form or equivalent, participating in apprenticeships and school-to-work programmes
The intent of this indicator was to measure the percentage of students enrolled in the last grade of the secondary system who are participating in apprenticeships and other school-to-work programmes.
The BVI, Guyana, Jamaica, Saint Kitts and Nevis, Suriname, and Turks and Caicos Islands responded to the requirements for this indicator. But BVI, Jamaica, and Turks and Caicos Islands were the only countries that reported on all variables. Guyana omitted information on males and females while Saint Kitts and Suriname only provided the aggregate values. The average aggre-gate value for the respondents was calculated as 52.68 % with a range of 22.6% in Guyana to 100% in both BVI and Jamaica. Baseline values for males averaged 66.94% and ranged from 30% to 100% compared to an average of 71.14 % and a range of 36% to 100% for females. The results are summarised in Chart 12.
TABLE 5: Comparison of values for males and females in STEM
Males Females Aggregate
Mean 49.51 52.39 49.24
Median 52.17 60.96 53.19
Range 33.3 % -74.6% 22.6 -76 36-71.4

Chart 12: Percentage of secondary school students up to fifth form or equivalent participating in apprenticeships and school-to-work programmes
% o
f Stu
dent
s
Baseline Values Males Baseline Values Females Aggregated Values Values
0
10
20
30
40
50
60
70
80
90
100
110
Turks & CaicosSurinameSt. KittsJamaicaGuyanaBVI
READINESS FOR ACTION: THE BASELINE AND SITUATIONAL ANALYSIS REPORT FOR PHASE I OF THE CARICOM HRD 2030 STRATEGY 47
15. Percentage of students in the final year secondary school, exposed to career guidance opportunities (career education)
This indicator was aimed at measuring the extent to which the secondary system offers career education that assists students to make and implement informed educational and occupational choices on transition to a future path by the time they get into the final year. Member states were advised to determine the number of final-year secondary students who are exposed to these career education programmes and to express this as a percentage of those enrolled in the final year of a secondary programme.
The indicator attracted reports on aggregate values from eleven Member States with a range of 90% in Antigua to 100 % in each of nine countries and an average of 98.9%. Baseline values for males and females were submitted by ten Member States and were both consistently high. The average baseline value for males and females were equally high. This was the only indicator for which there was a mode of 100% for all variables. The results are summarised in Chart 13.

Turk &
Caico
sSt.
Lucia
St. Ki
tts
Montser
rat
Jamaic
a
Dominic
a
GrenadaBV
I
Barba
dos
Baham
as
Antigua
Chart 13: Percentage of students in the final year secondary exposed to career guidance opportunities
Baseline Values Males
% o
f Stu
dent
s
Baseline Values Females Aggregated Baseline Value
0
10
20
30
40
50
60
70
80
90
100
110
48 READINESS FOR ACTION: THE BASELINE AND SITUATIONAL ANALYSIS REPORT FOR PHASE I OF THE CARICOM HRD 2030 STRATEGY
SECTION 2 – Skills for Lifelong Learning
This section addresses the responses of Member States to the indicators that are listed under SLL.
16. Existence of second-chance learning or alternative learning programmes for out-of-school youth and adults (2.6HRD)
This indicator was used to secure data on education programmes specifically targeted at individ-uals who, for a variety of reasons, never attended school; left school before completion of the programme; or never completed that level, but wish to enter an education programme or occupa-tion for which they are not yet qualified. The respondents were Belize, BVI, Bahamas, Dominica, Saint Kitts and Nevis, Saint Lucia, Suriname, Trinidad and Tobago, and Turks and Caicos Islands.
The Turks and Caicos Islands confirmed the adoption of the relevant policy, but advised that implementation of programmes has not been started. However, an initiative that is supported by the Ministry of Education is being operated at the prison. Further, there are support programmes for young persons who are in danger of having a premature end to their education. In addition, school-age girls who become pregnant are allowed to resume classes after giving birth. Based on these the Turks and Caicos Islands was listed as a respondent to the requirements of the indicator.
Belize reported two second-chance programmes. One is offered by the Gateway Youth Centre, which falls under the auspices of the Ministry of Education, Youth, Sports and Culture. It provides opportunities for youth 13-19 years to develop their physical, social and cognitive abilities, and experience achievement, leadership, enjoyment, friendship and recognition. The programme is one-two years and focuses on basic reading, comprehension, numeracy, sports and arts, and provides support for students who are interested in completion of a secondary education diploma or vocational training.

READINESS FOR ACTION: THE BASELINE AND SITUATIONAL ANALYSIS REPORT FOR PHASE I OF THE CARICOM HRD 2030 STRATEGY 49
The second programme also falls under the Ministry of Education, but is delivered through the Frank A. Lizama OBE Training Centre. It is a 10-month, skills-based experience that provides opportunities for youth to develop their physical, social, emotional and cognitive abilities through training in such areas as barbering, computer repair, and crafts, along with academic support courses in literacy and numeracy.
In the case of BVI, the current opportunity is a three-year Alternative Secondary Programme for which a Secondary Diploma is the exit qualification. Meanwhile, Dominica reported the existence of the Youth Skills Training Programme, which is managed by the Youth Division, and other programmes that are operated by the NGO/CBO community. Two such operators are the Social Centre and the Centre where Adolescents Learn to Love and Serve (CALLS). All programmes offer skills training and personal development. Together, these programmes cater for adolescents 16-35 years who are unemployed or underemployed. The general objective of these second-chance opportunities is to enhance preparedness for the job market and for self-employment.
The Bahamas cited its free Fresh Start Programme as the opportunity for second-chance learning. The initiative provides young prospective professionals, aged 16-25 years, with the resources, information and tools needed for successful employment and job retention. The 16-week programme comprises job readiness and personal development, skills development, and internship. The job readiness and personal development training is conducted in a classroom environment, but the internship component is designed to give trainees real-time work experience and is offered in partnership with corporate Bahamas. The skills development component is conducted over a 10-week period and is managed by the Bahamas Technical and Vocational Institute, University of Bahamas, and the Ministry of Tourism.
Saint Kitts and Nevis operates a government-supported National Skills Training Programme (NSTP) that focuses on a wide range of youth who are 17 years and older. The duration of the programmes range from 6 weeks to 6 months and modules are offered in a flexible mode using a hands-on approach to occupational areas. Training is cost free and offered as part of the government’s initiative for national development. Graduates are awarded an NSTP certificate upon successful completion.
Suriname reported that youth who are at least 16 years and who have not completed secondary education are given the opportunity to enrol with the Stichting Arbeids Mobilisatie en Ontwikkeling (SAO) or Labour Mobilisation and Development Foundation, which is operated by the Ministry of Labour. This institution offers theoretical and practical courses that are guided by international standards and based on local labour market demands. The programme provides for internships, and trainees are taught social skills. The objective is to make youth economically resilient. In addition to SAO, there are programmes that are managed by well-respected NGOs. One such example is the NGO known as is RUMAS. This organisation caters for youth in the age group 12 to 25 years who have been excluded from the education system because of social and financial challenges, and seeks to make beneficiaries more productive citizens.
Like Suriname, Saint Lucia highlighted the involvement of NGOs, particularly CARE, and reported that CXCs, CVQs and NVQs are among the options for exit qualifications. But there is also a NSTP of 6 weeks to 6 months duration that prepares disadvantaged youth and adults with attitudes, skills and knowledge for participation in the global working environment. It offers a range of CVQs and NVQs and other programmes, which graduates may exit with national qualifications.
The report from Trinidad and Tobago described 10 second-chance programmes for which providers include Ministries with responsibility for education; community development and national security; UWI Open Campus; NGOs, and other community-based groups. The specific objectives vary, but in general the programmes aim to promote literacy and skills acquisition, support at-risk youths, enhance workforce development, and assist individuals with furthering their education and training. The latter entails completion of secondary school certification and preparatory programmes that facilitate access to post-secondary opportunities. The reports on availability of second-chance opportunities are sum-marised in Chart 14.

Chart 16: Summary of responses on availability of Second Chance or alternative learning programmes
9
8
Countries reportingavailability ofSecond ChanceProgrammes
Countries NOTreporting avaiability ofSecond ChanceProgrammes
50 READINESS FOR ACTION: THE BASELINE AND SITUATIONAL ANALYSIS REPORT FOR PHASE I OF THE CARICOM HRD 2030 STRATEGY
17. Percentage of TVET instructors/teachers trained in competency-based programmes (3.1-HRD)
The survey sought to secure baseline data on instructors and trainers who are classified as trained in the delivery of competency-based programmes. The six Member States that submitted reports were the BVI, Saint Vincent and the Grenadines, Saint Kitts and Nevis, Suriname, Trinidad and Tobago, and Turks and Caicos Islands. Of this group, five reported aggregate baseline values ranging from 13% in Saint Vincent and the Grenadines to a peak of 87% in Trinidad and Tobago and with an average of 31.35%. There were no cases of data disaggregation according to urban and rural institutions. The values for females ranged from 13% to 91% and averaged 37.90% while those for males ranged from 13% to 92% and averaged 48.52%. The baseline values of Trinidad and Tobago were consistently high.

Chart 15: Percentage of TVET instructors/teachers trained in competency-based programmes
% %
Tra
ined
Inst
ruct
ors
Baseline Values Males Baseline Values Females Aggregated Values Values
0
10
20
30
40
50
60
70
80
90
100
Turks & CaicosTrinidad and TobagoSurinameSVGSt. KittsBVI
READINESS FOR ACTION: THE BASELINE AND SITUATIONAL ANALYSIS REPORT FOR PHASE I OF THE CARICOM HRD 2030 STRATEGY 51
18. Existence of curricula and/or programmes for youth and adults, which address personal health and family, or other skills-based development (4.8HRD)
This is a reference to education and training curricula and/or programmes that are community-based and structured to support continuous learning of technical and soft skills, as well as health enhancing behaviours. Reports were submitted by Bahamas, Belize, Guyana, Saint Kitts and Nevis, Saint Lucia, Suriname, and Trinidad and Tobago. The Bahamas, Guyana, and Trinidad and Tobago reported the use of HLFE curricula throughout the primary and lower secondary system. In the case of the Bahamas, its Focus on Youth Bahamas is very structured to assist teachers with delivery, and provides parents’ engagement.
The report from Suriname referenced the existence of HFLE as a component of the country’s national curriculum framework for primary education and includes a guidance programme that has been designed to assist teenage mothers in postponing another pregnancy for as long as possible and while still at school. Saint Lucia referenced a similar situation, but explained that there is a focus on HLFE at secondary level.
Like Suriname, Saint Kitts and Nevis reported on the existence of two programmes for teenage mothers, but also indicated that a mentorship programme has been established for at-risk boys. The report also described the use of a social cash transfer initiative that targets vulnerable households, as well as programmes for persons with disabilities, and community-oriented youth focused activities that are aimed at promoting healthy lifestyles and connecting with hard-to-reach youth, 18-30 years.

Chart 16: Availability of programmes for youths and adults, which address personal health and family and other skills-based development
10
7
Countries reportingavailability ofProgrammes
Countries NOTreporting avaiabilityof Programmes
52 READINESS FOR ACTION: THE BASELINE AND SITUATIONAL ANALYSIS REPORT FOR PHASE I OF THE CARICOM HRD 2030 STRATEGY
SECTION 3 – Tertiary Education
This section of the report describes the results for two indicators that are linked to the tertiary education sector.
19. Percentage of students enrolled in STEM programmes at the tertiary education level
The focus of this indicator was the percentage of students who are enrolled in tertiary education programmes that meet the criteria of science, technology, engineering and mathematics. The ver-sion used by Suriname is science, technology, reading, engineering, arts and maths, or STREAM. The intent of the indicator is to measure access to, and availability of, STEM programmes at the tertiary level.
For the purposes of this situational analysis it is assumed that STREAM adequately covers STEM. Ten Member States provided reports on aggregate baseline data and values for males and females. The aggregate values ranged from 24% in Saint Kitts and Nevis to 75% in Montserrat with an average of 37.96%. The BVI only reported on baseline values for males and females, and Turks and Caicos Islands limited its report to the aggregate value. The average baseline values for males and females were 52.60% and 31.02% respectively. The range of baseline values for males was 35% to 77% compared with 16% to 74% for females. The results are summarised in Chart 17.

Chart 17: Percentage of students enrolled in STEM programmes at the tertiary level%
of S
tude
nts
Baseline Values Males Baseline Values Females Aggregated Values Values
0
10
20
30
40
50
60
70
80
Turks
& Caico
s
Trinida
d and
Tobago
St. Lu
cia
St. Ki
tts
Montser
rat
GuyanaBV
IBe
lize
Barba
dos
Baham
as
READINESS FOR ACTION: THE BASELINE AND SITUATIONAL ANALYSIS REPORT FOR PHASE I OF THE CARICOM HRD 2030 STRATEGY 53
20. Gender Parity Index (GPI) at Tertiary Level
This is the ratio of females to males in programmes offered at the tertiary level. The GPI measures progress towards gender parity in education participation and/or learning opportunities available for women in relation to those available to men. It also reflects the level of women’s empowerment in society.
Seven Member States responded to the requirements of this indicator. The values provided for the GPI ranged from 1.58 in Saint Kitts and Nevis to 3.66 in Bahamas and averaged 2.16 with a median of 1.89.
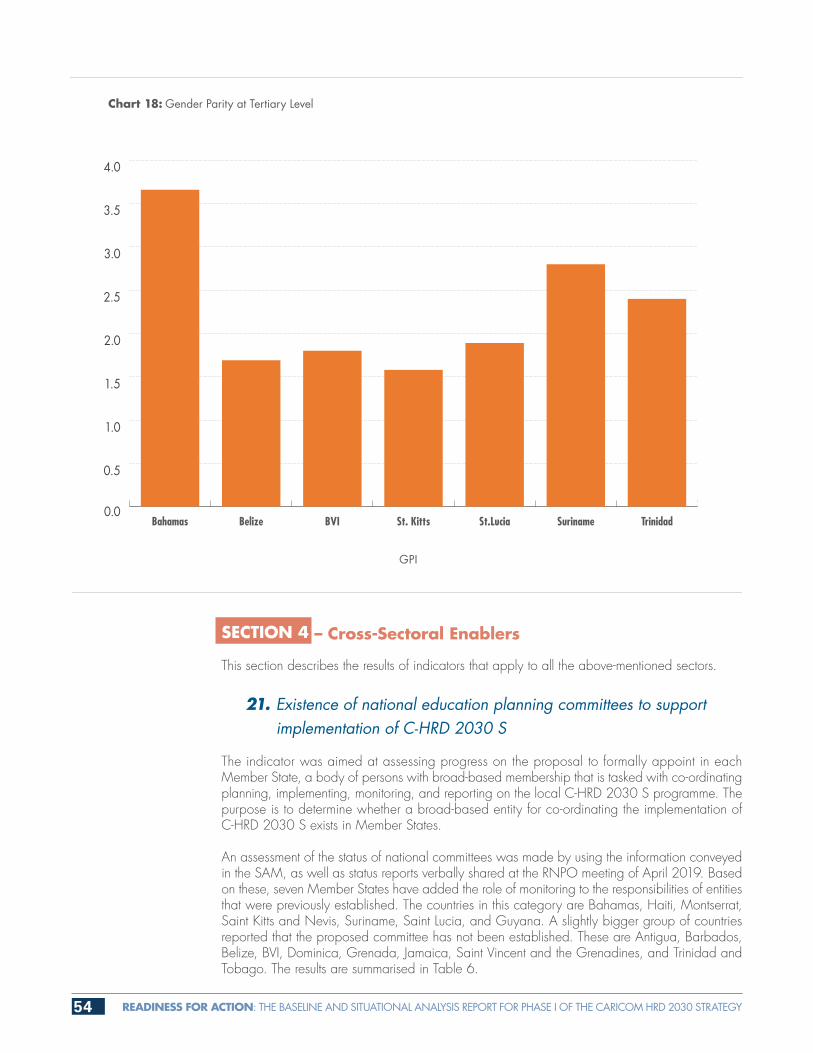
Chart 18: Gender Parity at Tertiary Level
0.0
0.5
1.0
1.5
2.0
2.5
3.0
3.5
4.0
TrinidadSurinameSt.LuciaSt. KittsBVIBelizeBahamas
GPI
54 READINESS FOR ACTION: THE BASELINE AND SITUATIONAL ANALYSIS REPORT FOR PHASE I OF THE CARICOM HRD 2030 STRATEGY
SECTION 4 – Cross-Sectoral Enablers
This section describes the results of indicators that apply to all the above-mentioned sectors.
21. Existence of national education planning committees to support implementation of C-HRD 2030 S
The indicator was aimed at assessing progress on the proposal to formally appoint in each Member State, a body of persons with broad-based membership that is tasked with co-ordinating planning, implementing, monitoring, and reporting on the local C-HRD 2030 S programme. The purpose is to determine whether a broad-based entity for co-ordinating the implementation of C-HRD 2030 S exists in Member States.
An assessment of the status of national committees was made by using the information conveyed in the SAM, as well as status reports verbally shared at the RNPO meeting of April 2019. Based on these, seven Member States have added the role of monitoring to the responsibilities of entities that were previously established. The countries in this category are Bahamas, Haiti, Montserrat, Saint Kitts and Nevis, Suriname, Saint Lucia, and Guyana. A slightly bigger group of countries reported that the proposed committee has not been established. These are Antigua, Barbados, Belize, BVI, Dominica, Grenada, Jamaica, Saint Vincent and the Grenadines, and Trinidad and Tobago. The results are summarised in Table 6.

READINESS FOR ACTION: THE BASELINE AND SITUATIONAL ANALYSIS REPORT FOR PHASE I OF THE CARICOM HRD 2030 STRATEGY 55
22. Per capita expenditure on education per level (5.10HRD)
This indicator was intended to assess public expenditure per student at a specific level as a percent-age of the total expenditure for that level. The purpose was to measure the allocation of funds at ECE, primary, secondary and tertiary levels. Saint Kitts and Nevis, and Saint Lucia provided values for each sector while Bahamas and Belize reported aggregated values for ECE and primary, as well as values for the secondary and tertiary sectors. Three countries reported expenditures for ECE and seven for primary. On the contrary, seven reported for secondary and five for tertiary and Guyana reported an amount of US$176,668 as the total expenditure for basic and tertiary education.
The average expenditures were calculated in United States dollars and were $1268 for ECE, $697 for primary and $2947 for the secondary subsector. At the tertiary level the average per capita expenditure for the region was $2451. The details are summarised in Table 7.
TABLE 6: Status of C-HRD 2030 S National Committees
Role is being executed by a previ-ously established body
Committee has not been established No update
Bahamas, Haiti, Montserrat, St Kitts and Nevis, St Lucia, Suriname, and Guyana
Antigua, Barbados, Belize, BVI, Dominica, Grenada, Jamaica, St Vincent and the Grenadines, Trinidad and Tobago
Turks and Caicos Islands
TABLE 7: Per capita Cost of Education According to Sectors (US$)
ECE Primary Secondary Tertiary
Antigua N/A N/A N/A N/A
Bahamas Mixed with primary 3.016 4,274 9,220
Barbados N/A N/A N/A N/A
Belize N/A 844 1919 1508
BVI N/A N/A N/A N/A
Dominica N/A 1,381 1,717 1,561
Grenada N/A N/A N/A N/A
Guyana N/A N/A N/A N/A
Haiti N/A N/A N/A N/A
Jamaica N/A N/A N/A N/A
MSR (20180 2652 1,487 3,762 N/A
St Kitts and Nevis 2,486 1,217 3,139 1,631
St Lucia 194 1522 2166 2500
SVG N/A N/A N/A N/A
Suriname N/A N/A N/A N/A
TCI N/A 2,973 5088 N/A
Trinidad and Tobago 2022 1936 3104 N/A
Average (Geometric) 1268 697 2946 2451
56 READINESS FOR ACTION: THE BASELINE AND SITUATIONAL ANALYSIS REPORT FOR PHASE I OF THE CARICOM HRD 2030 STRATEGY
23. CARICOM Tertiary Education (TE) accreditation framework established
The CARICOM TE framework is meant to be a regional higher education/tertiary education mechanism geared towards external quality assurance and the harmonisation of national accred-itation systems in the Region.
To date the CARICOM Secretariat has convened a Task Force to support the development of a regional mechanism, the CARICOM Quality Assurance Register (CQAR). The recommendations of the Task Force will be submitted at the next meeting of the COHSOD Education scheduled for October 2019.
24. Number of National Accreditation Agencies registered on the CARICOM Quality Assurance Register
This indicator refers to the number of the entities recognised as the authorities for accreditation at the national level that are registered on the Quality Assurance register that is maintained by CARICOM. The intent is to enable tracking of progress with regards to the operationalisation of the CARICOM TE Accreditation Framework by national accreditation agencies. No progress has been reported on this objective.
25. Regional research and innovation mechanism established (4.12HRD)
The regional research and innovation mechanism has been conceptualised as a set of cost-efficient capability centres. It has been designed to co-ordinate regional communities of practice such as government institutions, partner agencies and state enterprises. Its purpose is to ensure that projects concerning strategic intervention, research, innovative solution design, reform approaches, and quality improvement mechanisms are established, harmonised and developed across Member States. The focus is BE, TE and SLL. These centres will support the implementation of a seamless HRD system in CARICOM by tracking progress on the development of a regional research and innovation mechanism to enhance development and competitiveness in the Region. The mecha-nism has not been established.
26. Percentage of Member States for which the strategies are aligned to the C0HRD 2030 S by sector and imperatives (5.1HRD)
A major assumption of the C-HRD 2030 S is that implementation will take place at the level of Member States and that the planned changes will be realised through the cumulative efforts of all countries. Against that backdrop, this indicator is aimed at monitoring the number of countries in which the imperatives, strategies and planned outputs of the C-HRD 2030 S are adequately reflected in the local sector plan for education and/or HRD.
The reports from Member States suggest that Turks and Caicos Islands, Saint Vincent and the Grenadines, and Saint Kitts and Nevis have aligned their national sectoral plans and that Guyana, Belize, BVI and Suriname are still undertaking that exercise.
27. An operationalised C-HRD 2030 S Communications Strategy (5.7HRD)
This indicator refers to the deployment of an information dissemination mechanism that is designed to increase the overall visibility of C-HRD 2030 S and enhance awareness, under-standing and appreciation of progress among stakeholders. It will also help to foster ownership, sustain interest and remind the various actors of their roles in enabling successful implementation.
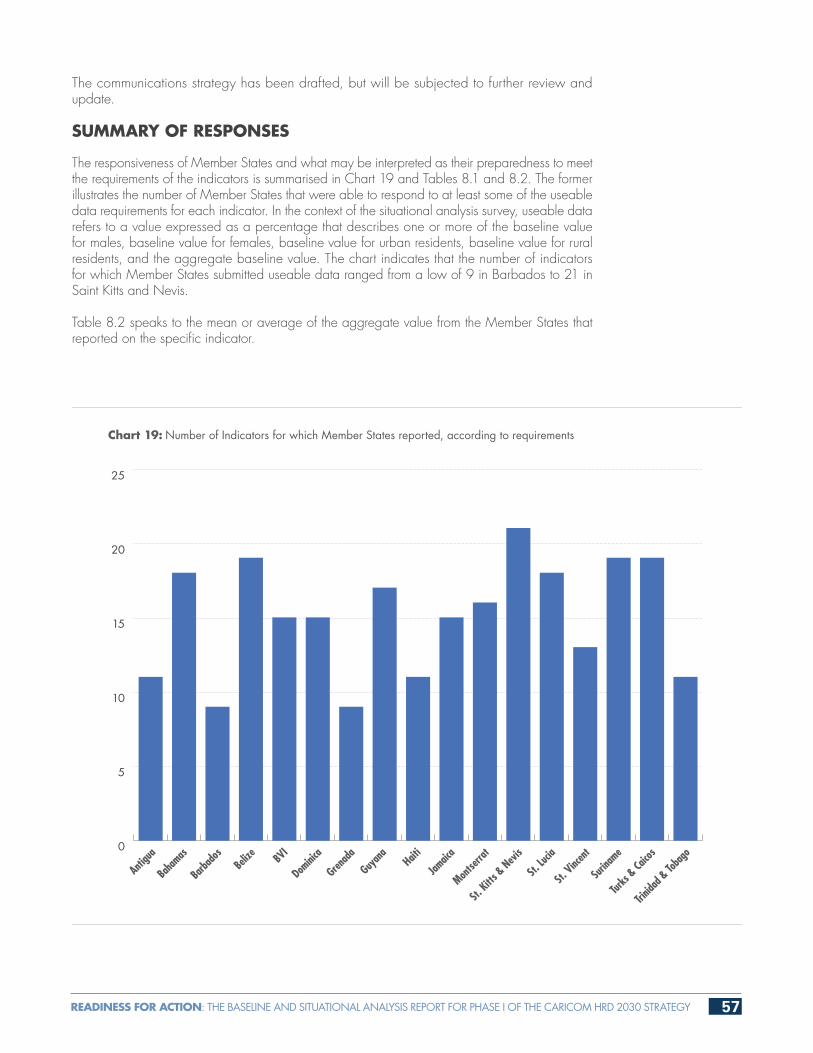
0
5
10
15
20
25
Trinida
d & To
bago
Turks
& Caico
s
Surina
me
St. Vinc
ent
St. Lu
cia
St. Ki
tts & Nevi
s
Montser
rat
Jamaic
aHait
i
Guyana
Grenada
Dominic
aBVI
Belize
Barba
dos
Baham
as
Antigua
Chart 19: Number of Indicators for which Member States reported, according to requirements
READINESS FOR ACTION: THE BASELINE AND SITUATIONAL ANALYSIS REPORT FOR PHASE I OF THE CARICOM HRD 2030 STRATEGY 57
The communications strategy has been drafted, but will be subjected to further review and update.
SUMMARY OF RESPONSES
The responsiveness of Member States and what may be interpreted as their preparedness to meet the requirements of the indicators is summarised in Chart 19 and Tables 8.1 and 8.2. The former illustrates the number of Member States that were able to respond to at least some of the useable data requirements for each indicator. In the context of the situational analysis survey, useable data refers to a value expressed as a percentage that describes one or more of the baseline value for males, baseline value for females, baseline value for urban residents, baseline value for rural residents, and the aggregate baseline value. The chart indicates that the number of indicators for which Member States submitted useable data ranged from a low of 9 in Barbados to 21 in Saint Kitts and Nevis.
Table 8.2 speaks to the mean or average of the aggregate value from the Member States that reported on the specific indicator.

58 READINESS FOR ACTION: THE BASELINE AND SITUATIONAL ANALYSIS REPORT FOR PHASE I OF THE CARICOM HRD 2030 STRATEGY
TABLE 8.1: Summary of Frequency of ResponsesIndicator No. of MS
BASIC EDUCATION
1. Net Enrolment Rate (NER) in organised learning of children who are 12 months below the official age for enrolment in the primary level
16
2. Net Enrolment Rate (NER) at primary level 15
3. Net Enrolment Rate (NER) at secondary level 16
4. Primary Completion Rate 15
5. Primary Survival Rate 14
6. Secondary Completion Rate 15
7. Secondary Survival Rate 14
8. Gender Parity Indices 17
9. Location or Geographic Parity Index 5
10. Proportion of children a) in grade 2, 3 & 4, and (b) at the end of primary achieving at least a minimum proficiency level in Reading and Mathematics
14
11. Percentage of trained teachers (a) pre-primary/ECE, (b) primary and (c) secondary 16
12. Proportion of secondary students who attain at least 5 subjects, including Mathematics and English A, or other official language 15
13. Proportion of secondary school students who are certified as successful in two or more STEM subjects 12
14. Percentage of secondary school students up to fifth form or equivalent participating in apprenticeships 6
15. Percentage of students in the final year secondary exposed to career guidance opportunities 11
SKILLS FOR LIFELONG LEARNING
16. Existence of second-chance learning or alternative programmes for out-of-school youth and adults 9
17. Percentage of instructors/trainers trained in competency-based programmes 7
18. Existence of curricula and/or programmes for youth and adults, which address personal health and family, and other skills-based development
7
TERTIARY EDUCATION
19. Percentage of students enrolled in STEM programmes at the tertiary education level 10
20. Gender Parity Index (GPI) at Tertiary Level 8
CROSS-SECTORAL ENABLERS
21. Existence of national education planning committees to support implementation of C-HRD 2030 S 6
22. Per capita expenditure on education per level (5.10 HRD) 8
23. CARICOM TE accreditation framework established N/A
24. Number of National Accreditation Agencies registered on the CARICOM Quality Assurance Register N/A
25. Regional research and innovation mechanism established N/A
26. Percentage of Member States plans for which strategies are aligned to the C-HRD 2030 S N/A
27. An operationalised C-HRD2030 S Communications Strategy N/A

READINESS FOR ACTION: THE BASELINE AND SITUATIONAL ANALYSIS REPORT FOR PHASE I OF THE CARICOM HRD 2030 STRATEGY 59
TABLE 8.2: Summary of Mean Aggregate ValuesIndicator Mean %
BASIC EDUCATION
1. Net Enrolment Rate (NER) in organised learning of children who are 12 months below the official age for enrolment in the primary level
62.79
2. Net Enrolment Rate (NER) at primary level 88.79
3. Net Enrolment Rate (NER) at secondary level 71.37
4. Primary Completion Rate 87.31
5. Primary Survival Rate 89.14
6. Secondary Completion Rate 71
7. Secondary Survival Rate 76.32
8. Gender Parity Indices 1-1.07
9. Location Parity Index 0.57-0.99
10a. Proportion of children a) in grade 2, 3 & 4, and (b) at the end of primary achieving at least a minimum proficiency level in Reading
59.27-63
10b. Proportion of children a) in grade 2 or 3, and (b) at the end of primary achieving at least a minimum proficiency level in Mathematics
50.79-53.96
11. Number of trained teachers (a) pre-primary/ECE, (b) primary and (c) secondary
a.) Pre-primary 62.9
b.) Primary 80.66
c.) Secondary 67.77
12. Proportion of secondary school students who attain at least five (5) subjects, including Mathematics and English A, or other official language.
36.85
13. Proportion of secondary school students who attain two or more STEM subjects 49.24
14. Percentage of secondary school students up to fifth form or equivalent participating in apprenticeships 52.68
15. Percentage of students in the final year secondary exposed to career guidance opportunities 98.90
SKILLS FOR LIFELONG LEARNING
16. Existence of second-chance learning or alternative programmes for out-of-school youths and adults N/A
17. Percentage of instructors/trainers trained in competency-based programmes 31.35
18. Existence of curricula and/or programmes for youth and adults, which address personal health and family, and other skills-based development
N/A
TERTIARY EDUCATION
19. Percentage of students enrolled in STEM programmes at the tertiary education level 37.96
20. Gender Parity Index (GPI) at Tertiary Level 2.16
CROSS-SECTORAL ENABLERS
21. Existence of national education planning committees to support implementation of C-HRD 2030 S N/A
22. Per capita expenditure on education per level (5.10 HRD) US$3284
23. CARICOM TE accreditation framework established N/A
24. Number of National Accreditation Agencies registered on the CARICOM Quality Assurance Register N/A
25. Regional research and innovation mechanism established N/A
26. Percentage of Member States plans for which strategies are aligned to the C-HRD 2030 S N/A
27. An operationalised C-HRD 2030 S Communications Strategy N/A
60 READINESS FOR ACTION: THE BASELINE AND SITUATIONAL ANALYSIS REPORT FOR PHASE I OF THE CARICOM HRD 2030 STRATEGY
CONCLUSION The SAM was designed to provide quantitative and qualitative information on the status of the proposed KPIs. It is also meant to provide answers on baseline information for the Member States. The survey attracted responses from seventeen Member States. Based on the results from these respondents, one may conclude that there is much diversity in levels of preparedness for use of the proposed indicators. Moreover, most countries are prepared to report aggregate values and performance by sex on the indicators that have been proposed for access and participation in BE. These are the indicators that cover participation in ECE, net enrolment rates, completion rates and survival rates. The inference is that these indicators may be immediately used for target setting and monitoring in the results framework.
There are, however, two glaring exceptions that should be noted. One involves the need to ensure that National Statistical Offices provide credible single-age intercensal population estimates (disaggregated by sex, geographic regions) otherwise it poses a challenge for computations and comparisons. The second issue is that Member States appear not to have a practice of monitoring changes in location or geographic parity indices. One explanation offered is that the rural urban divide is blurred in small island states like most of the countries in the Region. Another is that the classification of districts into rural and urban communities has not been formalised and, in some cases, it has been deemed inapplicable where monitoring of performance in education is concerned. Of course, the issue is further exacerbated by the fact that some Member States are multi-island countries. Presumably, these do not exhaust the list of explanations. But whatever the reasons, Member States may wish to pay closer attention to bridging gaps in performance where students may be disadvantaged because of inequity in services or resource allocation that is linked to their geographical locations.
The results for the quality indicators are slightly different. Generally, the countries are ready to monitor and report on aggregate values and values by sex for trained teachers, as well as the percentage of secondary graduates with five or more subjects, including mathematics and the official language. But the same is not true with reading and mathematics. The reports indicate that while 59 % of reporting Member States are ready to provide data on achievements in reading for students of Grade 6, there is little or no data collection and analysis from standardised national assessments in Grades 2 and 3. At most, only five countries have demonstrated limited readiness for monitoring performance at those levels; albeit 41% of Member States show readiness for Grade 4. The situation is worse for mathematics and the capacity to report achievement of mini-mum proficiency levels in lower secondary. Arguably, it is also worthwhile to note the gendered differences that favour girls and their growth in visibility during the transition from primary to secondary. However, one can conclude that while the quality indicators may be used for target setting and monitoring, there is certainly a case for structured discourse on enhancement of readiness and decisions on the scheduling of implementation.

READINESS FOR ACTION: THE BASELINE AND SITUATIONAL ANALYSIS REPORT FOR PHASE I OF THE CARICOM HRD 2030 STRATEGY 61
Different conclusions may be drawn from the results of the indicators for relevance of BE. The findings suggest that only six countries are ready to report on the number of students participating in apprenticeships and other school-to-work programmes that are organised at the secondary level. However, eleven countries demonstrate preparedness for the number of students graduating with two or more STEM subjects, as well as numbers that are exposed to career education. These obser-vations support the immediate use of the indicators for relevance; albeit some preparation may be needed for students exposed to apprenticeships and other school-to-work programmes.
The SAM fielded three indicators for SLL. Eight Member States reported on the existence of second-chance programmes and seven acknowledged existence of curricula for youth and adults that address personal health and family, and other skills-based development. The third indicator on the number of instructors trained in competency-based programmes only attracted six submissions.
The submissions for the tertiary sector are marginally better. Ten submissions were received for STEM programmes and for the gender parity, the number was eight. One may conclude that for both SLL and TE, the paucity of responses may not be a true reflection of what obtains in the region and is more likely a signpost of widespread deficiencies in data management practices. The issue may be resolved by entertaining more dialogue on preparedness for these indicators before decisions are made on imminent use.
In a manner that is not dissimilar to the outcomes for SLL and TE, the submissions for Cross-Sectoral Enablers were less than adequate. Eight countries reported on per capita expenditures in the primary and secondary subsectors and four provided data for early childhood education. For the tertiary subsector only five reports were received. Another very important observation is that less than 50% of responding countries have planned for co-ordinating the implementation of C-HRD 2030 S. Further, only three countries have completed alignment of their sector plans although another three are undertaking that task. At the level of the CCS, work appears to be most advanced with the communications strategy and development of the regional mechanism known as the CARICOM Quality Assurance Register (CQAR).
Finally, the situational analysis survey provided answers on baseline information for 17 Member States, the extent to which data is accessible for each indicator, opportunities for disaggregation, and the nature of the diversity among the Member States. The findings suggest that existing capacity challenges and deficiencies in data management must be urgently addressed if most of the Member States are to meet the reporting requirements for the C- HRD 2030 S and targets 4.2, 4.4, 4.5 and 4.6 of the SDGs. Further, it identified areas for possible interven-tions and opportunities for deepened collaboration among Member States. However, there is sufficient data for operationalisation of the proposed results framework at the regional level and at the level of Member States.

62 READINESS FOR ACTION: THE BASELINE AND SITUATIONAL ANALYSIS REPORT FOR PHASE I OF THE CARICOM HRD 2030 STRATEGY
APPENDICIESAppendix A
TABLE A1: Second Chance Learning or Alternative Learning Programmes
Member State Programmes Objective Provider Beneficiaries Training/Courses
BVI A 3-year Alternative Secondary Education Programme (ASEP)
To provide high school certificates to persons who previously failed to complete normal schooling
Ministry of Education
Accessible to male and female students. There were 35 participants for 2017/18. The group consisted of thirteen (13) males and twenty-two (22) females
Mathematics, English, social studies, integrated science, computer applications. Prior to Hurricane Maria, woodwork, metal work, clothing and textiles, and auto mechanics were offered.
Belize Frank A. Lizama, O.B.E. Training Centre
To provide trainees with skills training opportunities, basic numeracy and literacy skills, holistic personal development and to prepare them for integration into a formal secondary educational institution, or for basic entry level job opportunities
Ministry of Education, Youth, Sports and Culture
Youth ages 13-19 years; there were 34 youth enrolled in 2017-18 (30 Males, 4 Females)
10-month skills-based programme in areas such as barbering, computer repair and crafts along with academic support courses in literacy and numeracy.
Gateway Youth Centre
To provide opportunities for youth to develop their physical, social, emotional, and cognitive abilities and experience achievement, leadership, enjoyment, friendship and recognition
Ministry of Education, Youth, Sports and Culture
Youth ages 13-19 years
1-2 years study and support programme that focuses on basic reading, comprehension and numeracy skills, sports, and the arts and also provides support for students to enrol in an institution to pursue a secondary education diploma or vocational/skills training.
Bahamas Fresh Start Programme
To provide young prospective professionals with the resources, information and tools needed for successful employment and job retention
Ministry of Youth, Sports & Culture in partnership with the private sector
Youth 16-25 years A variety of personal development and job search topics plus workplace experiences, and 30 hours of community service. Courses include welding, computer technology, hospitality training, hotel services, cosmetology, general maintenance, food and beverages, among others.

READINESS FOR ACTION: THE BASELINE AND SITUATIONAL ANALYSIS REPORT FOR PHASE I OF THE CARICOM HRD 2030 STRATEGY 63
TABLE A1: Second Chance Learning or Alternative Learning Programmes
Member State Programmes Objective Provider Beneficiaries Training/Courses
Dominica Skills Training Programme
To provide efficient, effective and relevant training to unemployed and underemployed youth 17-35 years old, with the view to creating employment, and to cater to the employment market needs
Ministry of Education and Human Resource Development
Youth 17-35 years Computer literacy, computer maintenance, small engine repairs, mechanics, leather craft training, plumbing, electrical wiring, and woodwork.
Adolescent Skills Training Programme
To provide development in areas of skills and personality for youth between the ages of 16 and 20 years
Social Centre Youth 16-20 years Woodwork, personal and spiritual development, home management, ICT, literacy, numeracy, social studies
From offending to achieving programme
To provide support services to at-risk youth
- Juveniles referred to by courts
Less academic courses and skills
Centre Where Adolescents Learn to Love and Serve (CALLS)
To facilitate development of at-risk young adults into responsible well-rounded individuals
CALLS Centre
At risk young adults Early childhood education, woodwork, cosmetology, and agriculture, among others
Saint Kitts and Nevis
National Skills Training Programme
To offer non-formal, short-term training to a wide cross-section of the population, from school dropouts to professionals;to create job opportunities through skills training and personal development
Ministry of Education
Early School leavers and professionals, 17 years and over.
Industrial maintenance, hospitality/hotel trades, building construction, ago-processing, small appliance repair, agriculture, art & graphics, metal work, home decorative sewing, landscaping, tailoring, dress making, and upholstery
Saint Lucia
Community-based 2-year programme offering holistic education and skill training
To foster positive attitude in young people towards themselves and others
Centre for Adolescent Renewal & Education (C.A.R.E)
Disadvantaged and marginalised youth
TVET and academic courses inclusive of CXC, and preparation for local examinations/certification
3-6-month career counselling skills and TVET, coupled with job attachments
To prepare disadvantaged youth and adults with attitudes, skills and knowledge for participation in the global working environment
National Skills Development Centre
Disadvantaged youth and adults
A range of CVQs, NVQs and national certification programmes in areas such as bartending, culinary arts, massage therapy, housekeeping, and IT training

64 READINESS FOR ACTION: THE BASELINE AND SITUATIONAL ANALYSIS REPORT FOR PHASE I OF THE CARICOM HRD 2030 STRATEGY
TABLE A1: Second Chance Learning or Alternative Learning Programmes
Member State Programmes Objective Provider Beneficiaries Training/Courses
Trinidad and Tobago
Adult literacy programme
To provide a comprehensive, structured, adult literacy programme
The Adult Literacy Tutors Association (ALTA), a non-profit organisation
Students, Youth and Adults
Reading Circles – ALTA’s current and past students are given assistance to improve their reading skills; Community literacy classes in fifty (50) communities across Trinidad;Workplace Literacy Programme to improve the reading and writing skills of employees to meet the demands of the workplace; ALTA classes in prisons train the trainer programme
Community Education Programme – Skills Training Programme
To decrease the level of unskilled persons in local communities, and to improve the chances of the unemployed to find employment in existing organisations, or by creating employment opportunities for themselves
Ministry of Community Development
Householders, low income families, rural and urban poor, dropouts in the school system, and the vulnerable and “at risk” in our society
Technical/Vocational Courses Personal Development Courses Handicraft Courses Entrepreneurial (Micro-enterprise) Development/Management Courses
Continuing and Professional Education (CPE) Programme
Lifelong learning and workforce development
UWI Open Campus
Adults without higher-education qualifications & university certified individuals seeking to enhance their knowledge
Continuing Education (CE) which focuses on pre-university basic and vocational education
Continuing Professional Education
Technical and Vocational Training, Industry Services and Construction Services
To develop Technical and Vocational competencies for national and regional industries through quality training, innovation, manufacturing, construction and engineering products and services
Ministry of Education - MIC Institute of Technology
Youth & Adults MIC-IT Helping You Prepare for Employment (HYPE)MIC-IT Industrial Craft Programme (ICP)MIC-IT Multi-Sector Skills Training (MuST) ProgrammeMIC-IT/ National Skills Development Programme (NSDP)
Military-Led Academic Training (MiLAT) Programme
To bridge the gap for those young adults who may wish to pursue academic disciplines, as well as transform their social behaviours, in a highly structured and regulated environment
Ministry of National Security
Young men between the ages of 16-20 years
Academic instructionCharacter development
APPENDICES
Appendix A
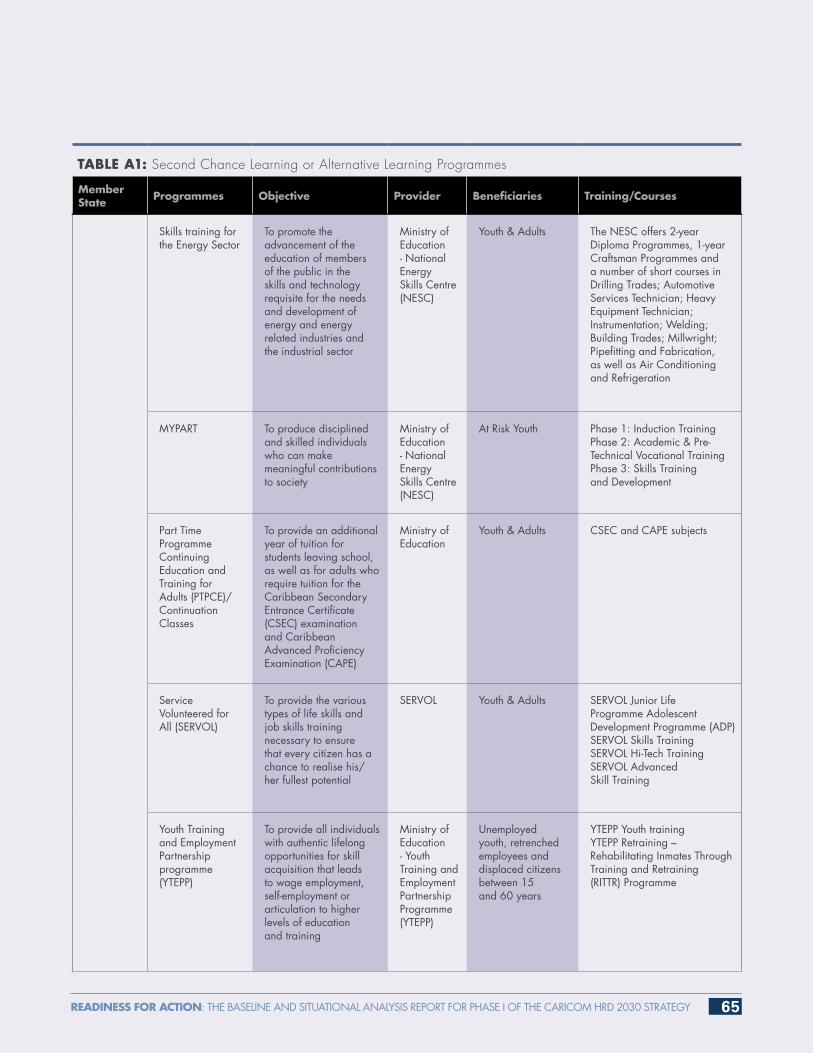
READINESS FOR ACTION: THE BASELINE AND SITUATIONAL ANALYSIS REPORT FOR PHASE I OF THE CARICOM HRD 2030 STRATEGY 65
TABLE A1: Second Chance Learning or Alternative Learning Programmes
Member State Programmes Objective Provider Beneficiaries Training/Courses
Skills training for the Energy Sector
To promote the advancement of the education of members of the public in the skills and technology requisite for the needs and development of energy and energy related industries and the industrial sector
Ministry of Education - National Energy Skills Centre (NESC)
Youth & Adults The NESC offers 2-year Diploma Programmes, 1-year Craftsman Programmes and a number of short courses in Drilling Trades; Automotive Services Technician; Heavy Equipment Technician; Instrumentation; Welding; Building Trades; Millwright; Pipefitting and Fabrication, as well as Air Conditioning and Refrigeration
MYPART To produce disciplined and skilled individuals who can make meaningful contributions to society
Ministry of Education - National Energy Skills Centre (NESC)
At Risk Youth Phase 1: Induction TrainingPhase 2: Academic & Pre-Technical Vocational TrainingPhase 3: Skills Training and Development
Part Time Programme Continuing Education and Training for Adults (PTPCE)/ Continuation Classes
To provide an additional year of tuition for students leaving school, as well as for adults who require tuition for the Caribbean Secondary Entrance Certificate (CSEC) examination and Caribbean Advanced Proficiency Examination (CAPE)
Ministry of Education
Youth & Adults CSEC and CAPE subjects
Service Volunteered for All (SERVOL)
To provide the various types of life skills and job skills training necessary to ensure that every citizen has a chance to realise his/her fullest potential
SERVOL Youth & Adults SERVOL Junior Life Programme Adolescent Development Programme (ADP)SERVOL Skills TrainingSERVOL Hi-Tech TrainingSERVOL Advanced Skill Training
Youth Training and Employment Partnership programme (YTEPP)
To provide all individuals with authentic lifelong opportunities for skill acquisition that leads to wage employment, self-employment or articulation to higher levels of education and training
Ministry of Education - Youth Training and Employment Partnership Programme (YTEPP)
Unemployed youth, retrenched employees and displaced citizens between 15 and 60 years
YTEPP Youth trainingYTEPP Retraining – Rehabilitating Inmates Through Training and Retraining (RITTR) Programme

66 READINESS FOR ACTION: THE BASELINE AND SITUATIONAL ANALYSIS REPORT FOR PHASE I OF THE CARICOM HRD 2030 STRATEGY
TABLE B1: Existence of curricula and/or programmes for youth and adults, which address personal health and family, and other skills-based development
Member State Programmes objective Provider Beneficiaries
BahamasFocus on Youth Bahamas at Primary level. HLFE at secondary level
Risk reduction Ministry of Youth, Sports & Culture in partnership with
Students of grade 6, and parents
Saint Kitts and Nevis
Saint Kitts Nevis Association of people with disabilities
To improve the lives of people with disabilities through advocacy, education, peer support, and service
NPO/NGO Persons with disabilities. Most recent figures are 20 males and 21 females
Ade’s Place To provide a safe place for young people who are “differently able” where they can develop to their fullest potential
NPO/NGO Youth with disabilities. Most recent figures, 11 females and 9 males
Boy’s mentorship Programme
To inculcate positive behaviour into at risk youths
Government, but implementation is done through secondary schools
Boys who are at risk. Most recent figure is 47 boys.
Project Viola To provide services and support to ensure that teen mothers return to school to complete their education
Government Teenage mothers.Most recent count was 137
RISE (Nevis) MEND (Saint Kitts)
A social cash transfer programme that aims to protect and promote the well-being of the most vulnerable households
Government Social Services
Vulnerable households
Second Chance Teen Mothers Programme
To provide social, emotional, educational and financial empowerment to young ladies who would have conceived during their adolescent years
Division of Gender Affairs
APPENDICES
Appendix B

READINESS FOR ACTION: THE BASELINE AND SITUATIONAL ANALYSIS REPORT FOR PHASE I OF THE CARICOM HRD 2030 STRATEGY 67
TABLE B1: Existence of curricula and/or programmes for youth and adults, which address personal health and family, and other skills-based development
Member State Programmes objective Provider Beneficiaries
Teen mothers (13-21 years) Current number enlisted to date is 65. Average enrolled per year is 11
Pon De Block (Nevis) To connect with hard-to-reach youth 18-30 and others who are at risk
Youth Development Division
At-risk and hard-to-reach youth
You fit Youth Dancercise To promote healthy living through exercise
Department of Youth Current numbers, 21 females and 9 males
Saint LuciaHFLE at Secondary Level To promote healthy
lifestylesMinistry of Education Secondary students
Trinidad and TobagoHLFE at secondary level To promote healthy
lifestylesMinistry of Education Secondary students
Suriname
National Curriculum Framework: Health, family & skills-based development
To promote healthy lifestyles
Ministry of Education Students in grades 3-6 of the primary sector
Programme for teenage mothers
To guide teenage mothers in postponing another pregnancy and to enable completion of a secondary education certificate
Ministry of Sports and Youth
Students of lower secondary age group who have become mothers

68 READINESS FOR ACTION: THE BASELINE AND SITUATIONAL ANALYSIS REPORT FOR PHASE I OF THE CARICOM HRD 2030 STRATEGY
Appen
dix
C
TAB
LE C
1:
Sum
mar
y of
Mem
ber
Stat
es’ P
repa
redn
ess
to R
epor
t on
Indi
cato
rs
A&
BBA
HB/
DO
SBE
LBV
ID
OM
GN
DG
UY
HA
IJA
MM
SRSK
NSL
USV
GSU
RTC
IT&
TTO
TAL
Parti
cipat
ion
rate
in o
rgan
ised
learn
ing
of ch
ildre
n on
e ye
ar b
efor
e th
e of
ficia
l prim
ary
entr
y ag
e by
sex
••
••
••
••
••
••
••
••
16
Net E
nrol
men
t at p
rimar
y•
••
••
••
••
••
••
••
15
Net E
nrol
men
t at s
econ
dary
••
••
••
••
••
••
••
••
16
Prim
ary
Com
plet
ion
Rate
••
••
••
••
••
••
••
•15
Prim
ary
Surv
ival
Rat
e•
••
••
••
••
••
••
•14
Seco
ndar
y Co
mpl
etio
n Ra
te•
••
••
••
••
••
••
••
15
Seco
ndar
y Su
rviv
al R
ate
••
••
••
••
••
••
••
14
Gend
er P
arity
Inde
x•
••
••
••
••
••
••
••
••
17
Geog
raph
ic Pa
rity
Inde
x•
••
••
5
Prop
ortio
n of
child
ren
and
youn
g pe
ople
(a) i
n gr
ade
2 or
3, (
b) a
t the
end
of
prim
ary
educ
atio
n, (c
) at t
he e
nd o
f low
er se
cond
ary
achi
evin
g at
leas
t a
min
imum
pro
ficien
cy le
vel i
n re
adin
g an
d m
athe
mat
ics, b
y se
x•
••
••
••
••
••
••
•14
Perc
enta
ge o
f tra
ined
teac
hers
(a) p
re-p
rimar
y, (b
) prim
ary,
and
(c)
seco
ndar
y (S
DG 4
.c.1)
••
••
••
••
••
••
••
••
16
Prop
ortio
n of
seco
ndar
y sc
hool
stud
ents
who
atta
in a
t lea
st fi
ve (5
) sub
jects
, in
cludi
ng M
athe
mat
ics a
nd E
nglis
h or
oth
er o
fficia
l lan
guag
e•
••
••
••
••
••
••
••
15
Prop
ortio
n of s
econ
dary
scho
ol stu
dent
s who
atta
in tw
o (2)
or m
ore S
TEM
subje
cts•
••
••
••
••
••
•12
Perc
enta
ge o
f sec
onda
ry sc
hool
stud
ents
in fi
fth fo
rm o
r equ
ival
ent
parti
cipat
ing
in a
ppre
ntice
ship
s and
scho
ol-t
o-w
ork
prog
ram
mes
••
••
••
6
Perc
enta
ge o
f stu
dent
s in
the
final
yea
r sec
onda
ry e
xpos
ed to
care
er
guid
ance
opp
ortu
nitie
s (ca
reer
edu
catio
n)•
••
••
••
••
••
11
Exist
ence
of s
econ
d ch
ance
lear
ning
or a
ltern
ativ
e lea
rnin
g pr
ogra
mm
es fo
r ou
t-of
-sch
ool y
outh
and
adu
lts (2
.6HR
D)•
••
••
••
••
9
Perc
enta
ge o
f TVE
T in
stru
ctors
/tea
cher
s tra
ined
in co
mpe
tenc
y-ba
sed
prog
ram
mes
(3.1
0HRD
)•
••
••
••
7
Exist
ence
of c
urric
ula
and/
or p
rogr
amm
es fo
r you
th a
nd a
dults
, whi
ch
addr
ess p
erso
nal h
ealth
and
fam
ily, a
nd o
ther
skill
s-ba
sed
deve
lopm
ent (
4.8
HRD)
••
••
••
•7
Perc
enta
ge o
f stu
dent
s enr
olled
in S
TEM
pro
gram
mes
at t
he te
rtiar
y ed
ucat
ion
level
••
••
••
••
••
10
Gend
er P
arity
Inde
x (G
PI) a
t ter
tiary
leve
l•
••
••
••
•8
Exist
ence
of n
atio
nal e
duca
tion
plan
ning
com
mitt
ees t
o su
ppor
t im
plem
enta
tion
of C
-HRD
203
0 S
(5.7
HRD)
••
••
••
6
Per C
apita
exp
endi
ture
acc
ordi
ng to
leve
ls/su
bsec
tors
••
••
••
••
8
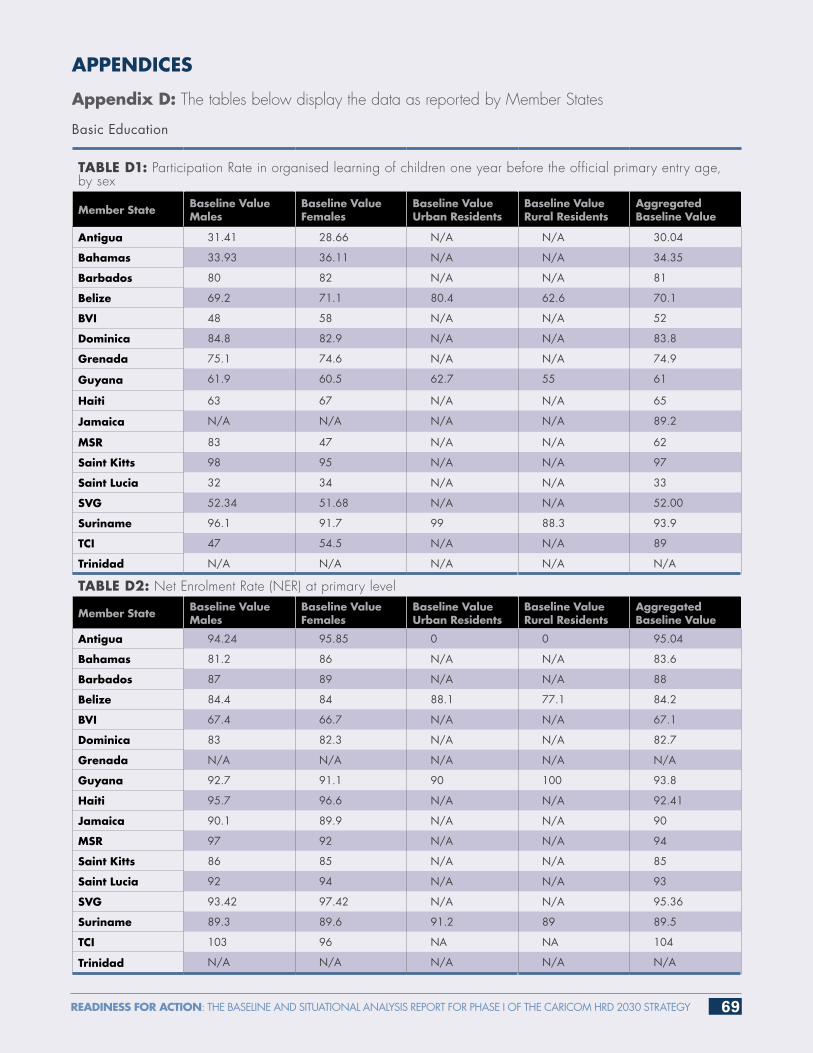
READINESS FOR ACTION: THE BASELINE AND SITUATIONAL ANALYSIS REPORT FOR PHASE I OF THE CARICOM HRD 2030 STRATEGY 69
APPENDICES
Appendix D: The tables below display the data as reported by Member States
Basic Education
TABLE D1: Participation Rate in organised learning of children one year before the official primary entry age, by sex
Member State Baseline Value Males
Baseline Value Females
Baseline Value Urban Residents
Baseline Value Rural Residents
Aggregated Baseline Value
Antigua 31.41 28.66 N/A N/A 30.04
Bahamas 33.93 36.11 N/A N/A 34.35
Barbados 80 82 N/A N/A 81
Belize 69.2 71.1 80.4 62.6 70.1
BVI 48 58 N/A N/A 52
Dominica 84.8 82.9 N/A N/A 83.8
Grenada 75.1 74.6 N/A N/A 74.9
Guyana 61.9 60.5 62.7 55 61
Haiti 63 67 N/A N/A 65
Jamaica N/A N/A N/A N/A 89.2
MSR 83 47 N/A N/A 62
Saint Kitts 98 95 N/A N/A 97
Saint Lucia 32 34 N/A N/A 33
SVG 52.34 51.68 N/A N/A 52.00
Suriname 96.1 91.7 99 88.3 93.9
TCI 47 54.5 N/A N/A 89
Trinidad N/A N/A N/A N/A N/A
TABLE D2: Net Enrolment Rate (NER) at primary level
Member State Baseline Value Males
Baseline Value Females
Baseline Value Urban Residents
Baseline Value Rural Residents
Aggregated Baseline Value
Antigua 94.24 95.85 0 0 95.04
Bahamas 81.2 86 N/A N/A 83.6
Barbados 87 89 N/A N/A 88
Belize 84.4 84 88.1 77.1 84.2
BVI 67.4 66.7 N/A N/A 67.1
Dominica 83 82.3 N/A N/A 82.7
Grenada N/A N/A N/A N/A N/A
Guyana 92.7 91.1 90 100 93.8
Haiti 95.7 96.6 N/A N/A 92.41
Jamaica 90.1 89.9 N/A N/A 90
MSR 97 92 N/A N/A 94
Saint Kitts 86 85 N/A N/A 85
Saint Lucia 92 94 N/A N/A 93
SVG 93.42 97.42 N/A N/A 95.36
Suriname 89.3 89.6 91.2 89 89.5
TCI 103 96 NA NA 104
Trinidad N/A N/A N/A N/A N/A

70 READINESS FOR ACTION: THE BASELINE AND SITUATIONAL ANALYSIS REPORT FOR PHASE I OF THE CARICOM HRD 2030 STRATEGY
TABLE D3: Net Enrolment Rate (NER) at secondary level
Member State Baseline Value Males
Baseline Value Females
Baseline Value Urban Residents
Baseline Value Rural Residents
Aggregated Baseline Value
Antigua 86.61 86.86 0 0 86.74
Bahamas 74.4 83.2 NA NA 78.8
Barbados 90 97 N/A N/A 93
Belize 43.8 56.2 87.4 22.2 50.1
BVI 53.2 59.9 0 0 64.5
Dominica 83 82.3 N/A N/A 82.7
Grenada 74.8 82.4 N/A N/A 78.6
Guyana 57.07 65 58.8 76.1 62
Haiti 18.5 21.6 N/A N/A 20.16
Jamaica 84.3 89.8 N/A N/A 87
MSR 77 83 N/A N/A 80
Saint Kitts 90 91 N/A N/A 90
Saint Lucia 83 88 N/A N/A 85
SVG 83.66 87.14 N/A N/A 85.36
Suriname 38.4 50.4 48.4 19.20 59.14
TCI 84.7 79.1 NA NA 101
Trinidad N/A N/A N/A N/A N/A
TABLE D4: Primary Completion Rate
Member State Baseline Value Males
Baseline Value Females
Baseline Value Urban Residents
Baseline Value Rural Residents
Aggregated Baseline Value
Antigua 93.8 98.6 0 0 96.2
Bahamas 101.5 102.51 NA NA 102.2
Barbados 98 99 N/A N/A 99
Belize 84.4 84 88.1 77.1 84.2
BVI 69.6 64.3 N/A N/A 66.9
Dominica 77.2 79.8 N/A N/A 78.5
Guyana 82.1 83.8 80 100 82.9
Grenada N/A N/A N/A N/A N/A
Haiti N/A N/A N/A N/A 94.14
Jamaica 95.3 93.1 N/A N/A 94.3
MSR 90 81 N/A N/A 86
Saint Kitts 101 98 N/A N/A 99
Saint Lucia 91 93 N/A N/A 92
SVG 76.62 92.71 N/A N/A 84.34
Suriname 62.89 76.12 75.16 41.25 69.4
TCI 91 90 NA NA 90
Trinidad N/A N/A N/A N/A N/A
APPENDICESAppendix D: The tables below display the data as reported by Member StatesBasic Education

READINESS FOR ACTION: THE BASELINE AND SITUATIONAL ANALYSIS REPORT FOR PHASE I OF THE CARICOM HRD 2030 STRATEGY 71
TABLE D5: Primary Survival Rate
Member State Baseline Value Males
Baseline Value Females
Baseline Value Urban Residents
Baseline Value Rural Residents
Aggregated Baseline Value
Antigua N/A N/A N/A N/A N/A
Bahamas 82.12 82.78 NA NA 82.02
Barbados N/A N/A N/A N/A N/A
Belize 88.7 85.7 NA NA 87.3
BVI 67 74 N/A N/A 71
Dominica 96.2 87.6 N/A N/A 91.9
Grenada 73.6 87.1 N/A N/A 79.8
Guyana 93 91 92 93 93
Haiti N/A N/A N/A N/A 92.34
Jamaica 92.6 96.5 N/A N/A 94.4
MSR 88 94 N/A N/A 91
Saint Kitts 95 96 N/A N/A 96
Saint Lucia 97.1 93.4 N/A N/A 95.4
SVG 96.1 82.43 N/A N/A 93.86
Suriname N/A N/A N/A N/A 85.14
TCI 100 100 100 100 99.5
Trinidad N/A N/A N/A N/A N/A
TABLE D6: Secondary Completion Rate
Member State Baseline Value Males
Baseline Value Females
Baseline Value Urban Residents
Baseline Value Rural Residents
Aggregated Baseline Value
Antigua 92.1 118.4 N/A N/A 105.0
Bahamas 91.26 100.90 N/A N/A 96.57
Barbados N/A N/A N/A N/A N/A
Belize 43.8 56.2 87.4 22.2 50
BVI 34.7 59.3 N/A N/A 46.7
Dominica 102 121 N/A N/A 111
Grenada 90.9 95.2 N/A N/A 93.1
Guyana 36.8 49.5 43.2 41.3 43
Haiti 30.2 38.5 N/A N/A 37.29
Jamaica 77.2 87.1 N/A N/A 82
MSR 60 73 N/A N/A 66
Saint Kitts 69 80 N/A N/A 75
Saint Lucia 83 92 N/A N/A 87
SVG 68.48 87.53 N/A N/A 77.85
Suriname 46.41 68.34 36.65 25.99 57.16
TCI 75.6 70 N/A N/A 90
Trinidad N/A N/A N/A N/A N/A

72 READINESS FOR ACTION: THE BASELINE AND SITUATIONAL ANALYSIS REPORT FOR PHASE I OF THE CARICOM HRD 2030 STRATEGY
TABLE D7: Secondary Survival Rate
Member State Baseline Value Males
Baseline Value Females
Baseline Value Urban Residents
Baseline Value Rural Residents
Aggregated Baseline Value
Antigua N/A N/A N/A N/A N/A
Bahamas 80.34 97.42 NA NA 88.72
Barbados N/A N/A N/A N/A N/A
Belize 59 79 NA NA 66.8
BVI 58 66 N/A N/A 62
Dominica 99.95 99.89 N/A N/A 99.92
Grenada 52.8 63.9 N/A N/A 58.0
Guyana 32 52 48 32 41
Haiti N/A N/A N/A N/A 81.28
Jamaica 89.8 88.9 N/A N/A 89.4
MSR 81 92 N/A N/A 87
Saint Kitts 91 92 N/A N/A 92
Saint Lucia 88 92 N/A N/A 90
SVG 54.39 78.06 N/A N/A 65.20
Suriname 33.8 43.7 N/A N/A N/A
TCI 100 100 100 100 100
Trinidad N/A N/A N/A N/A N/A
APPENDICES
Appendix D: The tables below display the data as reported by Member States
Basic Education

READINESS FOR ACTION: THE BASELINE AND SITUATIONAL ANALYSIS REPORT FOR PHASE I OF THE CARICOM HRD 2030 STRATEGY 73
TAB
LE D
8A
: Pr
opor
tion
of s
tude
nts
(a) i
n gr
ades
2,3
,4 &
5,
(b) a
t end
of p
rimar
y ac
hiev
ing
at le
ast a
min
imum
pro
ficie
ncy
leve
l in
read
ing
MS
National G
rade
Two
Ass
essm
ent Li
tera
cyN
ational G
rade
Thre
e A
sses
smen
tN
ational G
rade
Four
A
sses
smen
tN
ational G
rade
Five
A
sses
smen
tN
ational G
rade
Six
A
sses
smen
t
M
FU
RA
MF
UR
AM
FU
RA
MF
UR
AM
FU
RA
Antig
ua
N/A
N/A
N/A
N/A
N/A
N/A
N/A
N/A
N/A
N/A
N/A
N/A
N/A
N/A
N/A
N/A
N/A
N/A
N/A
N/A
40.6
760
N/A
N/A
50.3
Ba
ha
mas
N/A
N/A
N/A
N/A
N/A
62.3
471
.92
N/A
N/A
67.0
9 N
/AN/
AN/
AN/
AN/
AN/
AN/
AN/
AN/
AN/
A57
.83
73.3
7N/
AN/
A65
.56
Ba
rba
dos
N/A
N/A
N/A
N/A
N/A
N/A
N/A
N/A
N/A
N/A
N/A
N/A
N/A
N/A
N/A
N/A
N/A
N/A
N/A
N/A
8592
N/A
N/A
89
Bel
ize
N/A
N/A
N/A
N/A
N/A
N/A
N/A
N/A
N/A
46.4
N/A
N/A
N/A
N/A
N/A
N/A
NANA
NA
N/A
N/A
N/A
N/A
67.5
BVI
N/A
N/A
N/A
N/A
N/A
N/A
N/A
N/A
N/A
N/A
N/A
N/A
N/A
N/A
N/A
N/A
N/A
N/A
N/A
N/A
N/A
N/A
N/A
N/A
N/A
Dom
inic
a54
69
6
1.5
N/A
N/A
N/A
N/A
N/A
70
85.6
N/A
N/A
77.8
N/A
N/A
N/A
N/A
N/A
70.2
88.7
N/A
N/A
79
Gre
na
da
78.2
90.2
8N/
AN/
A84
.24
N/A
N/A
N/A
N/A
N/A
54.4
77N/
AN/
A65
.656
.1376
.94
N/A
N/A
65.7
457
.21
82.6
3N/
AN/
A69
.57
Guya
na
39
3941
26.7
39N/
AN/
AN/
AN/
A N
/A 2
741
3010
.734
N/A
N/A
N/A
N/A
N/A
47
6760
.838
.757
Ha
iti
N/A
N/A
N/A
N/A
N/A
N/A
N/A
N/A
N/A
N/A
N/A
N/A
N/A
N/A
N/A
N/A
N/A
N/A
N/A
N/A
N/A
N/A
N/A
N/A
N/A
Jam
aic
aN/
AN/
AN/
AN/
AN/
AN/
AN/
AN/
AN/
AN/
A 7
890
.9N/
AN/
A84
.4N/
AN/
AN/
AN/
AN/
A N
/AN/
AN/
AN/
AN/
A
Monts
erra
t 6
476
N/A
N/A
7130
45N/
AN/
A38
50
79N/
AN/
A67
6977
N/A
N/A
72 8
384
N/A
N/A
83
St K
itts
a
nd N
evis
N/A
N/A
N/A
N/A
N/A
N/A
N/A
N/A
N/A
55 4
455
N/A
N/A
50N/
AN/
AN/
AN/
A31
5263
N/A
N/A
57
St L
uci
a 4
6.9
68.8
N/A
N/A
58N/
AN/
AN/
AN/
AN/
A 5
5.1
71.6
N/A
N/A
63.1
N/A
N/A
N/A
N/A
N/A
N/A
N/A
N/A
N/A
N/A
SVG
N/A
N/A
N/A
N/A
N/A
N/A
N/A
N/A
N/A
N/A
N/A
N/A
N/A
N/A
N/A
N/A
N/A
N/A
N/A
N/A
N/A
N/A
N/A
N/A
N/A
Suri
na
me
N/A
N/A
N/A
N/A
N/A
N/A
N/A
N/A
N/A
N/A
N/A
N/A
N/A
N/A
N/A
N/A
N/A
N/A
N/A
N/A
23.
6725
.35
26.17
15.2
224
.55
TCI
N/A
N/A
N/A
N/A
N/A
N/A
N/A
N/A
N/A
N/A
N/A
N/A
N/A
N/A
N/A
N/A
N/A
N/A
N/A
N/A
76.7
89.7
79.
989
.783
.2
Trin
ida
dN/
AN/
AN/
A N
/AN/
AN/
AN/
AN/
AN/
AN/
AN/
AN/
AN/
AN/
AN/
AN/
AN/
A N
/AN/
AN/
A N
/AN/
AN/
AN/
AN/
A

74
TAB
LE D
8B
: Pr
opor
tion
of s
tude
nts
in (a
) gra
des
2,3,
4, a
nd (b
) at t
he e
nd o
f prim
ary
achi
evin
g at
leas
t a m
inim
um le
vel p
rofic
ienc
y in
mat
hem
atic
s
MS
National G
rade
Two
Ass
essm
ent
National G
rade
Thre
e A
sses
smen
tN
ational G
rade
Four
A
sses
smen
tN
ational G
rade
Five
A
sses
smen
tN
ational G
rade
Six
A
sses
smen
t
M
FU
RA
MF
UR
AM
FU
RA
MF
UR
AM
FU
RA
Antig
ua
N/A
N/A
N/A
N/A
N/A
N/A
N/A
N/A
N/A
N/A
N/A
N/A
N/A
N/A
N/A
N/A
N/A
N/A
N/A
N/A
47.3
59.6
7N/
AN/
A53
.6
Ba
ha
mas
56
.86
64.
59N/
A N
/A60
.67
N/A
N/A
N/A
N/A
N/A
N/A
N/A
N/A
N/A
N/A
29.4
137
.71
N/A
N/A
33.5
4
Ba
rba
dos
N/A
N/A
N/A
N/A
N/A
N/A
N/A
N/A
N/A
N/A
N/A
N/A
N/A
N/A
N/A
N/A
N/A
N/A
N/A
N/A
7179
N/A
N/A
75
Bel
ize
N/A
N/A
N/A
N/A
N/A
N/A
N/A
N/A
N/A
50.9
N/A
N/A
N/A
N/A
N/A
NANA
NANA
N/A
N/A
N/A
N/A
N/A
51.6
BVI
N/A
N/A
N/A
N/A
N/A
N/A
N/A
N/A
N/A
N/A
N/A
N/A
N/A
N/A
N/A
N/A
N/A
N/A
N/A
N/A
N/A
N/A
N/A
N/A
N/A
Dom
inic
a32
37 N
/AN/
A34
.5N/
AN/
AN/
A N
/AN/
A31
.933
.1 N
/A N
/A 3
2.5
N/A
N/A
N/A
N/A
N/A
64.3
79.5
N/A
N/A
71.5
Gre
na
da
67.6
778
.64
N/A
N/A
72.9
1N/
AN/
AN/
AN/
AN/
A31
.942
.7N/
AN/
A37
.234
.847
.57
N/A
N/A
40.6
960
.775
.68
N/A
N/A
67.9
8
Guya
na
N/A
N/A
N/A
N/A
N/A
N/A
N/A
N/A
N/A
N/A
N/A
N/A
N/A
N/A
N/A
N/A
N/A
N/A
N/A
N/A
N/A
N/A
N/A
N/A
N/A
Ha
iti
N/A
N/A
N/A
N/A
N/A
N/A
N/A
N/A
N/A
N/A
N/A
N/A
N/A
N/A
N/A
N/A
N/A
N/A
N/A
N/A
N/A
N/A
N/A
N/A
N/A
Jam
aic
aN/
AN/
AN/
AN/
AN/
AN/
AN/
AN/
AN/
AN/
A 6
0.2
72.7
N/A
N/A
66.4
N/A
N/A
N/A
N/A
N/A
N/A
N/A
N/A
N/A
N/A
Monts
erra
tN/
AN/
AN/
AN/
AN/
A52
67N/
AN/
A59
N/A
N/A
N/A
N/A
N/A
45
44N/
AN/
A44
N/A
N/A
N/A
N/A
N/A
St K
itts
and
Nev
isN/
AN/
AN/
AN/
AN/
AN/
AN/
AN/
AN/
A57
65
58N/
AN/
A51
N/A
N/A
N/A
N/A
29 5
257
N/A
N/A
54
St L
uci
a 5
1.2
60.7
N/A
N/A
56N/
AN/
A N
/A N
/AN/
A 5
0.4
60.8
N/A
N/A
55.4
N/A
N/A
N/A
N/A
N/A
N/A
N/A
N/A
N/A
N/A
SVG
N/A
N/A
N/A
N/A
N/A
N/A
N/A
N/A
N/A
N/A
N/A
N/A
N/A
N/A
N/A
N/A
N/A
N/A
N/A
N/A
N/A
N/A
N/A
N/A
N/A
Suri
na
me
N/A
N/A
N/A
N/A
N/A
N/A
N/A
N/A
N/A
N/A
N/A
N/A
N/A
N/A
N/A
N/A
N/A
N/A
N/A
N/A
N/A
N/A
N/A
N/A
N/A
TCI
N/A
N/A
N/A
N/A
N/A
N/A
N/A
N/A
N/A
N/A
N/A
N/A
N/A
N/A
N/A
N/A
N/A
N/A
N/A
N/A
51.9
72.8
62.2
563
.05
62.3
5
Trin
ida
dN
/AN
/AN
/AN
/AN
/A N
/AN
/AN
/AN
/AN
/A N
/AN
/AN
/AN
/AN
/A N
/AN
/AN
/AN
/AN
/A N
/AN
/AN
/AN
/AN
/A
APPEN
DIC
ESA
ppen
dix
D: T
he ta
bles
bel
ow d
ispla
y th
e da
ta a
s re
porte
d by
Mem
ber S
tate
s
Basi
c Ed
ucat
ion

75
TAB
LE D
8C:
Low
er S
econ
dary
Proport
ion
of
child
ren
in lo
wer
sec
ondary
ach
ievi
ng a
t le
ast
min
imum
pro
fici
ency
in
readin
gPr
oport
ion
of
child
ren
in lo
wer
sec
ondary
ach
ievi
ng a
t le
ast
min
imum
pro
fici
ency
in m
ath
ematics
Mem
ber
St
ate
Base
line
Valu
e M
ale
sBase
line
Valu
e Fe
male
s
Base
line
Valu
e U
rban
Res
iden
ts
Base
line
Valu
e Rur
al
Res
iden
ts
Aggre
gate
d
Base
line
Valu
e
Base
line
Valu
e M
ale
sBase
line
Valu
e Fe
male
s
Base
line
Valu
e U
rban
Res
iden
ts
Base
line
Valu
e Rur
al
Res
iden
ts
Aggre
gate
d
Base
line
Valu
e
Antig
ua
N/A
N/A
N/A
N/A
N/A
N/A
N/A
N/A
N/A
N/A
Ba
ha
mas
N/A
N/A
N/A
N/A
N/A
N/A
N/A
N/A
N/A
N/A
Ba
rba
dos
N/A
N/A
N/A
N/A
N/A
N/A
N/A
N/A
N/A
N/A
Bel
ize
N/A
N/A
N/A
N/A
N/A
N/A
N/A
N/A
N/A
N/A
BVI
N/A
N/A
N/A
N/A
N/A
N/A
N/A
N/A
N/A
N/A
Dom
inic
a N
/A N
/A N
/A N
/A N
/A N
/A N
/A N
/A N
/A N
/A
Gre
na
da
N/A
N/A
N/A
N/A
N/A
N/A
N/A
N/A
N/A
N/A
Guya
na
3145
4311
38 N
/A N
/A N
/A N
/A N
/A
Ha
iti
N/A
N/A
N/A
N/A
N/A
N/A
N/A
N/A
N/A
N/A
Jam
aic
a N
/A N
/A N
/A N
/A N
/A N
/A N
/A N
/A N
/A N
/A
MSR
N/A
N/A
N/A
N/A
N/A
N/A
N/A
N/A
N/A
N/A
St K
itts
N
/A N
/A N
/A N
/A N
/A N
/A N
/A N
/A N
/A N
/A
St L
uci
a N
/A N
/A N
/A N
/A N
/A N
/A N
/A N
/A N
/A N
/A
SVG
N/A
N/A
N/A
N/A
N/A
N/A
N/A
N/A
N/A
N/A
Suri
na
me
N/A
N/A
N/A
N/A
N/A
74.
01 6
2.28
68.
5 4
0.22
66.
72
Trin
ida
d
N/A
N/A
N/A
N/A
N/A
N/A
N/A
N/A
N/A
N/A
TCI
N/A
N/A
N/A
N/A
N/A
N/A
N/A
N/A
N/A
N/A

76
TAB
LE D
9:
Num
ber
of T
rain
ed T
each
ers
(a) P
re-p
rimar
y, (b
) Prim
ary,
(c) S
econ
dary
M
ember
Sta
tePr
e-Pr
imary
/ EC
EPr
imary
Seco
ndary
M
FU
RA
MF
UR
A M
FU
RA
Antig
ua
N/A
N/A
N/A
N/A
N/A
42.3
752
.61
N/A
N/A
51.8
648
.78
52.4
8N
/AN
/A51
.52
Ba
ha
mas
010
0N
/AN
/A80
589
N/A
N/A
9487
92N
./A
N/A
91
Ba
rba
dos
4473
N/A
N/A
7267
79N
/AN
/A76
5052
N/A
N/A
51
Bel
ize
N/A
N/A
36.4
57.9
46.8
N/A
N/A
80.7
7879
.2N
/AN
/A60
.851
.158
BVI
N/A
N/A
N/A
N/A
3910
091
N/A
N/A
9591
86N
/AN
/A87
Dom
inic
aN
/A46
.9N
/AN
/A46
.953
.164
.9N
/AN
/A63
.544
.452
.8N
/AN
/A50
.1
Gre
na
da
N/A
N/A
N/A
N/A
N/A
N/A
N/A
N/A
N/A
N/A
N/A
N/A
N/A
N/A
N/A
Guya
na
5069
74.8
37.8
69 6
678
.680
47.5
7763
.871
52.2
42.6
69
Ha
iti
N/A
N/A
N/A
N/A
N/A
N/A
N/A
N/A
N/A
69.3
1N
/AN
/AN
/AN
/AN
/A
Jam
aic
aN
/AN
/AN
/AN
/A93
.6N
/AN
/AN
/AN
/A95
.3N
/AN
/AN
/AN
/A82
.5
MSR
-5
0N
/AN
/A50
100
80N
/AN
/A81
54
57N
/AN
/A56
St K
itts
0
43N
/AN
/A43
666
N/A
N/A
7216
44N
/AN
/A60
St L
uci
a0
57N
/AN
/A57
7292
N/A
N/A
8869
73N
/AN
/A69
SVG
N/A
N/A
N/A
N/A
N/A
77.2
488
.55
N/A
N/A
86.7
456
.58
63.4
5N
/AN
/A61
.22
Suri
na
me
N/A
N/A
N/A
N/A
99.2
7N
/AN
/AN
/AN
/A98
.38
N/A
N/A
N/A
N/A
83.7
Trin
ida
d10
0 (1
)99
N/A
N/A
9989
8486
8385
7479
7974
77
TCI
N/A
N/A
N/A
N/A
N/A
100
91.6
N/A
N/A
95.8
91.5
92.3
N/A
N/A
91.9
APPEN
DIC
ESA
ppen
dix
D: T
he ta
bles
bel
ow d
ispla
y th
e da
ta a
s re
porte
d by
Mem
ber S
tate
s
Basi
c Ed
ucat
ion

READINESS FOR ACTION: THE BASELINE AND SITUATIONAL ANALYSIS REPORT FOR PHASE I OF THE CARICOM HRD 2030 STRATEGY 77
TABLE D10: Proportion of secondary school students who attain at least five subjects, including Mathematics and English or other official language
Member State Baseline Value Males
Baseline Value Females
Baseline Value Urban Residents
Baseline Value Rural Residents
Aggregated Baseline Value
Antigua 24.8 31.25 N/A N/A 28.4
Bahamas N/A N/A N/A N/A 62
Barbados N/A N/A N/A N/A N/A
Belize NA NA NA NA 44.8
BVI N/A N/A N/A N/A N/A
Dominica 40.2 43.5 N/A N/A 42.1
Grenada 19.33 22.8 N/A N/A 21.20
Guyana 37 36 46 19 36
Haiti N/A N/A N/A N/A 87.59
Jamaica N/A N/A N/A N/A 25
MSR 41 84 N/A N/A 67
Saint Kitts 14 11 N/A N/A 12
Saint Lucia 29 33.18 N/A N/A 31.24
SVG 30.5 35.51 N/A N/A 33.33
Suriname N/A N/A N/A N/A 54.16
TCI N/A N/A N/A N/A 24.2
Trinidad 47 55 55 26 52
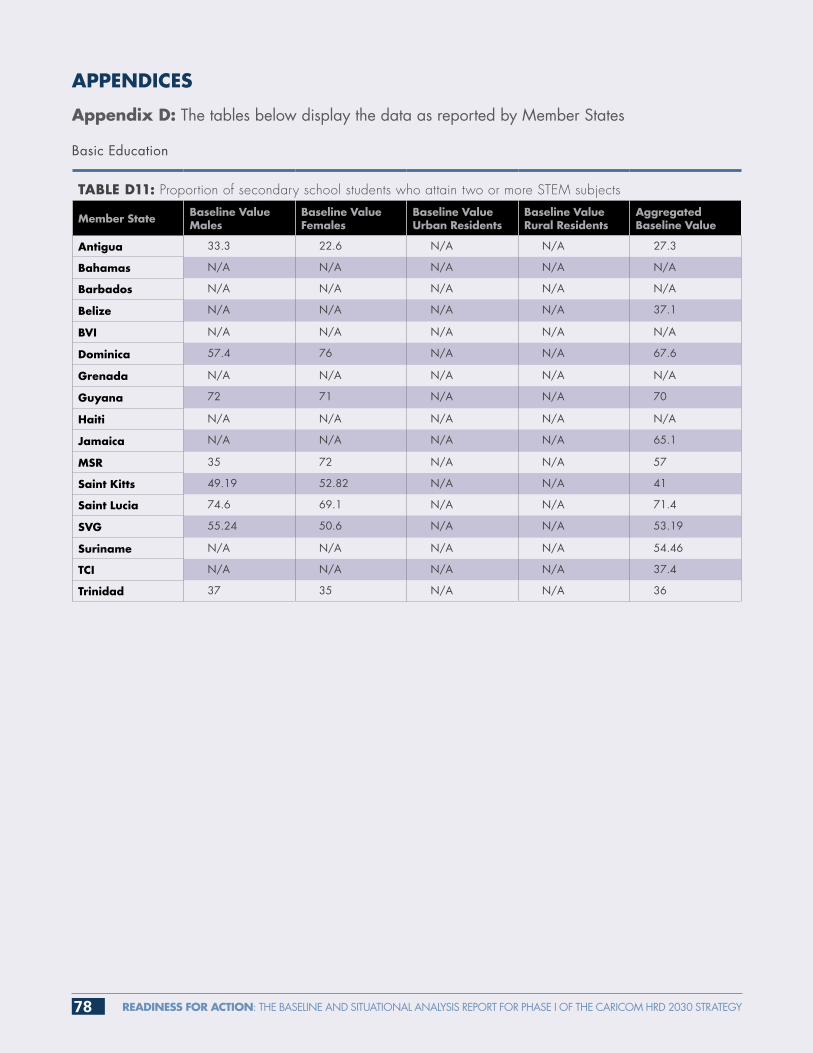
78 READINESS FOR ACTION: THE BASELINE AND SITUATIONAL ANALYSIS REPORT FOR PHASE I OF THE CARICOM HRD 2030 STRATEGY
TABLE D11: Proportion of secondary school students who attain two or more STEM subjects
Member State Baseline Value Males
Baseline Value Females
Baseline Value Urban Residents
Baseline Value Rural Residents
Aggregated Baseline Value
Antigua 33.3 22.6 N/A N/A 27.3
Bahamas N/A N/A N/A N/A N/A
Barbados N/A N/A N/A N/A N/A
Belize N/A N/A N/A N/A 37.1
BVI N/A N/A N/A N/A N/A
Dominica 57.4 76 N/A N/A 67.6
Grenada N/A N/A N/A N/A N/A
Guyana 72 71 N/A N/A 70
Haiti N/A N/A N/A N/A N/A
Jamaica N/A N/A N/A N/A 65.1
MSR 35 72 N/A N/A 57
Saint Kitts 49.19 52.82 N/A N/A 41
Saint Lucia 74.6 69.1 N/A N/A 71.4
SVG 55.24 50.6 N/A N/A 53.19
Suriname N/A N/A N/A N/A 54.46
TCI N/A N/A N/A N/A 37.4
Trinidad 37 35 N/A N/A 36
APPENDICES
Appendix D: The tables below display the data as reported by Member States
Basic Education
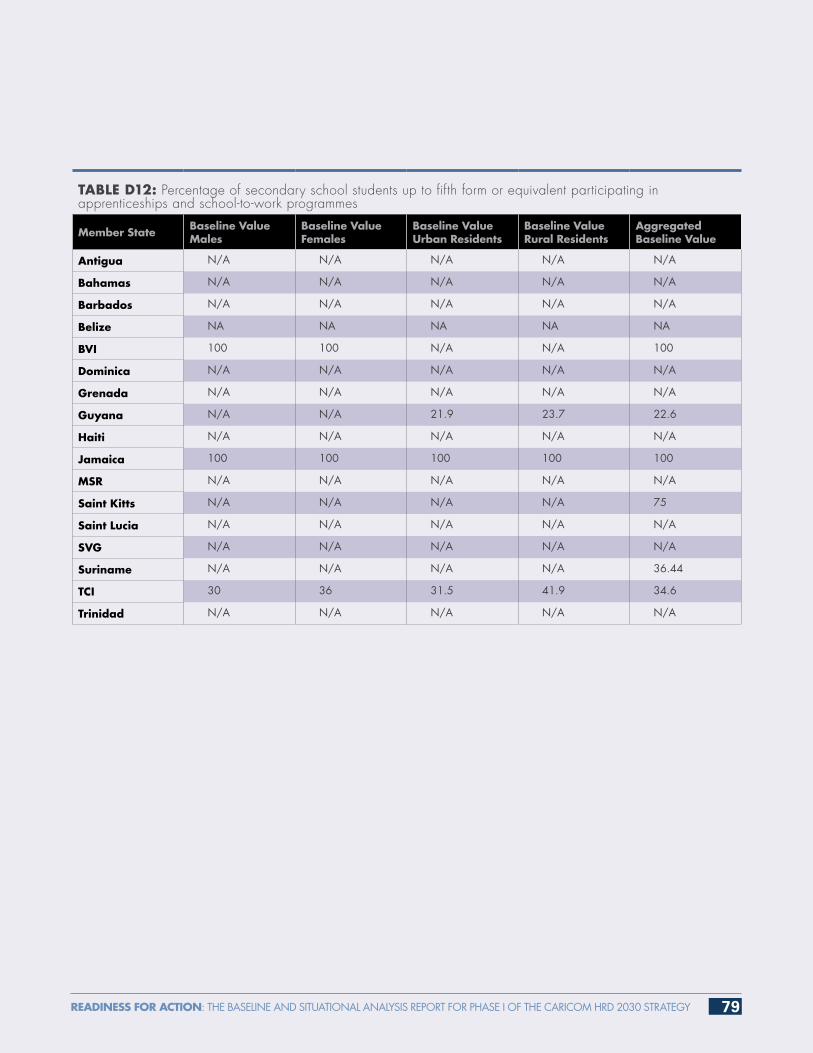
READINESS FOR ACTION: THE BASELINE AND SITUATIONAL ANALYSIS REPORT FOR PHASE I OF THE CARICOM HRD 2030 STRATEGY 79
TABLE D12: Percentage of secondary school students up to fifth form or equivalent participating in apprenticeships and school-to-work programmes
Member State Baseline Value Males
Baseline Value Females
Baseline Value Urban Residents
Baseline Value Rural Residents
Aggregated Baseline Value
Antigua N/A N/A N/A N/A N/A
Bahamas N/A N/A N/A N/A N/A
Barbados N/A N/A N/A N/A N/A
Belize NA NA NA NA NA
BVI 100 100 N/A N/A 100
Dominica N/A N/A N/A N/A N/A
Grenada N/A N/A N/A N/A N/A
Guyana N/A N/A 21.9 23.7 22.6
Haiti N/A N/A N/A N/A N/A
Jamaica 100 100 100 100 100
MSR N/A N/A N/A N/A N/A
Saint Kitts N/A N/A N/A N/A 75
Saint Lucia N/A N/A N/A N/A N/A
SVG N/A N/A N/A N/A N/A
Suriname N/A N/A N/A N/A 36.44
TCI 30 36 31.5 41.9 34.6
Trinidad N/A N/A N/A N/A N/A

80 READINESS FOR ACTION: THE BASELINE AND SITUATIONAL ANALYSIS REPORT FOR PHASE I OF THE CARICOM HRD 2030 STRATEGY
TABLE D13: Percentage of students in the final year secondary exposed to career guidance opportunities (career education)
Member State Baseline Value Males
Baseline Value Females
Baseline Value Urban Residents
Baseline Value Rural Residents
Aggregated Baseline Value
Antigua 90 90 0 0 90
Bahamas N/A N/A N/A N/A 98.4
Barbados 100 100 0 0 100
Belize NA NA NA NA NA
BVI 100 100 N/A N/A 100
Dominica 100 100 0 0 100
Grenada 100 100 100 100 100
Guyana N/A N/A N/A N/A N /A
Haiti N/A N/A N/A N/A N/A
Jamaica 100 100 N/A N/A 100
MSR 100 100 N/A N/A 100
Saint Kitts 100 100 0 0 100
Saint Lucia 100 100 N/A N/A 100
SVG ND ND ND N/A N/A
Suriname N/A N/A N/A N/A N/A
TCI 100 100 100 100 100
Trinidad N/A N/A N/A N/A N/A
APPENDICES
Appendix D: The tables below display the data as reported by Member States
Basic Education

READINESS FOR ACTION: THE BASELINE AND SITUATIONAL ANALYSIS REPORT FOR PHASE I OF THE CARICOM HRD 2030 STRATEGY 81
Appendix D: The tables below display the data as reported by Member States
Skills for Lifelong Learning
TABLE D14: Existence of second chance learning or alternative learning programmes for out-of-school youth and adults (2.6HRD)
Member State Existence of multiple curricula pathways and modalities to address personal health and family development among youth and adults
Antigua No report
Bahamas There is at least one programme
Barbados No report
Belize There are programmes
BVI There is at least one programme
Dominica Multiple programmes exist
Grenada No report
Guyana No report
Haiti No report
Jamaica No report
MSR No report
Saint Kitts There is at least one programme
Saint Lucia Multiple programmes exist
SVG No report
Suriname Multiple programmes exist
TCI A Programme exist
Trinidad There are multiple programmes

82 READINESS FOR ACTION: THE BASELINE AND SITUATIONAL ANALYSIS REPORT FOR PHASE I OF THE CARICOM HRD 2030 STRATEGY
APPENDICES
Appendix D: The tables below display the data as reported by Member States
Skills for Lifelong Learning
TABLE D15: Percentage of instructors/trainers trained in competency-based programmes
Member State Baseline Value Males
Baseline Value Females
Baseline Value Urban Residents
Baseline Value Rural Residents
Aggregated Baseline Value
Antigua N/A N/A N/A N/A N/A
Bahamas N/A N/A N/A N/A N/A
Barbados N/A N/A N/A N/A N/A
Belize NA NA NA NA NA
BVI 92 44 N/A N/A N/A
Dominica N/A N/A N/A N/A N/A
Grenada N/A N/A N/A N/A N/A
Guyana N/A N/A N/A N/A N/A
Haiti N/A N/A N/A N/A N/A
Jamaica N/A N/A N/A N/A N/A
MSR N/A N/A N/A N/A N/A
Saint Kitts N/A N/A N/A N/A 14
Saint Lucia N/A N/A N/A N/A N/A
SVG 13 13 N/A N/A 26
Suriname 57.19 39.62 N/A N/A 44.92
TCI N/A N/A N/A N/A 23
Trinidad 81 91 N/A N/A 87

READINESS FOR ACTION: THE BASELINE AND SITUATIONAL ANALYSIS REPORT FOR PHASE I OF THE CARICOM HRD 2030 STRATEGY 83
TABLE D16: Existence of curricula and/or programmes for youth and adults, which address personal health and family, and other skills-based development (4.8 HRD)
Member State Existence of multiple curricula pathways and modalities to address personal health and family development among youth and adults
Antigua No report
Bahamas There is a programme
Barbados No report
Belize There is a programme
BVI No report
Dominica No report
Grenada No report
Guyana There is a programme
Haiti No report
Jamaica No report
MSR No report
Saint Kitts There is a programme
Saint Lucia There is a programme
SVG No report
Suriname There is a programme
TCI There is no programme
Trinidad There is a programme

84 READINESS FOR ACTION: THE BASELINE AND SITUATIONAL ANALYSIS REPORT FOR PHASE I OF THE CARICOM HRD 2030 STRATEGY
APPENDICES
Appendix D: The tables below display the data as reported by Member States
Tertiary Education
TABLE D17: Percentage of students enrolled in STEM programmes at the tertiary education level
Member State Baseline Value Males
Baseline Value Females
Baseline Value Urban Residents
Baseline Value Rural Residents
Aggregated Baseline Value
Antigua N/A N/A N/A N/A N/A
Bahamas N/A N/A N/A N/A 32.65
Barbados N/A N/A N/A 32
Belize 38.9 25.9 NA NA 30.1
BVI 68 44 N/A N/A 56
Dominica N/A N/A N/A N/A N/A
Grenada N/A N/A N/A N/A N/A
Guyana 55 33 NA NA 41
Haiti N/A N/A N/A N/A N/A
Jamaica N/A N/A N/A N/A N/A
MSR 77 74 N/A N/A 75
Saint Kitts 35 16 N/A N/A 24
Saint Lucia N/A N/A N/A N/A 45.4
SVG N/A N/A N/A N/A N/A
Suriname N/A N/A N/A N/A N/A
TCI N/A N/A N/A N/A 32.9
Trinidad 54 20 N/A N/A 32

READINESS FOR ACTION: THE BASELINE AND SITUATIONAL ANALYSIS REPORT FOR PHASE I OF THE CARICOM HRD 2030 STRATEGY 85
TABLE D18: Gender Parity Index (GPI) at Tertiary Level
Member State GPI Tertiary
Antigua N/A
Bahamas 3.66
Barbados N/A
Belize 1.69
BVI 1.8
Dominica N/A
Grenada N/A
Guyana N/A
Haiti N/A
Jamaica 2.16
MSR N/A
Saint Kitts 1.58
Saint Lucia 1.89
SVG N/A
Suriname 2.8
TCI N/A
Trinidad 2.40
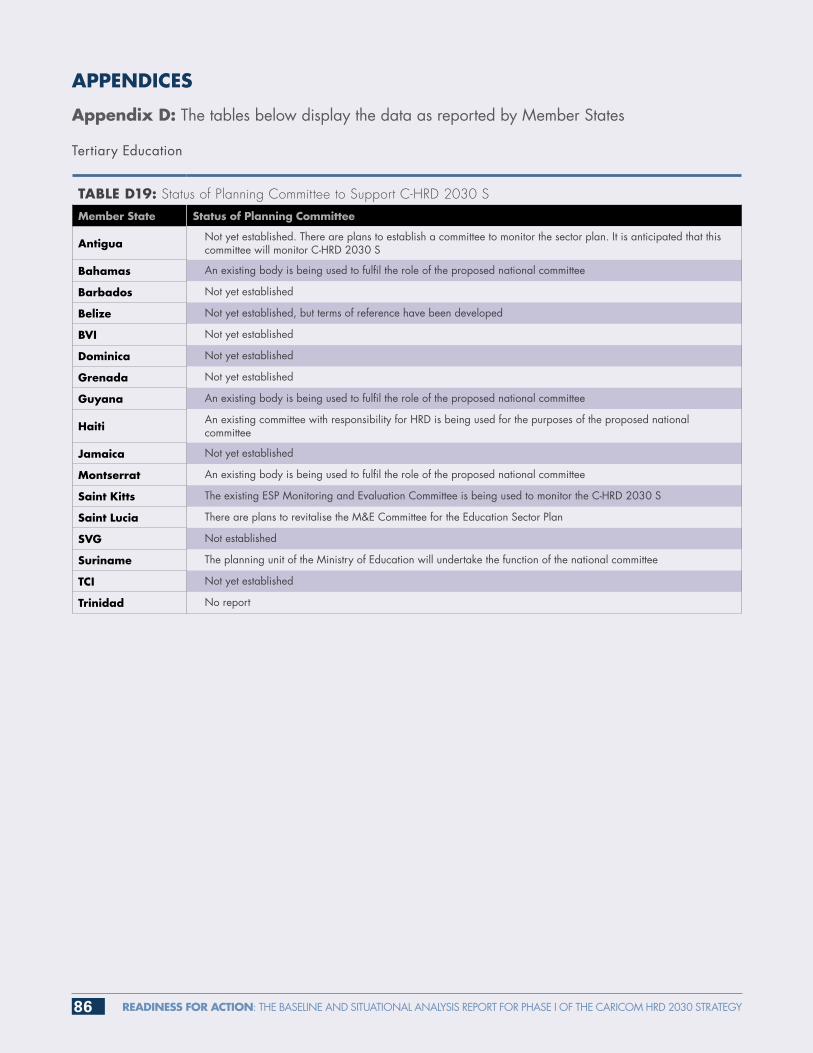
86 READINESS FOR ACTION: THE BASELINE AND SITUATIONAL ANALYSIS REPORT FOR PHASE I OF THE CARICOM HRD 2030 STRATEGY
APPENDICES
Appendix D: The tables below display the data as reported by Member States
Tertiary Education
TABLE D19: Status of Planning Committee to Support C-HRD 2030 S
Member State Status of Planning Committee
AntiguaNot yet established. There are plans to establish a committee to monitor the sector plan. It is anticipated that this committee will monitor C-HRD 2030 S
Bahamas An existing body is being used to fulfil the role of the proposed national committee
Barbados Not yet established
Belize Not yet established, but terms of reference have been developed
BVI Not yet established
Dominica Not yet established
Grenada Not yet established
Guyana An existing body is being used to fulfil the role of the proposed national committee
HaitiAn existing committee with responsibility for HRD is being used for the purposes of the proposed national committee
Jamaica Not yet established
Montserrat An existing body is being used to fulfil the role of the proposed national committee
Saint Kitts The existing ESP Monitoring and Evaluation Committee is being used to monitor the C-HRD 2030 S
Saint Lucia There are plans to revitalise the M&E Committee for the Education Sector Plan
SVG Not established
Suriname The planning unit of the Ministry of Education will undertake the function of the national committee
TCI Not yet established
Trinidad No report


Published byThe CARICOM Secretariat in collaborationwith Caribbean Development Bank (CDB) and the Regional Network of Planning Officers CARICOM Secretariat (2019)Georgetown, Guyana
Caribbean Development BankP.O. Box 408Wildey,St. MichaelBarbadosBB11000Tel: (246) 431-1600Fax: (246) 426-7269Website: [email protected]/caribbeandevelopmentbankwww.twitter.com/caribankwww.youtube.com/caribank
9 789766 004446
ISBN 978-976-600-444-6