read a chapter pdf 2.31 mb
TRANSCRIPT

1
1.1 Introduction
In the past, results of standard tests such as tensile strength, Izod impact strength and softening point have been given major emphasis in the technical literature on plastics. More recently, however, with the increasing use of plastics in more critical applications, there has been a growing awareness of the need to supplement such information with data obtained from tests more closely simulating operational conditions.
For many applications, the choice of material used depends upon a balance of stiffness, toughness, processability and price. For a particular application, a compromise between these features will usually be necessary. For example, it is generally true that, within a given family of grades of a particular polymer, the rigidity increases as impact strength decreases. Again, processing requirements may place an upper or a lower limit on the molecular weight (MW) of the polymer that can be used, and this will frequently influence the mechanical properties quite markedly. Single test values of a given property are a less reliable guide to operational behaviour with plastics than with metals. This is because for plastics the great mass of empirical experience and tradition of effective design which has been built up over centuries in the field of metals is not yet available. Furthermore, no single value can be placed on the stiffness or the toughness of a plastic because:
• Stiffnesswillvarywithtime,stressandtemperature.
• Toughnessisinfluencedbythedesignandsizeofthecomponent,thedesignofthe mould, processing conditions and the temperature of use.
• Stiffnessandtoughnesscanbeaffectedbyenvironmentaleffectssuchasthermaland oxidative ageing, ultraviolet (UV) ageing and chemical attack (including the special case of environmental stress corrosion).
In addition, a change in a specific polymer parameter may affect processability and basic physical properties. Both of these factors can interact in governing the behaviour of a fabricated article. Comprehensive experimental data are therefore necessary to understand effectively the behaviour of plastic materials, and to give a realistic and reliable guide to the selection of material and grade.
1 Mechanical Properties of Polymers

2
Physical Testing of Plastics
In many applications, plastics are replacing traditional materials. Hence, there is often a natural tendency to apply to plastics tests similar to those that have been found suitable for gauging the performance of the traditional material. Dangers can obviously arise if plastics are selected on the basis of these tests without clearly recognising that the correlation between values of laboratory performance and field performance may be quite different for the two classes of materials.
It is therefore important to realise that standard tests are not devised to give direct prediction of end-use performance. In general, the reverse is the case. That is, if a particular grade of a particular polymer is found to perform satisfactorily in a given end use, it can then be characterised with reasonable accuracy by standard tests, and the latter tests then used to ensure the maintenance of the required end-use quality.
Availability of instrumentation for mechanical testing is discussed in Appendix 1.
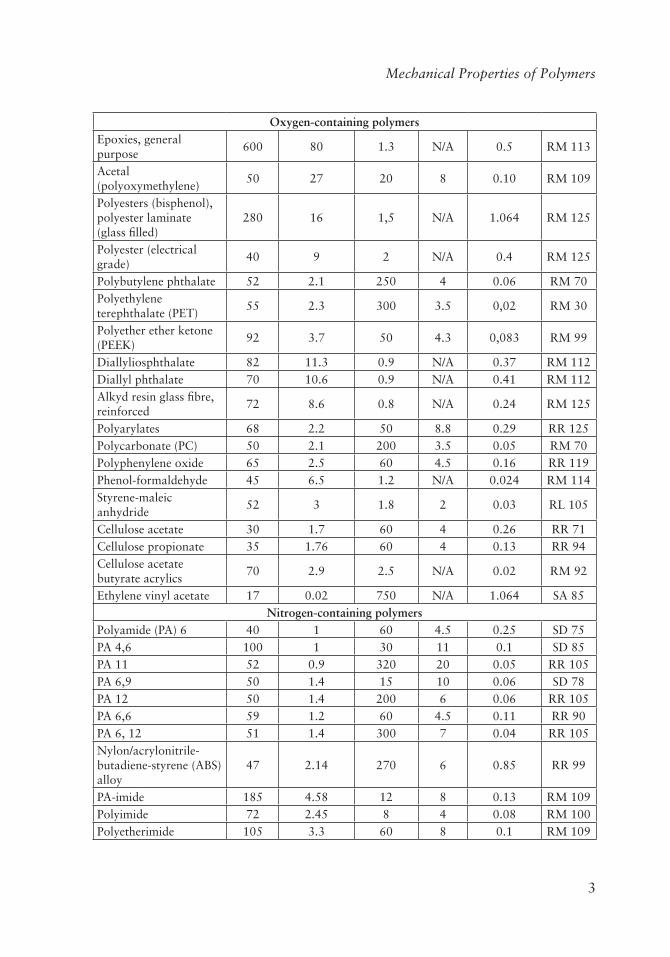
Typical mechanical properties of a range of polymers are listed in Table 1.1.
Table 1.1 Mechanical properties of polymers
PolymerTensile strength (MPa)
Flexural modulus/
(modulus of elasticity)
(GPa)
Elongation at break
(%)
Strain at yield
(%)
Notched Izod impact
strength (kJ/m)
Surface hardness
Carbon/hydrogen-containing polymersLow-density polyethylene (LDPE)
10 0.25 400 19 1.064 SD 48
High-density polyethylene (HDPE)
32 1.25 150 15 0.15 SD 68
Crosslinked polyethylene (PE)
18 0.5 350 N/Y 1.064 SD 58
Polypropylene (PP) 26 2 80 N/Y 0.05 RR 85Ethylene-propylene 26 0.6 500 N/Y 0.15 RR75Polymethyl pentene 28 1.5 15 6 0.04 RR 70Styrene-butadiene 28 1.6 50 N/Y 0.08 SD 75Styrene-ethylene-butylene-styrene
6 0.02 800 N/Y 1.064 SA 45
High-impact polystyrene (PS)
42 2.1 2.5 1.8 0.1 RM 30
PS, general purpose 34 3 1.6 RM 80
3
Mechanical Properties of Polymers
Oxygen-containing polymersEpoxies, general purpose
600 80 1.3 N/A 0.5 RM 113
Acetal (polyoxymethylene)
50 27 20 8 0.10 RM 109
Polyesters (bisphenol), polyester laminate (glass filled)
280 16 1,5 N/A 1.064 RM 125
Polyester (electrical grade)
40 9 2 N/A 0.4 RM 125
Polybutylene phthalate 52 2.1 250 4 0.06 RM 70Polyethylene terephthalate (PET)
55 2.3 300 3.5 0,02 RM 30
Polyether ether ketone (PEEK)
92 3.7 50 4.3 0,083 RM 99
Diallyliosphthalate 82 11.3 0.9 N/A 0.37 RM 112Diallyl phthalate 70 10.6 0.9 N/A 0.41 RM 112Alkyd resin glass fibre, reinforced
72 8.6 0.8 N/A 0.24 RM 125
Polyarylates 68 2.2 50 8.8 0.29 RR 125Polycarbonate (PC) 50 2.1 200 3.5 0.05 RM 70Polyphenylene oxide 65 2.5 60 4.5 0.16 RR 119Phenol-formaldehyde 45 6.5 1.2 N/A 0.024 RM 114Styrene-maleic anhydride
52 3 1.8 2 0.03 RL 105
Cellulose acetate 30 1.7 60 4 0.26 RR 71Cellulose propionate 35 1.76 60 4 0.13 RR 94Cellulose acetate butyrate acrylics
70 2.9 2.5 N/A 0.02 RM 92
Ethylene vinyl acetate 17 0.02 750 N/A 1.064 SA 85Nitrogen-containing polymers
Polyamide (PA) 6 40 1 60 4.5 0.25 SD 75PA 4,6 100 1 30 11 0.1 SD 85PA 11 52 0.9 320 20 0.05 RR 105PA 6,9 50 1.4 15 10 0.06 SD 78PA 12 50 1.4 200 6 0.06 RR 105PA 6,6 59 1.2 60 4.5 0.11 RR 90PA 6, 12 51 1.4 300 7 0.04 RR 105Nylon/acrylonitrile-butadiene-styrene (ABS) alloy
47 2.14 270 6 0.85 RR 99
PA-imide 185 4.58 12 8 0.13 RM 109Polyimide 72 2.45 8 4 0.08 RM 100Polyetherimide 105 3.3 60 8 0.1 RM 109
4
Physical Testing of Plastics
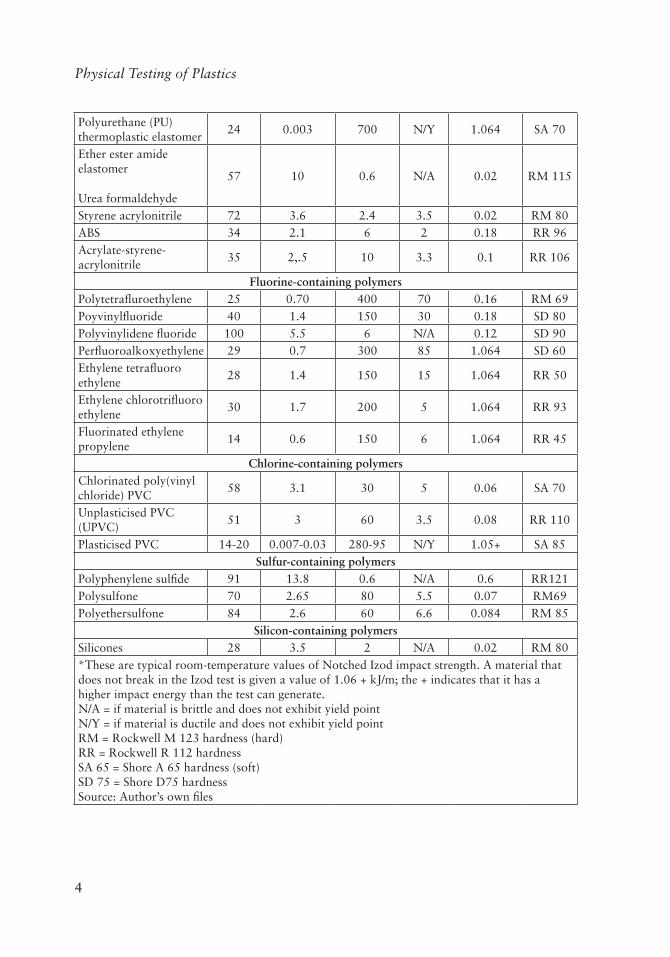
Polyurethane (PU) thermoplastic elastomer
24 0.003 700 N/Y 1.064 SA 70
Ether ester amide elastomer
Urea formaldehyde
57 10 0.6 N/A 0.02 RM 115
Styrene acrylonitrile 72 3.6 2.4 3.5 0.02 RM 80ABS 34 2.1 6 2 0.18 RR 96Acrylate-styrene-acrylonitrile
35 2,.5 10 3.3 0.1 RR 106
Fluorine-containing polymersPolytetrafluroethylene 25 0.70 400 70 0.16 RM 69Poyvinylfluoride 40 1.4 150 30 0.18 SD 80Polyvinylidene fluoride 100 5.5 6 N/A 0.12 SD 90Perfluoroalkoxyethylene 29 0.7 300 85 1.064 SD 60Ethylene tetrafluoro ethylene
28 1.4 150 15 1.064 RR 50
Ethylene chlorotrifluoro ethylene
30 1.7 200 5 1.064 RR 93
Fluorinated ethylene propylene
14 0.6 150 6 1.064 RR 45
Chlorine-containing polymersChlorinated poly(vinyl chloride) PVC
58 3.1 30 5 0.06 SA 70
Unplasticised PVC (UPVC)
51 3 60 3.5 0.08 RR 110
Plasticised PVC 14-20 0.007-0.03 280-95 N/Y 1.05+ SA 85Sulfur-containing polymers
Polyphenylene sulfide 91 13.8 0.6 N/A 0.6 RR121Polysulfone 70 2.65 80 5.5 0.07 RM69Polyethersulfone 84 2.6 60 6.6 0.084 RM 85
Silicon-containing polymersSilicones 28 3.5 2 N/A 0.02 RM 80*These are typical room-temperature values of Notched Izod impact strength. A material that does not break in the Izod test is given a value of 1.06 + kJ/m; the + indicates that it has a higher impact energy than the test can generate. N/A = if material is brittle and does not exhibit yield point N/Y = if material is ductile and does not exhibit yield point RM = Rockwell M 123 hardness (hard) RR = Rockwell R 112 hardness SA 65 = Shore A 65 hardness (soft) SD 75 = Shore D75 hardness Source: Author’s own files
5
Mechanical Properties of Polymers
Each of those measurements will now be discussed in further detail.
1.2 Tensile Strength
This is the room temperature tensile strength at yield for ductile materials and at break for brittle materials. An excellent rating indicates high tensile strength, and a very poor rating indicates low tensile strength. The values given in Table 1.1 are typical room-temperature values taken at break for brittle materials and at yield for ductile materials.
1.2.1 Electronic Dynamometer Testing of Tensile Properties
ATS FAAR supplies the Series TC200 computer-governed dynamometer, which can carry out tensile, compression, and flexural tests on a variety of material. All details of the tests are managed, including computing the final results and presenting them in alphanumerical or graphical form. Moreover, the use of a personal computer (PC) for the management of dynamometers gives the extra advantage of storing (at will) the results of the tests in an electronic data file which can be utilised to obtain organised print-outs, historical series, and go-no-go checks. Full automation of all operations (including computations) increases the precision, reproducibility, and speed of analysis due to the elimination of otherwise unavoidable human errors.
Tests that can be carried out by this dynamometer include those listed below and those shown in Table 1.2:
• Tensilestrength(tensilemodulus)testswithorwithoutpreloading,accordingtospecifications of ASTM D638-03 [1], DIN EN ISO, 527-1 [2] and DIN EN ISO 527-2 [3].
• CompressionandcompressivestrengthtestsaccordingtospecificationsASTMD695-02a [4] and DIN EN ISO 179-1 [5].
• FlexuralandflexuralstrengthtestsaccordingtospecificationsASTMD790-03[6], ASTM D732 [7] and DIN EN ISO 178 [8].

6
Physical Testing of Plastics
Table 1.2 Mechanical properties of polymers using the Dyanometer testMethod ATS FAAR
Apparatus code number
Measurement units
Test suitable for meeting the following standards
Tensile impact strength
16.10050 kJ/m2 DIN EN ISO 8256 [9]
Tensile strength (tensile modulus)
16.00121 16.00122 16.00126 16.00127
N/mm2
Psi kg/cm2
ASTM D638-03 [1] DIN EN ISO 527-1 [2] DIN EN ISO 527-2 [3]
Compression strength and compressive stress
16.00121 16.00122 16.00126 16.00127
N/mm2
Psi N/mm2
ASTM D695-02a [4] DIN EN ISO 604 [23]
Flexural strength (Dyanometer)
16.00121 16.00122 16.00126 16.00127
N/mm2
Psi kg/cm2
ASTM D790-03 [6] ASTM D732 [7] DIN EN ISO 178 [8]
ASTM = American Society for Testing and Materials DIN EN ISO = Deutsches Institut für Normung Europa Norm International Standards Organization Source: Author’s own files
The TC 100 instrument can also undertake cycles between preset limits, creep and relaxation studies, peeling experiments, and measurement of friction co-efficient and puncture resistance of films.
Typical tensile strength data are quoted in Table 1.1.
Polymers of excellent tensile strength (i.e., >100 MPa) include: epoxies, polyester laminates, polyamide (PA) 4/6, PA-imide, polyetherimide, polyvinylidene fluoride.
Polymers with very good impact strength (i.e., 60-100 MPa) include: acetals, polybutylene terephthalete, polyethylene terephthalate (PET), polyallylphthalate, polyetherketone, polycarbonate (PC), polyphenylene, styrene-maleic acid, copolymer, acrylics, PA 11, PA 6/9, PA 12, polyimide 6/6 PA 6/12, polyimide: urea-formaldehyde, styrene-acrylonitrile copolymer, chlorinated polyvinyl chloride (PVC), polyphenylene sulfide, polysulfone, silicones, and alkyd resins.

7
Mechanical Properties of Polymers
Tab
le 1
.3 I
dent
ifica
tion
of
poly
mer
s w
ith
outs
tand
ing
tens
ile s
tren
gth
and
flexu
ral m
odul
us
Poly
mer
Ten
sile
st
reng
th
(MPa
)
Flex
ural
m
odul
us
(GPa
)
Elo
ngat
ion
at b
reak
(%
)
Stra
in
at y
ield
(%
)
Not
ched
Iz
od
(kJ/
m)
Exc
elle
nt o
r go
od
perf
orm
ance
in t
he
follo
win
g
Poor
per
form
ance
in
the
follo
win
g
Epo
xies
, gen
eral
pu
rpos
e60
080
13N
ot
appl
icab
le
(N/A
)
0.5
Tens
ile s
tren
gth,
flex
ural
m
odul
us, d
eter
gent
re
sist
ance
, res
ista
nce
to
gam
ma
radi
atio
n, h
eat
dist
orti
on t
empe
ratu
re
(HD
T),
wea
r pr
oper
ties
, low
re
sin
shri
nkag
e du
ring
cur
e
Poor
sur
face
fini
sh,
high
cos
t, e
long
atio
n at
bre
ak a
nd v
olum
e re
sist
ivit
y
Poly
este
rs
(bis
phen
ol p
olye
ster
la
min
ate)
gla
ss fi
lled
280
161.
5N
/A1.
06 +
Impa
ct s
tren
gth
and
chea
p w
hen
com
pare
d w
ith
epox
ies
Hea
t re
sist
ance
, sol
vent
re
sist
ance
, elo
ngat
iona
l at
bre
ak
Poly
este
r, sh
eet
mou
ldin
g co
mpo
und
7011
2.5
N/A
0.8
Hig
h fle
xura
l mod
ulus
, he
at d
isto
rtio
n te
mpe
ratu
re
(HD
T),
res
ista
nce
to U
V
and
gam
ma
irra
diat
ion,
to
ughn
ess
Mor
e ex
pens
ive
than
po
lyes
ters
. Die
lect
ric
cons
tant
, die
lect
ric
stre
ngth
, flam
e sp
read
, hy
drol
ytic
sta
bilit
y,
elon
gati
on s
tabi
lity,
H
DT
PA 4
,610
01
3011
0.1
Rea
sona
ble
HD
T, g
ood
chem
ical
res
ista
nce
Moi
stur
e ab
sorp
tion
Poly
viny
liden
e flu
orid
e (2
0%
carb
on fi
bre-
rein
forc
ed)
100
5.5
6N
/A0.
12Te
nsile
str
engt
h, fl
exur
al
mod
ulus
, HD
T, d
eter
gent
re
sist
ance
, hyd
roly
tic
stab
ility
Elo
ngat
ion
at b
reak
, ex
pens
ive,
gam
ma
irra
diat
ion
resi
stan
ce,
diel
ectr
ic p
rope
rtie
s,
surf
ace
finis
h, t
ough
ness
8
Physical Testing of PlasticsPo
lyet
heri
mid
e10
53.
360
80.
10Te
nsile
str
engt
h, c
ost,
ox
ygen
inde
x, d
eter
gent
re
sist
ance
, gam
ma
irra
diat
ion
and
UV
re
sist
ance
Stre
ss c
rack
ing
wit
h ch
lori
nate
d so
lven
ts,
notc
hed
impa
ct
stre
ngth
, hig
h co
st,
trac
king
, res
ista
nce,
fle
xura
l mod
ulus
, to
ughn
ess
Poly
phen
ylen
e su
lfide
(gl
ass
fibre
-re
info
rced
)
9113
.80.
6N
/A0.
031
Flex
ural
str
engt
h, fl
exur
al
mod
ulus
Ele
ctri
cal p
rope
rtie
s,
notc
hed
Izod
Dia
llyl i
so-p
htha
late
(l
ong
glas
s fib
re-
rein
forc
ed)
8211
.30.
9N
/A0.
37Te
nsile
str
engt
h, fl
exur
al
mod
ulus
, not
ched
Izo
d,
dete
rgen
t re
sist
ance
, HD
T,
trac
king
res
ista
nce,
UV
ra
diat
ion
Vol
ume
resi
stan
ce,
diel
ectr
ic s
tren
gth,
di
ssip
atio
n fa
ctor
, fla
mm
abili
ty, h
ydro
lyti
c st
abili
ty, h
igh
cost
, el
onga
tion
at
brea
k
Dia
llyl p
htha
late
7010
.60.
90.
41Te
nsile
str
engt
h, fl
exur
al
mod
ulus
, not
ched
Izo
d,
dete
rgen
t re
sist
ance
, HD
T,
trac
king
res
ista
nce,
UV
ra
diat
ion
Vol
ume
resi
stan
ce,
diel
ectr
ic s
tren
gth,
di
ssip
atio
n fa
ctor
, fla
mm
abili
ty, h
ydro
lyti
c st
abili
ty, h
igh
cost
, el
onga
tion
at
brea
k
Poly
sulf
one
702.
6580
5.5
0.07
Hig
h te
mpe
ratu
re
perf
orm
ance
, ele
ctri
cal
prop
erti
es, h
ydro
lyti
c re
sist
ance
, ten
sile
str
engt
h,
dim
ensi
onal
sta
bilit
y
Surf
ace
finis
h
Poly
acry
late
s68
2.2
5015
1.06
+Im
pact
str
engt
h, h
eat
resi
stan
ce a
nd U
V r
esis
tanc
eSt
ress
cra
ckin
g w
ith
hydr
ocar
bons
, nee
ds
350
°C p
roce
ssin
g te
mpe
ratu
re.
Sour
ce: A
utho
r’s
own
files
9
Mechanical Properties of Polymers
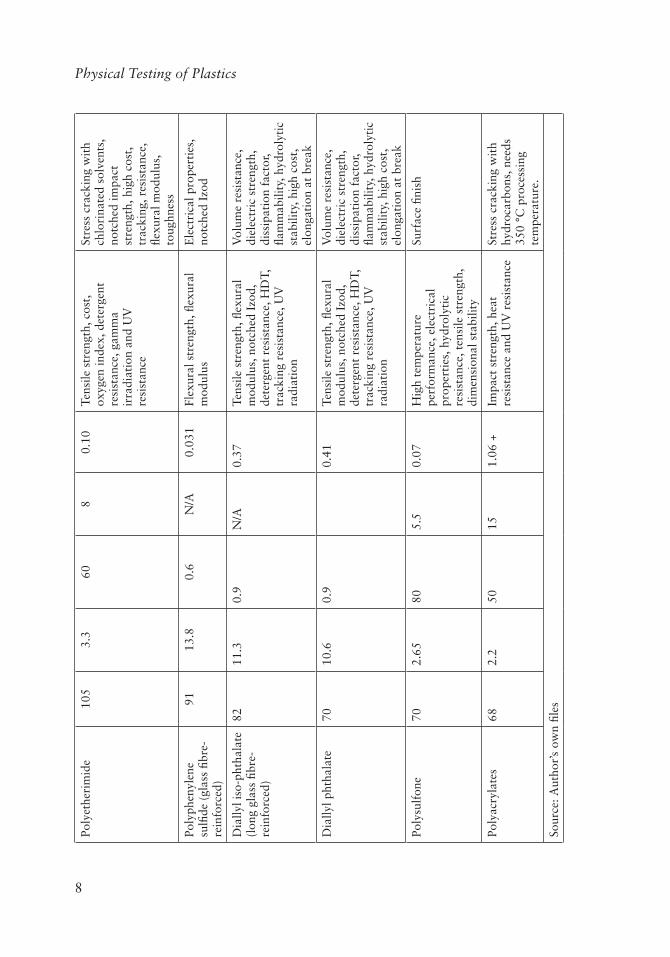
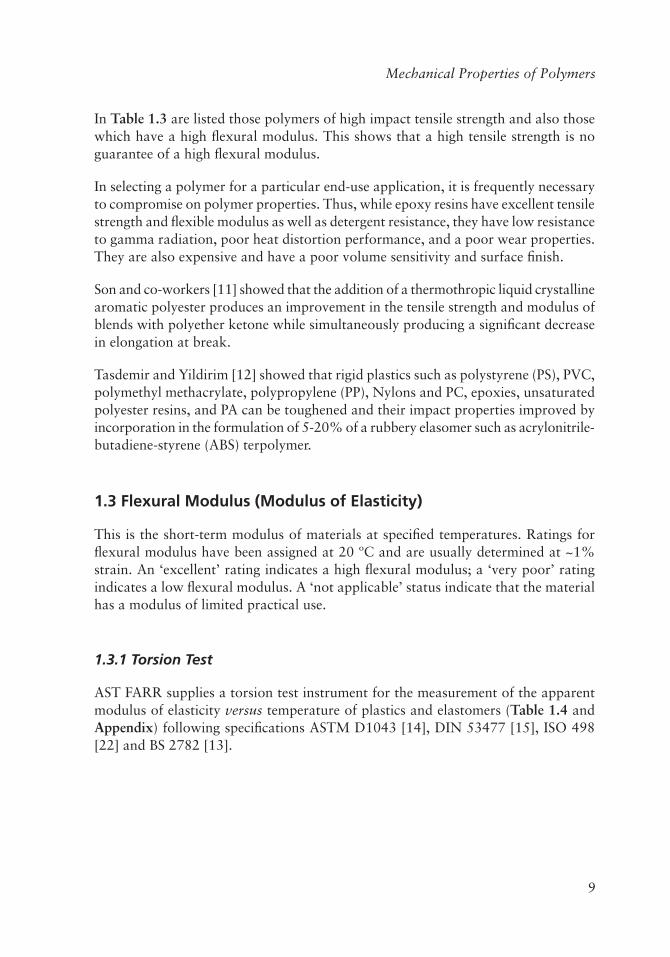
In Table 1.3 are listed those polymers of high impact tensile strength and also those which have a high flexural modulus. This shows that a high tensile strength is no guarantee of a high flexural modulus.
In selecting a polymer for a particular end-use application, it is frequently necessary to compromise on polymer properties. Thus, while epoxy resins have excellent tensile strength and flexible modulus as well as detergent resistance, they have low resistance to gamma radiation, poor heat distortion performance, and a poor wear properties. They are also expensive and have a poor volume sensitivity and surface finish.
Son and co-workers [11] showed that the addition of a thermothropic liquid crystalline aromatic polyester produces an improvement in the tensile strength and modulus of blends with polyether ketone while simultaneously producing a significant decrease in elongation at break.
Tasdemir and Yildirim [12] showed that rigid plastics such as polystyrene (PS), PVC, polymethyl methacrylate, polypropylene (PP), Nylons and PC, epoxies, unsaturated polyester resins, and PA can be toughened and their impact properties improved by incorporation in the formulation of 5-20% of a rubbery elasomer such as acrylonitrile-butadiene-styrene (ABS) terpolymer.
1.3 Flexural Modulus (Modulus of Elasticity)
This is the short-term modulus of materials at specified temperatures. Ratings for flexural modulus have been assigned at 20 ºC and are usually determined at ~1% strain. An ‘excellent’ rating indicates a high flexural modulus; a ‘very poor’ rating indicates a low flexural modulus. A ‘not applicable’ status indicate that the material has a modulus of limited practical use.
1.3.1 Torsion Test
AST FARR supplies a torsion test instrument for the measurement of the apparent modulus of elasticity versus temperature of plastics and elastomers (Table 1.4 and Appendix) following specifications ASTM D1043 [14], DIN 53477 [15], ISO 498 [22] and BS 2782 [13].

10
Physical Testing of Plastics
Table 1.4 Modulus of elasticity of polymers Method ATS FAAR
Apparatus code
number
Measurement units
Test suitable for meeting the following standards
Modulus elasticity versus temperature (torsion test)
10.22000
10.22001
GPa ASTM D1043 [14] DIN 53477 [15] ISO 458 [16] BS 2782 [13]
Modulus of elasticity or flexural modulus (bend test)
10.29000 kN/mm2
psi kg/cm2
ASTM D1896 [17] ASTM D3419 [18] ASTM D3641 [19] ASTM D4703 [20] ASTM D5227 [21] DIN EN ISO 178 [8] DIN EN ISO 527-1 [2] DIN EN ISO 527-2 [3] DIN EN ISO 604 [26]
Source: Author’s own files
This apparatus consists of an assembly of interdependent units. It is compact and very easy to operate. It features an accurate torque applications system with a broad angular measurement range.
The temperature is electronically controlled and the fully automatic system of pre-setting heating periods and torque is electronic. The apparatus is equipped with a set of weights allowing a wide range of torques to be applied to specimens having difference dimensions. The distance between the clamps can be varied in the range 20-100 mm.
It is thus possible to measure accurately the apparent modulus of elasticity of specimens obtained from a wide range of materials. The modulus is, in this case, defined as ‘apparent’ because it is obtained by measuring the angular torsion of the specimens under test.
In its regular version, the apparatus can conduct tests in the temperature range -100 ºC to +100 ºC. A special version, however, allows one to run tests between 100 ºC and +300 ºC. The torque application system is assembled on ball bearings of very

11
Mechanical Properties of Polymers
reduced dimensions and utilises the same ‘pivot’ contrivance used in watch making. As a consequence, all radial frictions are reduced to zero and the main pulley can be rotated even if applying torques <0.0005 N/m. The initial zero point can be adjusted so as to allow tests to be undertaken even on specimens having planar deformation between +5º and -5º. Cooling is obtained by solid carbon dioxide or by liquid nitrogen so as to achieve maximum operational flexibility.
1.3.2 Hand Test
ATS FAAR also supply hand test apparatus for the measurement of the modulus of elasticity (flexural modulus) according to specifications ASTM D1869 [17], ASTM D3419 [18], ASTM D3641 [19], ASTM D4703 [20], D ASTM 5227 [21], DIN EN ISO 178, [8] DIN EN ISO 527-1 [2], DIN EN ISO 527-2 [3] and DIN ISO 604 [23] (see Table 1.4).
Table 1.4 Modulus of elasticity of polymers Method ATS FAAR
Apparatus code number
Measurement units
Test suitable for meeting the following standards
Modulus elasticity versus temperature (torsion test)
10.22000 10.22001
GPa ASTM D1043 [14] DIN 53477 [15] ISO 458 [16] BS 2782 [13]
Modulus of elasticity or flexural modulus (bend test)
10.29000 kN/mm2
psi kg/cm2
ASTM D1896 [17] ASTM D3419 [18] ASTM D3641 [19] ASTM D4703 [20] ASTM D5227 [21] DIN EN ISO 178 [8] DIN EN ISO 527-1 [2] DIN EN ISO 527-2 [3] DIN EN ISO 604 [26]
Source: Author’s own files
Janick and Krolikowski [24] investigated the effect of charpy notched impact strength on the flexural modulus of PE and PET. Polymers with good flexible modulus (between
12
Physical Testing of Plastics
6 GPa and 80 GPa) include polydiallyephthalate (11.3 GPa), phenol-formaldehyde (6.5 GPa), alkyd resins (8.6 GPa) and polyphenylene sulfide (13.8 GPa) as well as glass-filled polyesterlaminate (16 GPa) epoxy resins (80 GPa), silica-filled epoxies (15 GPa) and acetals containing 30% carbon fibre (17.2 GPa).
1.4 Elongation at Break
Elongation at break is the strain at which a polymer breaks when tested in tension at a controlled temperature (i.e., the tensile elongation at specimen break).
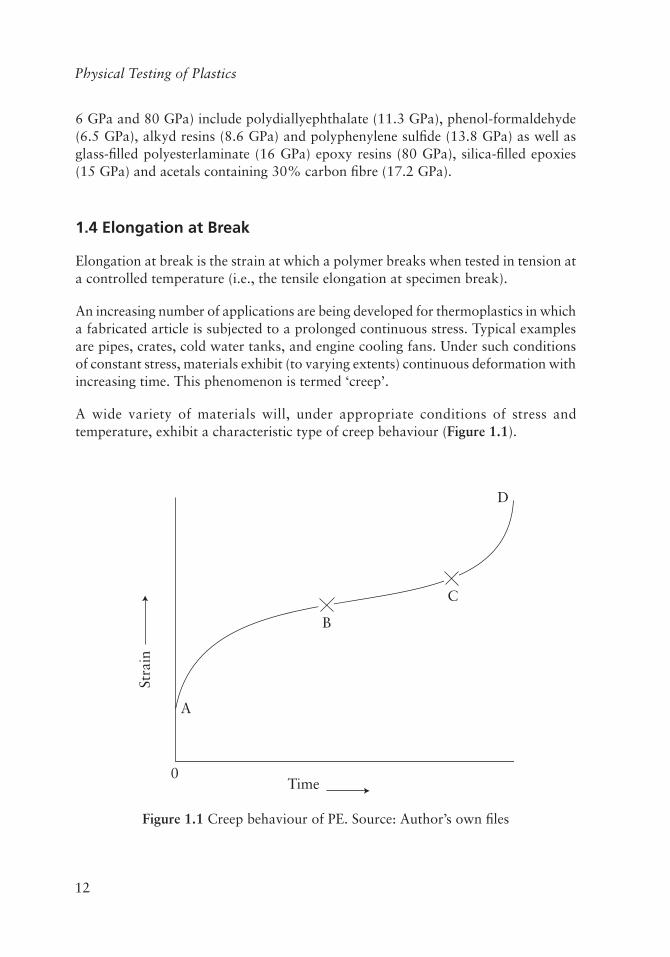
An increasing number of applications are being developed for thermoplastics in which a fabricated article is subjected to a prolonged continuous stress. Typical examples are pipes, crates, cold water tanks, and engine cooling fans. Under such conditions of constant stress, materials exhibit (to varying extents) continuous deformation with increasing time. This phenomenon is termed ‘creep’.
A wide variety of materials will, under appropriate conditions of stress and temperature, exhibit a characteristic type of creep behaviour (Figure 1.1).
Stra
in
A
B
C
D
0Time
Figure 1.1 Creep behaviour of PE. Source: Author’s own files

13
Mechanical Properties of Polymers
The general form of this creep curve can be described as follows. Upon application of the load, an instantaneous elastic deformation occurs (O-A). This is followed by an increase in deformation with time as represented by the portion of the curve A-D. This is the generally accepted classic creep curve, and is usually considered to be divided into three parts:
• A-B:Theprimarystageinwhichcreepratedecreaseslinearlywithtime.
• B-C:Thesecondarystagewherethechangeindimensionswithtimeisconstant(i.e., a constant creep rate).
• C-D:Thetertiarystagewherethecreeprateincreasesagainuntilruptureoccurs.
With thermoplastics, the secondary stage is often only a point of inflection, and the final tertiary stage is usually accompanied by crazing or cracking of the specimen or, at higher stresses, by the onset of necking (i.e., marked local reduction in cross-sectional area). In assessing the practical suitability of plastics, we are interested in the earlier portions of the curve, prior to the onset of the tertiary stage, as well as in the rupture behaviour.
As the values of the stress, temperature, and time of loading vary with differing applications, the type of information extracted from these basic creep data will also vary with the application. There are several alternative methods (some of which are discussed later in this book) of expressing this derived information, but whichever form is used (whether tabular of graphical), it is unlikely to cover all eventualities. It is thus considered of most value to give the actual creep curves and to discuss by means of examples the methods by which particular data can be extracted from these basic creep curves.
Typical creep curves for PE and PP at 23 ºC are shown in Figures 1.2 and 1.3. Lin and co-workers [25] discussed the accuracy of creep phenomena in reinforced PA and PC composites. The phenomenon of increasing dynamic creep and temperature under tension-tension fatigue loading are compared between semi-crystalline and amorphous composites.

14
Physical Testing of Plastics
6
5
4
3
2
1
00.1 1 10
6.2 MPa
4.8 MPa
3.4 MPa
2.1 MPa
1000
Tota
l str
ain
(%)
Time (hours)
Figure 1.2 Creep of high-density polyethylene (HDPE) at 23 ºC. Source: Author’s own files
6
5
4
3
2
1
00.1 1 10
9.7 MPa
11.7 MPa
13.8 MPa
15.9 MPa
5.5 MPa
3.4 MPa
7.6 MPa
1000100
Tota
l str
ain
(%)
Time (hours)
Figure 1.3 Creep of PP homopolymer at 23 ºC. Source: Author’s own files

15
Mechanical Properties of Polymers
To minimise as far as possible the influence of processing variables, studies have been carried out using tensile creep tests on carefully prepared compression moulded specimens. With injection moulded articles, creep properties will also be subject to variation with the amount and direction of residual flow orientation. However, with crystalline polymers such as the polyolefins, creep effects will also be influenced by variations in density caused by a combination of flow orientation, compressive packaging and cooling effects. Stresses will generally be complex and often involve compressive and flexural components. However, articles should be designed to limit the strains occurring to quite low levels, where a reasonable correlation can be expected between tensile, compressive and flexural creep data.
1.4.1 Basic Creep Data
In general, the first step in building up a comprehensive picture of creep behaviour is to obtain creep curves (elongation versus time) at a series of stress levels, each at a series of test temperatures. It is common practice to plot strain on a linear scale against time on a logarithmic scale. Each curve should preferably cover several decades on the logarithmic time scale so that subsequent extrapolations will have a firm foundation.
Wong and co workers [26] combined a commercially available research-grade dynamic mechanical analyser with a Fourier transform infrared (FTIR) spectrometer for the simultaneous mechanical analysis and dynamic IR spectral measurement of films of a polyester urethane elastomer under large amplitude creep deformation. Differential orientation of various segments of the molecule was observed during the creep and recovery process. Permanent damage to the elastomer observed after a large displacement was attributed to the irreversible destruction of its microscopic network structure.
Table 1.5 lists polymers with outstanding percentage elongation at break. High elongation at break is not necessarily accompanied by high tensile strength. Also listed in Table 1.5 are the particularly good and particularly poor performance characteristics which accompany high elongation at break.
Janick and Krolikowski [24] studied the effect of properties such as elongation at break, tensile strength, flexural strength, elastic modulus and fleural modulus on the elongation at break performance of PET–low-density polyethylene (LDPE) and PET-PP blends.

16
Physical Testing of PlasticsT
able
1.5
Ide
ntifi
cati
on o
f po
lym
ers
wit
h ou
tsta
ndin
g el
onga
tion
at
brea
kPo
lym
erT
ensi
le
stre
ngth
(M
Pa)
Flex
ural
m
odul
us
(GPa
)
Elon
gatio
n at
bre
ak
(%)
Stra
in
at y
ield
(%
)
Not
ched
Iz
od
(kJ/
m)
Exc
elle
nt o
r ve
ry g
ood
perf
orm
ance
Poor
per
form
ance
Low
-den
sity
po
lyet
hyle
ne10
0.25
400
191.
06 +
Elo
ngat
ion
at b
reak
, ch
emic
al r
esis
tanc
e,
elec
tric
al p
rope
rtie
s,
cost
, tou
ghne
ss
Tens
ile s
tren
gth,
sti
ffne
ss,
flam
mab
le, U
V r
esis
tanc
e,
envi
ronm
enta
l str
ess
crac
king
Styr
ene-
ethy
lene
-bu
tyle
ne-
styr
ene
60.
0280
0N
o yi
eld
(NY
)
1.06
+E
long
atio
n at
bre
ak,
low
-tem
pera
ture
pr
oper
ties
, ele
ctri
cal
prop
erti
es, t
ough
ness
Abr
asio
n re
sist
ance
, ten
sile
st
reng
th, fl
ame
spre
ad,
flexu
ral m
odul
us
Poly
ethy
lene
te
reph
thal
ate
552.
330
03.
50.
02E
long
atio
n at
bre
ak,
stif
fnes
s, d
eter
gent
re
sist
ance
, ele
ctri
cal
prop
erti
es, e
long
atio
n at
br
eak
Lim
ited
hyd
roly
sis
resi
stan
ce,
high
mou
ld s
hrin
kage
Eth
ylen
e-vi
nyl a
ceta
te
(25%
vin
yla
acet
ate)
170.
0275
0N
Y1.
06 +
Elo
ngat
ion
at b
reak
, co
st, s
trai
n at
yie
ld,
toug
hnes
s
Tens
ile s
tren
gth,
che
mic
al
resi
stan
ce, d
issi
pati
on f
acto
r, fla
mm
abili
ty, h
eat
dist
orti
on
tem
pera
ture
, flex
ural
m
odul
us
Poly
uret
hane
(t
herm
o-pl
asti
c el
asto
mer
)
240.
003
700
NY
1.06
+E
long
atio
n at
bre
ak,
low
tem
pera
ture
ch
arac
teri
stic
s, d
eter
gent
re
sist
ance
, fat
igue
in
dex,
str
ain
at y
ield
, to
ughn
ess
Tens
ile s
tren
gth,
flex
ural
m
odul
us

17
Mechanical Properties of Polymers
Poly
amid
e 12
501.
420
06
0.06
Elo
ngat
ion
at b
reak
, lo
w w
ater
abs
orpt
ion,
to
ughn
ess,
die
lect
ric
stre
ngth
Hig
h co
st, s
tren
gth
and
heat
re
sist
ance
Poly
amid
e 6,
1251
1.4
300
70.
04L
ow w
ater
abs
orpt
ion,
de
terg
ent
resi
stan
ce,
elon
gati
on a
t br
eak,
Low
hea
t di
stor
tion
te
mpe
ratu
re, d
issi
pati
on
fact
or, fl
amm
abili
ty, fl
exur
al
mod
ulus
Poly
amid
e 11
520.
932
020
0.05
Elo
ngat
ion
at b
reak
, im
pact
str
engt
h, h
eat
resi
stan
ce, f
atig
ue in
dex,
to
ughn
ess
Cos
t, im
pact
str
engt
h
Poly
amid
e 6,
950
1.4
--
--
-
Sour
ce: A
utho
r’s
own
files

18
Physical Testing of Plastics
Lyons [27] obtained creep rupture data and tensile behaviour for glass-filled PA and polyphthalamide at 23-150 ºC.
A polyphthamide with 33% glass reinforcement exhibited a good combination of creep resistance, strength and ductility.
1.5 Strain at Yield
This is an indication of the degree of strain that a material can accept without yielding. The values given are typical room-temperature values. If a material is brittle and does not exhibit a yield point, then the value given in Table 1.1 is termed ‘NA’. If the material is ductile and does not exhibit a yield point, then the value is given as ‘NY’ in Table 1.1. An excellent rating indicates a ductile material with no yield and high elongation to break. ‘Not applicable’ indicates a brittle material with low elongation to break.
Materials rated ‘very good’ to ‘very poor’ include all those exhibiting yield, ranked according to their strain at yield, as well as ductile materials with lower elongation to break than those rated as ‘excellent’, and brittle materials with higher elongation to break than those rated as ‘not applicable’. In general, ductile materials range from ‘excellent’ to ‘very poor’ by descending elongation to break, and brittle materials from ‘poor’ to ‘not applicable’ by descending elongation to break.
1.5.1 Isochronous Stress-strain Curves
Where it is necessary to compare several different materials, basic creep curves alone are not completely satisfactory. This is particularly so if the stress levels used are not the same for each material. If the stress endurance time relevant to a particular application can be agreed, a much simpler comparison of materials for a specific application can be made by means of isochronous stress-strain curves.
As an example, let us consider a milk crate in which we can assume that the moulding will not be continuously loaded for times >100 hours. From the basic creep curves, the strain values at the 100 hours point for various stresses can be readily determined. For each material, a stress-strain curve can now be drawn corresponding to the selected loading time of 100 hours. Now let us suppose that for this application it is further stipulated that after 100 hours of continuous loading the strain shall be ≤1%. The stress that can be sustained without violating the strain-endurance stipulation can then be conveniently read off for each material from the isochronous stress-strain curves, thereby indicating with reasonable confidence the stress than can be used for design

19
Mechanical Properties of Polymers
purposes for each of the materials considered. Examples of these interpolations are demonstrated in Figure 1.4.
4
3
2
1
0 0
250
500
750
1000
0.1 1 0 1 2 3 410
5.3 MPa
7 MPa
3.5 MPa
1.8 MPa
102 103
Tota
l str
ain
(%)
Stre
ss (
psi)
Total strain (%)Time (hours)
Figure 1.4 Isochronous stress-strain curve of PE. Source: Author’s own files
Hay and co-workers [28] developed an approximate method for the theoretical treatment of pressure and viscous heating effects on the flow of a power-law fluid through a slit die. The flow was assumed to remain one-dimensional and the accuracy of this approximation was checked via finite element simulations of the complete momentum and energy equations. For pressures typically achieved in the laboratory, it was seen that the one-dimensional approximation compared well with the simulations. The model therefore offered a method of including pressure and viscous heating effect in the analysis of experiments, and was used to rationalise experimentally pressure profiles obtained for the flow of polymer melts through a slit die. Data for the flow of a LDPE and a PS melt slit die showed that these two effects were significant under normal laboratory conditions. The shear stress-strain rate curves would thus be affected to the point of being inaccurate at high shear rates. In addition, it was found that the typical technique to correct for a pressure-dependent viscosity was also inaccurate, being affected by the viscous heating and heat transfer from the melt to the die.
Thermomechanical analysis is an ideal technique for analysing fibres because the measured parameters - dimension change, temperature and stress - are major variables that affect fibre processing. Figure 1.5 shows the thermal stress analysis curves for

20
Physical Testing of Plastics
a polyolefin fibre as received and after cold drawing. In this experiment, fibres are subjected to initial strain (1% of initial length), and the force required to maintain that fibre length is monitored. As the fibre tries to shrink, more force must be exerted to maintain a constant length. The result is direct measurement of the shrink force of the fibre. Shrink force reflects the orientation frozen into the fibre during processing, which is primarily related to the amorphous portions of the fibre. Techniques that track fibre crystallinity, therefore, are not as sensitive a measure of processing conditions as thermomechanical analysis. In this case, the onset of the peak of the shrink force indicates the draw temperature, whereas the magnitude of the peak is related to the draw ratio of the fibre. It has been shown that the area under the shrink force curve (from the onset to maxima) can be correlated to properties such as elongation at break and knot strength. Other portions of the thermomechanical analysis thermal stress plot can yield additional information. For example, the initial decreasing slope is related to the expansion properties of the fibre, and the appearance of secondary force peaks can be used to determine values such as heat set temperature in Nylon.
0.0
0.2
0.4
0.6
Forc
e (N
)
Temperature (°C)20 40 60 80 100 120 140 160 180 200
As received
Cold drawn
Figure 1.5 Application of thermomechanical analysis to thermal stress analysis of polyolefin films (as received and cold drawn). Source: Author’s own files

21
Mechanical Properties of Polymers
1.5.2 Stress-time Curves
With thermoplastic materials, above a certain stress, the stress-strain curve shows a marked departure from linearity (i.e., above such values further increases in stress lead to disproportionately greater increases in elongation). By study of the isochronous stress-strain curves of a material it is possible to decide upon a certain strain that should not be exceeded in a given application. The stress required to produce this critical strain will vary with the time of application of the load, so that the longer the time of application, the lower will be the permissible stress.
From isochronous stress-strain curves relating to endurance times of, for example, 1, 10, 100, and 1,000 hours, the magnitude of stress to give the critical strain at each duration of loading can be readily deduced. This procedure can be repeated for different selected levels of strain. In general, the more critical the application and the longer the time factor involved, the lower will be the maximum permissible strain. For the polyolefin family of materials, the upper limit of critical strain will always be governed by the onset of brittle-type rupture (e.g., hair cracking at elongations that are low compared with those expected from the short-term ductility of the material).
With thermoplastics of intermediate modules (e.g., HDPE, PP) the stress-strain curves depart slightly from linearity at quite low strains. Thus, if accurate results are to be obtained from standard formulae, it is sometimes necessary to limit the critical strain and the corresponding design stress to low values. One commonly selected criterion with high-modulus thermoplastics (e.g., polyacetal) is to base the design stress and the design modulus on that point on the stress-strain curve at which the secant modulus falls to 85% of the initial tangent modulus. This procedure is illustrated in Figure 1.6
It would be wrong, however, in many applications to limit the critical strain to a low value if the ductility of the material is to be fully utilised. Extreme examples are those such as pipes where rupture behaviour is the controlling factor.
The above type of data can be conveniently summarised by the presentation of stress-time curves corresponding to different levels of permissible strain. Such curves enable the time-dependency of different materials to be conveniently compared. If possible, rupture data should also be included on such plots so that at longer times an adequate safety margin over the rupture is always maintained.
As with normal creep curves, the time scale will normally be logarithmic. For extrapolation purposes, however, a linear relationship can be obtained by also using a logarithmic scale for the stress axis. In fact, if rupture data are to be included, a double logarithmic plot is preferred.

22
Physical Testing of Plastics
C
B
Stre
ss
StrainO A
ABAC
85100
=
Figures 1.6 Stress-time curve. Source: Author’s own files
1.5.3 Stress-temperature Curves
The methods discussed so far have been concerned with the presentation of combined creep data obtained at a single temperature. Thus, a further method is required to indicate the influence of temperature.
One convenient method is to combine the information available from isochronous stress-strain curves or stress-time curves obtained on the same materials at different temperatures. For example, suppose the performance criterion for a particular application is that the total strain should be ≤2% in 1,000 hours. Using the 1,000 hours isochronous stress-strain curve for each temperature and erecting an ordinate at the 2% point on the strain axis, the individual working stresses for each temperature can be obtained. Alternatively, by erecting an ordinate at the 1,000 hours point on the stress-time curve for 2% strain for each temperature investigated, the individual working stress can be similarly obtained. From these interpolated results, the stress-temperature curve can be drawn.
By similar procedures stress-temperature plots for other specific ‘time-permissible strain’ combinations can be obtained.

23
Mechanical Properties of Polymers
1.5.4 Extrapolation Techniques
Normal creep curves in which percentage total strain (or total strain) on a linear scale is plotted against time on a logarithmic scale show increasing curvature with time, particularly at higher stress levels. Due to this curvature it is not possible to extrapolate curves to longer times with certainty. If, however, a double-logarithmic plot is used for a series of stresses at a given temperature, a family of parallel straight lines is obtained. These can then be extrapolated quite easily. With PE and PP, the slope of such curves remains constant or tends to decrease at very long times. Furthermore, an increase in temperature also leads to a slight reduction in the slope of the family of curves for a given material. A straightforward linear extrapolation of the log (strain)/log (time) creep curves may thus involve an additional safety factor.
As mentioned above, stress-curves on a double-logarithmic scale are also linear and can be easily extrapolated. In both cases, however, over-extrapolation should be avoided (i.e., one decade and preferably not more than two).
1.5.5 Basic Parameters
Within a given family of materials of the same basic polymer, further condensation of data can be achieved if the principal polymer parameters influencing creep can be separated. For example, with PE, density and the melt index (MI) would be obvious possibilities.
If such factors can be found then all the results can be combined in suitable trend curves and the results for any intermediate grade interpolated. If good correlations are obtained, the reliability in the individual results is automatically increased and one can feel confident of predicting the creep behaviour of any material within a particular family.
1.5.6 Recovery in Stress Phenomena
In some applications, the load, instead of being constantly applied, will be applied only intermittently for limited periods. In the period between consecutive loadings the part will thus have an opportunity to recover. The extent to which this occurs will depend upon the ratio of the loaded time to the unloaded time. The recovery will be approximately exponential. Thus, to achieve virtually complete recovery, the time without load must be substantially longer than the time under load. The residual strain for a fixed ratio of loaded to unloaded time will also depend upon the magnitude of the strain experienced at the time of removal of the load.

24
Physical Testing of Plastics
With intermittent loading for relatively long time periods, higher permissible stresses will be possible than with continuous loading. With repeated loading over short time periods, however, fatigue effects could considerably reduce the value of the permissible stress for a long total endurance.
1.5.7 Stress Relaxation
In many applications such as those involving an interference fit (e.g., pipe couplings, closures), we are concerned more with the decrease in stress with time at constant strain (stress relaxation) rather than with the increase in strain with time under constant stress (creep).
To a first approximation, such data can be obtained from the basic family of creep curves by sectioning through them at the relevant strain value parallel to the time axis. That is, similar procedures are used as for obtaining stress-time curves.
1.5.8 Rupture Data
In applications in which strains up to the order of a few percent do not interfere with the serviceability of the component, the controlling factor as far as permissible stress is concerned will probably be the rupture behaviour of the material. The rupture curve forms the limiting envelope of any family of creep curves. Care must therefore be exercised in extrapolating creep data to ensure that for long-term applications a suitable safety factor is always allowed over the corresponding extrapolated rupture stress. In general, with thermoplastics, an increase in MW leads to improved rupture resistance, which is not necessarily reflected by an improvement in creep resistance and in fact may be associated with a decrease in creep resistance. An increase in MW will also, in general, be associated with a decrease in processability, which will tend to give higher residual stresses in fabricated articles which can in turn influence rupture properties. In designing injection moulded articles, particular care should be taken to ensure that the principal stresses experienced by the article in service are (wherever possible) parallel to the direction of flow of material in the mould. Avoidance of stress concentration effects, by appropriate design, will tend to minimise the interference of rupture phenomena and allow greater freedom to design on the basis of the creep modulus.
Certain environments reduce rupture performance with particular materials (e.g., PE in contact with detergents) and allowance must be made for this, where necessary, by the incorporation of an additional safety factor to the rupture stress. In general,

25
Mechanical Properties of Polymers
the resistance to rupture will be greater if the stress is applied in compression than in tension.
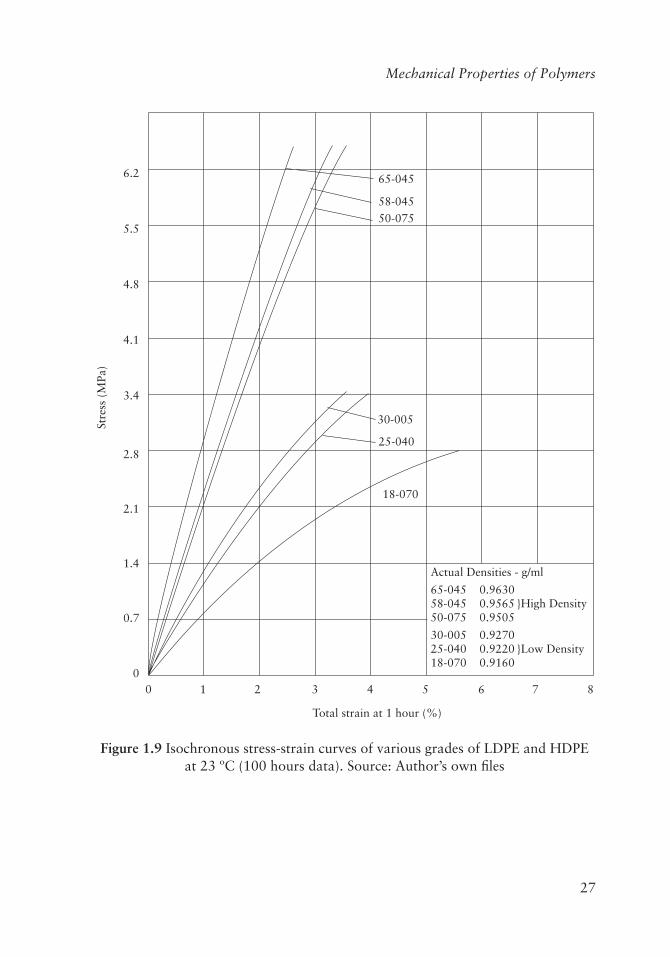
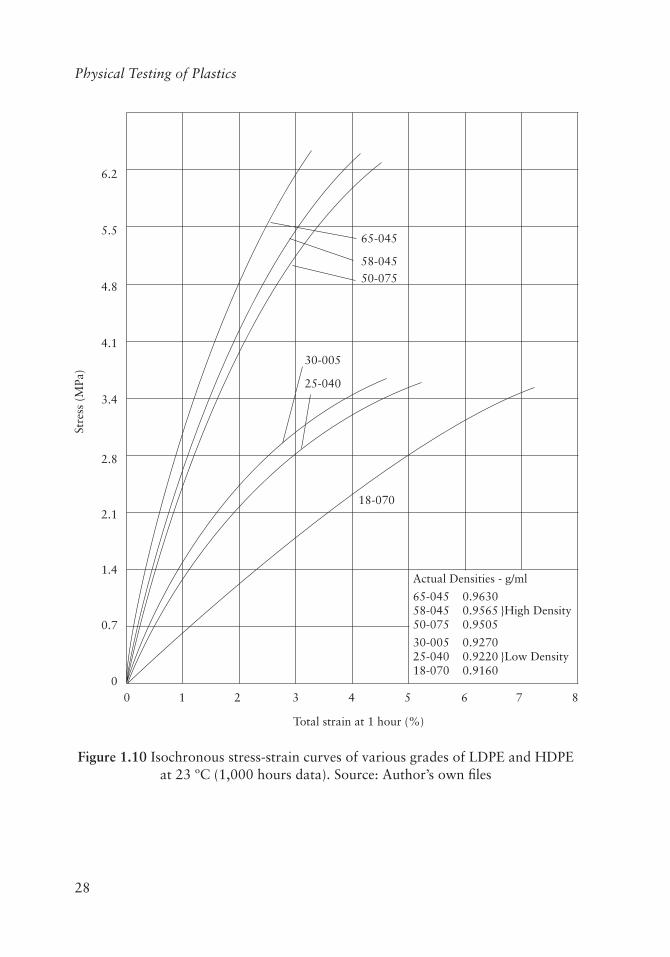
Differing stress levels have been used for HDPE and LDPE for the reasons previously discussed, so an easier comparison between grades can be made by the use of isochronous stress-strain curves. These are shown in Figures 1.7-1.10 for times of 1, 10, 100, 1,000 hours, respectively.
Stre
ss (
MPa
)
Total strain at 1 hour (%)
00
0.7
1.4
2.1
2.8
3.4
4.1
4.8
65-045
58-04550-075
30-005
25-040
18-070
Actual Densities - g/ml
65-045 0.963058-045 0.956550-075 0.9505
30-005 0.927025-040 0.922018-070 0.9160
5.5
6.2
1 2 3 4 5 6 7 8
}High Density
}Low Density
Figure 1.7 Isochronous stress-strain curves of various grades of LDPE and HDPE at 23 ºC (1 hour data). Source: Author’s own files

26
Physical Testing of Plastics
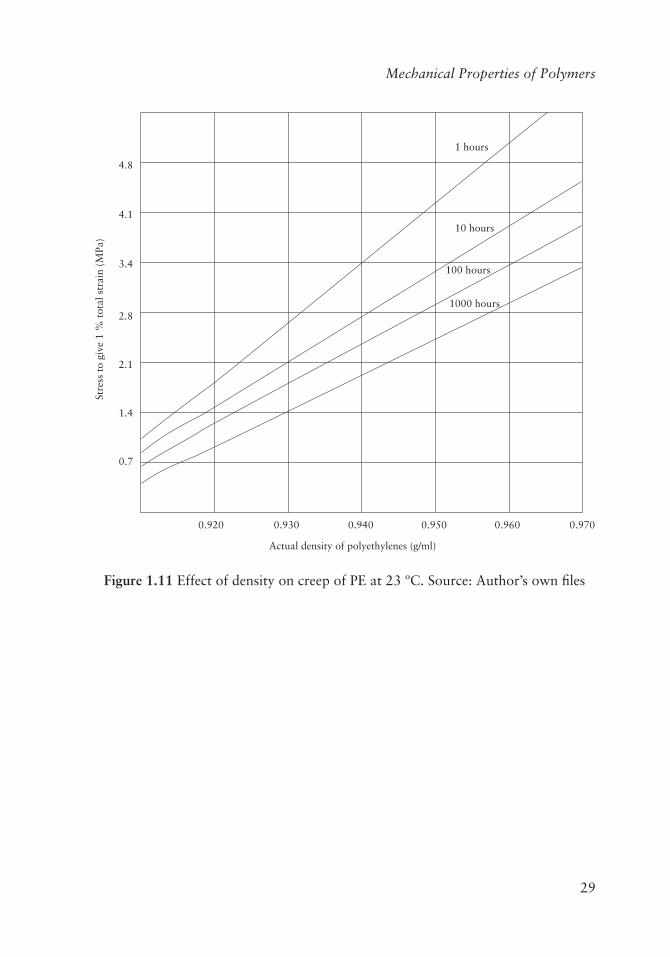
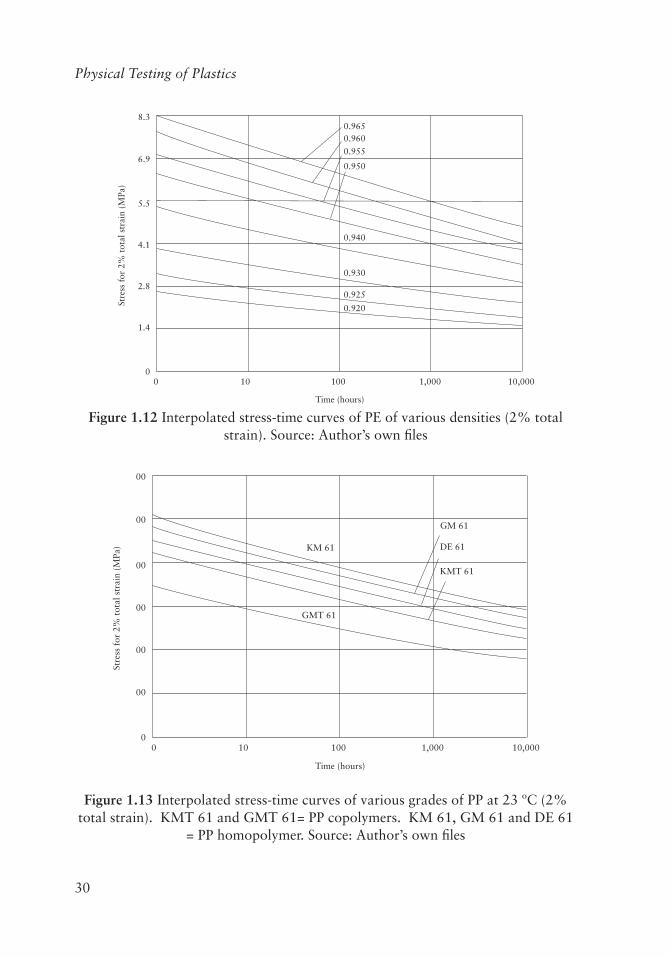
The data have been further combined in Figure 1.7, which demonstrates the marked (but systematic) influence of density on the creep behaviour of PE. The curves in Figure 1.11 are relevant to a total strain of 1%, but similar plots for other permissible strains can be readily derived from the isochronous stress-strain curves. The linear relationship between creep and density for PE at room temperature, irrespective of the melt index over the range investigated (i.e., 0.2 to 5.5), has enabled the stress-time curve of Figure 1.12 to be interpolated for the complete range of PE and for a range of PP (Figure 1.13). In this case, the data have been based on a permissible strain of 2% but, as previously explained, data for other permissible strains can be similarly interpolated from the creep curves. The effect of temperature on the creep properties of PE is summarised in Figure 1.14.
Stre
ss (
MPa
)
Total strain at 1 hour (%)
00
0.7
1.4
2.1
2.8
3.4
4.1
4.8
65-045
58-04550-075
30-005
25-040
18-070
Actual Densities - g/ml
65-045 0.963058-045 0.956550-075 0.9505
30-005 0.927025-040 0.922018-070 0.9160
5.5
6.2
1 2 3 4 5 6 7 8
}High Density
}Low Density
Figure 1.8 Isochronous stress-strain curves of various grades of LDPE and HDPE at 23 ºC (10 hours data). Source: Author’s own files
27
Mechanical Properties of Polymers
Stre
ss (
MPa
)
Total strain at 1 hour (%)
00
0.7
1.4
2.1
2.8
3.4
4.1
4.8
65-045
58-04550-075
30-005
25-040
18-070
Actual Densities - g/ml
65-045 0.963058-045 0.956550-075 0.9505
30-005 0.927025-040 0.922018-070 0.9160
5.5
6.2
1 2 3 4 5 6 7 8
}High Density
}Low Density
Figure 1.9 Isochronous stress-strain curves of various grades of LDPE and HDPE at 23 ºC (100 hours data). Source: Author’s own files
28
Physical Testing of PlasticsSt
ress
(M
Pa)
Total strain at 1 hour (%)
00
0.7
1.4
2.1
2.8
3.4
4.1
4.8
65-045
58-04550-075
30-005
25-040
18-070
Actual Densities - g/ml
65-045 0.963058-045 0.956550-075 0.9505
30-005 0.927025-040 0.922018-070 0.9160
5.5
6.2
1 2 3 4 5 6 7 8
}High Density
}Low Density
Figure 1.10 Isochronous stress-strain curves of various grades of LDPE and HDPE at 23 ºC (1,000 hours data). Source: Author’s own files
29
Mechanical Properties of Polymers
Stre
ss t
o gi
ve 1
% t
otal
str
ain
(MPa
)
Actual density of polyethylenes (g/ml)
0.7
1.4
2.1
2.8
3.4
4.1
4.8
1000 hours
100 hours
10 hours
1 hours
0.920 0.930 0.940 0.950 0.960 0.970
Figure 1.11 Effect of density on creep of PE at 23 ºC. Source: Author’s own files
30
Physical Testing of Plastics
Stre
ss f
or 2
% t
otal
str
ain
(MPa
)
Time (hours)
1.4
0
2.8
4.1
5.5
6.9
8.3
100 100
0.9650.960
0.955
0.950
0.940
0.930
0.925
0.920
1,000 10,000
Figure 1.12 Interpolated stress-time curves of PE of various densities (2% total strain). Source: Author’s own files
Stre
ss f
or 2
% t
otal
str
ain
(MPa
)
Time (hours)
00
0
00
00
00
00
00
100 100
KM 61
KMT 61
DE 61
GM 61
GMT 61
1,000 10,000
Figure 1.13 Interpolated stress-time curves of various grades of PP at 23 ºC (2% total strain). KMT 61 and GMT 61= PP copolymers. KM 61, GM 61 and DE 61
= PP homopolymer. Source: Author’s own files

31
Mechanical Properties of Polymers
Stre
ss t
o gi
ve 2
% t
otal
str
ain
in 1
000
hour
s (M
Pa)
Temperature (ºC)
200
0.7
1.4
2.1
2.8
3.4
4.1
4.8
5.5
30 40 50 60
0.960
0.950
0.940
0.930
0.920
70 80
Figure 1.14 Interpolated stress-temperature curves of PE of different densities (2% total strain at 1,000 hours). Source: Author’s own files

32
Physical Testing of Plastics
For PE, the principal factor controlling creep is density but the principal factor influencing rupture behaviour is the melt index. Thus, for a given density, for long-term applications, the higher the melt index the lower will be the maximum permissible strain. This is particularly important at elevated temperatures.
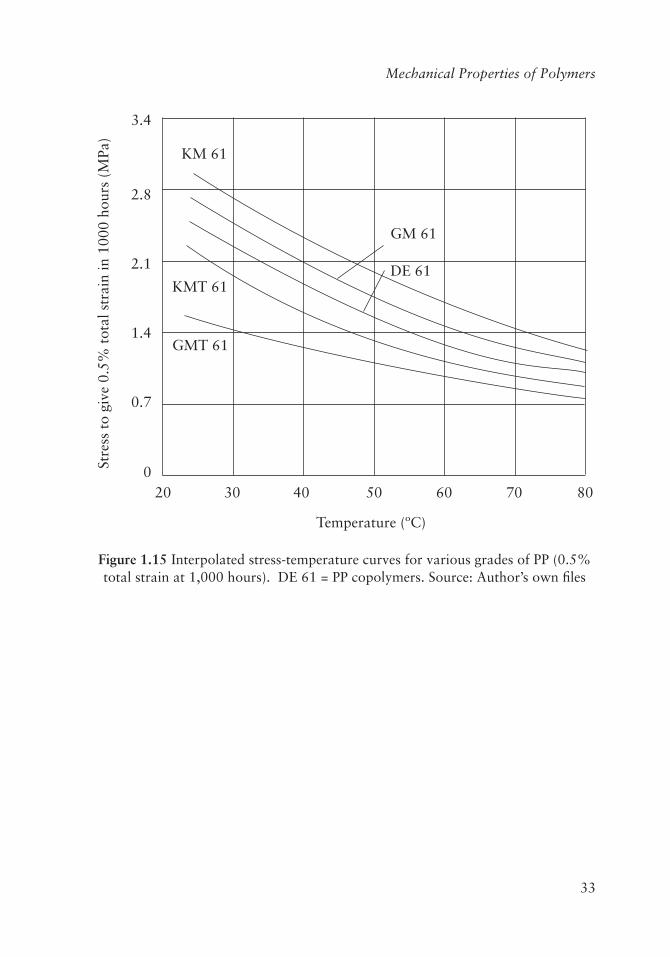
The effect of temperature on the creep of PP is also conveniently summarised in Figures 1.15 and 1.16. Although these curves refer specifically to 0.5% and 2% total strain in 1,000 hours, similar interpolations have shown that to a first approximation the fall off in stress with temperature is similar for other strain-time combinations.
In contrast to PE, an excellent correlation has been found between the creep and melt index of PP. An increase in the melt index is associated with an increase in creep resistance. This has been found for homopolymers and copolymers, and is illustrated in Figure 1.17. For similar melt indices the inferior creep resistance of the copolymers is also indicated, this difference being more marked for grades of lower melt index.
1.5.9 Long-term Strain-time Data
To illustrate the linearity of double-logarithmic plots of percentage total strain against time, Figure 1.18 shows a typical family of curves at a range of stress levels for a HDPE and Figure 1.19 shows that for a PP copolymer. From the uniform pattern of behaviour, the linear extrapolation of the curves at lower stresses to longer times appears well justified. As emphasised above, with the higher-melt-index materials at higher temperatures, over-extrapolation is dangerous because of the possible onset of rupture at comparatively low strains.
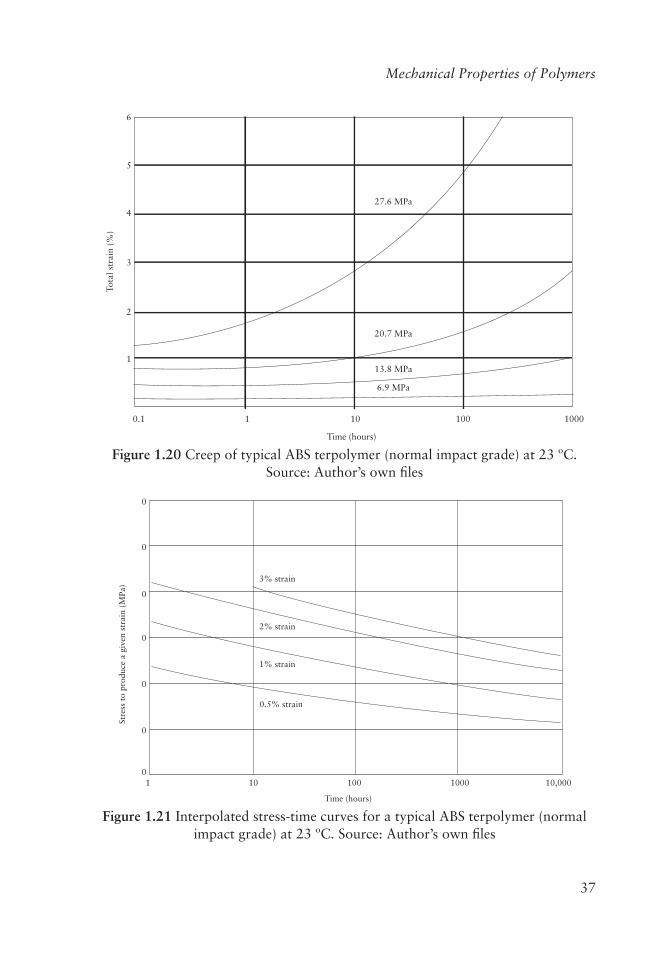
Figures 1.20 and 1.25 shows creep curves, isochronous stress-strain curves and stress-time curves for a typical ABS terpolymer and a typical unplasticised polyvinyl chloride (UPVC).
33
Mechanical Properties of Polymers
Stre
ss t
o gi
ve 0
.5%
tot
al s
trai
n in
100
0 ho
urs
(MPa
)
Temperature (ºC)
200
0.7
1.4
2.1
2.8
3.4
GM 61
KM 61
KMT 61
GMT 61
DE 61
30 40 50 60 70 80
Figure 1.15 Interpolated stress-temperature curves for various grades of PP (0.5% total strain at 1,000 hours). DE 61 = PP copolymers. Source: Author’s own files

34
Physical Testing of PlasticsSt
ress
to
give
0.5
% t
otal
str
ain
in 1
000
hour
s (M
Pa)
Temperature (ºC)
200
1.4
2.8
4.1
5.5
6.9
8.3
9.7
GM 61
KM 61
KMT 61
GMT 61
DE 61
30 40 50 60 70 80
Figure 1.16 Interpolated stress-temperature curves for various grades of PP (2% total strain at 1,000 hours). DE 61 = PP homopolymers. Source: Author’s own files

35
Mechanical Properties of Polymers
Stre
ss f
or 2
% t
otal
str
ain
(MPa
)
Melt index (g/10 min)
2.8
0
5.5
8.3
11.0
13.8
18.5
100 100
1 hour
1 hour
10 hours
10 hours
100 hours
100 hours
1000 hours
1000 hours
Homopolymers
Copolymers
1,000
x
x
x
x
x
Figure 1.17 Effect of melt index on creep of PP at 23 ºC. Source: Author’s own files
Tota
l str
ain
(%)
Time (hours)
0.10.1
1
10
1 10 100 1,000
6.2 MPa4.8 MPa3.4 MPa
2.1 MPa
1 ye
ar
10 y
ears
10,000 100,000
Density 0.96 gm/mlMelt index 0.3 gm/10 min (190 °C 2.16 kg)
Figure 1.18 Long-term creep of HDPE at 23 ºC. Source: Author’s own files

36
Physical Testing of Plastics
10 1 0.1 0.
11
1010
010
00
Tim
e (h
ours
)
Total strain (%)
1 year
3.4
MPa
5.5
MPa
7.6
MPa
9.7
MPa
11.7
MPa
13.8
MPa
19.5
MPa
10,0
00
Figu
re 1
.19
Lon
g-te
rm c
reep
of
high
-den
sity
PP
copo
lym
er a
t 23
ºC
. Sou
rce:
Aut
hor’
s ow
n fil
es
37
Mechanical Properties of Polymers
0.1 1 10 100 1000
Time (hours)
6.9 MPa
13.8 MPa
20.7 MPa
27.6 MPa
Tota
l str
ain
(%)
1
2
3
4
5
6
Figure 1.20 Creep of typical ABS terpolymer (normal impact grade) at 23 ºC. Source: Author’s own files
10
0
0
0
0
0
0
10 100 1000
3% strain
2% strain
1% strain
0.5% strain
10,000
Time (hours)
Stre
ss t
o pr
oduc
e a
give
n st
rain
(M
Pa)
Figure 1.21 Interpolated stress-time curves for a typical ABS terpolymer (normal impact grade) at 23 ºC. Source: Author’s own files

38
Physical Testing of Plastics
10.1 10 100 1000
34.5 MPa
25.9 MPa
17.2 MPa
8.6 MPa
Time (hours)
Tota
l str
ain
(%)
0
1
2
3
4
5
6
Figure 1.22 Creep of typical UPVC pipe formulation at 23 ºC. Source: Author’s own files
34.5 MPa
Time (hours)
0.5% strain
1% strain
2% strain
3% strain
Stre
ss t
o pr
oduc
e a
give
n st
rain
(M
Pa)
0
6.9
13.8
20.7
27.6
34.5
41.4
0 10 100 1000 10,000
Figure 1.23 Interpolated stress-time curves for a typical UPVC pipe formulation at 23 ºC. Source: Author’s own files

39
Mechanical Properties of Polymers
Figure 1.24 Injection moulded dish used in measurement of falling weight strength. Source: Author’s own files
Figures 1.25 Injection moulded ruler used in the study of weld effects (length, 37.5 cm). Source: Author’s own files
Stress-strain data have been reported for several polymers, including ultra-high MW PE [29-30] syndiotactic PP [31] PA 6 [32], PP [33], PA 6,6 [34] and LDPE aluminium foil laminates [35].
40
Physical Testing of Plastics
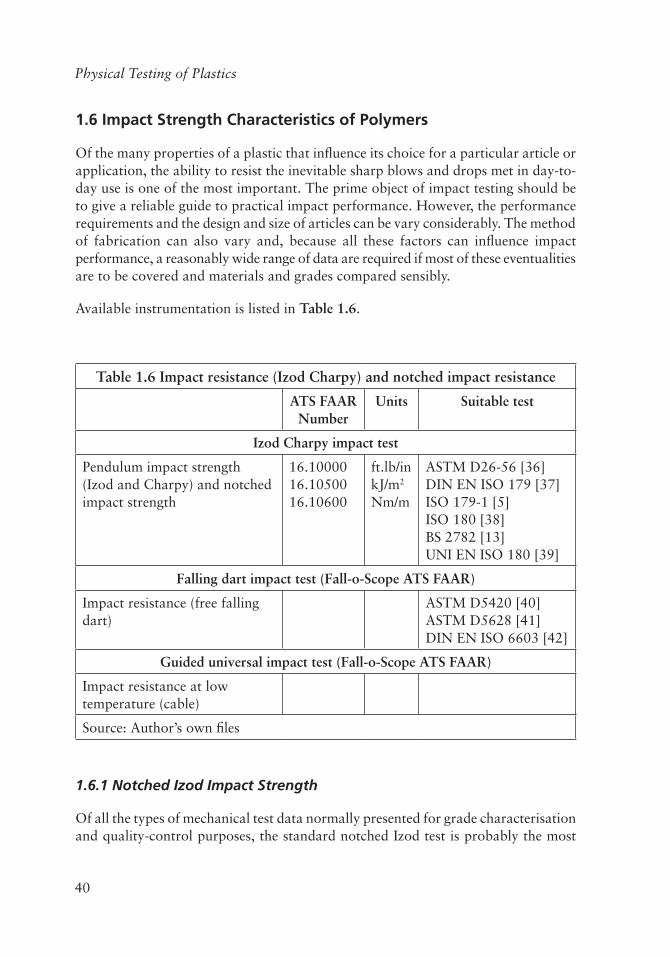
1.6 Impact Strength Characteristics of Polymers
Of the many properties of a plastic that influence its choice for a particular article or application, the ability to resist the inevitable sharp blows and drops met in day-to-day use is one of the most important. The prime object of impact testing should be to give a reliable guide to practical impact performance. However, the performance requirements and the design and size of articles can be vary considerably. The method of fabrication can also vary and, because all these factors can influence impact performance, a reasonably wide range of data are required if most of these eventualities are to be covered and materials and grades compared sensibly.
Available instrumentation is listed in Table 1.6.
Table 1.6 Impact resistance (Izod Charpy) and notched impact resistance
ATS FAAR Number
Units Suitable test
Izod Charpy impact test
Pendulum impact strength (Izod and Charpy) and notched impact strength
16.10000 16.10500 16.10600
ft.lb/in kJ/m2
Nm/m
ASTM D26-56 [36] DIN EN ISO 179 [37] ISO 179-1 [5] ISO 180 [38] BS 2782 [13] UNI EN ISO 180 [39]
Falling dart impact test (Fall-o-Scope ATS FAAR)
Impact resistance (free falling dart)
ASTM D5420 [40] ASTM D5628 [41] DIN EN ISO 6603 [42]
Guided universal impact test (Fall-o-Scope ATS FAAR)
Impact resistance at low temperature (cable)
Source: Author’s own files
1.6.1 Notched Izod Impact Strength
Of all the types of mechanical test data normally presented for grade characterisation and quality-control purposes, the standard notched Izod test is probably the most

41
Mechanical Properties of Polymers
vigorously criticised on the grounds that it may give quite misleading indications regarding impact behaviour in service. In most cases, however, the criticism should be levelled at too wide an interpretation of the results, particularly the tendency to overlook the highly important influence of the differences between the standard and operational conditions in terms of dimensions, notch effects, and processing strains. For example, in the Izod test, the specimens are of comparatively thick section (e.g., 6.25 × 1.25 × 1.25 cm, or 6.25 × 1.25 × 0.625 cm) and are consequently substantially unoriented. Even with injection moulded specimens (where some orientation does exist), specimens are usually tested in their strongest direction (with the crack propagating at a right angle to the orientation direction), which generally leads to high values. Furthermore, specimens are notched with the specific intention of locating the point of fracture and ensuring that as wide a range of materials as possible fracture in a brittle manner in the test. It is thus reasonably safe to infer that, if a material breaks in a ductile manner at the high impact energies involved in the Izod test it will, in nearly all circumstances involving thick sections, behave in a ductile manner in practice. Because of the severe nature of the test, it would be wrong, however, to assume that because a material gives a brittle-type fracture in this test it will necessarily fail in a brittle manner at low impact energies in service.
In cases in which high residual orientation is present, additional weakening can result from the easier propagation of cracks in the direction parallel to the orientation.
A low Izod value does give a warning that care should be exercised in design to avoid sharp corners or similar points of stress concentration. It does not by itself, however, necessarily indicate high notch sensitivity.
1.6.2 Falling Weight Impact Test
The normal day-to-day abuse experienced by an article is more closely simulated by the falling weight impact type test (see BS 2782) [13]. It is also much easier to vary the type and thickness of specimens in this test. Furthermore, any directional weakness existing in the plane of the specimens is easily detected.
ATS FAAR supplies the Fall-o-Scope Universal apparatus for free-falling dart impact resistance tests (Table 1.6). The apparatus can be set to obtain the rate of energy absorption during the impact. The apparatus can be used to conduct tests to different specifications with computerised operation in the range 70-200 ºC.
One would normally expect the impact energy required for failure to increase with specimen thickness, but the rate of increase will not be the same for all materials. In addition, the effect of the fabricating process cannot be over-emphasised. I mentioned

42
Physical Testing of Plastics
above that residual orientation can lead to marked weakening and susceptibility to cracking parallel to the orientation direction. Such residual orientation is extremely likely to be brought about in the injection moulding process, where a hot plastic melt is forced at a high shear rate into a narrow, relatively cold cavity. Naturally, the more viscous the melt and the longer and narrower the flow path, the greater the degree of residual orientation expected. Within a given family of grades the melt viscosity, besides being influenced by temperature and shear rates, will also be affected by polymer parameters such as MW and MW distribution. Thus, it cannot be assumed that the magnitude of this drop in impact strength will be the same for differing materials or for differing grades of the same material. For a satisfactory comparison it is, therefore, essential to know that variation in impact strength with thickness of unoriented compression moulded samples and injection moulded samples moulded over a range of conditions.
In some investigations, a flat, circular, centre-grated, 15 cm diameter moulded dish as (Figure 1.24) has been used. The dish is mounted in the falling weight impact tester in its inverted position and located so that the striker hits the base 1.875 cm from the centre because the area near the sprue is one of the recognised weak spots of injection moulding. By means of inserts in the mould, the thickness of the base of the moulding can be varied. For each material a family of curves is obtained for variation of impact strength with thickness of compression moulded sheets moulded under standard conditions, and of injection moulded dishes produced at a series of temperatures. An estimate of the weakening effects of residual orientation and of the tolerance that can be allowed on injection moulding conditions for satisfactory impact performance is thus obtained.
A further factor that can adversely affect impact performance is often encountered in injection moulding. Whether a single gate or multiple gates are used, it is usually inevitable due to a non-uniform flow pattern during the mould-filling operation that separate flow fronts meet to form a weld line. The strength at the weld line will vary with the material, the injection moulding conditions, and the length and thickness of the flow path, and can be considerably weaker that adjacent parts of the moulding. Weld effects have been studied by means of a flat 37.5 × 3.125 cm ruler mould as shown in Figure 1.25 which can be gated at one or both ends. The thickness of the specimens can be varied by means of inserts. In this way, a series of comparisons can be made between the falling weight impact strength of welded and non-welded specimens at the same distance from the gate for varying path length to cavity thickness ratios and differing moulding conditions.
Besides the average level at which failures occur in the falling weight impact test, the type of failure can also be of importance in judging the relative impact performance of a material in practice. There are generally three types of failure, as listed below:

43
Mechanical Properties of Polymers
• Aductileortoughfailure in which the material yields and flows at the point of impact, producing a hemispherical depression, which at sufficiently high impact energies eventually tears through the complete thickness.
• Abrittlefailure in which the specimen shatters or cracks through its complete thickness with no visible signs of any yielding having taken place prior to the initiation of the fracture. (With specimens possessing a high degree of residual orientation a single crack parallel to the orientation direction is obtained.)
• Anintermediateor‘bructile’failure in which some yielding or cold flow of the specimen occurs at the point of impact prior to the initiation and propagation of a brittle-type crack (or cracks) through the complete thickness of the specimen.
These types of failure are shown in Figure 1.26.
An idea of the impact energy associated with these types of failure can be ascertained by consideration of a typical load-deformation curve. This in general will be of the form shown in Figure 1.27. From the definitions given above, a brittle-type failure will occur on the initial, essentially linear part of the curve, prior to the yield point.
Figure 1.26 Examples of types of failure occurring in the falling weight impact strength test. Source: Author’s own files

44
Physical Testing of Plastics
Deformation
Brittle Bructile
Ductile
Yield Point
Loa
d
Figure 1.27 Typical load-deformation curve. Source: Author’s own files
A bructile failure will occur on that part of the curve near to but following the yield point. A ductile failure will be associated with high elongations on the final part of the curve which follows the yield point. With the last type of failure, the deformation at failure will be reasonably constant for a strike of given diameter. The area beneath the curve up to failure gives a measure of the impact energy to cause failure. Hence, in general, for a given thickness, tough-type failure is associated with high and reasonably constant impact energy. Bructile failure is also associated with relatively high but more variable energy. Brittle failures are generally associated with a low impact level.
If, in a given test, failures are all of the tough type, a reliable and reproducible measure of the impact strength of the sample can be obtained. If, however, differing types of failures are observed, a much wider variation in impact values can be obtained from repeat tests.

45
Mechanical Properties of Polymers
However, the difference in energy level required to produce tough and brittle-type failure varies for differing materials. In practice, the lowest level at which a failure is likely to occur is as important as the estimated level at which 50% of the samples are likely to fail, so it is necessary to have a measure of this variability. The 50% failure level (F50) is the value usually reported in a falling weight impact test. This can be obtained by repeating the falling weight test using the ‘probit’ rather than the ‘staircase’ procedure. In the former, sets of samples are tested at each of a series of increasing energy levels between the limits at which, none or all the specimens in a given set fail. If percentage failure is then plotted against impact energy on probability paper, the slope of the curve gives an estimate of the variable and the likelihood of occasional samples failing at low impact levels.
A final important factor that requires consideration for many applications is the influence of temperature because some thermoplastics undergo a tough-brittle transition, with a correspondingly marked drop in impact performance, just below ambient temperature. Changes in notch sensitivity with temperature have been ascertained by the use of notched bar tests (as described above) and change in impact strength with temperature by the falling weight test and standard Izod test. Comparatively thick compression- and/or injection moulded specimens have been used in these investigations to ensure that the starting value of the impact strength at room temperature is high and that change in this value is easily detected.
• GardnerImpactTest
Lavach [45] discussed the factors that affect results obtained by the Gardner impact test. This test is used by plastics producers to approximate the mean failure energy for many plastics. The test is inexpensive and easy to operate. The test equipment can be placed close to the manufacturing equipment, permitting fast and nearly online determination of the impact resistance of an article. The test is useful for finding the mean failure energy for brittle thermoplastics such as acrylic and high-impact PS, with standard deviations between 8% and 10%.
1.6.3 Notch Sensitivity
The sharpness of a notch is well known to have a strong influence on the impact performance of notched specimens. The extent of this effect is found to vary considerably from polymer to polymer. To investigate this point, impact values obtained with the BS notch of 0.10 cm tip radius have been compared with those obtained with other tip radii, namely 0.025 cm (the ASTM standard), 0.050 cm and 0.20 cm. The results for notch sensitivity are conveniently expressed by plotting the impact value as a ratio of the BS value against the notch tip radius or alternatively

46
Physical Testing of Plastics
plotting the actual Izod value on a logarithmic scale against notch tip radius on a linear scale. The steeper the slope of the curve, the greater the notch sensitivity of the material and the more essential it is to remove sharp radii and points of stress concentration in design if optimum performance is to be obtained.
If the limitations described above are remembered, the results of notched bar tests give useful information. However, for realistic comparisons of materials, additional impact data are required.
Reference was made above as to how a low Izod value gives a warning regarding the care that should be exercised in design to remove points of stress concentration if optimum impact behaviour is to be obtained with a component in practice. It was also mentioned that a more reliable measure of notch sensitivity can be obtained by carrying out tests using a series of notch radii rather than a single standard notch. Figure 1.28 shows the relative notch sensitivities of some polyolefins and a few other well-known thermoplastics. Polyolefins are of intermediate notch sensitivity, this being more marked with the higher melt-index grades. Among the polyolefins, the low melt-index PP copolymer designated GMT 61 has the lowest notch sensitivity, whereas the higher-melt-index PE and PP homopolymers (e.g., 65-045, KM 61) have the highest.
Figure 1.29 shows the variation in standard Izod impact strength (0.10 cm notch tip radius) with temperature for the same range of materials. By far the most temperature-sensitive is the low melt-index PP copolymer. It is interesting to compare the sharp fall-off in notched impact strength with this material between 23 ºC and 0 ºC with the steady values obtained for falling weight impact strength for the same temperature range (Figure 1.30). The removal of points of stress concentration is thus the most vital factor governing the impact performance of this grade at temperature of 0 ºC and below. Figure 1.31a shows in more detail the notched impact behaviour of PP at room temperature. A semi-logarithmic plot has been used so that the overall level and notch sensitivity can be determined. The marked influence of the melt index and the superiority of the copolymers over the homopolymers are clearly demonstrated.
Figure 1.31b and c show similar data for 0 ºC and -20 ºC, respectively. With the exception of the low melt index PP copolymer, notch sensitivities are similar to those at room temperature, but the marked drop in overall level brought about by a decrease in temperature is again clearly demonstrated.

47
Mechanical Properties of Polymers
0.25 0.50 1.0
20
40
60
80
120
140
160
Not
ch s
ensi
tivi
ty
180
200
Notch tip radius (mm)
2.0
Figure 1.28 Typical notch sensitivities of some thermoplastics at 23 ºC. Source: Author’s own files

48
Physical Testing of Plastics
–30 –20 –10 00
267
534
BSI
Izo
d im
pact
str
engt
h (1
mm
not
ch)
(J/m
not
ch)
801
1068
Temperature (°C)
10 20
Toughened polystyrene
PP GM 61
PP (GMT 61)
ABS (high impact)
HDPE (MI = 1.0)
HDPE (low MI) 60-004
PP KMT 61
HDPE–65045
ABS (normal impact)
30
Figure 1.29 Influence of temperature on Izod impact strength of various polymers.HDPE low melt index and high melt index. Source: Author’s own files

49
Mechanical Properties of Polymers
–30 –20 –10 00
107
214
320
427
534
641
GMT 61
ABS (high impact)
ABS (normal impact)
Toughened polystyrene
KM 61
65-045
KMT 61
748
Falli
ng w
eigh
t im
pact
str
engt
h (1
/m F
50)
Temperature (°C)
10 20 30
Figure 1.30 Effect of temperature on falling weight impact strength of 0.060 inch compression moulded specimens of various polymers. Source: Author’s own files

50
Physical Testing of Plastics
50.3 0.5 1.0 2.0
11
27
53
107
267
534
1068
GMT 61
GM 61
BS notchASTM notch
(a)
KMT 61
KM 61
PM 61
Izod
impa
ct s
tren
gth
(ft
lb/in
ch n
otch
)
Notch tip radius (mm)
50.3 0.5 1.0 2.0
11
27
53
107
267
534
GMT 61
GM 61
BS notchASTM notch
(b)
KMT 61
Izod
impa
ct s
tren
gth
(ft
lb/in
ch n
otch
)
Notch tip radius (mm)

51
Mechanical Properties of Polymers
50.3 0.5 1.0 2.0
11
27
53
107
267
534
GMT 61
GM 61
BS notchASTM notch
(c)
KMT 61
Izod
impa
ct s
tren
gth
(J/m
not
ch)
Notch tip radius (mm)
Figure 1.31 Variation of Izod impact strengths of various grades of PP with notch tip radius at (a) 23 ºC; (b) 0 ºC; and (c) -20 ºC. PM 61 = PP homopolymer. Source:
Author’s own files
Figures 1.32 and 1.33 show the combined data for room temperature and -20 ºC for HDPE and for ABS terpolymer and toughened PS, respectively. Of particular note is the very small effect of temperature on the impact level and notch sensitivity of HDPE, although the effect of MW (or melt index) is again clearly demonstrated. This indicates the suitability of HDPE for low-temperature applications.
One important practical example of the controlling influence of notch sensitivity in governing impact behaviour is that of embossed surfaces. Table 1.7 gives the results of falling weight impact tests in which a series of different textured finishes have been investigated for a range of PP. The injection moulded disc specimens possessed one texture and one plain, smooth surface. If the embossed surfaces were struck, high impact values were obtained. However, if the smooth surface was struck (so that the textured surface was placed in tension), very low impact values were obtained, with the magnitude of the drop depending upon the depth and sharpness of the embossing.
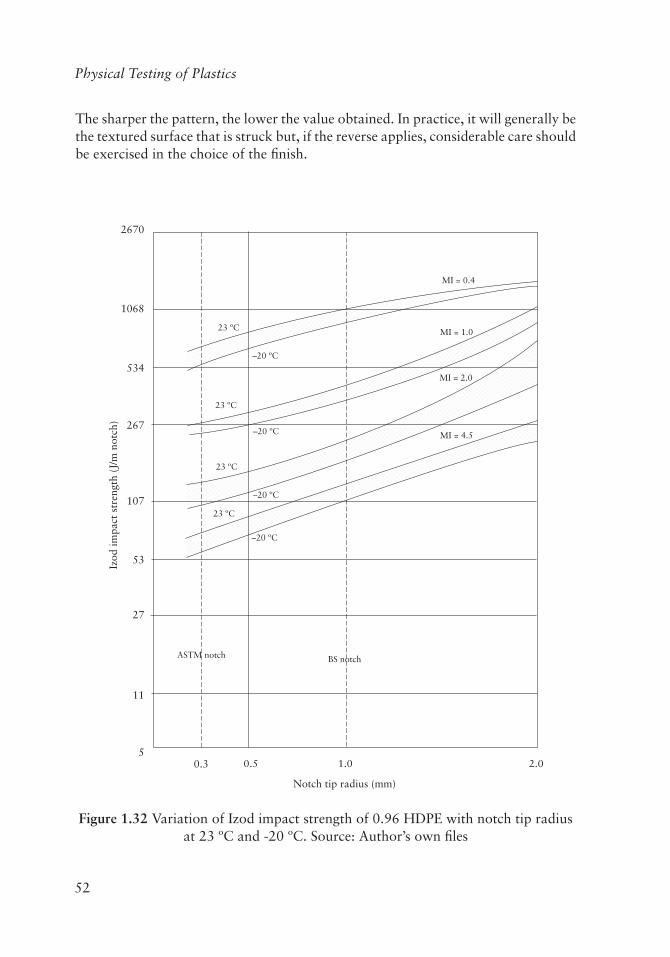
52
Physical Testing of Plastics
The sharper the pattern, the lower the value obtained. In practice, it will generally be the textured surface that is struck but, if the reverse applies, considerable care should be exercised in the choice of the finish.
50.3 0.5 1.0 2.0
11
27
53
23 ºC
23 ºC
23 ºC
23 ºC
–20 ºC
–20 ºC
–20 ºC
–20 ºC
MI = 0.4
MI = 1.0
MI = 2.0
MI = 4.5
107
267
534
1068
2670
BS notchASTM notch
Izod
impa
ct s
tren
gth
(J/m
not
ch)
Notch tip radius (mm)
Figure 1.32 Variation of Izod impact strength of 0.96 HDPE with notch tip radius at 23 ºC and -20 ºC. Source: Author’s own files

53
Mechanical Properties of Polymers
Tab
le 1
.7 E
ffec
t of
em
boss
ing
on f
allin
g w
eigh
t im
pact
str
engt
h at
23
o C
Poly
prop
ylen
e gr
ade
Surf
ace
tow
ards
st
rike
r
Falli
ng w
eigh
t im
pact
str
engt
h at
23
o C –
kJ/
m2
Surf
ace
1Su
rfac
e 2
Surf
ace
3Su
rfac
e 4
Surf
ace
5Sp
ecim
en
thic
knes
s (m
m)
Smoo
th
grai
n (m
ould
de
cora
tion
in
corp
orat
ed)
Rou
gh
finis
h (M
arti
n’s)
Rou
gh
finis
h (D
ornb
ush)
Smoo
th
grai
n (m
ould
de
cora
tion
in
corp
orat
ed)
Med
ium
fin
ish
(Dor
nbus
h)
PM 6
1Sm
ooth
0.4
0.4
0.4
0.5
0.4
2.7
Em
boss
ed2.
24.
51.
93.
82.
02.
7
GM
61
Smoo
th0.
50.
40.
40.
50.
42.
8
Em
boss
ed11
.712
.51.
921
.710
.72.
8
KM
T 6
1Sm
ooth
1.5
0.8
0.9
4.6
1.9
2.7
Em
boss
ed24
.420
.313
.6>2
4.4
>24.
42.
7
Sour
ce: A
utho
r’s
own
files

54
Physical Testing of Plastics
50.3 0.5 1.0 2.0
11
27
5323 ºC
23 ºC
23 ºC
–20 ºC
–20 ºC
–20 ºC
ABS (high impact)
ABS (normal impact)
Toughened polystyrene
107
267
534
1068
BS notchASTM notch
Izod
impa
ct s
tren
gth
(J/m
not
ch)
Notch tip radius (mm)
Figure 1.33 Variation of Izod impact strength of ABS terpolymer and toughened PS with notch tip radius and temperature. Source: Author’s own files
1.6.4 Falling Weight Impact Tests: Further Discussion
Figure 1.34 gives the variation in falling weight impact strength with thickness at 23 ºC of a range of materials in substantially stress-free compression moulded samples.
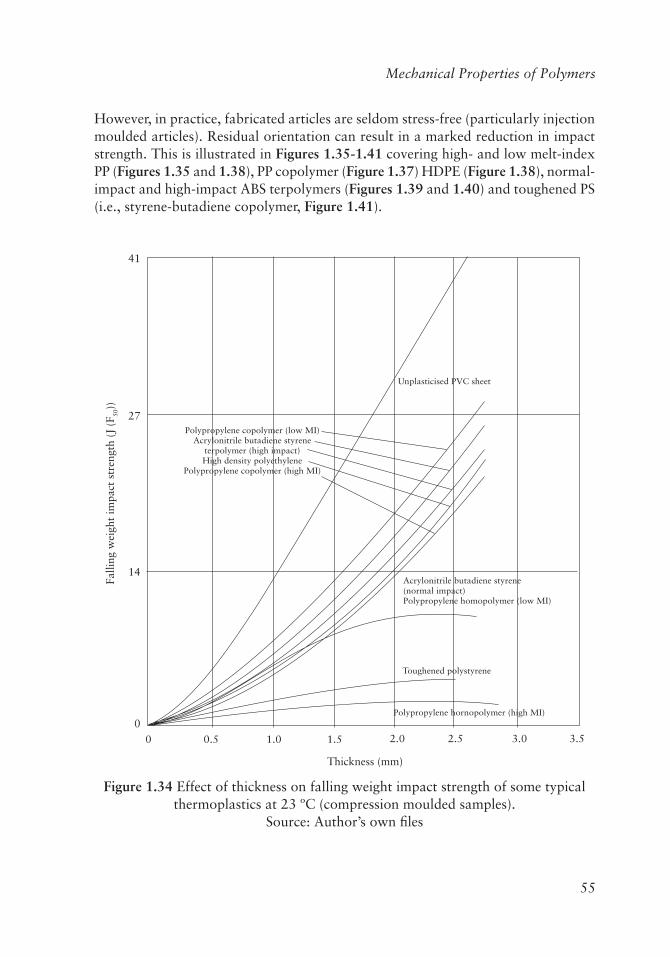
55
Mechanical Properties of Polymers
However, in practice, fabricated articles are seldom stress-free (particularly injection moulded articles). Residual orientation can result in a marked reduction in impact strength. This is illustrated in Figures 1.35-1.41 covering high- and low melt-index PP (Figures 1.35 and 1.38), PP copolymer (Figure 1.37) HDPE (Figure 1.38), normal-impact and high-impact ABS terpolymers (Figures 1.39 and 1.40) and toughened PS (i.e., styrene-butadiene copolymer, Figure 1.41).
2.0
Polypropylene copolymer (low MI)Acrylonitrile butadiene styrene
terpolymer (high impact)High density polyethylene
Polypropylene copolymer (high MI)
Unplasticised PVC sheet
Acrylonitrile butadiene styrene(normal impact)Polypropylene homopolymer (low MI)
Toughened polystyrene
Polypropylene hornopolymer (high MI)
2.5 3.0 3.51.51.00.50
41
27
14
0
Falli
ng w
eigh
t im
pact
str
engt
h (J
(F 50
))
Thickness (mm)
Figure 1.34 Effect of thickness on falling weight impact strength of some typical thermoplastics at 23 ºC (compression moulded samples).
Source: Author’s own files

56
Physical Testing of Plastics
2.0 2.5 3.0 3.51.51.0
IM = Injection mouldedCM = Compression moulded
IM 280 ºC
CM
IM 200 ºC
0.50
41
27
14
0
Falli
ng w
eigh
t im
pact
str
engt
h (J
(F 50
))
Thickness (mm)
Figure 1.35 Falling weight impact strength of high melt index PP copolymer at 23 ºC. Source: Author’s own files

57
Mechanical Properties of Polymers
2.0 2.5 3.0 3.51.51.0
IM = Injection mouldedCM = Compression moulded
IM 280 ºC
IM 240 ºCCM
IM 200 ºC
0.50
41
27
14
0
Falli
ng w
eigh
t im
pact
str
engt
h (J
(F 50
))
Thickness (mm)
Figure 1.36 Falling weight impact strength of low melt index PP copolymer at 23 ºC. Source: Author’s own files

58
Physical Testing of Plastics
2.0 2.5 3.0
MI = 3.0 (nucleated)
All samples wheninjection moulded
MI = 0.6
CM = Compression Moulded
MI = 3.0
CM
CMCM
3.51.51.00.50
14
0
3
5
8
11
Falli
ng w
eigh
t im
pact
str
engt
h (J
(F 50
))
Thickness (mm)
Figure 1.37 Falling weight impact strength of PP copolymers (comparison of moulded and injection moulded specimens at 23 ºC. Source: Author’s own files
2.0 2.5 3.0
CM = Compression Moulded
IM = Injection moulded CM
IM 280 ºC
IM 200 ºC
IM 240 ºC
3.51.51.00.50
27
0
14
Falli
ng w
eigh
t im
pact
str
engt
h (J
(F 50
))
Thickness (mm)
Figure 1.38 Falling weight impact strength of HDPE at 23 ºC. Source: Author’s own files
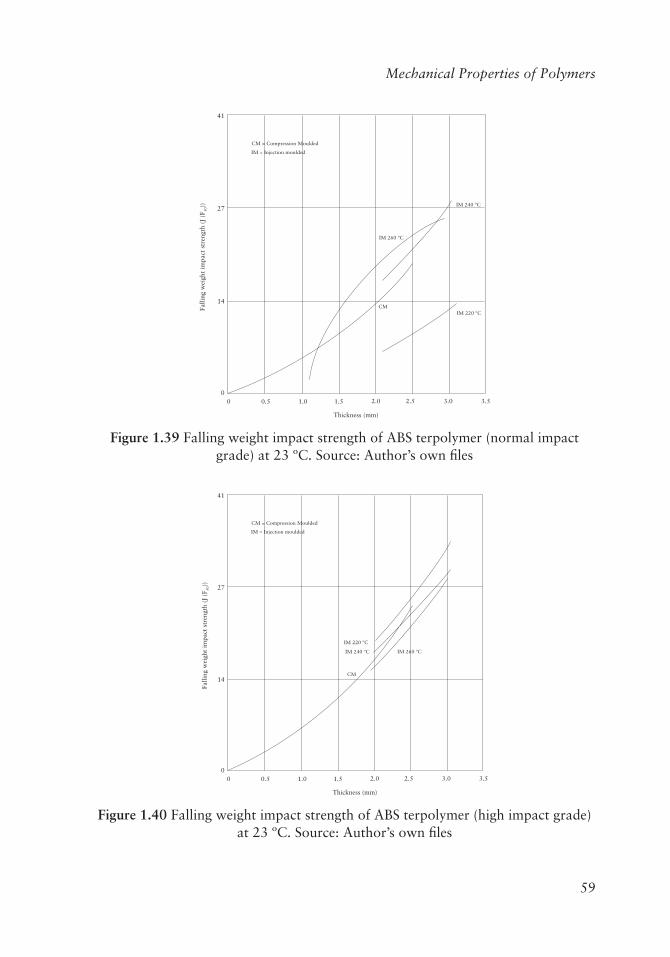
59
Mechanical Properties of Polymers
2.0 2.5 3.0
CM = Compression Moulded
IM = Injection moulded
CM
IM 260 ºC
IM 220 ºC
IM 240 ºC
3.51.51.00.50
27
41
0
14
Falli
ng w
eigh
t im
pact
str
engt
h (J
(F 50
))
Thickness (mm)
Figure 1.39 Falling weight impact strength of ABS terpolymer (normal impact grade) at 23 ºC. Source: Author’s own files
2.0 2.5 3.0
CM = Compression Moulded
IM = Injection moulded
CM
IM 260 ºC
IM 220 ºC
IM 240 ºC
3.51.51.00.50
27
41
0
14
Falli
ng w
eigh
t im
pact
str
engt
h (J
(F 50
))
Thickness (mm)
Figure 1.40 Falling weight impact strength of ABS terpolymer (high impact grade) at 23 ºC. Source: Author’s own files
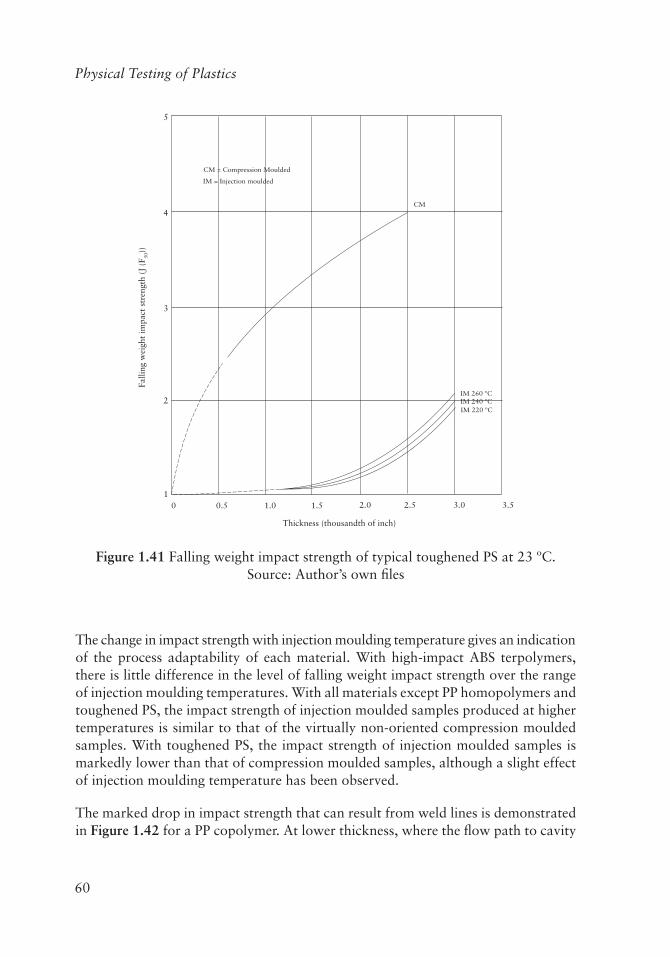
60
Physical Testing of Plastics
2.0 2.5 3.0
CM = Compression Moulded
IM = Injection moulded
CM
IM 260 ºC
IM 220 ºCIM 240 ºC
3.51.51.00.50
3
5
1
2
Falli
ng w
eigh
t im
pact
str
engt
h (J
(F 50
))
Thickness (thousandth of inch)
4
Figure 1.41 Falling weight impact strength of typical toughened PS at 23 ºC. Source: Author’s own files
The change in impact strength with injection moulding temperature gives an indication of the process adaptability of each material. With high-impact ABS terpolymers, there is little difference in the level of falling weight impact strength over the range of injection moulding temperatures. With all materials except PP homopolymers and toughened PS, the impact strength of injection moulded samples produced at higher temperatures is similar to that of the virtually non-oriented compression moulded samples. With toughened PS, the impact strength of injection moulded samples is markedly lower than that of compression moulded samples, although a slight effect of injection moulding temperature has been observed.
The marked drop in impact strength that can result from weld lines is demonstrated in Figure 1.42 for a PP copolymer. At lower thickness, where the flow path to cavity

61
Mechanical Properties of Polymers
thickness ratio is correspondingly higher, the impact strength measured at the weld is very much lower than that measured with a similar non-welded specimen. The positioning of gates to minimise weld effects is thus of vital importance in obtaining optimum behaviour in an injection moulded article of a given design.
Figures 1.30 and 1.43 show the effect of temperature on the falling weight impact strength for compression moulded and injection moulded specimens, respectively, of a range of materials. The reduction in impact strength with decrease in temperature is particularly marked with the injection moulded samples of the two otherwise higher impact-resistant types: PP copolymers and ABS terpolymers. The superior impact strength at low temperatures of injection moulded HDPE is clearly illustrated.
2.0 2.5 3.0 3.51.51.00.50
27Non-weld specimens
Compression moulded
Weld specimens
41
0
14
Falli
ng w
eigh
t im
pact
str
engt
h (J
(F 50
))
Thickness (mm)
Melt temperature: ∆ 200 °C240 °C280 °C
Figure 1.42 Effect of weld lines on the falling weight impact strength of PP copolymer at 23 ºC. Source: Author’s own files
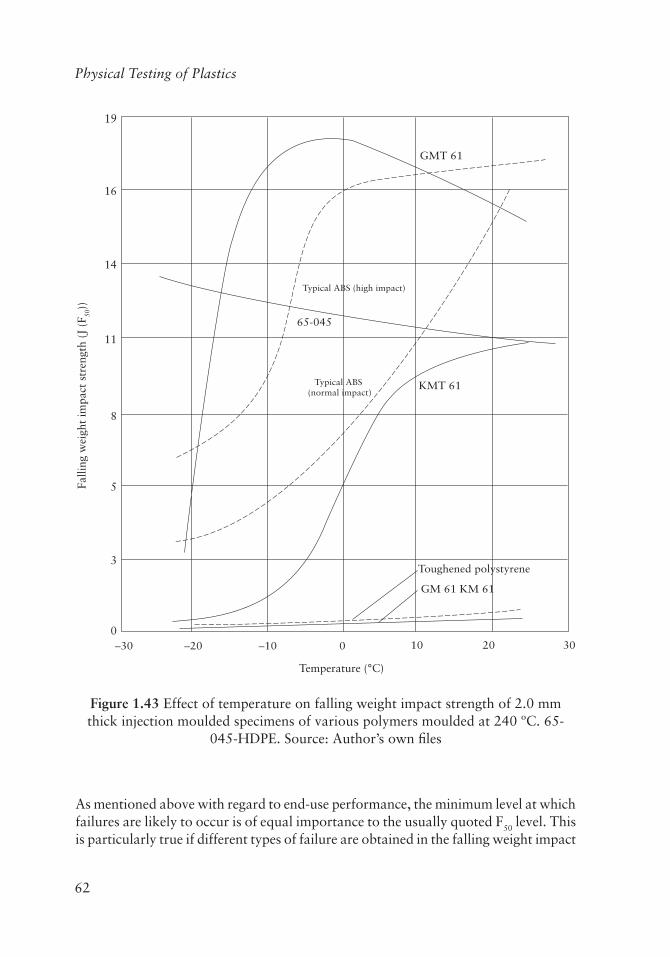
62
Physical Testing of Plastics
10 20
Toughened polystyrene
GM 61 KM 61
KMT 61
GMT 61
65-045
Typical ABS (high impact)
Typical ABS (normal impact)
300–10–20–30
5
19
0
3
Falli
ng w
eigh
t im
pact
str
engt
h (J
(F 50
))
Temperature (°C)
8
11
14
16
Figure 1.43 Effect of temperature on falling weight impact strength of 2.0 mm thick injection moulded specimens of various polymers moulded at 240 ºC. 65-
045-HDPE. Source: Author’s own files
As mentioned above with regard to end-use performance, the minimum level at which failures are likely to occur is of equal importance to the usually quoted F50 level. This is particularly true if different types of failure are obtained in the falling weight impact

63
Mechanical Properties of Polymers
test. Such variations in the type of failure frequently occur as temperature is reduced below ambient temperature. The probit method is then the preferred procedure of evaluation of impact strength behaviour.
The additional information that can be obtained by this method is demonstrated in Figures 1.44-1.46. For a low melt index HPDE (Figure 1.44) the probit is almost horizontal at ambient temperature and at -20 ºC. For a typical high-impact ABS terpolymer (Figure 1.45), the slopes of the curves are relatively steep compared with HDPE unless the impact strength is very low. The probability of failure occurring at low temperatures and at a low impact levels is thus higher with PP copolymers and ABS than with HDPE. In fact, the results indicate that the impact strength of the latter material at -20 ºC is slightly superior to that at 23 ºC.
22
19
16
14
11
8
5
3
00.01
0.050.1
0.20.5 2 10 30 50 70 90 98 99.8 99.99
99.99995
Polyethylene0.947 density0.3 melt index
–20 °C
–20 °C tough 23 °C
23 °C tough
806040
Failiure (%)
Imp
act
ener
gy (
J)
2051
Figure 1.44 Probit curves for a low melt-index HDPE (nominal thickness: 2.0 mm, injection moulded at 270 ºC). Source: Author’s own files

64
Physical Testing of Plastics
22
19
16
14
11
8
5
3
00.01
0.050.1
0.20.5 2 10 30 50 70 90 98 99.8 99.99
99.99995
Tough/Bructile + 10 °C
Tough/Bructile/Brittle + 10 °C
–20 °C brittle
–10 °C brittle0 °C
10 °C
23 °C23 °C tough
806040
Failiure (%)
Imp
act
ener
gy (
J)
2051
Figure 1.45 Probit curves for a typical high-impact ABS terpolymer (nominal thickness: 2.00 mm, injection moulded at 240 ºC). Source: Author’s own files
22
19
16
14
11
8
5
3
00.01
0.050.1
0.20.5 2 10 30 50 70 90 98 99.8 99.99
99.99995
Tough/Bructile 23 °C
Bructile + 10 °C
Bructile 0 °C
Bructile – 10 °C
Bructile – 20 °C
806040
Failiure (%)
Impac
t en
ergy
(J)
2051
Figure 1.46 Probit curves for a PP copolymer (nominal thickness: 2.0 mm, injection moulded at 240 °C). Source: Author’s own files
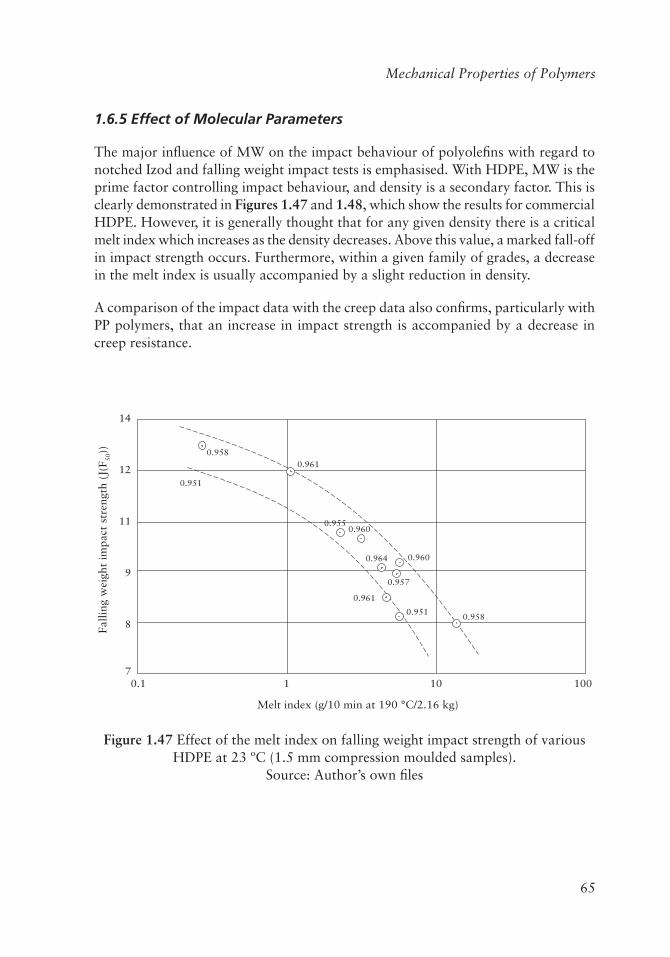
65
Mechanical Properties of Polymers
1.6.5 Effect of Molecular Parameters
The major influence of MW on the impact behaviour of polyolefins with regard to notched Izod and falling weight impact tests is emphasised. With HDPE, MW is the prime factor controlling impact behaviour, and density is a secondary factor. This is clearly demonstrated in Figures 1.47 and 1.48, which show the results for commercial HDPE. However, it is generally thought that for any given density there is a critical melt index which increases as the density decreases. Above this value, a marked fall-off in impact strength occurs. Furthermore, within a given family of grades, a decrease in the melt index is usually accompanied by a slight reduction in density.
A comparison of the impact data with the creep data also confirms, particularly with PP polymers, that an increase in impact strength is accompanied by a decrease in creep resistance.
14
12
11
9
8
70.1 1
0.961
0.9510.958
0.960
0.9610.958
0.951
0.960
0.964
0.957
0.955
10 100
Melt index (g/10 min at 190 °C/2.16 kg)
Fal
lin
g w
eigh
t im
pac
t st
ren
gth
(J(
F5
0))
Figure 1.47 Effect of the melt index on falling weight impact strength of various HDPE at 23 ºC (1.5 mm compression moulded samples).
Source: Author’s own files
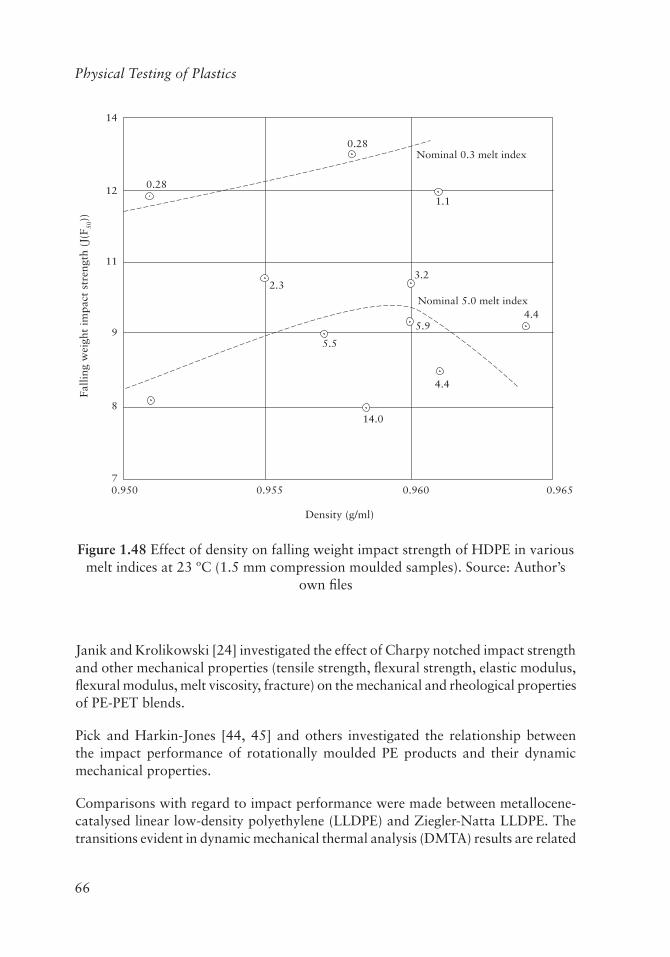
66
Physical Testing of Plastics
14
12
11
9
8
70.950 0.955
0.28
0.28
2.33.2
1.1
4.4
5.5
5.9
Nominal 5.0 melt index
Nominal 0.3 melt index
4.4
14.0
0.960 0.965
Density (g/ml)
Fal
ling
wei
ght
impac
t st
rengt
h (
J(F
50))
Figure 1.48 Effect of density on falling weight impact strength of HDPE in various melt indices at 23 ºC (1.5 mm compression moulded samples). Source: Author’s
own files
Janik and Krolikowski [24] investigated the effect of Charpy notched impact strength and other mechanical properties (tensile strength, flexural strength, elastic modulus, flexural modulus, melt viscosity, fracture) on the mechanical and rheological properties of PE-PET blends.
Pick and Harkin-Jones [44, 45] and others investigated the relationship between the impact performance of rotationally moulded PE products and their dynamic mechanical properties.
Comparisons with regard to impact performance were made between metallocene-catalysed linear low-density polyethylene (LLDPE) and Ziegler-Natta LLDPE. The transitions evident in dynamic mechanical thermal analysis (DMTA) results are related

67
Mechanical Properties of Polymers
to changes in impact performance with temperature. The beta transition is found to fall in the transition region between high impact performance at low temperatures and lower impact performance at ambient temperatures.
1.7 Shear Strength
Apparatus for the measurement of this property according to ASTM D732 [71] is available from ATS FAAR (Table 1.8). Briatico-Vangosa and co-workers [33] discussed the relationship between surface roughness and shear strength in ultra high MW PE.
Table 1.8 Instrumentation, compressive set and mould shrinkage
Method ATS FAAR Apparatus code
number
Units Test suitable for meeting the following
standards
Compressive set to measure permanent deformation
10.65000 (stress) 10.07000 (strain)
-
-
ASTM D395 [46] ISO 815 [48] UNI 6121 [49]
Mould shrinkage injection compression and post-shrinkage
- % DIN 53464 [50]
Source: Author’s own files
1.8 Elongation in Tension
Apparatus for the measurement of this property according to ASTM D32 [73] is available from ATS FAAR (Table 1.8).
1.9 Deformation Under Load
The use of light-scattering and X-ray beams to measure polymer deformation has been reported by Lee and co-workers [51] and Riekel and co-workers [52].

68
Physical Testing of Plastics
1.10 Compressive Set (Permanent Deformation)
The equipment described in the following section is supplied by ATS FAAR (Table 1.8).
Tests can be carried out under constant load Method A according to ASTM D395-03 [53]. The test is used to determine the capability of rubber compounds and elastomers in general to maintain their elastic properties after prolonged action of compression stresses. According to Method A of ASTM D395 [53], this stress is applied by a constant load.
The tester incorporates a spring with a calibration curve and is accurately calibrated to have a slope of 70 ± 3.5 kN/m at 1.8 kN force. Spring deflection is indicated by a vernier system with an accuracy of 0.05 mm applied directly to the moving plate.
The tester may be placed in an oven or in a cryogenic chamber to conduct tests in the range of +70 ºC to 30 ºC as indicated by ASTM specifications.
Tests can be carried out under constant deflection Method B according to ASTM D395 [53], ISO 815 [48] and UNI 6121 [49]. This method applies a constant compression stress to specimens having a diameter of 29 ± 0.5 mm or 13 ± 0.2 mm with a thickness of 12.5 ± 0.5 mm or 6 ± 0.2 mm. After introduction of the specimens, the apparatus is placed in a conditioning chamber for a preset time at a preset temperature. At the end of the heating period, the final thickness of the specimen is measured.
1.11 Mould Shrinkage
Apparatus for the measurement of this property according to DIN 53464 [50] is available from ATS FAAR (Table 1.8). Bertacchi and co-workers [54] reported on computer-simulated mould shrinkage studies on talc-filled PP, glass-reinforced PA and a PC/ABS blend.
1.12 Coefficient of Friction
This is an assessment of the coefficient of friction of materials in terms of dynamic (sliding) friction against steel. Friction is influenced by temperature, surface contamination and, most importantly, by the two material surfaces:
• An excellent rating indicates a low coefficient of friction.
• A very poor rating indicates a high coefficient of friction.

69
Mechanical Properties of Polymers
Miyata and Yamodka [55] used scanning probe microscopy (SPM) to determine the micro-scale friction force of silicone-treated polymer film surfaces. Polyurethane (PU) acrylates cured by an electron beam were used as polymer films. The micro-scale friction force obtained by SPM was compared with macro-scale data, such as surface free energy as determined by the Owens-Wendt method and the macro-scale friction coefficient determined by the ASTM method. These comparisons showed a good linear relationship between the surface free energy and friction force, which was insensitive to the nature of polymer specimens or to silicone treatment methods. Good linearity was also observed between the macro-scale and the micro-scale friction force. It was concluded that SPM could be a powerful tool in this field of polymer science. Everar and co-workers [56] reported coefficient of friction measurements for nitrile rubber. Frictional properties of PA, polyacetals, PET/poly tetrafluoroethylene (PTFE) [33] as well as polyesters and acrylics [353] have also been studied.
1.13 Fatigue Index
This is an assessment of the ability of materials to resist oscillating (or dynamic), load or deflection-controlled deformation:
• An excellent rating indicates excellent resistance to fatigue loading.
• A very poor rating indicates poor resistance to fatigue loading.
ATS FAAR supply flexing machines (De Mattia) for the measurement of resistance to dynamic fatigue to ASTM D430-95 [57] and ASTM D813-95 [58] (Table 1.9). These test methods are utilised to test the resistance to dynamic fatigue of rubber-like materials if subjected to repeated bending. The tests simulate the stresses in tension or in compression of inflexion or in a combination of the three modes of load application to which the materials will be subjected when in use.
The failure of tested specimens is indicated by cracking of the surface or, as prescribed by ASTM D813 [58] specifications, by the dimensional increase of a nick made on the specimen before starting the test. In the case of composite materials, the failure can show up as separation of the different layers.
Lin and co-workers [59] also investigated the static tensile strength and fatigue behaviour of long glass-fibre-reinforced semi-crystalline PA (Nylon 6,6) and amorphous PC composites. The static tensile measurement at various temperatures and tension-tension fatigue loading tests at various levels of stress amplitudes were studied. The two-parameter Weibull distribution function and the pooled Weibull distribution function was applied to obtain the statistical probability distribution of experimental data of static tensile strength and fatigue life under different stress amplitude tests.

70
Physical Testing of Plastics
The increasing dynamic creep property and temperature under tension-tension fatigue loading are compared between semi-crystalline and amorphous composites. Results show that the static tensile strength of PA composites is higher than that of PC composites, with lower fatigue life and more sensitivity to temperature. The slope of S-N0 curves of long glass-fibre-reinforced semi-crystalline PA and amorphous PC composites are almost identical.
Table 1.9 Instrumentation for measurement of dynamic fatigue
Method ATS FAAR Apparatus code number
Test suitable for meeting the following standards
Resistance to dynamic fatigue on bending (De Mattia apparatus)
10.23000 10.23001 10.23003
ASTM D430 [57] ASTM D813 [55]
Cold bend test (cables) 10.65053 ASTM D430 [57] ASTM D813 [58]
Source: Author’s own files
1.14 Toughness
Toughness tests are traditionally carried out at 40 ºC (-40 ºF) or at 20 ºC (68 ºF).
This quantity is related to the notched Izod impact strength. It includes an assessment of the overall fracture toughness of the polymer.
1.15 Abrasion Resistance or Wear
This is an assessment of the rate at which material is lost from the surface of the specimen when abraded against a steel face. Wear rates are dependent upon numerous factors, including contact pressure, relative velocity, temperature and initial surface roughness. This rating considers the inherent ability of a material to resist wear:
• An excellent rating indicates excellent resistance to wear.
• A very poor rating indicates poor resistance to wear.

71
Mechanical Properties of Polymers
Table 1.10 Comparison of fatigue index, abrasion resistance and coefficient of friction
Polymer Type Fatigue index
Wear Coefficient of friction
LDPE General purpose (GP)
Very good Poor Very poor
Crosslinked polyethylene GP Good Good Very poorHDPE GP Very good Good GoodPolypropylene GP Excellent Good GoodPolybutylene GP Very good Very good Very poorPolymethyl pentene GP Very good Good PoorEthylene-propylene copolymer
GP Excellent Good Very poor
Styrene-ethylene-butylene copolymer
GP Good Good Very poor
High-impact polystyrene GP Poor Very poor Very poorPolystyrene GP Good Very poor Very poorEpoxy resins GP Poor Good Very poorAcetal copolymer GP Very good - -Polyesters GP Good Poor Very poorPolybutylene terephthalate GP Good Good PoorPolyethylene terephthalate GP Poor Good Very poorPolyether ether ketone GP Very good Good GoodEthylene tetrafluoro ethylene GP Very good Poor Very poorPolycarbonate GP Poor Poor PoorPolyphenylene oxide GP Very poor Very poor GoodAcrylonitrile-butadiene-styrene terpolymer
30% glass fibre-reinforced
Poor Poor Very poor
Phenol-formaldehyde GP Poor Good Very poorPerfluoroalkoxy ethylene GP Very good Very poor PoorStyrene-maleic anhydride copolymer
GP Poor Very poor Very poor
Polymethylmethacrylate GP Poor Good Very poorEthylene vinylacetate copolymer
25% vinyl acetate
Very good Poor Very poor
Polyamide 11 GP Very good Good GoodPolyamide 12 GP Very good Good GoodPolyamide 6,6 GP Very good Good GoodPolyamide 6,10 GP Very good Good GoodPolyamide 6 GP Very good Good GoodPolyamide 6,9 GP Very good Good GoodPolyamide 6, 12 GP Very good Good GoodPolyamide-imide GP Poor Very good Poor
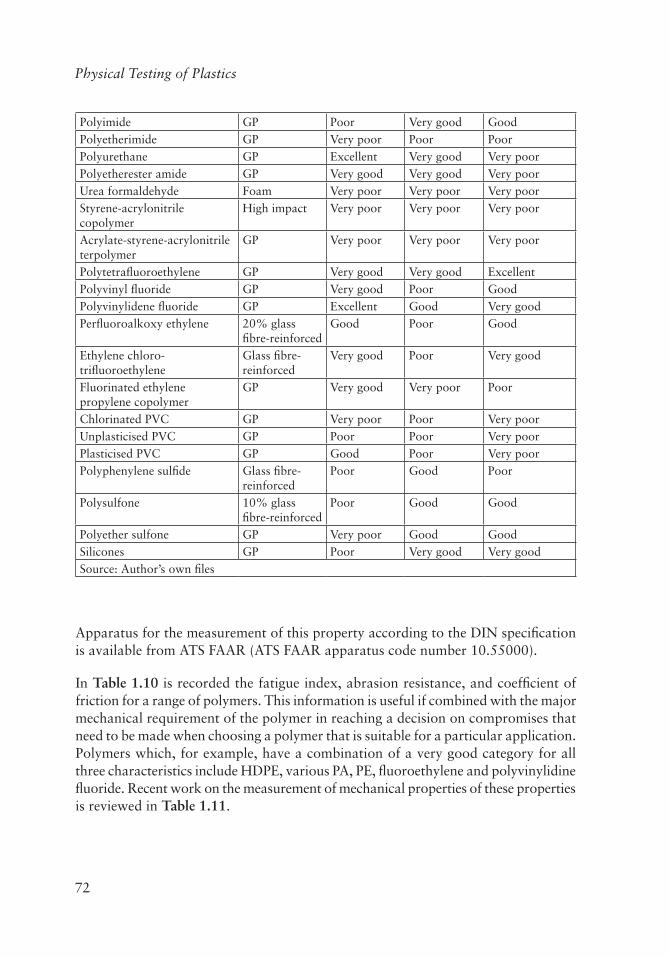
72
Physical Testing of Plastics
Polyimide GP Poor Very good GoodPolyetherimide GP Very poor Poor PoorPolyurethane GP Excellent Very good Very poorPolyetherester amide GP Very good Very good Very poorUrea formaldehyde Foam Very poor Very poor Very poorStyrene-acrylonitrile copolymer
High impact Very poor Very poor Very poor
Acrylate-styrene-acrylonitrile terpolymer
GP Very poor Very poor Very poor
Polytetrafluoroethylene GP Very good Very good ExcellentPolyvinyl fluoride GP Very good Poor GoodPolyvinylidene fluoride GP Excellent Good Very goodPerfluoroalkoxy ethylene 20% glass
fibre-reinforcedGood Poor Good
Ethylene chloro-trifluoroethylene
Glass fibre-reinforced
Very good Poor Very good
Fluorinated ethylene propylene copolymer
GP Very good Very poor Poor
Chlorinated PVC GP Very poor Poor Very poorUnplasticised PVC GP Poor Poor Very poorPlasticised PVC GP Good Poor Very poorPolyphenylene sulfide Glass fibre-
reinforcedPoor Good Poor
Polysulfone 10% glass fibre-reinforced
Poor Good Good
Polyether sulfone GP Very poor Good GoodSilicones GP Poor Very good Very goodSource: Author’s own files
Apparatus for the measurement of this property according to the DIN specification is available from ATS FAAR (ATS FAAR apparatus code number 10.55000).
In Table 1.10 is recorded the fatigue index, abrasion resistance, and coefficient of friction for a range of polymers. This information is useful if combined with the major mechanical requirement of the polymer in reaching a decision on compromises that need to be made when choosing a polymer that is suitable for a particular application. Polymers which, for example, have a combination of a very good category for all three characteristics include HDPE, various PA, PE, fluoroethylene and polyvinylidine fluoride. Recent work on the measurement of mechanical properties of these properties is reviewed in Table 1.11.

73
Mechanical Properties of Polymers
Table 1.11 Review of work on the determination of mechanical and thermal properties of polymers
Polymer Property discussed Reference
Polylactic acid Mechanical [65]
Polyethylene Mechanical [66]
Polypropylene Mechanical [67, 68]
Ethylene-1-octene Mechanical [69]
Polypropylene Mechanical and thermal [70, 72, 77, 79]
Ethylene-vinyl acetate Mechanical and thermal [71]
High-density polyethylene Mechanical and thermal [72]
Polyimide-modified epoxy Mechanical and thermal [73]
High-impact polystyrene Mechanical and thermal [74]
Polypropylene wood composite Mechanical and thermal [75]
Polycarbonate Mechanical and thermal [76-79]
Polycarbonate diols Mechanical and thermal [80]
Poly(3-hydroxybutyrate-co-hydroxyvalerate)
Mechanical and thermal [81]
PVC-polymethylmethacrylate blends
Mechanical and thermal [82]
PVC-wood composites Mechanical and thermal [83]
Polyurethane Mechanical and thermal [84]
Epoxy resin Mechanical and thermal [95]
Polycarbonate-PVC blend Mechanical and thermal [86]
Polyethylene-ethylene vinyl acetate mixtures
Mechanical and thermal [87]
Polyethylene-lignin polyblends Mechanical and thermal [88]
Polystyrene Mechanical and thermal [89]
Polypropylene-low-density polyethylene blends
Mechanical and thermal [90]
Polyethylene Mechanical and thermal [91]
Bisphenol epoxy vinyl ester Mechanical and thermal [92]
Fibre-reinforced polypropylene Mechanical and thermal [93]
Fluorocarbon elastomer Mechanical and thermal [95]
Acrylic elastomer Mechanical and thermal [94]
Polymethylmethacrylate Mechanical and thermal [96]
Polyethylene-terephthalate-polybutylene terephthalate blends
Mechanical and thermal [97]
Source: Author’s own files

74
Physical Testing of Plastics
1.16 Effect of Reinforcing Agents and Fillers on Mechanical Properties
Several typical reinforcing agents and filler have been used to improve or alter the mechanical properties of polymers. These include glass fibre, glass beads, calcium carbonate, minerals, mica, talc, clay, carbon fibres, carbon nanotubes, aluminium or other metal powders, silica and silicones [80-94, 96].
1.16.1 Glass Fibres
1.16.1.1 Poly Tetrafluoroethylene
The incorporation of 25% of glass fibre increases the tensile strength from 25 MPa to 180 MPa and the flexural modulus of PTFE from 0.07 GPa to 1.03 GPa while reducing the elongation at break from 400% to 240%.
1.16.2 Polyethylene Terephthalate
Incorporation of 30% glass fibres increases the tensile strength of PET from 55 MPa to 100 MPa and the flexural modulus from 2.3 GPa to 9.5 GPa while reducing the elongation at break from 300% to 2.2%. Glass-filled PP has been the subject of several studies involving tensile testing and the measurement of notched Izod impact strength. Gupta and co-workers [97] observed a maximum improvement of the mechanical and thermal properties in PP at 1% of a chemical coupling agent. However, deterioration in impact strength and elongation at break occurred with increasing contents of glass fibre in the polymer Type B in Table 1.12.
Other publications cover the effect of glass fibres on the mechanical and electronical properties of epoxies [109, 110], the crystallinity of PA 6 [111] and the thermal properties of PET [112].
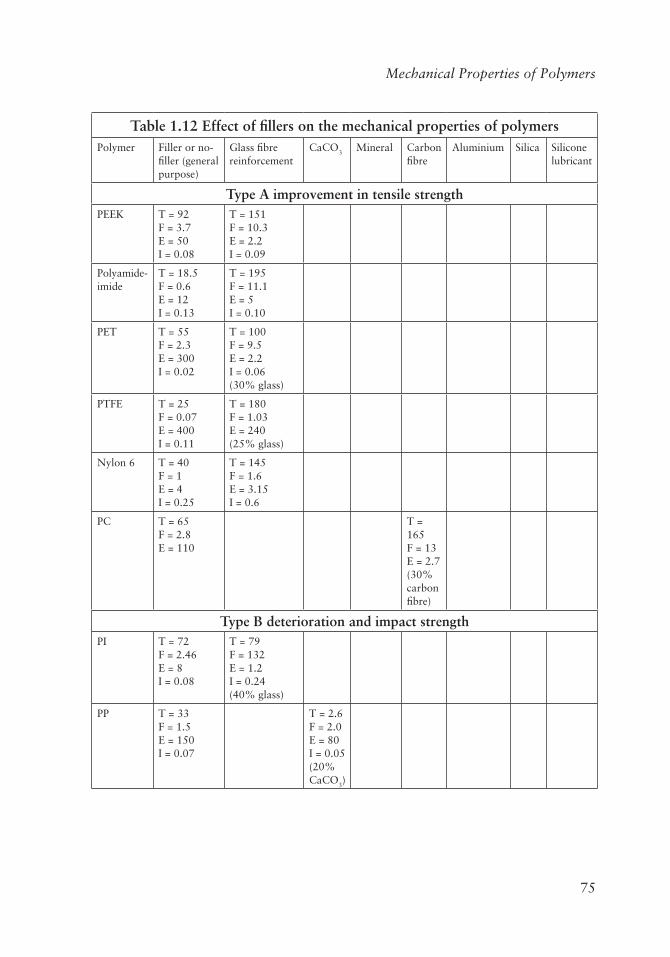
75
Mechanical Properties of Polymers
Table 1.12 Effect of fillers on the mechanical properties of polymersPolymer Filler or no-
filler (general purpose)
Glass fibre reinforcement
CaCO3 Mineral Carbon fibre
Aluminium Silica Silicone lubricant
Type A improvement in tensile strengthPEEK T = 92
F = 3.7 E = 50 I = 0.08
T = 151 F = 10.3 E = 2.2 I = 0.09
Polyamide-imide
T = 18.5 F = 0.6 E = 12 I = 0.13
T = 195 F = 11.1 E = 5 I = 0.10
PET T = 55 F = 2.3 E = 300 I = 0.02
T = 100 F = 9.5 E = 2.2 I = 0.06 (30% glass)
PTFE T = 25 F = 0.07 E = 400 I = 0.11
T = 180 F = 1.03 E = 240 (25% glass)
Nylon 6 T = 40 F = 1 E = 4 I = 0.25
T = 145 F = 1.6 E = 3.15 I = 0.6
PC T = 65 F = 2.8 E = 110
T = 165 F = 13 E = 2.7 (30% carbon fibre)
Type B deterioration and impact strengthPI T = 72
F = 2.46 E = 8 I = 0.08
T = 79 F = 132 E = 1.2 I = 0.24 (40% glass)
PP T = 33 F = 1.5 E = 150 I = 0.07
T = 2.6 F = 2.0 E = 80 I = 0.05 (20% CaCO3)

76
Physical Testing of Plastics
Polyalkyl-phthalate
T = 70 F = 10.6 E = 0.9 I = 0.40
T = 57 F = 9.5 E = 0.9 I = 0.35 (30% mineral)
Epoxy resins
T = 600 F = 80 E = 1.3
T = 68 F = 1.1
T = 58 F = 1.1 E = 0.8
T = 48 F = 9.5 E = 1.0
T = 72 F = 15 E = 1
Acetal T = 73 F = 2.6 E = 65 I = 0.06
T = 85 F = 17.2 E = 1 I = 0.04
T = 55 F = 2.1 E = 50 I = 0.085
E: Elongation (%) F: Flexural modulus (GPa), I: Izod impact strength (kJ/m) PC: Polycarbonate PEEK: Polyether ether ketone PET: Polyethylene terephthalate PI: Polyimide PP: Polypropylene PTFE: Polytetrafluoroethylene T: Tensile strength (MPa) Source: Author’s own files
Some of these fillers or reinforcing agents (e.g., filler glass) improve the tensile strength of the blend over that of the general glass-free polymer (Type A, Table 1.12). Glass-fibre additions in general lead to an increase in the flexural modulus (or modulus of elasticity) and a decrease in the elongation at break. In the case of other polymers (Type B, Table 1.12), addition of fillers such as glass fibre and calcium carbonate causes a distinct decrease in tensile strength (usually with an accompanying decrease in flexural modulus, elongation and impact strength). Some particular examples of these effects are discussed in more detail below.
The effects of fillers on mechanical properties are reviewed at Table 1.12.
1.16.2.1 Polyether Ether Ketone
As seen in Table 1.12, the incorporation of 50% glass fibre into polyether ether ketone (PEEK) increases the tensile strength from 92 MPa to 151 MPa and increases
77
Mechanical Properties of Polymers
the flexural modulus from 3.7 to GPa 10.3 GPa while decreasing the elongation at break from 50% to 2.2%.
1.16.2.2 Polyimide
In the case of polyimide, the incorporation of 40% glass fibre increases the flexural modulus from 2.46 GPa to 132 GPa with hardly any effect on tensile strength. The elongation at break falls from 8% to 1.2%.
1.16.2.3 Polyamide Imide
The incorporation of glass fibre increases the tensile strength of PA-imide from 18.5 MPa to 195 MPa (Table 1.2) and the flexural modulus from 0.6 GPa to 11.1 GPa while the elongation at break falls from 12% to 5%.
The effect of glass beads on the mechanical properties of PP has been studied [114]. Various workers have studied the effect of glass fibres on the influence of various factors such as melt temperature [351], weld line strength [352] and on annealing [353] on glass-reinforced polymers.
1.16.3 Calcium Carbonate
Calcium carbonate has been used as a reinforcing agent for polyetherether ketone [104], ABS terpolymer [85], PP [106], and PP-vinyl acetate (PPVA) copolymer [107].
Tang and co-workers [99] showed that the tensile modulus of the PPVA copolymer increased with increase in filler weight fraction. The impact strength decreased rapidly when the weight fraction of calcium carbonate fell below 10% and then decreased gradually with increasing weight fraction of calcium carbonate.
1.16.4 Modified Clays
Various workers have investigated the mechanical and thermal properties of polymers in which had been incorporated organically modified clays and Montmorillonites (Table 1.13). In general, it was found that increasing the clay contents of a polymer increased the storage and loss modulus as well as Young’s modulus and reduced crystallinity. The glass transition temperature (Tg) increased and thermal stability tended to improve.

78
Physical Testing of Plastics
Table 1.13 Influence of incorporation of organically modified clays and montmorillonite nanocomposites in polymers
Polymer Property investigated Reference
A MontmorillonitePolyurethane Glass transition (Tg), particle
size, electrical [334]
PVDF Thermal [335]
Polytrimethylene triphthalate Heat stability, mechanical [336]
Polyimide-amide Rheological [337]
Acrylonitrile-butadiene-styrene Thermal [338]
PE Thermal [339]
Polypropylene-ethylene-propylene diene Mechanical and viscoelastic [340]
Hydroxy benzoic acid-hydroxynaphthoic acid copolymers
Thermal [341]
LDPE Rheological [342]
Polyamide Mechanical and rheological [343]
Polystyrene nanocomposites Thermal [344]
B Organically modified claysPLA Rheological [345]
PS Rheological [346, 347]
PE Thermal [278]
Ethylene-propylene diene elastomers Mechanical and rheological [279]
PP Mechanical and thermal [280]
PP Viscoelastic
Ethylene-vinyl acetate Mechanical and thermal [281]
Maleic anhydride-based PP composites Rheological [282]
Epoxies Thermomechanical [283]
Nylon 12 Thermal and rheological [284]
High-impact PS-PET nanocomposite Mechanical and rheological [285]
Fluroroelastomers Thermal [286]
LDPE = Low-density polyethylene PE = Polyethylene PLA = Polylactic acid PP = Polypropylene PS = Polystyrene PVDF = Polyvinylidene fluoride Source: Author’s own files

79
Mechanical Properties of Polymers
Clay-polyvinylidene fluoride composites have a significantly improved storage modulus to the base polymer over the temperature range -100 ºC to 150 ºC [102]. Gupta and co-workers [103] and Yan and co-workers [104] reported on the mechanical and thermal behaviour of glass-fibre filled or glass bead-filled polyvinylidene-bentonite-clay nanocomposites, which were shown to have a significantly improved storage modulus to the base polymers [95].
1.16.5 Polymer-silicon Nanocompsites
It has been found that the Tg of ABS, silica [145] and polymerthyl methacrylates silica nanocomposites [146] increased with silica content. Also, the thermal properties were enhanced. Thus, the degradation temperature at 10% weight loss was ~30 ºC higher than that of pristine polymethyl methacrylate. Other properties that have been studied include mechanical, viscoelastic, thermal and optical properties [136-144] (Table 1.14).
Table 1.14 Properties of polymer-silica nanocompositesPolymer Property studied Reference
Ethylene diamine and maleic anhydride-grafted PP
Mechanical [147]
Epoxies Mechanical and thermal [148]
PS Viscoelastic [149]
Polyacrylonitrile Thermal [150]
Poly(3,4 ethylene-dioxythiophene) Optical [151]
Phenylene-vinylene oligomers Optical [152]
PP Crystallinity [153]
PET Crystallinity [154]
Source: Author’s own files
1.16.6 Carbon Fibres
Various mechanical properties have been determined on carbon fibres epoxy composites [155], as well as LDPE [156] and polyvinylidene fluoride [158].

80
Physical Testing of Plastics
Carbon fibre has been used in PC blends. For instance, 30% carbon fibre increased the tensile strength of PC from 68 MPa to 165 MPa and increased the flexural modulus from 2.8 GPa to 13 GPa while decreasing the elongation at break from 110% to 2.7%. Carbon fibre has also been used as a reinforcing agent in epoxy resins [106].
1.16.7 Carbon Nanotubes
As will be discussed in Chapter 3, the incorporation of carbon nanotubes into polymers can have beneficial effects on electrical properties such as conductivity. The measurement of mechanical properties of these polymers is reviewed in Table 1.15.
Table 1.15 Effect of carbon nanotubes on mechanical propertiesPolymer Property measured Reference
Epoxy composites Tensile and thermal [159]
Epoxy matrices Mechanical and thermal [160]
Polyurethanes Mechanical and rheological [161]
Polyethylene composites Mechanical and rheological [162]
Polyethylene glycol Morphological and rheological [163]
Polycaprolactone Rheological [164]
Nylon 10,10 Morphological and rheological [165]
PET Crystallinity [166]
PHB Morphological and thermal [167]
PC Rheological [168]
Polyetheramide and epoxy resins
Mechanical and electrical properties [169]
Epoxy resins Mechanical and electrical [170]
PEEK Rheological and electrical [171]
PI Crystallinity [172]
Ethylene-vinyl acetate Morphological and rheological [173]
Polysilsesquioxane Morphological and thermal [174]
Source: Author’s own files

81
Mechanical Properties of Polymers
1.16.8 Miscellaneous Fillers/Reinforcing Agents
Natural materials that have been used to modify polymer properties include wood sawdust [126, 127], coconut fibre [128] carbon fibres, [129], oat husks, cocao, shells [130], sugarcane fibres, [131] and banana fibre [132]. Mohanty and co-workers [101] observed a 70% increase in the flexural strength of polyorpylene to which had been added 30% jute with a maleic anhydride-grafted PP coupling agent.
Other materials that have been incorporated into polymers to modify mechanical and other properties include calcium sulfate in styrene-butadiene rubber [115]; barium sulfate in PE [115] and PP; [116] talc in PP [117]; aluminium in epoxies [118]; kaolinile-muscovite in PVC-polybutyl acrylate [119]; aluminium in PE [120]; nickel in epoxies [121]; copper in PE [122]; gold in PS [123]; caesium bromide in polyvinyl alcohol [124]; nickel-cobalt-zinc ferrite in natural rubber [125]; and carbon black in various polymers [133-134].
1.16.9 Test Methods for Fibre Reinforced Plastics
Sims [175] reviewed some UK contributions to the development of fibre-reinforced plastics such as those used for glass reinforced plastic pressure vessels and pipes. He also discussed the need for harmonising and validating the many variants of property testing methods currently in use.
Sims [175] has pointed out that a redraft of ISO 527 tensile testing for plastics has resulted in two complementary parts for composites: Part 4 based on ISO 3268 [176] covers isotropic and orthotropic materials and Part 5 covers unidirectional materials [175]. There is a need to harmonise these two methods into a new part 5. Inputs were included from ISO, ASTM, CRAG and EN aerospace methods. The remaining three parts are: Part 1 - general principles; Part 2 - plastics and moulding materials (including short fibre-reinforced materials); and Part 3 - films. ISO DIS 527-5 has in parallel been voted as a European Committee for Standardization (CEN) standard (EN 527-5) and should, with part 4, replace EN61 [185] and possibly two Aerospace EN standards [149-180].
Obtaining agreement between ISO, CEN General series, EN aerospace-carbon only, ASTM and JIS in specimen sizes for unidirectional reinforced materials was a notable first step towards harmonisation of the test methods, particularly because the 1.25 cm wide ASTM specimen [182] has been in extensive use for many years. The agreed dimensions are 15 × 1 mm for 0º and 25 × 2 mm for 90º fibre direction specimens [179]. After agreement on the specimen sizes (which is the same in all standards series

82
Physical Testing of Plastics
except EN Aerospace for glass-fibre systems [180]), several other aspects of the test method were decided upon during drafting of the new standard.
A complete list of recommended mechanical test methods for fibre-reinforced plastics has been reported [183-213].
1.17 Application of Dynamic Mechanical Analysis
1.17.1 Theory
Dynamic mechanical analysis (DMA) provides putative information on the viscoelastic and rheological properties (modulus and damping) of materials. Viscoelasticity is the characteristic behaviour of most materials in which a combination of elastic properties (stress proportional to strain rate) are observed. DMA simultaneously measures the elastic properties (modulus) and viscous properties (damping) of materials.
DMA measures changes in mechanical behaviour such as modulus and damping as a function of temperature, time, frequency, stress, or combinations of these parameters. The technique also measures the modulus (stiffness) and damping (energy dissipation) properties of materials as they are deformed under periodic stress. Such measurements provide quantitative and qualitative information about the performance of materials. The technique can be used to evaluate elastomers, viscous thermoset liquids, composite coatings and adhesives, and materials that exhibit time, frequency and temperature effects or mechanical properties because of their viscoelastic behaviour.
Some of the viscoelastic and rheological properties of polymers that can be measured by DMA are [223, 224, 354]:
• Modulus and strength (elastic properties)
• Viscosity (stress-strain rate)
• Damping characteristics
• Low- and high-temperature behaviour (stress-strain)
• Viscoelastic behaviour
• Compliance
• Stress relaxation and stress relaxation modulus
83
Mechanical Properties of Polymers
• Creep
• Gelation
• Projection of material behaviour
• Polymer lifetime prediction
Basically, this technique involves measurement of the mechanical response of a polymer as it is deformed under periodic stress. It is used to characterise the viscoelastic and rheological properties of polymers.
DMA is measurement of the mechanical response of a material as it is deformed under periodic stress. Material properties of primary interest include modulus (E´), loss modulus (E´´), tan δ (E´´/E´), compliance, viscosity, stress relaxation and creep. These properties characterise the viscoelastic performance of a material.
DMA provides material scientists and engineers with the information necessary to predict the performance of a material over a wide range of conditions. Test variables include temperature, time, stress, strain and deformation frequency. Because of the rapid growth in the use of engineering plastics and the need to monitor their performance and consistency, DMA has become the fastest-growing thermal analysis technique.
Recent advances in materials sciences have been the cause and effect of advances in the technology of materials characterisation.
The theory of DMA has been understood for many years. However, because of the complexity of measurement mechanics and the mathematics required to translate theory into application, DMA did not become a practical tool until the late 1970s when DuPont developed a device for reproducibly subjecting a sample to appropriate mechanical and environmental conditions. The addition of computer hardware and software capabilities several years later made DMA a viable tool for the industrial scientist because it greatly reduced analysis times and labour-intensity of the technique.
DMA provides information on the viscoelastic properties of materials. Viscoelasticity is the characteristic behaviour of most materials in which a combination of elastic properties (stress proportional to strain) and viscous properties (stress proportional to strain rate) are observed. DMA simultaneously measures elastic properties (modulus) and viscous properties (damping) of a material. Such data are particularly useful because of the growing trend towards the use of polymeric materials as replacements for metal and structural applications.

84
Physical Testing of Plastics
The DuPont 9900 system controls the test temperature and collects, stores and analyses the resulting data. Data analysis software for the DuPont 983/9900 DMA system provides hardcopy reports of all measured and calculated viscoelastic properties, including time/temperature superpositioning of the data for the creation of master curves. A separate calibration programme automates the instrument calibration routine and ensures highly accurate, reproducible results. In addition to measuring the specific viscoelastic properties of interest, the four modes provide a more complete characterisation of materials (including their structural and end-use performance properties). The system can also be used to simulate and optimise processing conditions, such as those used with thermoset resins.
The DuPont 983 DMA system can evaluate a wide variety of materials, ranging from the very soft (e.g., elastomers, supported vicious liquids) to the very hard (e.g., reinforced composites, ceramics, metals). The clamping system can accommodate a range of sample geometries, including rectangles, rods, films and supported liquids. The DuPont 983 instrument produces quantitative information on the viscoelastic and rheological properties of a material by measuring the mechanical response of a sample as it is deformed under periodic stress.
1.17.2 Instrumentation (Appendix 1)
Seiko Instruments supplies the Exstar 6000 Series, DMM 6100 [225]. The instrument can determine characteristics such as Tg damping intensity, heat resistance and creep and stress relaxation of various materials. This allows the user to obtain complete characterisation of a processed material. The instrument can also be used to evaluate the compatibility, anisotropy, vibration absorbency, MW, degree of crystallinity and degree of orientation of polymeric and elastomeric materials.
Recently introduced instruments from TA Instruments include the DMA Q800 analyser [226, 227]. The instrument can be used for the testing of mechanical properties of a broad range of viscoelastic materials at temperatures ranging from -150 ºC to 600 ºC. The DMA Q800 system is claimed to provide unmatched performance in stress-strain control and measurement. It uses a proprietary non-contact linear motor to provide precise stress control and optical encoder technology for unmatched sensitivity and resolution in strain deflection.
The Mettler-Toledo Incorporated SDTA 861 DMA analyser [235] can provide measurements over wide frequency ranges (1 mHz to 1 kHz) and large dynamic stiffness ranges. A schematic of the instrument is illustrated and examples represented of test data for various rubbers obtained using this equipment. Other suppliers include Rheometric Scientific and Thermocahn [229].

85
Mechanical Properties of Polymers
Arm-locking pins
LVDT adjustment screwLVDT
Flexure pivot
Sample arm
Sample
Clamp
Control and samplethermocouples
Mechanical slide
Vernier adjustment knob
Slide lock
Electromagneticdriver
Figure 1.49 DMA Electromechanical System, linear variable differential transformer. Source: Author’s own files
Figure 1.49 shows the mechanical components of the DuPont 983 DMA system. The clamping mechanism for holding samples in a vertical configuration consists of two parallel arms, each with its own flexure point, an electromagnetic driver to apply stress to the sample, a linear variable differential transformer for measuring sample strain, and a thermocouple for monitoring sample temperature. A sample is clamped between the arms and the system is enclosed in a radiant heater and Dewar flask to provide precise temperature control.
Easily interchanged clamp faces are designed to accommodate various geometries: smooth and serrated faces for rectangular shapes and notched faces to hold cylinders or tubing. A horizontal clamping system with smooth clam faces is available to hold soft samples and supported liquids.
The sample is clamped between the ends of two parallel arms, which are mounted on low-force flexure pivots, allowing motion in only the horizontal plane. The distance between the arms is adjustable by means of a precision mechanical slide to accommodate a wide range of sample lengths. An electromagnetic motor attached to one arm drives the arm/sample system to a strain selected by the operator. As the
86
Physical Testing of Plastics
original sample system is displaced, the sample undergoes flexural deformation. A linear variable differential transformer mounted on the driven arm measures the response of the sample (strain and frequency) to the applied stress, and provides feedback control to the motor.
The sample is positioned in a temperature-controlled chamber which contains a radiant heater and a coolant distribution system. The radiant heater provides precise and accurate control of sample temperature. The coolant distribution system uses cold nitrogen gas for smooth, controlled sub-ambient operation and for quench cooling at the start or end of a run. The radiant heater and the coolant accessory are controlled automatically by the DuPont 983 system to ensure reproducible temperature programming. An adjustable thermocouple, mounted close to the sample, provides precise feedback information to the temperature controllers, as well as the readout of sample temperature.
1.17.3 Fixed Frequency Mode
This mode is used for accurate determination of the frequency-dependence of materials and prediction of end-use product performance. In the fixed frequency mode, applied stress (i.e., force per unit area that tends to deform the body, usually expressed in Pa (N/m)) forces the sample to undergo sinusoidal oscillation at a frequency and amplitude (strain), i.e., deformation from a specified reference state, measured as the ratio of the deformation to the total value of the dimension in which the strain occurs. Strain is non-dimensional, but is frequently expressed in reference values (such as percentage strain) selected by the operator. Energy dissipation in the sample causes the sample strain to be out of phase with the applied stress (Figure 1.50a). That is, the sample is viscoelastic, so the maximum strain does not occur at the same instant as maximum stress. This phase shift or phase lag, defined as the phase angle (δ), is measured and used with known sample geometry and driver energy to calculate the viscoelastic properties of the sample.
The DuPont 983 analyser can be programmed to measure the viscoelastic characteristics of a sample at up to 57 frequencies during a single test. In such multiplexing experiments, an isothermal step method is used to hold the sample temperature constant while the frequencies are scanned. The sample is allowed to reach mechanical and thermal equilibrium at each frequency before data are collected. After all the frequencies have been scanned, the sample is automatically stepped to the next temperature and the frequency scan repeated. Multiplexing provides a more complete rheological assessment than is possible with a single frequency.

87
Mechanical Properties of Polymers
1.17.3.1 Resonant Frequency Mode
This mode is used for detection of subtle transitions, which are essential for understanding the molecular behaviour of materials and structure-property relationships. Allowing a sample to oscillate at its natural resonance provides higher damping sensitivity than at a fixed frequency, making possible detection of subtle transitions in the material. Because of its high sensitivity, the resonance mode is particularly useful in analysing polymer blends and filled polymers, such as reinforced plastics and composites.
In the resonance mode, the DuPont 983 system operates on the mechanical principle of forced resonant vibratory motion at fixed amplitude (strain), which is selected by the operator. The arms and sample are displaced by the electromagnetic driver, subjecting the sample to a fixed deformation and setting the system into resonant oscillation.
In free vibration mode, a sample will oscillate at its resonant frequency with decreasing amplitude of oscillation (dashed line in Figure 1.50b). The resonance mode of the DuPont 983 analyser differs from the free vibration mode in that the electromagnetic driver puts energy into the system to maintain fixed amplitude (Figure 1.50b).
Time
Phase angle (δ) Fixed frequency(a)
Stress (σ)
Strain (ε)
Stre
ss
Stra
in

88
Physical Testing of Plastics
Time
Resonant frequency
Free vibration983 DMA resonant mode
(b)O
scil
lati
on
am
plitu
de
Time
t0 t1 t2 t3 t4 t5
(c)
Stra
in
Strain
Strainrecovery
Stre
ss
Stress
Stress relaxationT
emper
ature
(°C
)Temperature

89
Mechanical Properties of Polymers
Time
t0 t1t2 t3 t4
t5
(d)
Stra
in
Strain
Strainrecovery
Stre
ssStress Creep
Tem
per
atu
re (
°C)Temperature
Figure 1.50 Modes of operation in the DuPont 983 dynamic mechanical analyser. Source: Author’s own files
The make-up energy, oscillation frequency and sample geometry are used by the DMA software to calculate the desired viscoelastic properties.
1.17.3.2 Stress Relaxation Mode
Stress relaxation is defined as a long-term property measured by deforming a sample at a constant displacement (strain) and monitoring decay over a period of time. Stress is a very significant variable that can dramatically influence the properties of plastics and composites.
Induced stress is always a factor in structural applications, and can result from processing conditions, thermal history, phase transitions, surface degradation and variations in the expansion coefficient of components in a composite. The modulus of a material is not only temperature-dependent but also time-dependent, so the stress relaxation behaviour of polymers and composites is of great importance to the structural engineer. Stress relaxation is also important to the polymer chemist developing new engineering plastics because relaxation times and moduli are affected by polymer structures and transition temperatures. Therefore, it is essential that

90
Physical Testing of Plastics
polymeric materials that will be subjected to loading stress be characterised for stress relaxation and creep behaviour.
Figure 1.51 shows the stress relaxation curves obtained for PC. The large drop in the modulus of the material >130 ºC is caused by the increased mobility of the polymer molecules as the Tg is approached.
The stress relaxation mode is used for measurement of ultra low-frequency relaxation in polymers and composite structures (a primary indicator of the long-term performance of materials). This mode of operation provides definitive information for prediction of the long-term performance of materials by measuring the stress decay of a sample as a function of time and temperature at an operator-selected displacement (strain).
Figure 1.50c is a schematic representation of the process of measuring stress relaxation in a viscoelastic material. Using an isothermal step method, the sample is allowed to equilibrate at each temperature in an unstressed state. The sample is then stressed to the selected strain. The amount of driver energy (stress) required to maintain that displacement is recorded as a function of time for a period selected by the operator. After the measurements are recorded, the driver stress is removed and the sample is allowed to recover in an unstressed state. This sample recovery (strain) can be recorded as a function of time for a period selected by the operator. If the measurements at one temperature are complete, the temperature is increased and the experiment repeated.
1.17.3.3 Creep Mode
Creep is defined as a long-term property measured by deforming a sample at a constant stress and monitoring the flow (strain) over a period of time. Viscoelastic materials flow or deform if subjected to loading (stress). In a creep experiment, a constant stress is applied and the resulting deformation measured as a function of temperature and time. Just as stress relaxation is an important property to structural engineers and polymer scientists, so is creep behaviour.
The elastic modulus is a quantitative measure of the stiffness or rigidity of a material. For example, for homogeneous isotropic substances in tension, the strain (ε) is related to the applied stress (o′) by the equation E = o′/ε, where E is defined as the elastic modulus. A similar definition of shear modulus (g) applies if the strain is shear.
For a PEEK laminate below the Tg, the laminate exhibits <2% creep, whereas above the Tg creep increases to >10%.

91
Mechanical Properties of Polymers
0
0 200
2 90110
130
150
170 190 210 230250
270 290
310 ºCMode: CreepSize: 35.90 × 12.43 × 1.00 mm
400 600 800
Time (min)
(–)
Per
cent
cree
p
1000 1200 1400
4
6
8
10
12
14
16
Figure 1.51 Stress relaxation modulus of PC. Source: Author’s own files
The thermal curve in Figure 1.52 shows the flexural storage modulus-and-loss properties of a rigid pultruded oriented-fibre-reinforced vinyl ester composite. The flexural modulus and Tg increase dramatically with post-curing, so the test can be used to evaluate the degree of cure, as well as to identify the high-temperature mechanical integrity of the composite.
The creep mode is used for the measurement of flow at constant stress to determine the load-bearing stability of materials, which is a key to prediction of product performance. The creep mode is used to measure sample creep (strain) as a function of time and temperature at a selected stress. Using the isothermal step method, the sample is allowed to equilibrate at each temperature in a relaxed state. After equilibration, the sample is subjected to a constant stress (Figure 1.52). The resulting sample deformation (strain) is recorded as a function of time for a period selected by the operator. After the first set of measurements is made, the driver stress is removed and the sample is allowed to recover in an unstressed state. Sample recovery (strain) can be recorded as a function of time for any desired period. If the measurement at one

92
Physical Testing of Plastics
temperature is complete, the temperature is changed and the measurement repeated.
Creep studies are particularly valuable for determining the long-term flow properties of a material and its ability to withstand loading and deformation influences.
Temperature (ºC)
1st temperature scan(undercured as received)
2nd temperature scan(post cured on 983 DMAduring 1st scan)
Amplitude (p–p) = 0.20 mm
(– –
–)
E f
lexura
l st
ora
ge m
odulu
s (G
Pa)
(– –
–)
E f
lexura
l st
ora
ge m
odulu
s (G
Pa)
50
40
30
20
10
0
50
40
30
20
10
050 90 110 130 150 170 190 210 230 25070
Figure 1.52 Flexural storage modulus-and-loss properties of rigid extruded oriented fibre reinforce vinyl ester composites. Source: Author’s own files
Whereas elastic modulus at a single temperature (as measured by a static-mode instrument) is indicative of the properties and quality of metals, this is not necessarily true of polymeric materials in which molecular relaxations dramatically influence the temperature and time (reciprocal frequency) dependences of material properties.
DMA is the preferred tool for evaluation of the effects of the following variables on the mechanical properties of materials:
• Temperature:Temperaturescanningcandetermineifproductperformancewillremain within the specifications at end-use temperatures.

93
Mechanical Properties of Polymers
• Frequency (1/time) deformation: Frequency sweeps can be used to study thefrequency dependence of material properties.
• Load:Creepandstressrelaxationmeasurementscandeterminethe long-termmechanical properties of materials and their ability to withstand loading and deformation influences.
The DuPont 983 DMA is a versatile laboratory instrument for characterising the viscoelastic and rheological behaviour of materials. Various applications of DMA are reviewed in Sections 1.17.2.5-1.17.2.17. Various applications of DMA are reviewed below.
1.17.3.4 Projection of Material Behaviour using Superpositioning
The effects of time and temperature on polymers can be predicted using time-temperature superpositioning principles. The latter are based upon the premise that the process involved in molecular relaxation or rearrangements occur at greater rates at higher temperatures. The time over which these processes occur can be reduced by conducting the measurement at elevated temperatures and transposing the data to lower temperatures. Thus, viscoelastic changes that occur relatively quickly at higher temperatures can be made to appear as if they occurred at longer times simply by shifting the data with respect to time.
Viscoelastic data can be collected by condcuting static measurements under isothermal conditions (e.g., creep or stress relaxation) or by undertaking frequency multiplexing experiments in which a material is analysed at a series of frequencies. By selecting a reference curve and then shifting the other data with respect to time, a ‘master curve’ can be generated. A master curve is of great value because it covers times or frequencies outside the range readily accessible by experiment.
Figure 1.53a shows the DMA frequency multiplexing results for an epoxy/fibreglass laminate. The plot shows the flexural storage modulus (E´) and the loss modulus (E´´) as a function of temperature at various analysis frequencies. The loss modulus peak temperatures show that the Tg moves to higher temperatures as the analysis frequency increases. Through suitable calculations, the storage modulus data can be used to generate a master curve (Figure 1.53b). The reference temperature of this is 125 ºC and shows the effects of frequency on the modulus of the laminate at this temperature. At very low frequencies (or long times), the material exhibits a low modulus and would behave similarly to a rubber. At high frequencies (or short times), the laminate behaves like an elastic solid and has a high modulus. This master curve demonstrates that data collected over only two decades of frequency can be transformed to cover more than nine decades.

94
Physical Testing of Plastics(–
–––)
Fle
xu
ral
sto
rage
mo
du
lus
(GP
a)
(– –
–)
Fle
xu
ral
sto
rage
mo
du
lus
(GP
a)
10
9
8
7
Mode: Fixed frequency(0.1, 0.32, 1.0, 3.2, 8.0 Hz)
Temperature (°C)
6
5
4
3
2
180 90 100 110 120 130 140 150
0.0
0.2
0.4
0.6
0.8
1.0
1.2
1.4
(a)
Log
[E (
Pa)
]
10
9
8
7
6
5
4
3
2
1–6 –4 –2 0 2 4 6
(b)
Figure 1.53 Dynamic mechanical analysis (a) frequency multiplexing results for an epoxy/fibreglass laminate; and (b) the master curve generated from fixed frequency
multiplexing data for epoxy fibreglass laminate. Source: Author’s own files

95
Mechanical Properties of Polymers
Example of the practical uses for superpositioning are:
• Gaskets:Tomeasureflow(creepandstressrelaxation)effects,whichreducesealintegrity over time.
• Force-fitofsnapparts:Tomeasurestressrelaxationeffects,whichcanleadtojoint failure.
• Structuralbeams:Tomeasuremodulusdropwithtime,whichleadstoincreasingbeam deflection under load over time.
• Boltplates:Tomeasurethecreepofthepolymer,whichreducesthestressappliedby the fastener.
• Hoses:Tomeasurethecreepofthepolymer,whichcanleadtoprematureruptureof the hose.
• Acoustics:Toaidintheselectionofmaterialsthatexhibithighdampingpropertiesin specific frequency ranges.
• Elastomericmounts:Toassessthelong-termcreepresistanceofmountsusedforvibration damping with engines, missiles and other heavy equipment.
• Structuralparts:Tomeasurehighdeformationfrequencies,whichcauseshiftingof molecular transitions to high temperatures and can result in impact failure or microcracking.
1.17.3.5 Prediction of Polymer Impact Resistance
Impact resistance is critical in the end uses of many commercial plastic products. Measurement of impact properties, however, requires lengthy sample preparation and is often irreproducible. For example, the ASTM drop weight (falling dart) impact (DWI) method D5420 [40] and D5628 [41] requires an impact measurement on as many as 30 samples. Each sample must be prepared by high-quality injection moulding, followed by temperature conditioning at -29 ºC for 24 hours.
Low-temperature loss peak measured by DMA correlates with the ASTM DWI values. DMA values are more precise than DWI measurements, so as few as four determinations can be used to rank impact resistance. Sample preparation for DMA is not lengthy and does not require sophisticated processing equipment because surface effects are not critical and smaller samples are used. Figure 1.54 shows the comparative DMA profiles for a series of impact-modified PP. The intensity of the damping peak at -110 ºC correlates well with the DWI values at -29 ºC. Using these

96
Physical Testing of Plastics
types of data, a suitable calibration curve can be developed so that future formulations can be rapidly screened by DMA.
1.17.3.6 Effect of Processing on Loss Modulus
PEEK is an important matrix material for thermoplastic composite applications. The properties of PEEK laminate depend primarily on this morphology developed during processing. Cooling rate, time in the melt, and sub-melt annealing are all critical processing variables that can be simulated and the effects of changes immediately evaluated by DMA. Figure 1.55 illustrates, for example, the effects of cooling rate on loss modulus results. The peak maximum temperature, reflective of the Tg of the matrix, increases significantly as the cooling rates is decreased. The magnitude of the loss peak decreases and the peak width increases significantly as the cooling rate is decreased. These changes in the loss modulus Tg peak can be explained in terms of increased free volume as well as decreased level of crystallinity as the cooling rates increase. A very fast cooling rate results in greater free volume in the amorphous phase and imparts greater mobility to the polymeric backbone. A decrease in the matrix crystalline content also results in greater mobility when passing through the Tg.
0.02
0.03
6
6
5
5
4
4
3
3
2
2
11
Impact resistanceDWI at –29 ºCCurve J
>61602717.27.22.4
0.04
–130 –90
Temperature (°C)
Tan
δ
–50 –10
Figure 1.54 Prediction of polymer impact resistance. Comparative dynamic mechanical analysis profiles for a series of impact-modified PP.
Source: Author’s own files

97
Mechanical Properties of Polymers
0.5
1.0
1.5
2.0
2.5
3.0
A – “Quick cooled”B – 20 ºC/minC – 5 ºC/minD – 2 ºC/minE – Standard processing
120 130 140 150 160 170 180 190 200 210
Temperature (°C)
Fle
xura
l lo
ss m
odulu
s (G
Pa)
Mode: Flxed frequency (1.0 Hz)
A
B
C
D
E
Figure 1.55 Effect of polymer processing on loss modulus by dynamic mechanical analysis. Effect of cooling rate of PEEK composite loss modulus at the Tg.
Source: Author’s own files
1.17.3.7 Material Selection for Elevated-temperature Applications
The task of evaluating new materials and projecting their performance for specific applications is a challenging one for engineers and designers. Often, materials are supplied with short-term test information such as deflection temperature under load (DTUL) (ASTM D648) [356], which is used to project long-term, high-temperature performance. However, because of factors such as polymer structure, filler loading and type, oxidative stability, part geometry and moulded-in stresses, the actual maximum long-term use temperatures may be as much as 150 ºC below or above the DTUL. DMA continuously monitors material modulus with temperature and hence provides a better indication of long-term elevated-temperature performance.
Figure 1.56 illustrates the DMA modulus curves for three resins with nearly identical DTUL: a PET, a polyethersulfone and an epoxy. The PET begins to lose modulus

98
Physical Testing of Plastics
rapidly at 60 ºC as the material enters the glass transition. The amorphous component of the polymer achieves an increased degree of freedom and, at the end of the Tg, the modulus of the material has declined by ~50% from room-temperature values. Because of its crystalline component, the material then exhibits a region of relative stability. The modulus again drops rapidly as the crystalline structure approaches the melting point. Because the Tg in a semi-crystalline thermoplastic is 150 ºC below its melting point, the actual modulus of a resin of this type at the DTUL is only 10-30% of the room-temperature value. The DTUL of highly filled systems based on these resins is more closely related to the melting point than to the significant structural changes associated with the Tg.
18
16
14
12
10
8
6
4
2
00 50
Epoxy
PESDTUL218 °C
DTUL224 °C
DTUL218 °C
PET
100 150 200 250 300
Temperature (°C)
[–––
] E
′ (G
Pa)
Figure 1.56 Comparison of DTUL and DMA results. Source: Author’s own files
1.17.3.8 Storage Modulus
One of the values obtained in a DMA is the storage modulus which approximately quantifies the flexural or tensile strength of a material. Figure 1.57 shows the

99
Mechanical Properties of Polymers
modulus of some common materials analysed over three decades of frequency using the frequency scan mode. In this mode, the temperature is held constant and the frequency at which the sample is oscillated is scanned from low to high, or from high to low, frequencies.
In polymer materials exhibiting viscoelastic behaviour, the modulus and viscosity are dependent upon the frequency of the DMA measurement. This frequency dependence is quite different for materials with different degrees of molecular branching, crosslinking, or MW distribution. The use of DMA in the frequency scan mode of operation is particularly important in material analysis because these types of molecular differences are very difficult to distinguish using any other thermal analysis techniques. For example, a frequency scan can show clear differences between PE samples having a difference in average MW of only a few percent.
The effect of frequency on materials and the corresponding rate dependence of materials on it can supply additional information about the viscoelastic characteristics of a polymer.
When frequency is being scanned, small differences in MW (and the distribution of MW) can be detected by shifts in the viscosity and modulus curves.
Storage modulus data have been reported for PP-wood composites [234], basalt fibre-reinforced PP [237], ethylene-propylene-diene terpolymer [238], polyvinyl fluoride-clay nanocomposites [239] thermosetting resins [240] and water-based adhesives [235, 236].
1.17.3.9 Frequency Dependence of Modulation and Elasticity
As shown in Figure 1.58, the frequency dependence of modulus and viscosity can be measured at different temperatures through the Tg to predict long-term behaviour of polymers. This information can be used to calculate how the polymer will perform over long durations at various temperatures and mechanical stress.

100
Physical Testing of Plastics
1011
Steel alloy
Uncured rubber
1010
109
108
107
106
105
104
103
102 101
Frequency (Hz)
Modulu
s (P
a)
101
1212
PTFE (25°C)
Chocolate (–5°C)
PDMS (20°C)
Figure 1.57 Examples of modulus range. Source: Author’s own files
Frequency (Hz)
Vis
cosi
ty (
Pa.
s)
Mo
du
lus
(Pa)
10110010–110–2
107
108
109
1010
1011
109
1010
1011
PC Board 130°C
125°C130°C
135°C
145°C
Figure 1.58 Viscoelastic behaviour through the Tg of epoxy PC board. Source: Author’s own files

101
Mechanical Properties of Polymers
1.17.3.10 Elastomer Low Temperature Properties
Flexibility is an important end-use property for elastomers. The Tg (which is the point at which an elastomer (on cooling) goes from a flexible more rubber-like form to a more rigid inflexible form) is a critical parameter in determining the suitability of the elastomer for specific applications. Plots of flexural storage modulus (in GPa) versus specimen temperature by DMA are very useful in evaluating the stiffness and flexibility of polymeric materials.
1.17.3.11 Tensile Modulus
The tensile modulus of poly-p-phenylene [230], relaxation modulus in LDPE [231], diglycidyl ether bisphenol A epoxy resins [232] and styrene-butadiene block copolymers with doped polyaniline [233] has been determined by DMA.
1.17.3.12 Stress-strain Relationships
Choosing the best conditions of dynamic stress and strain is often difficult if creating mechanical analysis methods for a series of samples. Sample behaviour will often change if the stress or strain imposed on a sample is increased or decreased, so a curve of stress versus strain is very valuable. The Newtonian or linear region for a material can be measured with the stress scan mode of the DMA. This is the region in which quantitative data can be obtained.
The stress scan (dynamic stress (10,000 Pa) versus strain (%)) of an unvulcanised rubber material depicted the linear region of this material to be within 0.8-0.27% strain and 2,000-4,200 Pa stress. Without this capability, this linear region of stress and strain can only be approximated.
Stress-strain curves have been reported for PE [241], PC [241], PA [241], polybutylene phthalate [250] and styrene-butadiene block copolymers [242].
A stress scan (i.e., dynamic stress (Pa) versus strain (5%) plots) will show the effect of increasing stress on a polymer. There is usually an initial region in which the strain is proportional to stress. Then, with increasing strain there can be deviations from linearity due to various molecular effects. Calculations can determine proportional limits, yield modulus, draw strength and ultimate modulus.
Kim and White [243] used DMA to study the stress relaxation behaviour of 3501-6 epoxy resin during cure.

102
Physical Testing of Plastics
Specimens were tested at several cure states to develop master curves of stress relaxation behaviour during cure. Using the experimental data, the relaxation modulus was then modelled in a thermorheologically complex manner. A exponential series was used to describe the relaxation times. Shift functions used to obtain reduced times were empirically derived based on curve fits to the data. The data showed that the cure state had a significant effect on the stress relaxation of epoxy resin. Furthermore, the relaxation behaviour above gelation was shown to be quite sensitive to the degree of cure.
Venneman and co-workers [244] reported the results of a study of the elastomeric properties of thermoplastic elastomers determined using temperature scanning stress relaxation analysis and recoverable strain after hysteresis. The thermoplastic elastomers tested were styrene-ethylene/butylene-styrene-based thermoplastic elastomers blended with PP, polyphenylene ether (PPE) and PPE/PA 12.
1.17.3.13 Viscosity
Sepe [240] showed that DMA allows the modulus and viscosity of a polymeric thermoset resin to be calculated, making it possible to follow crosslinking process by continuously monitoring these properties as the sample is heated.
Various workers [245-248] have discussed the application of DMA to the study of aspects of viscosity, elasticity and morphology. Bouton and Rheo [249] studied viscosity effects in blends of PC with styrene-acrylonitrile and ABS terpolymer.
1.17.3.14 Miscellaneous Applications of Dynamic Mechanical Analysis
DMA has also been used to determine the mechanical and thermal properties of LDPE and ethylene-propylene diene terpolymer containing jute filler, which had improved flexural and impact properties to those of the base polymer [280]. Jeong and co-workers [251] investigated the dynamic mechanical properties of a series of polyhexamethylene terephthalate, poly (1,4-cyclohexylenedimethylene terephthalate) and random copolymers thereof in the amorphous state as a function of temperature and frequency. The effect of copolymer composition on dynamic mechanical properties was examined and the dynamic mechanical properties interpreted in terms of the cooperativity of segmental motions.
Costa and co-workers [252] characterised polimides using gel permeation chromatography, differential scanning calorimetry (DSC), DMA optical microscopy and small- and wide-angle X-ray scattering. Stability of liquid crystalline phases

103
Mechanical Properties of Polymers
was discussed with respect to the number of ethylene oxide units and enthalpies of transition between crystalline and liquid crystalline phases as well as between liquid crystalline and isotropic liquid phases. The technique has also been applied to the study of thermal properties of epoxy-bis maleimide composites [253], the dynamic mechanical and thermal properties of maleic anhydride-treated jute HDPE composites [254], the curing behaviour and viscoelastic properties of epoxy-anhydride networks [255] and the mechanical alpha- and gamma-relaxation process of short-chain PE [256].
1.18 Rheology and Viscoelasticity
There are several rheological studies specific to particular polymers. These include dynamic rheological measurements and capillary theometry of rubbers [257], capillary rheometry of PP [258], degradation of PP [259], torsion rheometry of PE [260], viscosity effects in blends of PC with styrene-acrylonitrile and ABS [249], peel adhesion of rubber-based adhesives [261] and the effect of composition of melamine-formaldehyde resins on rheological properties [262].
As discussed in Section 1.17, DMA offers an enhanced means of evaluating the performance of polymeric systems at elevated temperatures. It provides a complete profile of modulus versus temperature as well as measurement of mechanical damping. Operating in the creep mode and coupled with the careful use of time-temperature superpositioning, projections can be made regarding the long-term time-dependent behaviour under constant load. This provides a much more realistic evaluation of the short- and long-term capabilities of a resin system than the values of DTUL.
Rheology is concerned with the flow and deformation of matter. Viscoelastic properties are more concerned with the flow and elasticity of matter.
Numerous references to rheology and viscoelasticity occur. Thus, 250 references have been identified in the five-year period between 2004 and 2008.
In addition to various moduli (storage, loss, loss shear, plateau) the following rheological properties of polymers can be determined by a range of techniques:
• Creepandstressrelaxation
• Shearstress
• Stressrelaxationbehaviour
• Order-disordertransitions

104
Physical Testing of Plastics
• Shearratedynamicviscosity
• Molecularentanglement
• Creepstrain
• Tg
• Meltfracture
• Frequencydependenceondynamicmoduli
• Clampingfunctionofshear
Particular applications of the techniques in studies of the viscoelastic and rheological properties of polymers are reviewed in Table 1.16.
Table 1.16 Measurement of rheological and viscoelastic properties of polymers
Polymer Property measured Technique Reference
LLDPE Storage modulus (alpha relaxation)
Effects of β irradiation
[263]
PS Storage shear modulus DMTA [264]
PBT and polyethylene naphthalate
Stress relaxation behaviour
Instron tester [274]
Polyvinyl alcohol hydrogels and ferrogels
Storage modulus [265]
PEEK (fibre-reinforced) Specimens loaded in flexure
DMA [266]
Poly(styrene-butadiene-isoprene)
Order transition Dynamic mechanical spectroscopy
[267]
PMMA and LDPE Shear modulus and clamping
Broadband viscoelastic spectroscopy
[268]
Polybutadienes Zero shear rate dynamic viscosity and Tg
GPC, FTIR, rheometry
[269]

105
Mechanical Properties of Polymers
Poly(phenylene sulfide)-Fe3O4 magnetic composite
Tg, steady state shear deformation
DSC, DMA, TGA
[270]
Ethylene-propylene random copolymer
Plateau modulus and entanglement
GPC, DSC, oscillatory rheometry
[271]
PP nanopolymer Structure and viscoelastic properties
X-ray diffraction, DMA, TGA
[272]
LLDPE Creep strain stress relaxation
DSC [273]
Polyethylene oxide-polypropylene oxide
Steady-state shear and oscillatory shear
- [274]
Branched polystyrenes Entanglements Oscillatory shear measurement
[275, 276]
Tetrafluoroethylene-hexafluoropropylene copolymer
Zero shear rate viscosity
Linear rheological properties
[277]
Poly(N-vinylpyrrolidone-co-dimethethylamino-propylmethacrylamide)
Radii of gyration GPC, multi-angle light scattering
[278]
Polyvinyl acetate Apparent viscosity, viscous flow activation energy
Viscometry [279]
Lightly crosslinked acrylic networks
Bulk rheological properties, elastic modulus, resistance to interfacial crack propagation
Dynamic mechanical spectroscopy
[280]
Polyethylacrylates Zero rate shear, viscosity dependence
Rheometric measurements
[281]
Polyalkylether ketone and polyaryl ether ketone
Dynamic rheological behaviour in oscillatory shear mode
Viscosity composition studies
[282]

106
Physical Testing of Plastics
PVDF Shear rate Apparent viscosity, activation energy
[283]
PP modified by ultrasonic waves
Structure of modified PP
High-intensity ultrasonic wave studies
[284]
Chlorinated polyethylene/natural rubber blends
Viscoelastic changes and thermal degradation
- [284]
DMA = Dynamic mechanical analysis DMTA = Dynamic mechanical thermal analysis DSC = Dynamic scanning calorimetry FTIR = Fourier-transform infrared spectroscopy GPC = Gel permeation chromatography LLDPE = Linear low-density polyethylene PMMA = Polymethylmethacrylate TGA = Thermogravimetric analysis Source: Author’s own files
1.19 Physical Testing of Rubbers and Elastomers
A wide variety of physical tests are available for rubbers and elastomers (Table 1.17).
1.19.1 Measurement of Rheological Properties
Negretti Automation offers a range of rheological testing instruments for rubber elastomers. Probably the top-of-the-market instrument is the THS rheometer. This is a unique and versatile instrument offering a complete characterisation of flow behaviour of a polymer in the unvulcanised state. Variable shear rates between 0.1/s and 100/s are available using a die and rotor principle with a preheated chamber. A typical curve obtained with this instrument is illustrated in Figure 1.59, which shows the curve obtained in the measurement of rheological behaviour.

107
Mechanical Properties of Polymers
Table 1.17 Physical testing of rubbers and elastomersProperties measured Instrument Testing
to the following standards
Supplier Notes
Rheology
Measurement of processability and rheological behaviour of raw (unvulcanised) elastomers at variable shear rates and temperatures (viscosity and elasticity)
THS Rheometer BS EN ISO 9001 [287]
Negretti Automation
Oscillating disc rheometry. Full analysis of vulcanisation curing
Rheo-Check 100C Barco Rheomicrocomputer package
BS ASTM ISO
Negretti Automation
Oscillating die rheometer Oscillating die rheometer
BS ASTM ISO
Gibitre, Italy, available from Negretti Automation
Viscometry
Viscosity measurement of rubbers and elastomers
Mark III Mooney viscometer
BS ASTM ISO NFT DIN JIN
Negretti Automation
Mark 8 Mooney viscometer
BS ASTM ISO NFT DIN JIN
Negretti Automation
Weight-density-volume variation
Balance check and Rapid Direct Reading density check
Gibitre, Italy, available from Negretti Automation
Hardness IRHD Micro durometer and durometer support
Gibitre, Italy, available from Negretti Automation

108
Physical Testing of Plastics
Brittleness point Low temperature brittleness check
ASTM D1329 [288]
Gibitre, Italy, available from Negretti Automation and ATS FAAR
Code Nos.
10.2900
10.29005
10.12010
Ross flexing test Measurement of cut growth when subject to repeat bend flexing
ASTM D1052 [289]
ATS FAAR Code no. 10.64002
De Mattia type flexing test De Mattia type dynamic testing machine
ASTM DIN
Gibitre, Italy, available from Negretti Automation
Mechanical properties
Resilience
Yersley mechanical oscillograph
ASTM D945 [290]
ATS FAAR Code no. 16.65100
Universal tensile testing
Mechanical stability of natural and synthetic lattices
Abrasion test
Peel adhesion test
Ozone degradation test Ozone check Gibitre, Italy, available from Negretti Automation and ATS FAAR
IRHD = International rubber hardness degrees Source: Author’s own files

109
Mechanical Properties of Polymers
Time
C
B
A
Shea
r st
ress
(k
Pa)
Figure 1.59 Characterisation of polymer flow behaviour with a TMS rheometer showing: (A) viscosity at very low shear rates, the stress measured is a function of viscosity; (B) transient flow-step changes from low the high shear rates generate a peak stress value which is a product of the thixotropic and structural features of the sample; and (C) elasticity - high shear rates produce results that represent
elastic behaviour. Source: Author’s own files
The Rheocheck 100C is a classic oscillating disc rheometer offering a full analysis of the vulcanisation curve with pre-set limits for quality-control purposes. It is available from the standard cost-effective computer/printer/plotter package. The instrument can be extended to include a Mooney viscometer.
The Barco Rheomicro computer package enables existing oscillating disc rheometers to be converted to a powerful dynamic testing system.
The Gibitre oscillating die Rheocheck system available from Negretti Automation is a moving die rheometer that enables the vulcanisation curve for any compound to be produced rapidly at closely controlled temperatures. It is designed for rapid computer-controlled quality checks in a production environment.
110
Physical Testing of Plastics
1.19.2 Viscosity and Elasticity
Depending upon temperature, shear rate and other flexural factors, the elements of viscosity and elasticity impose a varying influence on processing behaviour. A rheometer measures these in isolation in a single test, allowing prediction of processing behaviour at an early stage. It also allows close control of raw polymers of nominally identical specification from various sources, which often behave very differently when processed.
Negretti Automation supplies the Negretti Mooney viscometer which meets the requirements of all international standards. It is available with a digital control unit and recorder to provide semi-automatic operation.
In this instrument, the viscosity of a material is derived by measuring the torque required to rotate a disc squeezed between two samples of material at a defined pressure. The diagram of the system (Figure 1.60) shows how the presence of the sample around the shearing rotor causes a breaking reaction which can be measured as a thrust against the calibrated U-beam. The net displacement of the U-beam (which is proportional to the torque required to keep the rotor turning) is measured directly on a gauge and can also be plotted on a chart recorder. The results are read or plotted directly in Mooney units, which are universally used for viscosity measurement in the rubber industry.
In accordance with the standards, the sample is preheated for a set time to a temperature suitable for the test. For example, viscosity may be measured at 100 ºC, whereas scorch tests normally use a higher temperature, typically 125 ºC.
In the mechanical layout of the viscometer (Figure 1.60), the rotor is driven by the motor through the gear train and worm wheel. The axle carrying the ‘worm’ can move laterally in the direction of the arrow. When the motor is started with the rotor surrounded by a sample, rotation is resisted by the viscosity of the material. As a result, the worm rotates against the worm wheel and tries to move in the direction of the arrow. This movement is resisted by the U-beam and eventually the rotor is forced to turn.
The deflection of the U-beam is related to the torque required to turn the rotor and thus to the viscosity of the sample. The deflection can be read directly on the gauge, which is calibrated in Mooney units. It can also control the linear deflection transducer whose output drives a chart recorder.
Negretti Automation also supplies the Negretti Mark 8 Mooney viscomer which is a computer-controlled instrument offering improved temperature control, repeatability, hard copy of results, statistical memory and peripheral computer interface.
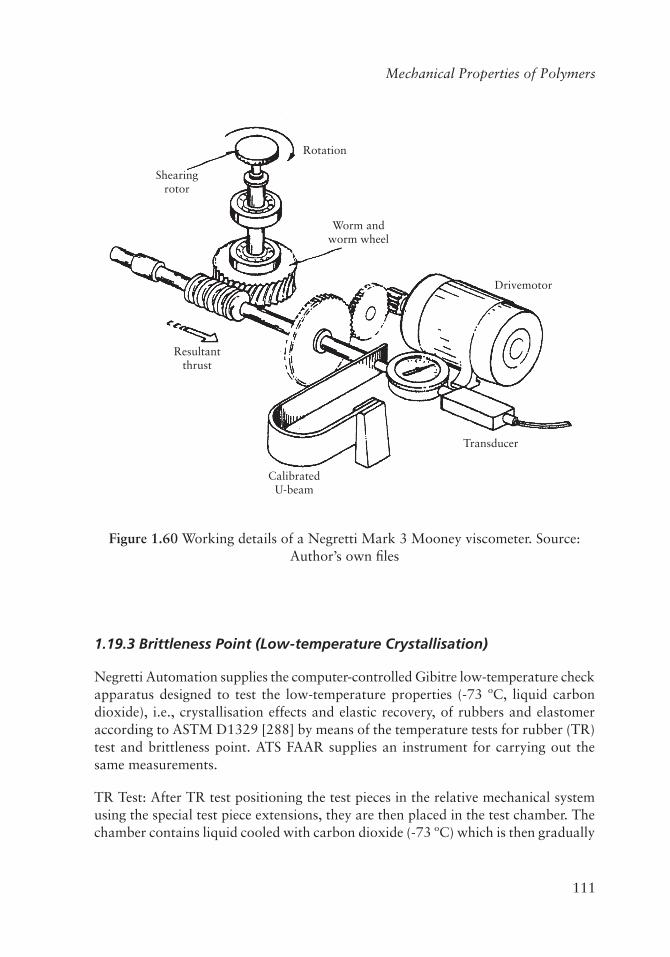
111
Mechanical Properties of Polymers
Shearingrotor
Rotation
Worm andworm wheel
Drivemotor
Transducer
CalibratedU-beam
Resultantthrust
Figure 1.60 Working details of a Negretti Mark 3 Mooney viscometer. Source: Author’s own files
1.19.3 Brittleness Point (Low-temperature Crystallisation)
Negretti Automation supplies the computer-controlled Gibitre low-temperature check apparatus designed to test the low-temperature properties (-73 ºC, liquid carbon dioxide), i.e., crystallisation effects and elastic recovery, of rubbers and elastomer according to ASTM D1329 [288] by means of the temperature tests for rubber (TR) test and brittleness point. ATS FAAR supplies an instrument for carrying out the same measurements.
TR Test: After TR test positioning the test pieces in the relative mechanical system using the special test piece extensions, they are then placed in the test chamber. The chamber contains liquid cooled with carbon dioxide (-73 ºC) which is then gradually

112
Physical Testing of Plastics
heated to 20 ºC (2 ºC/min). The test assesses the temperature difference between the two return values as a percentage.
After positioning the test pieces in a relative mechanical system, they are placed in the test chamber. This contains liquid cooled with carbon dioxide (-73 ºC) to the required temperature. A ‘ram’ comes into impact with the test pieces at a speed established by the standards and this appears on the display. The test is repeated several times using new test pieces to establish the brittleness temperature.
1.19.4 Flexing Test
The Ross flexing apparatus supplied by ATS FAAR measures, according to ASTM D1052 [289], the cut growth of rubber or elastomer specimens when subjected to repeated bend flexing. The machine allows the pierced flexed area of the specimen to bend freely over a 10 mm-diameter rod at 90º with a frequency of 100 ± 5 or 50 ± 5 cycles/min. The test is considered to have ended if the length of the cut (made with a special nicking tool) has increased by 500%.
The test is widely used by all industries manufacturing rubber or elastomer goods subjected (when in use) to repeated bending, such as shoes, tyres and conveyor belts.
Negretti Automation supplies the Gibitre De Mattia type dynamo tester which meets the requirements of ASTM, BS and ISO standards. The equipment has been specially designed by Gibitre to meet different requirements and can be used for other tests besides the De Mattia type. Repeated flexing tests can be carried out on De Mattia-type pieces or other types.
1.19.5 Deformation
The Yerseley mechanical Oscillograph supplied by ATS FAAR measures, according to ASTM D945 [290], the mechanical properties of rubber vulcanisations in the small range of deformation that characterises many technical applications. These properties include resilience, dynamic modulus, static modulus, kinetic energy, creep and set under a given force.
1.19.6 Tensile Properties
Negretti Automation supplies universal testing machines with capacities up to 5 kN (500 kg) and 10 kN (1,000 kg) complete with computer systems and printers.

113
Mechanical Properties of Polymers
1.19.7 Mechanical Stability of Natural and Synthetic Lattices
ATS FAAR supplies equipment for carrying out this test to ASTM specifications.
1.19.8 Abrasion Test
Negretti Automation supplies equipment to carry out abrasion tests on rubbers to the DIN specification.
1.19.9 Peel Adhesion Test
Negretti Automation supplies equipment for carrying out 180º peel tests for adhesive tapes and similar products to BS specifications.
1.19.10 Ozone Resistance Test
The Ozone Check supplied by Negretti Automation determines the resistance to ozone of elsatomers used in the tyre industry.
1.20 Physical Testing of Polymer Powders
Methods for the testing of polymer powders have been reviewed by Chambers [291] and Klaren [292], and are listed in Table 1.18. With the exception of particle-size distribution and thermal analysis measurements (by DSC and differential thermal analysis), none of these tests requires commercially produced equipment (i.e., they are simple laboratory tests). Full ASTM test specifications for polymer powders are described in ASTM D3451 [293]. Brief comments on the various tests on powders included in Table 1.18 are given below.

114
Physical Testing of Plastics
Table 1.18 Test methods for polymer powdersMeasurement Standard test method(s)
Polymer powders
Particle-size distribution ASTM D1921 [295] BS ISO 13319 [296]
Storage stability ASTM D609 [297] DIN ISO 8130 [298]
ChemicalandphysicalStability
Ultraviolet and outdoor stability Reactivity
ASTM D822-01 [299] ASTM G155 [300] ASTM D3451 [293] DIN ISO 8130 [298]
Melt viscosity ASTM D3451 [293]
Volatiles (stoving) ASTM D3451 [293] DIN ISO 8130 [298]
True density DIN ISO 8130 [298] ASTM D792 [301]
Bulk density BS 2782 [13] BS 2701 [302] ASTM D1895 [303]
Powder flow ASTM D1895 [303]
Test for cure
Electrical properties Thermal analysis
By DSC and DTA
Tests on fused powder coatings
Defects
Glass Whiteness Film thickness Hardness
ASTM D523-89 [304] IN 53157 [305]
Adhesion
Flow deformation ASTM D2794-93 [306]
Bend test ASTM D522-93 [307]
Chemical resistance
Corrosion resistance ASTM B117-64 [308]
Glass transition Melting Cure
Source: Author’s own files
115
Mechanical Properties of Polymers
1.20.1 Ultraviolet and Outdoor Resistance
Although the physical properties of a powder coating may be studied to predict its probable behaviour in practice, there are occasions when UV and/or outdoor resistance are required. There are two main procedures: artificial weathering and natural weathering (Appendix 5).
1.20.2 Artificial Weathering
The Atlas Xenon Arc Weather-O-Meter is used to calculate artificial weathering according to ASTM G155-04 a [300] and ASTM D822-01 [299]. The coated panel is exposed to a cycle of 102 minutes of light, followed by 18 minutes of light together with a water spray.
1.20.3 Natural Weathering
Various sites have been used for the evaluation of coatings e.g., Miami (FL, USA) or Phoenix (AZ, USA). The site at Phoenix greatly differs from that at Miami with respect to atmospheric conditions. Because of the elevation (2000 feet above sea level) and the clear dry atmosphere (38% relative humidity as the annual average), the percentage of UV in the solar radiation is higher in Phoenix than in the humid climate at sea level in Miami. (Arizona has 4,000 sun hours per year compared with the UK, which has with 1,000 sun hours.) The yearly average climate data of Arizona and Florida are as follows:
• Arizona:Hoursofsunlight:3,993;cmofrain:16;relativehumidity:38%;averagetemperature: 21 ºC.
• Florida:Hoursofsunlight:2,271;cmofrain:148;relativehumidity:58%;averagetemperature: 24.5 ºC.
1.20.4 Reactivity
Thermosetting powders vary in their degree of reactivity, and some means of quantifying this property is required. The basic method described in DIN ISO 8130 [298] and ASTM D3451 [293] involves melting the powder on a heating block at 160-200 ºC and stirring the molten material until gelation occurs.
There is undoubtedly some objectivity in this test, and slight differences in test method could have a significant effect on the final result. Hence, elastomer repeatability is

116
Physical Testing of Plastics
reasonable, but there is considerable doubt as to how reproducible the method is from one laboratory to another. Thus, the gelation test should be treated only as a useful laboratory tool until sufficient evidence is available to justify inclusion in a national standard.
1.20.5 Melt Viscosity
The fluidity of a material during the stoving process determines, to a large degree, the smoothness of the final coating and the degree of edge coverage achieved. It may be argued that the final appearance is the sole criterion for excellence, but some means of quantitative measurement of melt viscosity is required for research work, and is useful for quality control. A method is described in ASTM D3451 [294] which employs a cone and plate viscometer. A simpler method is to use an inclined plane whereby a pellet of the compressed powder is allowed to flow down on heated glass plate set at a suitable angle. The total length of flow after a fixed time (usually 10 minutes) is related to the melt viscosity.
1.20.6 Loss on Stoving
Although stoving losses of coating powders are small when compared with conventional finishes, some emission occurs, particularly with PU powders. Basically, there are two methods of determination:
• Sprayingontoatestplateandmeasuringmasslossafterstoving.
• Placingpowderonatareddishanddetermininglossmassafterheatinginanoven.
The first approach is favoured by the French (NFT 30-502) [310], whereas DIN ISO 8130-10 [298] and ASTM D3451-01 [293], describe dish methods. The dish method has the advantage that it follows normal laboratory practice. The temperature of the test and its duration can conveniently be the recommended cure schedule.
1.20.7 True Density
For powders of specific gravity above unity a pyknometer with water plus a wetting agent may be used. DIN ISO 8130-7 [298], describes an air pyknometer which caters for any powder (Appendix 5).

117
Mechanical Properties of Polymers
1.20.8 Bulk Density
Bulk density refers to the mass per unit volume of the powder (including air trapped between the particles). Thus, this measurement enables the calculation to be made of appropriate capacities for containers and hoppers. It is essential to ensure that the sample is not compacted during the test, and this is normally achieved by pouring the powder through a funnel into a measuring container. Methods are described in BS 2782 [13] and ASTM D1895 [303]. A Rees-Hugill powder density flask is also described in BS 2701 [302], (Appendix 5).
1.20.9 Powder Flow
The flow characteristics of a powder bear a complex relationship with the size, distribution, shape and structure of particles. It is of particular significance in connection with the ability of a powder to pass easily along feed lines to give the necessary consistency of applications when using electrostatic spraying equipment. The flow may be measured by determining the time for a prescribed volume of powder to flow through a standard funnel, as described in ASTM D1895 [303] and DIN EN ISO 813-10 [309].
This method has poor reproducibility in the case of thermosetting powders. This has led to the development of an empirical technique by the Netherlands Organization for Applied Scientific Research (TNO), which is described in the French standard NFT 30-500 [311].
The method consists of placing the powder in a standard fluidised bed with a plugged orifice in the side of the chamber. The height of the powder during and after fluidisation is measured. The powder is then refluidised and the plug removed for 30 seconds, allowing powder to flow into a tared container. The powder is weighed and the flow factor calculated as the product of this mass and the height difference. This is then compared with flow factors previously obtained on a wide range of powders, the flow characteristics of which are known. This enables a prediction of flow behaviour to be obtained.
1.20.10 Test for Cure
Unlike coatings made from thermoplastic powders, which require only visual inspection to see if the coating is satisfactory, thermosetting powder coatings require additional examination to determine if the coating has achieved its full physical properties. Simple mechanical tests may be used (as is the practice with conventional

118
Physical Testing of Plastics
paint finishes) but, particularly for epoxy powder coatings, it is not normal to use chemical resistance as a criterion for suitability. A common method is to swab the coating continuously for 30 seconds with a cotton wool pad soaked in methyl isobutyl ketone. Any deterioration of the film (with the exception of a minor loss) may be taken as in indication that the coating is insufficiently cured.
1.20.11 Electrical Properties
Application of the electrostatic technique to powders has drawn attention to the need for powders to possess appropriate electrical characteristics if they are to hold an electrical charge and be successfully processed. This has led to development of special apparatus which in addition to measuring resistivity and powder charge also acts as a diagnostic kit for the electrostatic spraying equipment. This apparatus was developed by the Wolfson Unit at Southampton University (Southampton, UK) and is manufactured by Industrial Development (Bangor) at University College, North Wales (Bangor, Wales).
1.20.12 Thermal Analysis
The performance of powder coatings during fusion and subsequent cure may be followed in detail by thermal analytical procedures such as differential thermal analysis and DSC. These techniques offer an opportunity for the study of phase transitions and cure behaviour under closely controlled conditions. DSC is a requirement in the British Gas standard for epoxy powder-coated materials for the external coatings of steel pipes (where it is used as a guide to ascertain optimum cure conditions).
1.20.13 Particle-size Distribution
Procedures based on several principles are used for the measurement of the particle-size distribution of polymer powders [312].
1.20.13.1 Methods Based on Electrical Sensing Zone (Coulter Principle)
Figure 1.61 shows, schematically, a simple form of apparatus. Particles, suspended homogeneously at a low concentration in an electrolyte solution, are made to flow through a small aperture (or orifice) in the wall of an electrical insulator, which is commonly called an aperture (or orifice) tube – the aperture creates the sensing zone. In addition, a current path is established between two immersed electrodes across

119
Mechanical Properties of Polymers
this aperture, setting a certain base impedance to the electrical detection circuitry. A direct current is generally used. As each particle enters the aperture, it has effectively displaced a volume of electrolyte solution equal to its own immersed volume. The base impedance is therefore modulated by an amount proportional to the displaced volume of the particle. This results in an electrical pulse of short duration being created by each particle, the height of the pulse being essentially proportional to the volume of the particle. The pulse may be measured, for example, as the change in resistance, current, or voltage across the electrodes.
To vacuum
Stirred suspensionof particles inelectrolyte
Manometercontacts
Main amplifier
Threshold Circuit
Pulse amplifier
Counterdriver
Digitalregister
Oscilloscope
Horizontalsweep
Aperture
Mercurymanometer
– +
Counter stop/start
Electrodes
Tap
Figure 1.61 Simple form of particle size analyser (schematic). Source: Author’s own files
The passage of several particles produces a ‘train’ of pulses that can be observed on an oscilloscope and analysed by counter and pulse height analyser circuits to produce a number against particle volume (or equivalent spherical diameter) distribution. A volume or mass (‘weight’) against size distribution can also be measured, calculated,

120
Physical Testing of Plastics
or computed. The ‘weight’ percentages are possible if all of the particles have uniform density or have a known density distribution across their size range.
Simple models have only one counter and size level circuit (and so are called ‘single-channel models’); more complex instruments can obtain number and/or mass (weight) distributions automatically in up to 256 size channels within a few seconds. Counting and sizing rates of up to some 10,000 particles per second are possible, with each pulse height being measured to within 1% or 2%.
Most particulate materials are irregularly shaped, so the volumetric response is invaluable because volume is the only single measurement that can be made of an irregular particle to characterise its size. In biological applications, the size response is usually left calibrated in volume units (femtolitres, or ‘cubic microns’), but industrially it is conventional to report the equivalent spherical diameter calculated from it. This volumetric method makes no assumptions about particle shape and indeed is not greatly affected by particle shape except in extreme cases such as flaky materials such as certain clays. To count the number of particles in a known volume of suspension, such as for particular contamination studies or for a blood cell count, the sample volume is accurately metered by means of a calibrated ‘monometer’. Figure 1.61 illustrates the original simple mercury siphon and metering system.
The shape of the aperture tube can vary according to application. For example, a very narrow design, which can be inserted into glass ampoules as small as 1 ml capacity, allows the particle contamination of injectable solutions to be measured.
Instrument designs have a range of extra features, including embedded microprocessors and various data reduction handling and presentation methods, and manufacturers should be contacted for details. The volumetric sizing resolution, speed of data collection, statistical accuracy of counting, freedom from any optical response effects and the reliability and simplicity of calibration make these devised unsurpassed for providing particle counting and size-distribution analysis.
Coulter-type instrumentation available from Coulter Electronics Limited is listed in Table 1.19 (multisiser and Model 2M) and Appendix 1.
1.20.13.2 Laser Particle Size Analysers
Light diffraction is one of the most widely used techniques for measuring the size of particles in the range 0.1-1,000 µm. This popularity is partly due to the way precise measurements can be made quickly and easily. It also stems from the flexibility of

121
Mechanical Properties of Polymers
the technique, particularly the way it can be adapted to measure samples presented in various forms.
The method depends on analysing the diffraction patterns produced when particles of different sizes are exposed to a collimated beam of light. The patterns are characteristic of the particle size, so mathematical analysis can produce an accurate, reproducible picture of size distribution.
Coulter Electronics Limited supplies a range of laser particle size distribution apparatus (LS100 and LS130) (Table 1.19).
Christianson Scientific Equipment supplies the Fritsch Analysette 22 Laser Particle Sizer, which operates over the particle size range 0.16–1250 µm. This is a universally applicable instrument for determining particle-size distributions of all kinds of solids which can be analysed in suspension in a measuring cell or dry feeding through a solid particle feeder. In the Fritsch Analysette 22 system, laser diffraction apparatus measuring the particle-size distribution is displayed on the monitor in various forms, either as a frequency distribution or as a summary curve in tabular form. These can be subsequently recorded on a plotter, stored on hard disc, or transferred to a central computer via an interface. The time required for one measurement is ~2 minutes.
Table 1.20 lists some suppliers and working ranges of various particle-size distribution methods.
Terray [313] examined laser diffraction as a method for the inline measurement of particle size. Examples of the application of Insitec laser granulometers developed by Malvern Instruments are described. These include their use for particle-size measurement in the cryogenic grinding of plastics.
1.20.13.3 Photon Correlation Spectroscopy (Autocorrelation Spectroscopy)
The Coulter N4 and its predecessor, the Nano-Sizer, use autocorrelation spectroscopy of scattered light to determine the time-dependent fluctuations of the scattered light which result from the Brownian motion of particles in suspension. The technique is also known as photon correlation spectroscopy.

122
Physical Testing of Plastics
Table 1.19 Particle-size measurement instrumentation available from Coulter Electronics Limited
Instrument Type Particle-size range Analysis time (s)
Measurement
Coulter Multisiser Coulter 0.4-1200 µm (overall) 0.4-336 µm for distributions to be expressed as volume (weight) against size
30-90 Counting and sizing
Model ZM (more basic than the Multisiser)
Coulter 0.4-1200 µm - Counting and sizing
Coulter LS series particle size distribution analyser
Laser light diffraction
0.1-810 µm 60 Particle sizing
LS130 LS100
-
Coulter series model N4 Photon correlation spectroscopy (auto correlation spectroscopy)
0.003-3 µm -
Model N45 measures coefficients of particles by laser light scattering and converts them to size or molecular weight
- Sub-micro particle distribution and molecular weight
Model N4MD automated laser based submicron particle size analyser
0.003-3 µm -
Model N45D sub-micron particle size analyser with size distribution analysis capability
-
Source: Author’s own files
1.20.13.4 Sedimentation
The use of sedimentation, whereby the particle size is determined by the application of Stokes’ law, is well established. The time taken for fine particles to complete the sedimentation process is far too long for practical utility. However, the development

123
Mechanical Properties of Polymers
of the wide-scanning sedimentometer (whereby a suspension of particles that are separated under gravity is scanned by a light beam which is attenuated accordingly) has largely overcome this difficulty. A result may be obtained in 30 minutes by a competent operator using hand calculation methods.
Table 1.20 Suppliers and working ranges of particle-size distribution methods
Method Particle size range
Equipment supplier Model
Dry sieving 6-63 µm Fritsch Analysette 3 (20-25 mm)
Wet sieving 20-200 µm Fritsch Analysette 18
Microsieving 5-100 µm Fritsch
Sedimentation in gravitational field
0.5-500 µm Fritsch Analysette 20
Laser diffraction 0.1-1100 µm Fritsch Analysette 22
Electrical zone sensing
0.4-1200 µm Coulter Model ZM Coulter Multisizer
Electron microscopy 0.5-100 µm - -
Photocorrelation spectroscopy
0.5-5 µm - -
Sedimentation in centrifugal field
0.5-10 µm Fritsch Analysette 21 (Anderson Pipette centrifuge)
Diffraction spectroscopy
1 µm-1 mm - -
Optical microscopy 0.5 µm-1 mm
- -
Projection microscopy
0.05 µm-1 mm
- -
Image analysis systems
0.8-150 µm down to 0.5 µm
Joyce Leobl Instruments, Leitz, Karl Zeiss, Cambridge Instruments
Magiscan and Magiscan P, Autoscope P, Videoplan II, Quantimet 520
Source: Author’s own files

124
Physical Testing of Plastics
1.20.13.5 Acoustic Spectroscopy
Particle-size measurement results obtained from the deconvolution of acoustic attenuation over a broad frequency range is showing increasing potential in the characterisation of emulsions and slurries at process concentrations over particle sizes ranging from 0.01 µm to 1,000 µm [314]. The results of this study reveal that the particle-size distribution in high and low-density contrast materials can be accurately measured by acoustic spectroscopy. The technique is distinct from other size-characterisation technologies in three ways: there are no optics involved because the instrument can measure through opaque high-concentration suspensions; it has an extremely wide dynamic range; and it is well suited for online applications because it is a relatively robust instrument and dilution is not required. Trottier and co-workers [317] discussed the applications of acoustic spectroscopy to particle-size measurement for LDPE and HDPE.
1.20.13.6 Capillary Hydrodynamic Fractionation
Venkatesan and Silebi [315] used capillary hydrodynamic fractionation to monitor an emulsion polymerisation of styrene monomer as a model system. A sample taken from the reactor at different time intervals is injected into the capillary hydrodynamic fractionation system to follow the evolution of the particle-size distribution of the polymer particles formed in the emulsion polymerisation. After the colloidal particles have been fractionated by capillary hydrodynamic fractionation, they pass through a photo-diode array detector which measures the turbidity at several wavelengths instantaneously, thereby enabling utilisation of turbidimetric methods to determine particle-size distribution. The particle size instrument is not hindered by the presence of monomer-swollen particles. The shrinkage effect due to monomer swelling is found to be accurately reflected in particle-size measurements.
1.20.13.7 Small-angle Light Scattering
Boerschig and co-workers [316] mentioned that light scattering should prove useful for the direct measurement of particle growth during flow-driven coalescence of PS/polymethyl methacrylate blends.
1.21 Plastic Pipe Materials
Testing of polymer pipe materials is done to international standards. Impact resistance (falling dart) is done to ASTM D2944 [367] and UNI EN ISO 748 [337]. Hydrostatic
125
Mechanical Properties of Polymers
pressure tests have been conducted on polyolefin pipe exposed to chlorinated water [318-319] and failure mechanisms discussed.
The effect of welding [320] and long-term exposure to soil [321] of PE pipes has been investigated.
Physical performance testing has also been carried out on rigid PVC [334] and isotatic polybutene [335] as well as polyacrylate [337] pipes.
Sims [326] reviewed the international standardisation of test methods according to BS4994 and BS 6464 for general-purpose pipes and pressure vessels.
1.22 Plastic Film
Additional tests for polymer films that have been mentioned in the literature are the tear strength at ethylene-vinylacelate plasticiser [344], the coefficient of friction of polyolefin plasticiser blown film [342] and oxygen absorption of food packaging film [343].
Michaelie and co-workers [332] studied the gas barrier properties of PET films coated with microwave-enhanced plasma, polymerised barrier layer polyacetylene or polyhdifluoroethylene.
References
1. ASTM D638-03, StandardTestMethodforTestingTensilePropertiesofPlastics, 2003.
2. DIN EN ISO 527-1, Plastics-Determination of Tensile Properties, Part 1: GeneralPrinciples, 1996.
3. DIN ISO 527-2, Plastics-Determination of Tensile Properties, Part 2: Test ConditionsforMouldingandExtrusionPlastics, 1996.
4. ASTM D695-02a, StandardTestMethodforCompressivePropertiesofRigidPlastics, 2002.
5. DIN EN ISO 179-1, DeterminationofCharpyImpactProperties,Part1:Non-InstrumentalImpactTest, 2001.

126
Physical Testing of Plastics
6. ASTM D790-03, StandardTestMethodsforFlexuralPropertiesofUnreinforcedandReinforcedPlasticsandElectricalInsulatingMaterials, 2003.
7. ASTM D732, StandardTestMethodforShearStrengthofPlasticsbyPunchTool, 2002.
8. DIN EN ISO 178, Plastics-DeterminationofFlexuralProperties, 2003.
9. DIN EN ISO 8256, DeterminationofImpactStrength, 2005
10. DIN EN ISO 604, Plastics-Determination of Compressive Properties, 2003
11. Y. Son, Y.S. Chun and R.A. Weiss, PolymerEngineeringandScience, 2004, 44, 541.
12. M. Tasdemir and H. Yildirim, JournalofAppliedPolymerScience, 2003, 83, 2967.
13. BS 2782-0, MethodofTestingPlasticsPart0:Introduction, 1995.
14. ASTM D1043, StandardTestMethodforStiffnessPropertiesofPlasticsasaFunctionofTemperaturebyMeansofaTorsionTest, 2002.
15. DIN 53477, TestingofPlastics:DeterminationofParticleSizeDistributionofMouldingMaterialsbyDrySievingAnalysis, 1992.
16. ISO 458, Plastics–DeterminationofStiffnessonTorsionofFelxibleMaterials–Part1:GeneralMethod, 1985.
17. ASTM D1869-99, StandardPracticeforTransferMoldingTestSpecimensofThermosettingCompounds, 2004.
18. ASTM D3419, StandardPracticeforIn-LineScrew-InjectionMoldingTestSpecimensfromThermosettingCompounds, 2000.
19. ASTM D3641, StandardPracticeforInjectionMoldingTestSpecimensofThermoplasticMoldingandExtrusionMaterials, 2002.
20. ASTM D4703, StandardPracticeforCompressionMoldingThermoplasticMaterialsintoTestSpecimens,Plaques,orSheets, 2003.
21. ASTM D5227-01, StandardTestMethodforMeasurementofHexaneExtractableContentofPolyolefins, 2001.

127
Mechanical Properties of Polymers
22. ISO 498, NaturalRubberLatexConcentrate–PreparationofDryFilms, 1992.
23. DIN ISO 604, Plastics Determination of Compressive Properties, 2003.
24. J. Janick and W. Krolikowski, Polymery, 2002, 47, 250.
25. S. H. Lin, C.C.M. Ma, N.H. Tai and I.H. Perng, ProceedingofMaterialsChallenge,DiversificationandtheFutureSymposium, Anaheim, CA, USA, 1995, 40, 2, 1046.
26. H. Wong, P.G. Thompson, J.R. Schoonover, S.R. Ambuchon and R.A. Palmer, Polymer Macromolecules, 2001, 34, 7084.
27. J.J. Lyons, Polymer Testing, 1998, 17, 237.
28. G. Hay, P.E. Mackey, P.N. Awati and Y. Park, JournalofRheology, 1999, 43, 1099.
29. C. Nakafuku and K. Nishimura, JournalofAppliedPolymerScience, 2003, 87, 1962.
30. H-C. Wong, C.M. Sung and J. Hamilton, JournalofMaterialScienceLetters, 1998, 7, 41.
31. T.C. Barany, E. Foldes, T. Czigany and J. Korgar-Kosis, JournalofAppliedPolymerScience, 2004, 91, 3462.
32. J.F. Mana and J.C.A. Viana, Polymer Testing, 2001, 20, 937.
33. F. Briatico-Vangosa, M.D. Rink, F. D’Oria and A. Verzelli, Polymer EngineeringandScience, 2000, 40, 1553.
34. A. Marcellon, A.R. Bunsell, R. Piques and P. Colomban, Journal of Materials Science, 2003, 38, 2117.
35. S. Kao-Walter, J. Pahlstrom, T. Karlsson and A. Magnuson, Mechanics of Composite Material, 2004, 40, 29.
36. ASTM D256-56, StandardTestMethodsforDeterminationofIzodPendulumImpactResistanceofPlastics, 2005.
37. ISO 179-1 Plastics, DeterminationofCharpyImpactProperties,Part1:Non-InstrumentalImpactTest, 2001.

128
Physical Testing of Plastics
38. ISO 180, Plastics: DeterminationofIzodImpactStrength, 2000.
39. UNI EN ISO 180, Plastics: DeterminationofIzodImpactStrength, 2001.
40. ASTM D5420, StandardTestMethodforImpactResistanceforFlatRigidPlasticSpecimenbyMeansofStrikerImpactedbyaFallingWeight(GardnerImpact), 2004.
41. ASTM D5628, 96 e-I, StandardMethodforImpactResistanceofFlatRigid PlasticSpecimenbyMeansofaFallingDart(TuporFallingMass), 2001.
42. DIN EN ISO 6603, Plastics: DeterminationofPunctureImpactBehaviourofRigidPlastics, 2000.
43. M. Lavach, PlasticsEngineering, 1999, 55, 41.
44. L.T. Pick and E. Harkin-Jones, PolymerEngineeringandScience, 2003, 43, 905.
45. Y. Kayano, H. Keskkula and D.R. Paul, Polymer, 1997, 38, 1885.
46. ASTM D395-03, StandardTestMethodforStiffnessPropertiesofPlasticasaFunctionofTemperaturebyMeansofTorsionTest, 2003.
47. ISO 815, RubberVulcanisedorThermoplastic-DeterminationofCompression SetatAmbient,ElevatedorLowTemperature, 1993.
48. UNI ISO 815, Rubber,VulcanisedorThermoplastic-DeterminationofCompressionSetatAmbient,ElevatedorLowTemperatures, 2001.
49. UNI 6121, Elastomeri:ProdottiFiniti,ProdottidiGommaSpugnosaaaLattice,DefinizioniEProve, 1967.
50. DIN 53464, TestingofPlastic.DeterminationofShrinkagePropertiesofMouldedMaterialsfromThermosettingMouldingMaterials, 1962.
51. E.C. Lee, M.J. Solomon and S.J. Muller, Macromolecules, 1997, 30, 7313.
52. C. Riekel, M. Burghammer, M.C. Garcia, A. Gourier and S. Roth, Polymer Preprints, 2002, 43, 215.
53. ASTM D395-03, StandardTestMethodforStiffnessPropertiesofPlasticsasaFunctionofTemperaturebyMeansofTorsionTest, 2003.
54. G. Beracchi, A. Pipino and G. Boero, Macplas, 2001, 26, 78.

129
Mechanical Properties of Polymers
55. T. Miyata and T. Yamaoka, KobunshiRonbunshu, 2002, 59, 415.
56. G. Evrard, A. Belgrine, F. Carpier, E. Valot and P. Dang, RevueGeneraledesCaoutchoucesetPlastiques, 1999, 777, 95.
57. ASTM D430-95, StandardTestMethodsforRubberDeterioration-DynamicFatigue, 2000.
58. ASTM D813-95, StandardTestMethodforStiffnessPropertiesofPlasticsasaFunctionofTemperaturebyMeansofTorsionTest, 2000.
59. S.H. Lin, C.C.M. Ma, N.H. Tai and L.H. Pering in the Proceedings of the SAMPE Conference - MaterialsChallenge-DiversificationandtheFuture,Anaheim, CA, USA, 1995, Volume 40, Book 2, p.1046.
60. A.M. Harris and F.C. Lee, JournalofAppliedPolymerScience, 2008, 107, 2246.
61. A. Menzur, JournalofAppliedPolymerScience, 2008, 108, 1574.
62. J. Jia, D. Raabe and W-M. Miao, ChineseJournalofPolymerScience, 2006, 24, 403.
63. T. Barany, E. Folden, T. Czigany and J. Karger-Kocsis, JournalofAppliedPolymerScience, 2004, 91, 3462.
64. A. Flores, V.B.F. Mathot, G.H. Michler, R. Adhikari and F.J. Balta Calleja, Polymer, 2006, 47, 5602.
65. S. Houshyai and R.A. Shanks, JournalofAppliedPolymerScience, 2007, 105, 390.
66. T. Kuila, H. Archarya, S.K. Shrivastava and A.K. Bhowmick, Journal of AppliedPolymerScience, 2008, 108, 1329.
67. B.G. Girija and R.R.N. Sailaja,JournalofAppliedPolymerScience, 2006, 101, 1109.
68. F-L. Jin and S-J. Park, JournalofPolymerScience,PartB:PolymerPhysicsEdition, 2006, 44, 3348.
69. F. Parres, R. Balart, J. Lopez and D. Garcia, JournalofMaterialsScience, 2008, 43, 3203.

130
Physical Testing of Plastics
70. R. Bouza, A. Lasagabasta, M.J. Abad and L. Bareal, JournalofAppliedPolymerScience, 2008, 109, 1197.
71. F. Rouabah, M. Fuis, A. Bourdenne, C. Picard, D. Dadach and H. Hodduoni, JournalofAppliedPolymerScience, 2008, 109, 1505.
72. S. Houshyar and R.A. Shonks, MacromolecularMaterialandEngineering, 2006, 291, 59.
73. F. Rouabah, M. Fois, L. Ibos, A. Bourdenne, D. Dadache, N. Haddaounis and P Ausset, JournalofAppliedPolymerScience, 2007, 106, 2710.
74. M.G. Ahangani and A. Fereidoon, Polymers, 2008, 153, 1.
75. A Eceiza, M. Martin, K. De la Caba, G. Kortaberria, N. Gabilondo, M. Curcnera and I. Mondragon, PolymerEngineeringandScience, 2008, 48, 297.
76. K.L. Pagnon, H.H. Chen, M.H. Innocentini-Mei and N.A. D’Souza, Proceedingsofthe66thSPEAnnualTechnicalConference, Milwauki WI, USA, SPE, 2008, p.610.
77. R. Chakrabarti M. Das and D. Chakrabarti, JournalofAppliedPolymerScience, 2004, 93, 272.
78. S. Pop and K. Chaochanchaikul, PolymerInternational, 2004, 53, 1210.
79. C.V. Mythili, A.M. Retna and S. Gapalakrishanan, JournalofAppliedScience, 2005, 98, 284.
80. M. Funabashi, S. Hirose and H. Hatcheyame, ProceedingsofFourthAsian-AustralianConferenceonCompositeMaterials(AAGM–4), Sydney Australia, Cambridge, Woodhead Publishing, Cambridge, UK, 2004, p.57.
81. A. Li, J. Chang, K. Wang, L. Lu, X. Yang and Y. Wang, Polymer International, 2006, 55, 565.
82. A.J. Zattari, O. Bionchi, R.V.B. Oliveiri, L.B. Canto, C.A. Ferreiro and M. Zeni, ProcessinRubber,PlasticsandRecyclingTechnology, 2006, 22, 69.
83. R.R.N. Sailaja, PolymerInternational, 2005, 54, 1589.
84. F.R. Kogler, T. Kich, H. Peterlick, S. Seidler and U. Schubert, Journal of PolymerScience,PartB:PolymerPhysicsEdition, 2007, 45, 2215.

131
Mechanical Properties of Polymers
85. A.P. Gupta, U.K. Saroop and M. Verma, PolymerPlasticsTechnologyandEngineering, 2004, 43, 937.
86. D. Sheivastava, JournalofAppliedPolymerScience, 2005, 96, 1691.
87. Ming-Zhang, C-Z. Wang, D-Z. Wu, Y-H. Yu and X-P. Yang, Polymer MaterialsScienceandEngineering, 2005, 21, 196.
88. S. Houshyar, R.A. Shanks and A. Hodzik, JournalofAppliedPolymerScience, 2005, 96, 2260.
89. E. Shrivakumar, K.N. Pandeu and S. Alam and C.K. Das, Polymer International, 2005, 54, 1458.
90. Nohalen, L. Solar, I. Porcar, C.I. Vollo and G.M. Gomez, EuropeanPolymerJournal, 2006, 42, 3093.
91. F. Rouhbah, K. Ayadi and N. Hoddaoui, InternationalJournalofPolymericMaterials, 2006, 55, 975.
92. M. Szostah, MolecularCrystalsandLiquidCrystals, 2004, 416, 209.
93. I. Nigam, D. Nigam and G.N. Mathur, PolymerPlasticsTechnologyandEngineering, 2005, 44, 815.
94. Y.H. Nien and J. Chen, JournalofAppliedPolymerScience, 2006, 100, 3727.
95. L. Priya and J.P. Jog, JournalofPolymerScience,PartB:PolymerPhysicsEdition, 2003, 41, 31.
96. Q. Yuan, W. Jiang, L. An and L.K.Y. Li, PolymersforAdvanced Technologies, 2004, 15, 409.
97. A.P. Gupta, U.K. Saroop, G.S. Jha and M. Verma, Polymer Plastics, TechnologyandEngineering, 2003, 42, 297.
98. B. Zhou, X. Ji, Y. Sheng, L. Wang and Z. Jiang, BurofearsPolymerJournal, 2004, 40, 2357.
99. C.Y. Tang, L.C. Chan, J.Z. Liang, K.W.E. Cheng and T. Wong, Journal of ReinforcedPlasticsandComposites, 2002, 21, 1337.
100. P.J.M. Von den Heuvrel, S. Goutianos, R.J. Young and T. Peijs, Composite ScienceandTechnology, 2004, 64, 645.

132
Physical Testing of Plastics
101. S. Mohonty, S.K. Nayak, S.K. Verma and S.S. Tripathyl, Journal of ReinforcedPlastics,andComposites, 2004, 23, 625.
102. L. Priya and J.P. Jog, JournalofPolymerScience,PartB:PolymerPhysicsEdition, 2003, 41, 31.
103. A.P. Gupta, U.K. Saroop, G.S. Tha and M. Verma, Polymer Plastics, TechnologyandEngineering, 2003, 42, 297.
104. Q. Yan, W. Jiang, L. An and R.K.Y. Li, PolymersforAdvancedTechnologies, 2004, 15, 409.
105. H. Xiaoming Xu, Y. Song, Q. Zheng and G. Ha, JournalofAppliedPolymerScience, 2007, 103, 2027.
106. W. Leong, Z.A.M. Ishak and A. Ariffin, JournalofAppliedScience, 2004, 915, 3327.
107. O. Okzuk and H. Yildirim, JournalofAppliedPolymerScience, 2005, 96, 1126.
108. J. Zhaoliang, JournalofAppliedPolymerScience, 2007, 104, 1692.
109. F.H. Gojny, M.M.G. Wichman, B. Fiedler, W. Bauhofer and K. Schulte, Composites:PartA,AppliedScienceandManufacturing, 2005, 11, 1525.
110. Y. Nischitani, I. Sekiguchi, B. Hausnerova, N. Zolpazilova and T. Kitono, PolymersandPolymerComposites, 2007, 15, 111.
111. E. Klata, S. Barysiak, K. Van De Velde, J. Garbarczyk and I. Krucinska, FibresandTextilesinEasternEurope, 2004, 12, 64.
112. A. Pegoretti and A. Pencalti, PolymerDegradationandStability, 2004, 86, 233.
113. L. Huang, Q. Yuan, W. Jiang, L. An and S.Y. Jiang, JournalofAppliedPolymersScience, 2004, 94, 1885.
114. S. Mishra and N.G. Shimpi, JournalofPolymerScience, 2007, 104, 2018.
115. F. Bianchi, A. Lazzeri, M. Pracella, A. Aguinu and G. Ligeri, Macromolecular Symposium, 2004, 218, 191.
116. K. Wang, J. Wu and H. Zeng, PolymersandPolymerComposites, 2006, 14, 473.

133
Mechanical Properties of Polymers
117. D. Yun-Sheng, G. Hong-Wei and W. Seng-Shan, PolymerMaterialsScienceandEngineering, 2005, 21, 90.
118. E.S.A. Rachid, K. Ariffin, H. Akit and C.C. Kooi,JournalofReinforced PlasticsandComposites, 2008, 27, 1573.
119. Z-H. Chen and K-C. Gung, PolymerMaterialScienceandEngineering, 2007, 23, 203.
120. B. Mary, C. Dubois, P.J. Garreau and D. Brousgeay, RheologicaActa, 2006, 45, 561.
121. J. Burghardt, N. Hansen, L. Hansen and G. Hansen in ProceedingsoftheSAMPE’06Conference, Long Beach, CA, USA, 2006, Paper No.131.
122. A.S. Luyt, S.A. Molefi and H. Krump, PolymerDegradationandStability, 2006, 91, 1629.
123. J. Liu, B. Cankurtaran, L. Weizorek, M.J. Ford and M. Cortie, AdvancedFunctionsMaterials, 2006, 16, 1457.
124. N. Abdelaziz, JournalofApplied,PolymerScience, 2004, 94, 2178.
125. D. Puryanti, S.H. Amed, H.M. Abdullah and A.N.H. Yushaft, InternationalJournal of Polymeric Materials, 2007, 56, 327.
126. N. Sombatsompop, A. Kositchaiyong and W. Wimolala, JournalofAppliedPolymerScience, 2006, 102, 1896.
127. B.L. Shah, S.E. Selke, M.B. Walters and P.A. Heiden, Polymer Composites, 2008, 29, 655.
128. C.Y. Lai, S.M. Sapuan, M. Ahmid, N. Yahya and K.Z.H.M. Dahlan, Polymer PlasticsTechnologyandEngineering, 2005, 44, 619.
129. E.M. Wouterson, F.C.Y. Boey, X. Hu and S-C. Wang, Polymer, 2007, 48, 3183.
130. E. Lezak, Z. Kulinski, R. Masirek, E. Piorkowgka and M. Pracella and K. Gadzinowika, MacromolecularBioscience, 2008, 8, 1190.
131. S.M. Luz, A.R. Goncalves, A.P. Del-Arco and D.M.C. Ferrao, Composite Interfaces, 2008, 15, 841.

134
Physical Testing of Plastics
132. S. Joseph and S. J. Lumas, JournalofAppliedPolymerScience, 2008, 109, 256.
133. H. Hu, J. Lin, Q. Zheng and X. Xu, JournalofAppliedPolymerScience, 2006, 99, 3477.
134. S. Radhakrichnan, B.T.S. Ramanujam, A. Adhikara and S. Sivaram, Journal of PowerSources, 2007, 163, 702.
135. K.I. Jung, S.W. Yoon, S.J. Sung and J.K. Park, JournalofAppliedPolymerScience, 2004, 94, 678.
136. H. Mirzazadeh, A.A. Katbab and S. Bazgir in the Proceedingsofthe 8th IUPACInternationalSymposiumonPolymersforAdvancesTechnologies, Budapest, Hungary, 2005, Paper No.41.
137. O. Kusmon, Z.A. Mohd Ishek, W.S. Chow and T. Tekeichi, EuropeanPolymer Journal, 2008, 44, 1023.
138. E. Nazockdast, H. Nazockdost and F. Goharpey, PolymerScienceandEngineering, 2007, 26, 789.
139. H. Ardhyananta, H. Ismail and T. Takeichi, JournalofReinforcedPlasticsandComposites, 2002, 21, 822.
140. S. Hwan-Lee and J. Ryoun Youn, Polymer, 2007, 34, 1.
141. F. Kaya, M. Tanoglu and S. Okur, JournalofAppliedPolymerScience, 2008, 109, 834.
142. C.Y. Lew, W.R. Murphy and G.M. McNally in the Proceedingsofthe Antec62ndSPEAnnualConference, Chicago, IL, SPE, USA, 2004, p.304.
143. G. Sanchez-Olivares, A. Sanchez-Solis and O. Manerv, InternationalJournalof Polymeric Materials, 2008, 57, 417.
144. M.A. Kadei, M.Y. Lyn and C. Nah, CompositesScienceTechnology, 2006, 66, 1431.
145. K. Zheng, L. Chen, Y. Li and P. Cui, PolymerEngineeringandScience, 2004, 44, 1077.
146. Y-H. Hu, C-Y. Chen and C-C. Wong, Macromolecules, 2004, 37, 2411.

135
Mechanical Properties of Polymers
147. S.U. Ryadiansyah, H. Ismail and B. Azhari, Polymer Composites, 2008, 29, 1169.
148. V. Paseual, V. Sanchez and J.M. Martin-Martinez, MacromolecularSymposia, 2006, 233, 137.
149. C. Bartholom, E. Beyou, E. Bourgeat-Hamy, P. Cassagnau, P. Chanmonr, L. David and N. Zydowicz, Polymer, 2005, 46, 9965.
150. O. Ruzimuradov, G. Rajan and J. Mark, MacromolecularSymposia, 2006, 245-256, 322.
151. J.C.S. Norton, M.G. Han, P. Jiang, G.H. Shim, Y. Ying, S. Greager and S.H. Foulger, Chemistry of Materials, 2006, 18, 4570.
152. T.P. Ngnyen, S.H. Yang, J. Gomes and M.S. Wong, SyntheticMetals, 2005, 15, 269.
153. D.S. Chaudhary, M.C. Jalland and F. Cser, PolymersandPolymerComposites, 2004, 12, 383.
154. D.W. Chae and B.C. Kim, JournalofMaterialsScience, 2007, 42, 1238.
155. J.L. Abot, A. Yasmin, A.J. Jacobson and I.M. Daniel, CompositeScienceandTechnology, 2004, 64, 263.
156. B. Hausner Nova, N. Zdrajilova, T. Kitano and P. Saha, Polymeri, 2006, 5, 33.
157. C-H. Chen and K-C. Lein, PolymersandPolymerComposites, 2006, 14, 155.
158. S. Vidhate, E. Ogunsona, J. Chung and N.A. D’Souza in theProceedingsofthe66thSPEAnnualTechnicalConference,Milwaukee, WI, USA, 2008, p.74.
159. M.R. Loos, S.H. Pezzin, S.C. Amico, C.P. Bergmann and L.A.F. Coelho, JournalofMaterialsScience, 2008, 18, 6064.
160. M.R. Loos, L.A.F. Coelho, S.H. Pezzin and S.C. Amico, Journal of Materials Research,2008, 11, 347.
161. H-C. Kuan, C-C.M. Ma, W-P. Chong, S-M. Yuen, H-H. Win and T-M. Lee, CompositesScienceandTechnology, 2005, 65, 1703.

136
Physical Testing of Plastics
162. K.Q. Xiao, L.C. Zhang and I. Zarudi, CompositesScienceandTechnology, 2007, 67, 177.
163. Y.S. Song, PolymerEngineeringandScience, 2006, 46, 1350.
164. D. Wu, L. Wu, Y. Sun and M. Zhang, JournalofPolymerScience,PartB:PolymerPhysicsEdition, 2007, 45, 3137.
165. B. Wang, G. Sun and J. Liu, PolymerEngineeringandScience, 2007, 47, 1610.
166. S. Tzavalas, D.E. Mouzakis, V. Drakonakis and V.E. Gregoriou, Journal of PolymerScience,PartB:PolymerPhysicsEdition, 2008, 46, 668.
167. M. Lai, J. Li, J. Yang, J. Liu, X. Tong and H. Cheng,PolymerInternational, 2006, 53, 1479.
168. Y.T. Sung, M.S. Han, K.H. Song, J.W. Jung, H.S. Lee, C.K. Kum, J. Loo and W.N. Kim, Polymer, 2006, 47, 4434.
169. T. Aoki, Y. Ono and T. Ogasawara in the ProceedingsoftheAmericanSocietyforComposites21st Technical Conference, Dearborn, MI, USA, 2006, Paper No.31.
170. S-M. Yuen, C-C. M Ma, C-Y. Chuang, Y-H. Hsiao, C.L. Chiang and A-D. Yu, CompositesPartA, 2008, 39, 119.
171. D.S. Bangarusam Path, V. Alstradt, H. Ruckdeseschel, J.K.W. Sandler and M.S.P. Shaffer, Journal of Plastics Technology, 2008, 6, 19.
172. V.E. Yudin, V.M. Svetlidnya, A.N. Shumkaov, D.G. Letenko, A.Y. Feldman and G. Marom, MicromolecularRapidCommunications, 2005, 26, 885.
173. S. Peeterbroveck, M. Alexandre, J.B. Nagy, N. Moreau, A. Destrec, F. Monteverde, A. Pulmont, R.J. Jerome and P. Dubois, Macromolecular Symposia, 2005, 22, 115.
174. S-M. Ynen, C-C. M Ma, C-C. Teng, H-H. Wu, H-C. Kuan and C-L. Chiang, JournalofPolymerScience,PartB:PolymerPhysicsEdition, 2008, 46, 472.
175. G.D. Sims, InternationalStandardisationofCouponandStructuralElementTestMethods,ECCM-Composite,TestingandStandardisation2, Hamburg, Germany, 1994.

137
Mechanical Properties of Polymers
176. ISO 3268, Plastics–GRP–DeterminationofTensileProperties, 1978.
177. ISO/DIS 527 – Part 5, Plastics – Determination of Tensile Properties – Test ConditionsforUnidirectionalFibre-ReinforcedPlasticComposites, 1994.
178. EN 61:1977, GlassReinforcedPlastics–DeterminationofTensileProperties, 1977.
179. prEN 2561, Carbon-ThermosettingResinUnidirectionalLaminates– Tensile TestParalleltotheFibreDirection, 1989.
180. prEN 2747, GlassReinforcedPlastic–TensileTestParalleltotheFibre Direction, 1990.
181. M. Hojo, Y Sawada and H. Miyairi,EffectsofTabDesignandGripping ConditionsonTensilePropertiesofUnidirectionalCFRPinFibreandTransverseDirection,ECCM-Composites:TestingandStandardisation, Amsterdam, The Netherlands, 1992.
182. ASTM D3039, TestMethodforTensilePropertiesFibre-Resin Composites, 1993.
183. G.D. Sims, DevelopmentsinHarmonisationofStandardsforPolymerMatrixComposites,EECMCompositeTestingandStandardisation, Amsterdam, The Netherlands, 1992.
184. G D Sims, Composites, 1991, 22, 4, 267.
185. BS 4994:1987, DesignandConstructionofVesselsandTanksin ReinforcedPlastics, 1987.
186. BS 6464:1984, SpecificationsforReinforcedPlasticsPipes,FittingsandJointsfor Process Plant, 1984.
187. ISO 10119:1992, CarbonFibres–DeterminationofDensity, 1992.
188. ISO 10120:1991, CarbonFibres–DeterminationofLinearDensity, 1991.
189. ISO/DIS 10548, CarbonFibres–DeterminationofSizecontentandSize Amount, 2002.
190. ISO/DIS 10617, CarbonFibres–DefinitionandVocabulary, 2010.
191. ISO 10352, FibreReinforcedPlastics–MouldingCompoundsand Prepregs, DeterminationofMassperUnitArea, 1991.

138
Physical Testing of Plastics
192. prEN 2557, CarbonFibrePreimpregnates–TestMethodforthe DeterminationofMassPerUnitArea, 1998.
193. EN 2339, TestMethodfortheDeterminationofMassperUnitAreaofWovenTextileGlass–FibreFabricPreimpregnates, 1993.
194. P.T. Curtis, CragTestmethodsfortheMeasurementofEngineering Properties ofFibreReinforcedPlastics, 3rd Edition, RAE TR 88012, 1988.
195. G.D. Sims, DevelopmentofStandardsforAdvancedPolymerMatrixComposites–ABPF/ACGOverview, NPLReport DMM(A)8, 1990.
196. G.D. Sims, StandardsforPolymerMatrixComposites,PartIAssessmentforCragTestMethodsData, NPLReport DMM(M)6, 1990.
197. G.D. Sims, StandardsforPolymerMatrixComposites,PartIIAssessment and ComparisonofCragTestMethods,NPLReport DMM(M)7, 1990.
198. ISO 178, Plastics–DeterminationofFlexuralPropertiesofRigid Plastics, 1993.
199. ISO 8515, TextileGlassReinforcedPlastics:Determination of Comparison PropertiesParalleltotheLaminate, 1991.
200. ISO 4585, TextileGlassReinforcedPlastics-DeterminationofApparentInterlaminarShearStrengthbyShortBeamTest, 1989.
201. ASTM D3518, In-PlaneShearStress-StrainResponseofUnidirectionalReinforcedPlastics, 1991.
202. S. Kellas, J. Morton and K.E. Jackson, DamageandFailure Mechanisms in ScaledAngle-PlyLaminates,ASTM STP 1156, 257-280, 1993.
203. prEN 6031, FRP–DeterminationofIn-PlaneShearProperties(+ Tensile Test, 1995.
204. ISO 5725, (BSI 5497, 1987), PrecisionofTestMethods,Part1:Guide for theDeterminationofRepeatabilityandReproducibilityfora StandardTestMethodbyInter-LaboratoryTrial, 1986.
205. ISO CD 13586, Plastic-DeterminationofEnergyPerUnitAreaofCrack (Gc)andtheCriticalStressIntensityFactor(Kc),LinearElasticFractureMechanicsApproach, 2000.
139
Mechanical Properties of Polymers
206. R. Khoshravan and C. Bathias, DelaminationTestsofDCBand ENFCompositeSpecimensinModeIandModeII,AnnualReportofVAMAS WG5, 1990.
207. W.R. Broughton and A. Vamas,Round-RobinProjectonPolymerCompositeDelaminationinModeIandModeII;CyclicLoading,NPLReport DMM(A)47, 1992.
208. G.D. Sims and A. Vamas,Round-RobinonFatigueTestMethodsforPolymerMatrixComposites.PartI,TensileandFlexuralTestsofUnidirectionalMaterial, NPLReport DMM(A)180, 1989.
209. G.D. Sims, InterimVAMSReportonPart1ofPolymerComposites FatigueRound-Robin.
210. ASTM D3044, StandardTestMethodforShearModulusof Plywood, 1976.
211. G.D. Sims, W. Nimmo, F.A. Johnson and D.H. Ferriss, AnalysisofPlate-TwistTestforIn-PlaneShearModulusofCompositeMaterials,NPL Report DMM(A)54, 1992.
212. S.W. Tsai and H.T. Hahn, IntroductiontoCompositeMaterials, Technomic Publishing Company, Lancaster, PA, USA, 1980.
213. G.G. Sims, InternationalStandardisationofCouponandStructural ElementTestMethods, ECCM-Composites: Testing and Standardisation 2, Hamburg, Germany, 1994.
214. ASTM D5379/D3579M – 1993, StandardTestMethodforShear Properties ofCompositeMaterialsbytheV-NotchedBeamMethod, 1993.
215. ISO 6603, Plastics–DeterminationofMulti-AxialImpactBehaviourofRigidPlastics, Part1–FallingDartMethod;Part2–InstrumentedPunctureTest, 1989.
216. W.R. Broughton and G.D. Sims, AnoverviewofThrough-ThicknessTest MethodsforPolymerMatrixComposites, NPL Report DMM(A)148, 1994.
217. G.D Sims and M.J. Lodeiro, AnoverviewofStructuralElementTest MethodsforPolymerMatrixComposites, NPL Report, 1994.
218. G.D. Sims, D.H. Ferriss and D. Payne, AnOverviewofDesignAidsfor StructuralDesignofPolymerMatrixComposites, NPL Report, 1994.

140
Physical Testing of Plastics
219. G.D. Sims and W. Nimmo, AReviewofTestMethodsforPolymerMatrix CompositesatNon-AmbientTemperatures, NPL Report, 1994.
220. ISO/CD3 1172, TextileGlassReinforcedPlastic,Prepregs,MouldingCompoundsandComposites–DeterminationofGlassandFillerContent,MethodofCalcination, 1994.
221. ISO/CD2 11667, FibreReinforcedPlastics-MouldingCompoundsand Prepregs-DeterminationofFibre,ResinandFillerContent–MethodbyDissolution, 1994.
222. BS 18, MethodforTensileTestingofMetals(IncludingAerospace Materials, 1987. [Withdrawn, replaced by BS EN 10002:1990]
223. C. Treny and B. Dupenray in the Proceedingsofthe55thSPEANTEC Conference, Toronto, Canada, 1997, p.2805.
224. P.C. Haschke, Machine Design, 2001, 73, 61.
225. Exstae 6000, SeriesDynamicMechanicalSpectrometers,Seiko,Instruments
226. H.T. Jones, SAMPEJournal, 2002, 38, 91.
227. H. Wong, D.G. Thompson, J.R. Schoonover, S.R. Ambushon and R.A. Palmer, Macromolecules, 2001, 34, 7084.
228. J. Foreman, J.E.K. Schawe and M.W. Wagner inProceedingsofthe162nd ACSRubberDivisionConference, Pittsburgh, PA, USA, 2002, Paper No.13.
229. F. Gouin, PlastiquesetElastomeresMagazine, 2001, 53, 17.
230. D. Dean, M. Husband and M. Trimmer, JournalofPolymerScience,PolymerPhysicsEdition, 1998, 36, 2971.
231. E. Kontou and G. Spathis, JournalofAppliedPolymerScience, 2003, 88, 1942.
232. L. Heux, J.J. Halary, F. Laupretre and I. Monnerie, Polymer, 1997, 38, 767.
233. M.E. Leyva, B.G. Soares and D. Khastgir, Polymer, 2002, 43, 7505.
234. J. Son, D.J. Gardner, S. O’Neill and C. Metaxas, JournalofAppliedPolymer Science, 2003, 89, 1638.
141
Mechanical Properties of Polymers
235. D.W. Bamborough in the ProceedingsoftheTechnomicPressureSensitive AdhesiveTechnologyConference,Milan, Italy, 2001, Paper No.10.
236. D.W. Bamborough in the ProceedingsoftheTechnomicPressureSensitiveAdhesivesConference, Basel, Switzerland, 1993, Section 111, p.2.
237. M. Botov, H. Betchev, D. Bikiaris and D. Panayiotou, JournalofAppliedPolymerScience, 1999, 74, 523.
238. D. Singh, V.P. Malhotra and J.L. Vats, JournalofAppliedPolymerScience, 1999, 71, 1959.
239. L. Priya and J.P. Jog, JournelofPolymerScience,PolymerPhysicsEdition, 2003, 41, 31.
240. M. Sepe, InjectionMoulding,1999, 7, 52.
241. O. Schroder and E. Schmachtenberg in theProceedingsoftheANTEC2001Conference, Dallas, TX, USA, 2001, Paper No.405.
242. R.A. Palmer, P. Chen and M.H. Gilson in the ProceedingsoftheACSPolymericMaterialsScienceandEngineeringConference, Orlando, FL, USA, Fall 1996, 75, p.43.
243. Y.K. Kim and S.R. White, PolymerEngineeringandScience, 1996, 36, 2852.
244. W. Venneman, S. Barbe, K. Kummerlow, K.G. Cai, A.C.A. Reid, S. Srinivan and S. de Vogel in the ProceedingsofaRapraTechnologyConference-TPE2004, Brussels, Belgium, 2004, p.141.
245. P. Maltese,MateriePlasticheedElastomeri,1995, 4, 225.
246. ChinaPlasticandRubberJournal, 2002, 10-11, 68.
247. M. Exrin in the Proceedingsofthe60thAnnualTechnicalConferenceANTEC2002,San Francisco, CA, USA, 2002, Session M40, Paper No.202.
248. J.L. Leblanc, RevueGeneraledesCaoutchoucsetPlastiques, 1995, 745, 41.
249. J. Bouton and S.A. Rheo, PlastiquesetElastomers, Magazine, 2000, 52, 34
250. G. Sarrkel and A. Choudhury, JournalofAppliedPolymerScience, 2008, 108, 3442.
251. Y.G. Jeong, S.C. Lee and W.H. Jo, MacromolecularResearch, 2006, 14, 416.

142
Physical Testing of Plastics
252. G. Costa, G.C. Eastwood, J.P.A. Fairclough, J. Paprotny, A.J. Ryan and P. Stagnaro, Macromolecules, 2008, 41, 1034.
253. J. Seo, W. Jang and H. Han, MacromolecularResearch, 2007, 15, 10.
254. S. Mohanty, S.K. Verma and S.K. Nayak, CompositesScienceandTechnology, 2006, 66, 538.
255. P. Musto, M. Abbate, G. Ragosta and G. Scarinzi, Polymer, 2007, 48, 3703.
256. I.S. Kolesov, R. Androsch and H.J. Radusch, Macromolecules, 2005, 38, 445.
257. F. Declerq in the ProceedingsoftheTechnicalRubberGoods;PartofOur EverydayLifeConference, Puchov, Slovakia, 1996, p.173.
258. M. Fujiyama, Y. Kitajima and H. Inata, JournalofAppliedPolymerScience, 2002, 84, 2128.
259. B. Vergnes and F. Berzin, MacromolecularSymposia, 2000, 158, 77.
260. H. Kwag, D. Rana, K. Cho, J. Rhee, T. Woo, B.H. Lee and S. Choe, Polymer EngineeringandScience, 2000, 40, 1672.
261. A.B. Kummer in the ProceedingsofthePressureSensitiveTapeCouncil23rd AnnualTechnicalSeminar:PressureSensitiveTapesfortheNewMillennium,New Orleans, LA, USA, 2000, p.25.
262. M. Doyle and J. A.E. Manson in the ProceedingsoftheANTEC 2000 Conference, Orlando, FL, USA, 2000, Paper No.169.
263. A.L.A Bobovich, Y, Unigovski, E.M. Gutman and E. Kolmakov in the ProceedingsofANTEC63rdAnnualConference, SPE, Boston, MA, USA, 2005.
264. M. Patel, Polymer Testing, 2004, 231, 107.
265. P.D.B. Jung, D. Bhattacharyya and A.J. Easteel, JournalofMaterialScience, 2005, 40, 4775.
266. R. Hernandez, A. Sarafian, D. Dopez and C. Myangos, Polymer, 2004, 45, 5543.
267. J.D.O. Mela and R.W. Radford, Journal of Composite Materials, 2004, 38, 1815.

143
Mechanical Properties of Polymers
268. W. Lifeng, E.W. Cochran, T.P. Lodge and F.S. Bates, Macromolecules, 2004, 37, 3360.
269. J. Capodagli and R. Lakes, RheologicaActa,2008, 47, 777.
270. O. Robles-Vadquez, A. Gonzales-Alvarez, J.E. Puig and O. Manero, Rubber ChemistryandTechnology,2006, 79, 859.
271. D. Wu, L. Wu, F. Goa, M. Zhong and C. Yan, PolymerEngineeringandScience, 2008, 48, 966.
272. J. Ding, X. Ding, X. Riwei and Y. Ding Sheng, Journal of Macromolecular Science, 2005, 1344, 308.
273. K.K. Kar, P. Paik and J.U. Otaigbe, in the Proceedingsof62nd SPEAnnualConference - ANTEC 2004, Chicago, IL, USA, 2004, p.2495.
274. A.L. Bobovitch, Y. Linigovski, E.M. Gutman, E. Kolmakov and S. Yyazovkin, JournalofAppliedPolymerScience, 2007, 103, 3218.
275. J.P. Habas, E. Pavie, A. Happ and J. Perelasse, RheologicaActa, 2008, 47, 765.
276. J. Hepperle, H. Muenstedt, P.K. Haug and C.D. Eisenbach, RheologicaActa, 2005, 45, 151.
277. J. Hepperle and H. Muenstedt, RheologicaActa, 2006, 45, 717.
278. J. Strange, S. Waechtex, H. Muenstedt and H. Kaspar, Macromolecules, 2007, 40, 2409.
279. J. Jachowicz, R. McMuller, C. Wu, L. Senak and D. Koelmel, Journal of AppliedPolymerScience, 2007, 105, 190.
280. F. Yang, X-H. Xiong, Q. Wang and L. Li, PolymerMaterialsScienceandEngineering, 2007, 23, 190.
281. A. Lindner, B. Lestriez, S. Mariot, C. Creton, T. Maevis, B. Luehmann and R. Brummer, JournalofAdhesion, 2006, 82, 267.
282. L. Andreozzi, V. Castelvetro, M. Faetti, M. Giordano and F. Zulli, Macromolecules, 2006, 39, 1880.
283. J. Chan, X. Liu and D. Yang, JournalofAppliedPolymerScience, 2006, 102, 4040.

144
Physical Testing of Plastics
284. J-L. Zhang, L. Shen, W. Chun Li and Q. Zheng, PolymerofMaterialsScienceandEngineering, 2006, 22, 123.
285. K.Y. Kim, G.J. Nam, S.M. Lee and J.W. Lee, JournalofAppliedPolymer Science, 2006, 99, 2132.
286. P. Prasopnatre, P. Saroui and C. Sirisinha, JournalofAppliedPolymerScience, 2009, 111, 1051.
287. ISO 9001, QualityManagementSystems–Requirements, 2001.
288. ASTM D1329, StandardTestMethodforEvaluatingRubberProperty–RetractionatLowerTemperatures(TRTest), 2002.
289. ASTM D1052, StandardTestmethodforMeasuringRubberDeterioration-CutGrowthusingRossFlexingApparatus, 2005.
290. ASTM D945 – 92el, StandardTestMethodsforRubberPropertiesinCompressionorShear(MechanicalOscillograph), 2001.
291. R. H. Chambers, PolymersPaintandColourJournal, 1979, 169, 1109.
292. K.H.J. Klaren, JournaloftheOilandColourChemists’Association, 1977, 60, 205.
293. ASTM D3451-01, StandardGuideforTestingCoatingPowdersandPowderCoatings, 2001.
294. ASTM D3451-0, StandardGuideforTestingCoatingPowdersandPowderMaterials, 2001.
295. ASTM D1921, StandardTestMethodsforParticleSizeofPlasticMaterials, 2001.
296. BS ISO 13319, DeterminationofParticleSizeDistribution–Electrical SensingZoneMethod, 2000.
297. ASTM D609, StandardPracticeforPreparationofCold-RolledSteelPanelsforTestingPaint,Varnish,ConversionCoatingsandRelatedCoatingProducts, 2000.
298. DIN ISO 8130-10, CoatingPowders, 2005.
299. ASTM D822-01, StandardTestMethodforStiffnessPropertiesofPlasticsasaFunctionofTemperaturebyMeansofaTorsionTest, 2001.

145
Mechanical Properties of Polymers
300. ASTM G155-04a, StandardPracticeforOperatingXenonArcLightApparatusforExposureofNon-MetallicMaterials, 2004.
301. ASTM E308, StandardPracticeforComputingtheColoursofObjectsbyUsingtheCIESystem, 2008.
302. BS 2701, SpecificationforRees-HugillPowderDensityFlask, 1965.
303. ASTM D1895-96, StandardTestMethodsforApparentDensity,BulkFactor,andPourabilityofPlasticMaterials, 2003.
304. ASTM D523, StandardTestMethodforSpecularGloss, 2008.
305. DIN 53157, PaintsandVarnishes–PendulumDampingTest, 2000.
306. ASTM D2794-93, StandardTestMethodforResistanceofOrganicCoatingstotheEffectsofRapidDeformation(Impact), 2004.
307. ASTM D522-93a, StandardTestMethodsforMandrelBendTestofAttachedOrganicCoatings, 2001.
308. ASTM B117-64, StandardPracticeforOperatingSaltSpray(Fog)Apparatus, 2003.
309. DIN EN ISO 8130-10, CoatingPowdersPart10:DeterminationofDepositionEfficiency, 2011.
310. NFT 30 – 5-2, PeintursenPoudreThermodurcissablesDeterminationdeleTemperatureandAcclomeration, 1977.
311. NFT 30 – 500, PeintursenPoudreThermodurcissablesdel’aptitudealaProjection, 1976.
312. ASTM D1921, StandardTestMethodforParticleSize(SieveAnalysis)ofPlastic Materials, 2001.
313. M. Terray, InformationsChimie, 1998, 398, 121.
314. R. Trottier, J. Szalanski, C. Dobbs and A. Felix in the ProceedingsoftheACSPolymericMaterialsScienceandEngineeringConference,Orlando, FL, USA, Fall 1996, 75, 58.
315. J. Venkatesan and C.A. Silebi in the ProceedingsoftheACS Polymeric MaterialsScienceandEngineeringConference,Orlando, FL, USA, 1996, Volume 75, p.99.

146
Physical Testing of Plastics
316. C. Boerschig, B. Fries, W. Gronski, C. Weis and C. Friedrich, Polymer, 2000, 41, 3029.
317. R. Trottier, J. Szalanski, C. Dobbs and A. Felix in the ProceedingsoftheACS PolymericMaterialsScienceandEngineering,Orlando, FL, 1996, Volume 75, p.58.
318. M. Ifwarson and K. Aoyama in ProceedingsoftheInstituteofMaterials PlasticPipesXConference, Goteborg, Sweden, 1982, p.731.
319. R. Vegas, RevistadePlastico,Modernos, 2002, 83, 589.
320. C. Bonter and E. Schmechtenberg, KunststoffePlastEurope, 2000, 90, 38.
321. D.V. Reddy and S. Ataoglu, JournalofAdvancesMaterials,2004, 36, 43.
322. S. Ghoch and D.K. Tully, PlasticsIndustry, 1982, 9, 12.
323. M.A. Gomez, G. Ellis and C. Marco, RevistadePlasticosModernos, 2002, 83, 582.
324. Y. Germain, PolymerEngineeringandScience, 1998, 38, 657.
325. UNI 7448, Tubi di PVC Rigido (Non Plastificato), MetodidiProva, 1975.
326. G.D. Sims in the Proceedingsofthe BPFConference-DesignedforLifeComposites, London, UK, 1994, Publication No. 293/9, p.101.
327. ASTM D1709, StandardTestMethodsforImpactResistanceofPlasticFilmbytheFree-FallingDartMethod, 2004.
328. UNI EN ISO 7765-1, PlasticsFilmandSheeting–DeterminationofImpactResistancebytheFree-FallingDartMethod–Part1:StaircaseMethods, 2005.
329. R.M. Patel, P. Saavedra, J. de Groot, C. Hinton and R. Guerra in the ProceedingsoftheTAPPI: Polymers,LaminationandCoatingsConference,Toronto, Ontario, Canada, 1997, Book 1, p.239.
330. S.S. Wood and A.V. Pocius in the ProceedingsoftheAnnualSPEConference-ANTEC2000,Orlando, FL, USA, 2000, Paper No.33.
331. M.G. Cernak and W.L. Chiang in the ProceedingsoftheTAPPI Polymers, LaminationsandCoatingsConference, Toronto, Ontario, Canada, 1997, Book 2, p.479.
147
Mechanical Properties of Polymers
332. W. Michaeli, S. Goehel and R. Dahlmann, JournalofPolymerEngineering, 2004, 24, 107.
333. R.M. Patel, P Saavedra, J. de Grat, C. Hinton and R. Guerra in the ProceedingsoftheTAPPI Polymers,LaminatesandCoatings Conference, Toronto, Ontario, Canada, 1997, Book 1, p.239.
334. H-T. Lee and L-H. Lin, Macromolecules, 2006, 39, 6133.
335. Y.P. Wang, X. Goa, R.M. Wong, H.G. Liu, C. Yang and Y.B. Xiong, ReactiveandFunctionalPolymers, 2008, 687, 1170.
336. Z. Liu, K. Chen and D. Yan, Polymer Testing, 2004, 23, 323.
337. T. Mikolajczyk and M. Olejnik, FillersandTextilesinEasternEurope, 2007, 15, 26.
338. B. Pourabbas and H. Azimi, Journal of Composite Materials, 2008, 42, 2499.
339. K. Stoeffler, P.G. Lafleur and J. Denault, PolymerEngineeringandScience, 2008, 48, 1449.
340. H. Mirzazadeh and A.A. Katbaly, PolymersforAdvancedTechnologies, 2006, 17, 975.
341. J. Bandyopadhyaly, S.S. Ray and M. Bousmina, Macromolecular Chemistry andPhysics, 2007, 208, 1979.
342. Y.C. Kim, S.J. Lee, J.C. Kim and H. Cho, PolymerJournal(Japan), 2005, 37, 206.
343. W.S. Chaw and Z.A. Mohd Ishak, ExpressPolymerLetters, 2007, 1, 77.
344. D-R. Yei, S-W. Kuo, H-K. Fe and F-C. Chang, Polymer, 2005, 46, 741.
345. D.Y. Wei, S. Innace, E. Di Maio and L. Nicolais, JournalofPolymerScience–PolymerPhysicsEdition, 2005, 43, 689.
346. S. Tanoue, L.A. Utracki, A. Garcia Rejon, P. Sammut, I. Pesneau, M.R. Kamal and I. Lyngaae-Jorgensen, PolymerEngineeringandScience, 2004, 44, 1061.
347. K. Stoeffler, P.G. Lafleur and J. Renault in the Proceedingsofthe64th SPE AnnualConference–ANTEC 2006, Charlotte, NC, USA, 2006, p.263.

148
Physical Testing of Plastics
348. ASTM D693-03a, StandandTestMethodsforDeflectionTemperatureunderLoadofPlastics.
349. L. Zsedai, G. Kalacska, K. Vercommen and K. Van Acber, InternationalScienceandTechnology, 2002, 29, T17.
350. P.M. Taylor and D.M. Pollet, JournalofTextileInstitute,Part1: FibreScienceandTextileTechnology, 2000, 91, 1.
351. E.A. Poppe, K. Leidig, K. Schirmer and L. Jayle, RevueGeneraldesCaoutchoucsetPlastiques, 1997, 760, 41.
352. R. Selden, PolymerEngineeringandScience, 1997, 37, 205.
353. M.Y. Keating, L.B. Malone and W.D. Saunders, JournalofThermalAnalysisandCalorimetry, 2002, 69, 37.
354. S.C. Shik, PopularPlasticsandPackaging, 2003, 48, 55.
355. ASTM D2944-71, StandardTestMethodofSamplingProcessedPeatMaterials, 1998.
356. ASTM D648, StandardTestMethodforDeflectionTemperatureofPlasticsUnderFlexuralLoadintheEdgewisePosition, 2007.