re2
TRANSCRIPT

STATUS AND BENEFITS
OF
ELECTRIFICATION
ON
INDIAN RAILWAYS

Status of Electrification(As on 01.04.2010)
BG MG NG Total
Route Kilometer (RKM)
52808
8473 2734
64015
Electrified 20059
0 0 20059
% Electrified
37.98
0 0 31.33

%Electrification on World Railways :-(As on 01-01-2007)
Source :-StatInfo.biz - a database of economic statistics of countries, markets and companies. All data are taken from official public sources.

%Electrification on World Railways :-(As on 01-01-2007)
Source :-StatInfo.biz - a database of economic statistics of countries, markets and companies. All data are taken from official public sources.

Plan Period RKM Electrified Cumulative Electrified RKM
- 1925-56 529 5292nd Plan 1956-61 216 7453rd Plan 1961-66 1678 2423
Annual Plan 1966-69 814 32374th Plan 1969-74 953 41905th Plan 1974-78 533 4723
Inter Plan 1978-80 195 49186th Plan 1980-85 1522 64407th Plan 1985-90 2812 9252
Inter Plan 1990-92 1557 108098th Plan 1992-97 2708 135179th Plan 1997-02 2484 16001
10th Plan 2002-07 1810 17811
Plan wise Progress of Electrification on Indian Railways
11th plan(31.03.10) 2007-12 200592248

“Vision – 2020” - A Policy Document
of Railway Board has set up a target
of increasing electrified RKM from
20000 RKM at present to 33000 RKM
by 2020, so as to meet the challenge
of hauling 250% more traffic by 2020.


(Pink Book of 2010-11)
completed
70% completed
completed
completed
completed

completed
completed
completed
completed
completed
80% completed
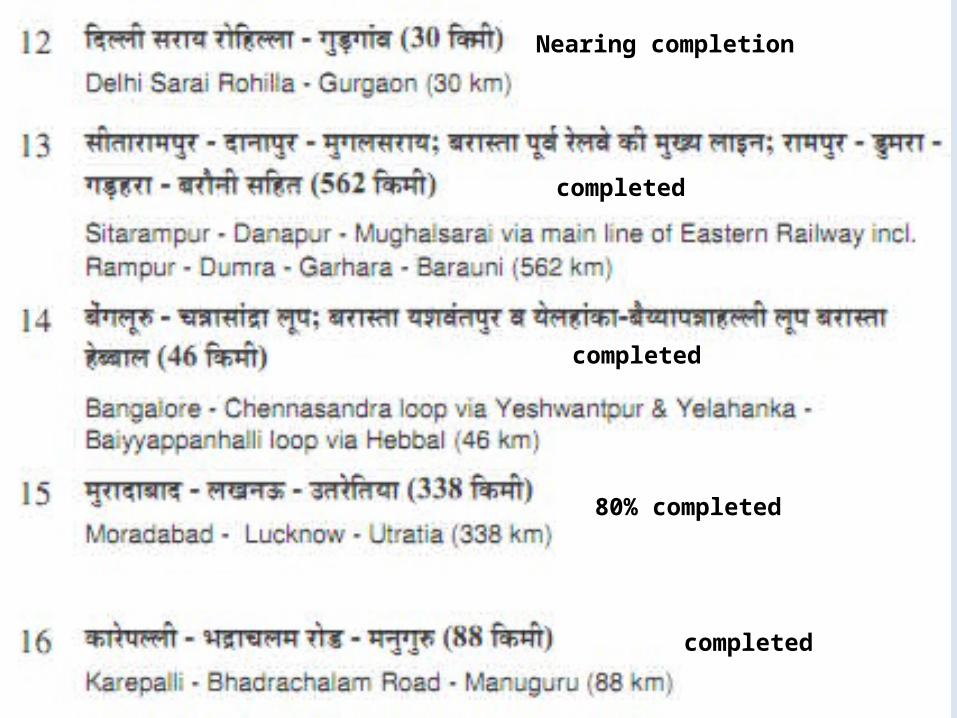
completed
completed
80% completed
completed
Nearing completion
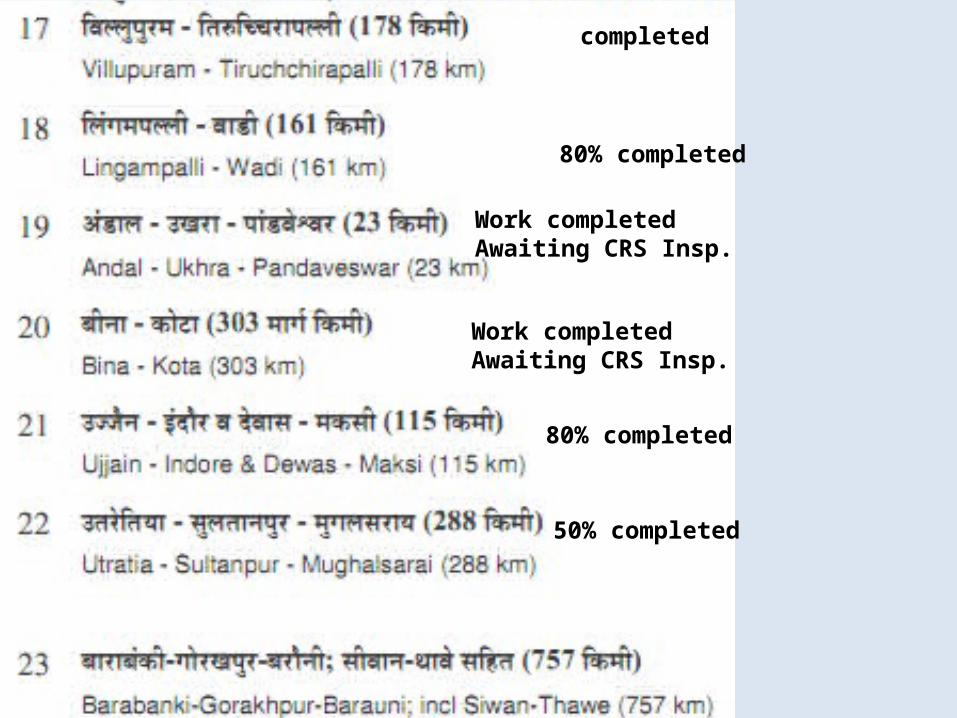
completed
Work completedAwaiting CRS Insp.
Work completedAwaiting CRS Insp.
80% completed
80% completed
50% completed

Work completedAwaiting CRS Insp.
completed
40% completed

(totalling 1430 km.)
Suppl. Budget – 1.Mathura – Alwar 2. Gooty-Yelhanka-Banguluru - sanctioned.
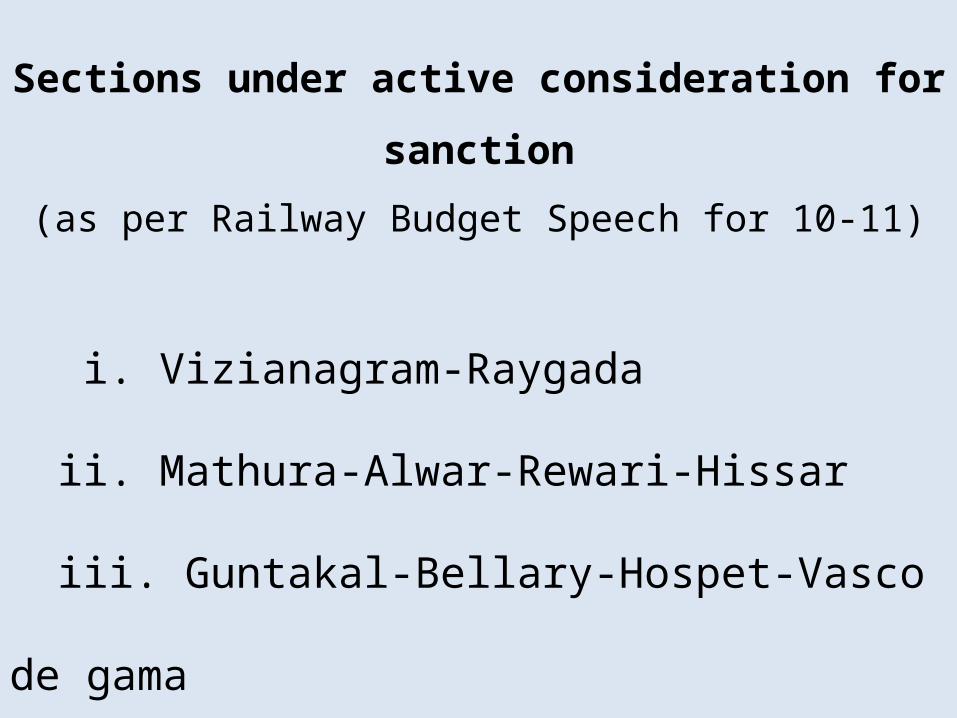
Sections under active consideration for sanction
(as per Railway Budget Speech for 10-11)
i. Vizianagram-Raygada
ii. Mathura-Alwar-Rewari-Hissar
iii. Guntakal-Bellary-Hospet-Vasco de gama

Sections for which Feasibility study is undertaken(as per Railway Budget Speech for 10-11)
i. Bardhaman-Katwa-New Farakka including Katwa-Ahmadpurii. Chheoki-Manikpur-Itarsiiii. Chhapra-Varanasi-Allahabad including Bhatni-Aunrihar and PhephnaIndaraiv. Garwa Road-Chopan-Singrauli including Chunar-Chopanv. Pakur-Kumedpur including Gumani-Sahibganjvi. Angul-Sambalpur-Jharsugudavii. Kiul-Tillaiyya-Manpurviii. New Bongoigaon-Jogighopa-Kamakhyaix. Bankura-Rainanagarx. Fatwa-Islampur-Bakhtiyarpur-Rajgirxi. Vijaywada-Niduduvolu including Machhlipatnam & Narsapurxii. Falaknuma – Umdanagarxiii. Secunderabad – Medchal
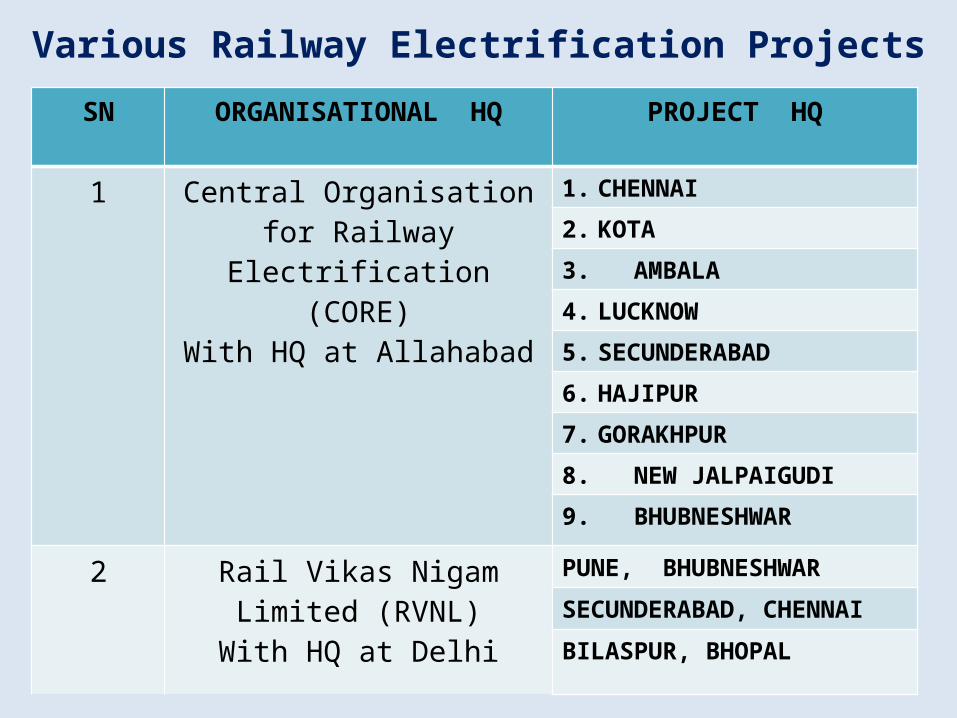
Various Railway Electrification Projects
SN ORGANISATIONAL HQ PROJECT HQ
1 Central Organisation for Railway Electrification
(CORE)With HQ at Allahabad
1. CHENNAI
2. KOTA
3. AMBALA
4. LUCKNOW
5. SECUNDERABAD
6. HAJIPUR
7. GORAKHPUR
8. NEW JALPAIGUDI
9. BHUBNESHWAR
2 Rail Vikas Nigam Limited (RVNL)
With HQ at Delhi
PUNE, BHUBNESHWAR
SECUNDERABAD, CHENNAI
BILASPUR, BHOPAL

Electrification works in progress by RE
Project
Group
Section RKMEnergised till 31-3-10
Balance RKM as on
1-4-10
Target for 2010-11
CHENNAI
157& 158
Shoranur-Penambur-Mangalore
328 0 328 -
139Trivandrum-Kanyakumari
87 0 87 53 (TVC-Eraniel)
154Madurai-Tuticorin-Nagercoil
262 0 262100 (Madurai-Kumarpuram)
155Vellore-Villupuram
150 0 15067 (Villupuram-Tiruvannmalai)
Bangalore Suburban
51 45 6 6
Total 878 45 833 226

Project
Group
Section RKM
Energ-ised till
31-3-10
Balance RKM as on
1-4-10
Target for 2010-11
KOTA
138Indore –Dewas-Ujjain - Maksi
115 88 27 27 (Maksi-Sheelakheri)
148Kanpur-Jhansi 241 0 241 90 (Jhansi-Ait)
Total 356 88 268 117
Electrification works in progress by RE

Electrification works in progress by REProject
Group
Section RKMEnergised till 31-3-10
Balance RKM as on
1-4-10
Target for 2010-11
AMBALA
89BGhaziabad- Moradabad
140 0 140 -
128 Moradabad-Rosa 169 80 89 89 (Bareli-MB)
143Jallandhar-Jammutawi-Udhampur
275 99 17636 (Jammu -Samba+Chakki-Pathankot)
145Shakurbasti-Rohtak
60 57 33 (Rohtak Yard)
107Khurja- Meerut-Saharanpur
207 112 9595 (Sakhoti-Saharanpur)
107A GZB-Meerut 47 0 47 47
145Rohtak-Bhantida-Lehramohabbat
252 0 252 -
Total 1150 348 802 270

Project
Group
Section RKMEnergised till 31-3-10
Balance RKM as
on 1-4-10
Target for 2010-11
L K O
129Rosa-LKO-Alamnagar-Utratia
179 177 2 2 (Utratia Yd)
136Utratia-Sultanpur
128 61 67 67(Akbarg-Sult)
137Sultanpur-Mughalsarai-
169 104 6565 (Sultanpur -Srikrishna Nagar)
153Varansi-Unchahar
207 0 20745 (Varanasi-Bhadohi)
Total 683 342 341 179
SC
132Lingampalli-Wadi
161 109 5252 (Nawandgi-Wadi)
156 Kangeri-Mysore 125 0 12526 (Kangeri-Ketohalli)
-Ballarshah-Gondia
250 0 250 -
Total 536 109 427 78

Electrification works in progress by RE
Project
Group
Section RKM
Energised till
31-3-10
Balance RKM as on 1-4-10
Target for 2010-11
Hajipur
140 AB
Chhapra – Barauni 305 240 6534 (Dholi-Ramdayal Nag
149 Barauni-Katihar 187 0 18750(Barauni-Umesh Nagar)
Total 492 240 252 84
Gorakhpur
141Chapra-Gorakhpur & Siwan-Thawe
207 90 11750 (Siwan-Bhatni)
142Gorakhpur-Barabanki
245 4 24125 (Budwal-Sarju)+36(Sarju-Gonda)
Total 452 94 358 111
Barabanki-Gorakhpur-Siwan-Chapara-Barauni-Katihar section is distributed.

Electrification works in progress by RE
Project
Group
Section RKM
Energised till
31-3-10
Balance RKM as on
1-4-10
Target for 2010-11
Newjalpaiguri
150 Katihar-Jalpaiguri 267 0 267
65 (Katihar-Sanjaygram) + 35 (Katihar-Mukuria)
151Jalpaiguri-New
Bongaigaon221 0 221 -
152New Bongaigaon-Guwahati
161 0 161 -
Total 649 0 649 100
Bhubneshwar
Pandabeshwar-Sainthia-Pakur (incl. Khana-Santhia)
205 0 20550 (Khana-Kopai)

Summary of Electrification works in progress by RE
Sl No
Project Total RKM
Energised till 31-3-10
Balance RKM as on 1-4-10
Target for 2010-11
1 Chennai 878 45 833 226
2 Kota 356 88 268 117
3 Ambala 1150 348 802 270
4 Lucknow 683 342 341 179
5 Secunderabad 536 109 427 78
6 Hajipur 492 240 252 84
7 Gorakhpur 452 94 358 111
8 New Jalpaiguri 649 0 649 100
9 Bhubneshwar 205 0 205 50
Grand Total 5401 1266 4135 1215

Project Section RKM
RVNL
Nandalur-Guntakal 222
Obulavripalle- Krishnapatnam 113
Bharauch-Dahej 62
Haridaspur-Paradeep 82
Daitari-Banspani 142
Pune-Wadi-Guntakal 641
Daund – Manmad incl. Shirdi 255
Gooty – Bengaluru - Yelahanka 306
Total 1823
Zonal Rly
Chandigarh-LDH(NR) 112
Chandigarh-Budhi(NR) 33
Burdwan- Katwa (ER) 52
Total 197
Grand Total 2020
Electrification works in progress by RVNL & Zonal Rlys.

Future planning for electrification in next 10 yr.
PARAMETER RKM
Missing sections identified for RE
1879
Feeder routes for DFC 2042
High Density (HDN) routes 7268
Routes left in the Blue Print 2814
TOTAL 14003

SECTIONS Rly. RKM
Bakhtiarpur-Rajgir ECR 53
Manpur-Tilaiya-Kiul ECR 117
Katwa-Azimganj ER 78
Moradabad-Kashipur-Ramnagar, Kashipur-Lalkuan NER 136
Rampur-Kathgodam NER 89
Chhapra-Varanasi-Allahabad incl.Aunrihar-BTT & Indara-Phephna
NER 503
Barabanki-AY-Akbarpur NR 160
Laksar-Dehradun incl Raiwala-Rishikesh NR 78
Utraitia-Unchahar & Zafrabad-Janghai NR 151
Madurai-Rameshwaram SR 161
Salem-Vridhachalam SR 138
Erode-Karur-Tirichirappalli & Karur-Dindigul SR 215
TOTAL 1879
MISSING SECTIONS TO BE ELECTRIFIED

Feeder routes for DFCSECTIONS Rly. RKM
Panvel-Pen-Roha CR 75
Pandabeshwar-Saintia-Pakur ER 151
Hissar-Bhatinda-Suratgarh-Bridhwal NR 174
Ludhiana-Beas-Govindwal sahib NR 27
Rajpura-Dhuri-Lehra Mohabhat NR 173
Zafrabad-Akberpur-Tanda NR 99
Ludhiana-Hissar-Rewari NR/NWR 348
Hazira-Surat WR 40
Kandla port-Gandhidham-Palanpur WR 312
Mundraport-Gandhidham WR 66
Pipavav-Surendranagar WR 395
Viramgram-Samakhiali WR 182
TOTAL 2042

STATUS OF ELECTRIFICATION ON HIGH DEISITY ROUTESSN ROUTE SECTION RKM
Delhi-Kanpur-Mughalsarai-Gaya-Howrah
1453
Mughalsarai-Patna-Sitarampur 562Utraitia -Lucknow-Moradabad 338Utraitia-Zafrabad-Mughalsarai. 288
Varanasi-Jhangai-Unchahar incl. Phaphamau-Prayag-Allahabad.
207
Shakurbasti-Bhatinda-Suratgarh 477Andal-Pandabeswar 20
Pandabeswar-Sainthia-Khana 123Mumbai-Howrah via Nagpur 1969
Jalgaon-Surat 306Bina (including flyover)-Kota. 303
Delhi-Mumbai via Kota 1385Delhi-Rewari-Reengus-Phulera-Ajmer-
Chittorgarh/Palanpur-Ratlam675
Gandhidham-Palanpur-Bhildi-Samdari-Jodhpur-Kolayak-Phalodi-Lalgarh-
Bhatinda1005
Panvel-JNPT 28
DELHI-HOWRAH ALONG WITH THE ALTERNATIVE "B" ROUTE ON NORTHERN RAILWAY AND ITS EXTENSION TOWARDS SHAKURBASTI-ROHTAK-BHATINDA-SURATGARH AND ANDAL-SAINTHIA
MUMBAI-HOWRAH ALONG WITH THE LINK ROUTE OF BILASPUR-ANNUPUR-KATNI-DELHI-MUMBAI INCLUDING ALTERNATIVE ROUTE OF DELHI-REWARI-PHULERA-AJMER-CHITTORGARH AND GANDHIDHAM-PALANPUR-BHILDI-SAMDARI-JODHPUR-BHATINA AND PANVEL-
1
2
3
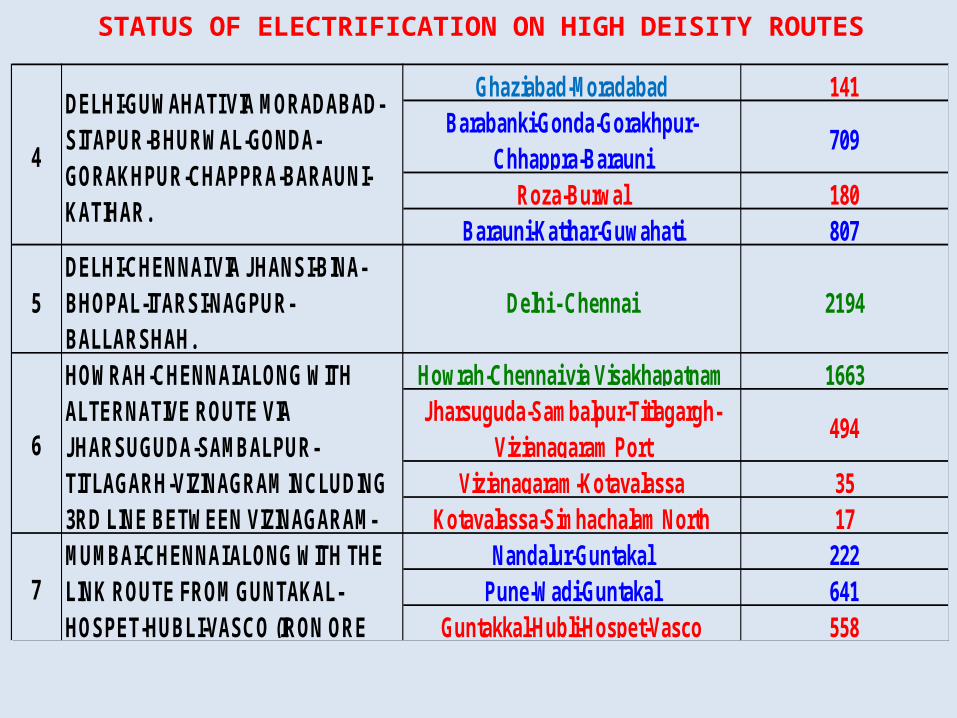
Ghaziabad-Moradabad 141Barabanki-Gonda-Gorakhpur-
Chhappra-Barauni709
Roza-Burwal 180Barauni-Katihar-Guwahati 807
5DELHI-CHENNAI VIA JHANSI-BINA-BHOPAL-ITARSI-NAGPUR-BALLARSHAH.
Delhi - Chennai 2194
Howrah-Chennai via Visakhapatnam 1663Jharsuguda-Sambalpur-Titlagargh-
Vizianagaram Port494
Vizianagaram-Kotavalassa 35Kotavalassa-Simhachalam North 17
Nandalur-Guntakal 222Pune-Wadi-Guntakal 641
Guntakkal-Hubli-Hospet-Vasco 558
4
6
7
DELHI-GUWAHATI VIA MORADABAD-SITAPUR-BHURWAL-GONDA-GORAKHPUR-CHAPPRA-BARAUNI-KATIHAR.
HOWRAH-CHENNAI ALONG WITH ALTERNATIVE ROUTE VIA JHARSUGUDA-SAMBALPUR-TITLAGARH-VIZINAGRAM INCLUDING 3RD LINE BETWEEN VIZINAGARAM-MUMBAI-CHENNAI ALONG WITH THE LINK ROUTE FROM GUNTAKAL-HOSPET-HUBLI-VASCO (IRON ORE
STATUS OF ELECTRIFICATION ON HIGH DEISITY ROUTES
ASS is the Source Book
of data (published by
Statistical Directorate of
Railway Board) used for
this Presentation.
This ASS can be
accessed on internet as :
log on to indianrailways.gov.in
Click Railway Bd. Directorates
Click Statistics & Economics
Click Annual Statistical
Statement (2008-09)

1. Haulage Performance of locomotives :-
The relative performance of existing locomotives, Electric vis-à-vis
Diesel, in terms of MGTKM per loco in last nine years is shown
below :-
Elec loco has hauled
70% more tfc in 08-09

Traction& Year
01-02 02-03 03-04 04-05 05-06 06-07 07-08 08-09
Electric 4238 4206 3170 4381 4400 4427 4506 4557
Diesel 2543 2572 2620 2661 2714 2723 2763 2840
2. Average Horse Power per Locomotive2. Average Horse Power per Locomotive
Source: ASS Stt.-10A/Col.18,19,21&22Source: ASS Stt.-10A/Col.18,19,21&22
(1.6 times more in elect. Loco in 08-09)

3. Share of traffic hauled on Electric & DSL Traction :-
60% traffic is hauled on electric traction in 08-09.40% traffic is hauled on Diesel traction in 08-09.Elect has hauled 50% more than DSL , in tons.
Billion
Source :- ASS (08-09) Statement No. 16 / col. 8 & 9

Traction 01-02 02-03 03-04 04-05 05-06 06-07 07-08 08-09
Freight (Elect.) 61.31 62.82 61.49 63.22 63.22 63.05 63.89 65.32
Freight (Diesel)
38.69 37.18 38.51 36.78 36.79 36.95 36.1 34.68
Pass. (Elect.)
46.75 47.60 45.32 47.03 46.70 47.46 46.95 47.92
Pass.(Diesel)
53.24 52.40 54.68 52.97 53.30 52.54 53.04 52.07
4. Percentage Share of Traffic in Freight & Passenger
Traction - Wise
4. Percentage Share of Traffic in Freight & Passenger
Traction - Wise
Source: ASS Stt.-16/Col.8 & 9. Pass. excludes suburban. Source: ASS Stt.-16/Col.8 & 9. Pass. excludes suburban.

Traction 01-02 02-03 03-04 04-05 05-06 06-07 07-08 08-09
Electric 2682 2746 2864 2990 3003 3044 3004 3082
Diesel 2493 2470 2649 2780 2787 2821 2863 2838
5. Average Load per Train (Goods) in Tons5. Average Load per Train (Goods) in Tons
Source: ASS Stt.-23/col.9Source: ASS Stt.-23/col.9
An average electric-hauled Goods Train has carried
9% more load than an average diesel - train in 2008-09.

Traction 01-02 02-03 03-04 04-05 05-06 06-07 07-08 08-09
Electric 25.8 26.2 24.0 24.7 25.0 25.8 26.3 26.4
Diesel 22.6 22.8 22.1 22.8 23.3 23.9 24.2 24.6
6. Average Speed of Goods Trains (BG) in kmph.6. Average Speed of Goods Trains (BG) in kmph.
Source: ASS Stt.-20/col.12 &13 Source: ASS Stt.-20/col.12 &13
The average speed of an electric-hauled Goods Train is
8% higher than an average diesel - train in 2008-09.

Traction 01-02 02-03 03-04 04-05 05-06 06-07 07-08 08-09
Freight (Elect.) 311 327 434 415 390 361 396 402
Freight (Diesel) 187 183 240 238 247 268 264 265
Ratio (Elec/Dsl)
1.66 1.79 1.81 1.74 1.58 1.67 1.5 1.51
7. Engine Usage - NTKM per day per loco on line
(fig. In 000’s)
7. Engine Usage - NTKM per day per loco on line
(fig. In 000’s)
Source: ASS Stt.-22/col.21Source: ASS Stt.-22/col.21

8. Engine Usage in “Eng.Km. per day per loco in use”
Diesel Electric RatioElectric : Diesel
Ekm/day/locoIn use on
Goods401 487 1.21
Ekm/day/locoIn use on
Passanger595 624 1.05
As per ASS Statement No.22/col.16 & 18 of year 2008-09

9. Fuel consumption (SEC) & cost per 1000 GTKM
Service 07-08 08-09
DSL Elec DSL Elec
@ Rs.31.14/Ltr @Rs.4.41/KWH @Rs.34.21/Ltr @Rs.4.42/KWH
Ltr Rs. KWH Rs. Ltr. Rs. KWH Rs.
Pass. 4.09 127.36 18.9 83.34 4.00 136.84 19.4 85.74
Goods 2.52 78.47 7.72 34.04 2.47 84.49 7.37 32.57
Source :- Statement 27(B) of ASS of 08-09 / Col. No. 17 & 18
In 2008-09, average fuel cost per 1000 GTKM for DSL,
compared to electric was :-
60% higher in Passenger & 160% higher in Goods

2000-01 5389 3685
2001-02 4808 3211
2002-03 4416 2976
2003-04 4301
2929
2004-05 4410 2639
2005-06 4432 2902
2006-07 4181 2653
2007-08 5761
3967
2008-09 5752 3545
2009-10 6734 3505
FAILURE STATISTICS OF LOCOMOTIVES(as per Efficiency & Research Directorate of Rly. Bd.)
Year DSL Elect

Traction
00-01 01-02 02-03 03-04 04-05 05-06 06-07 07-08 08-09 09-10
Elec 2791 2853 2915 2986 3065 3188 3294 3294 3443 3586
DSL 3402 3495 3472 3575 3663 3714 3809 3809 3933 4113
Loco HoldingLoco Holding
Source: ASS Stt.-10A/7&8Source: ASS Stt.-10A/7&8
FAILURE PER LOCO 08-09 09-10
DSL 1.46 1.63
ELEC 1.02 0.97
Dsl locos have 50% more failures than Elect. loco

BENEFITS OF ELECTRIFICATION
1. Huge Savings per year & high “Rate of Return on capital”
A total of Rs.7349 crores is spent on RE Projects since
inception, whereas an annual saving of Rs.6755.72 crores was
achieved only in one year of 2008-09 (after deducting payments
of interest & depreciation), due to electric traction.
It gives annual ROR of about 92% on capital-invested in
RE projects. Explanation follows in next slides.

Km

Constituents of traction – cost
1. Loco Repair & Maintenance Cost – - in Sheds, Workshops, POH, etc.
2. Plant & Equipment Cost - includes OHE
3. Running Staff Cost
4. Fuel Cost

A saving of Rs.(156.33-68.55) = Rs.87.78 per 1000 GTKM is
achieved on use of electric traction, instead of diesel.
Col.50 & 69Col.56 & 72
Col.62 & 75 Col.65
Col.123 Col.129
Col.132 & 134
Col.145 & 147
Col.177 & 180
Based on Statement No.30 of ASS of
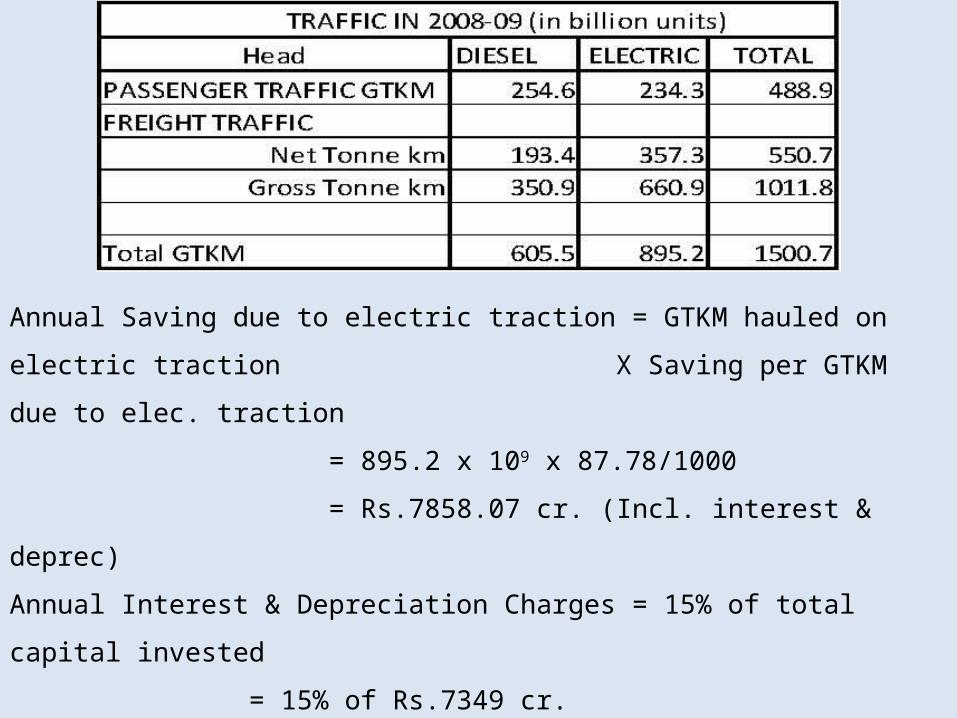
Annual Saving due to electric traction = GTKM hauled on electric traction
X Saving per GTKM due to elec. traction
= 895.2 x 109 x 87.78/1000
= Rs.7858.07 cr. (Incl. interest & deprec)
Annual Interest & Depreciation Charges = 15% of total capital invested
= 15% of Rs.7349 cr.
= Rs.1102.35 cr.
Net Annual Saving in 2008-09 due to electric traction = Rs.(7858.07-1102.35)
= Rs.6755.72 cr.
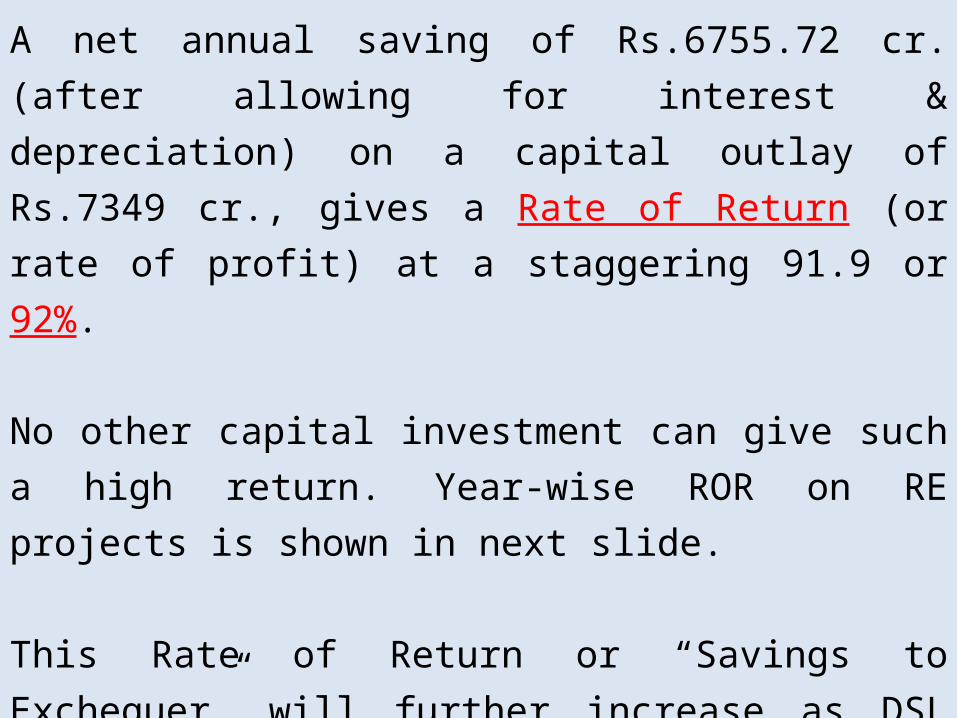
A net annual saving of Rs.6755.72 cr. (after allowing for
interest & depreciation) on a capital outlay of Rs.7349
cr., gives a Rate of Return (or rate of profit) at a
staggering 91.9 or 92%.
No other capital investment can give such a high return.
Year-wise ROR on RE projects is shown in next slide.
This Rate of Return or “Savings to Exchequer” will
further increase as DSL prices increase and more traffic
is hauled on electric traction. Reducing the working of
“Diesel under wire” will further boost the savings.

ROR on capital

2. Low Operation & Maintenance Cost of electric traction :-
As per figures published in ASS, the O&M cost of electric
traction is consistently lower than diesel traction. It has 4
components viz. Loco Maintenance, Plant & Equip. Maintenance,
Running Staff and Fuel.
Increase in Fuel Cost increased sharply for diesel.


Elect.Diesel

Subsequent price hike in diesel after 08-09, amounting to Rs.2.5 per litre
(which increases the diesel traction cost by Rs. 8.51 per 1000 GTKM) and
taking into account the extra cost of lubricants at Rs 2 per 1000 GTKM, the
total revised savings with electric traction today works out to Rs.98.29 per 1000
GTKM.
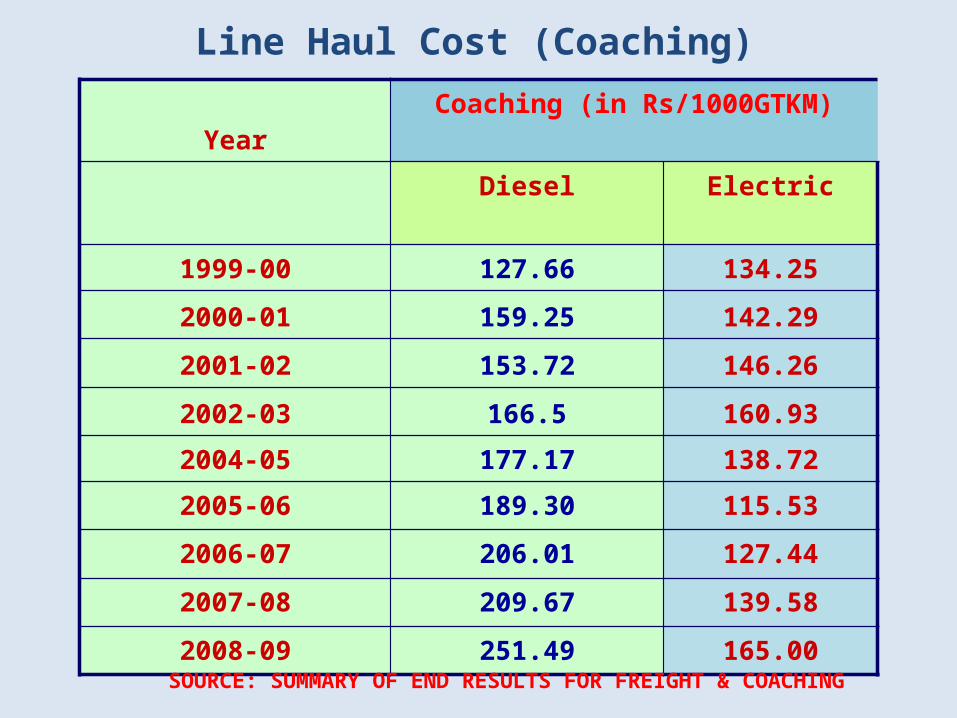
Line Haul Cost (Coaching)
YearCoaching (in Rs/1000GTKM)
Diesel Electric
1999-00 127.66 134.25
2000-01 159.25 142.29
2001-02 153.72 146.26
2002-03 166.5 160.93
2004-05 177.17 138.72
2005-06 189.30 115.53
2006-07 206.01 127.44
2007-08 209.67 139.58
2008-09 251.49 165.00
SOURCE: SUMMARY OF END RESULTS FOR FREIGHT & COACHING

Line Haul Cost (Freight)
Year Freight (in Rs/1000GTKM)
Diesel Electric
1999-00 87.94 79.36
2000-01 103.9 82.33
2001-02 107.37 77.24
2002-03 110.44 77.35
2004-05 118.54 72.57
2005-06 121.22 89.90
2006-07 129.64 78.34
2007-08 132.99 74.56
2008-09 170.69 86.55
SOURCE: SUMMARY OF END RESULTS FOR FREIGHT & COACHING

Mode of Traction
% of Traffic Hauled
Traffic Hauled in Billion GTKM
Expenditure on Fuel in
Rs.Cr.
Remarks
Electric 59.7 % 895.2 3774 No foreign exchange
Diesel 40.3% 605.5 7055 Rs.3737 cr. of foreign exchange
3. Fuel Bill vis-à-vis Traffic Hauled In year 2008-09
In yr. 2008-09, Diesel Traction has hauled about 20% less
traffic, with a fuel bill 87% higher than electric traction.
As per Vision 2020 Document, electrified route will be 33000
km. & Elec. Traction shall haul 77% of total traffic, while DSL
shall haul only 23%.

4. Loss due to running of diesel locomotives :- In 2008-09,
loss of Rs.87.78 per 1000 GTKM and haulage of 605.5 BGTKM on DSL, gives
a loss of Rs.5315 cr., involving 4113 DSL locos @ Rs.1.3 cr. per DSL loco per
yr.

5. Precious Foreign Exchange component :- The foreign
exchange component in the import of oil is around Rs.0.912 crores per loco per
annum.
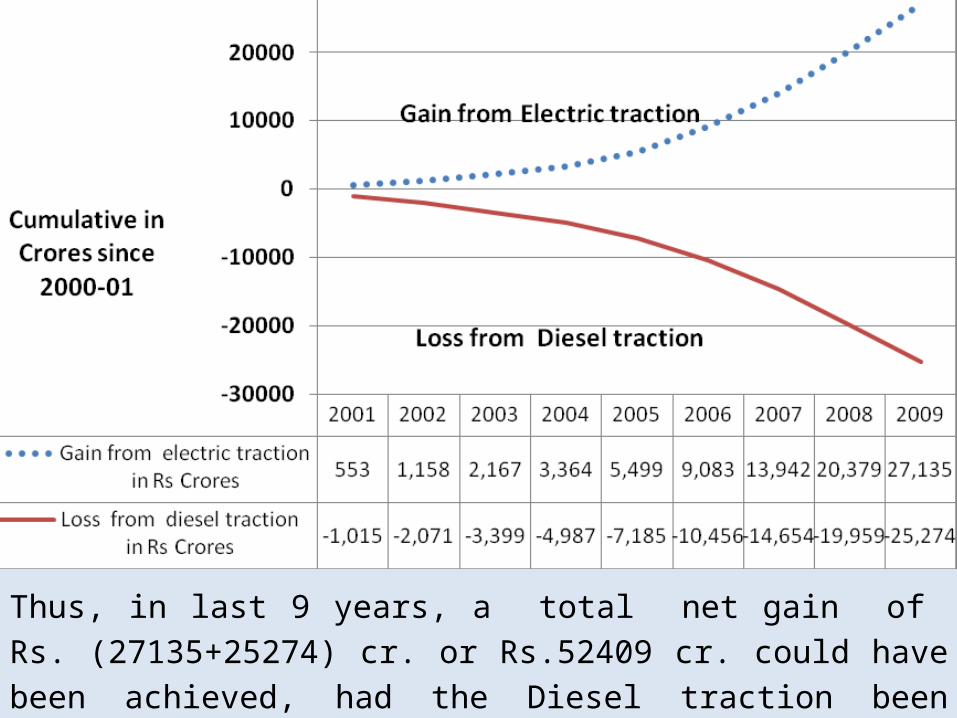
Thus, in last 9 years, a total net gain of Rs. (27135+25274) cr.
or Rs.52409 cr. could have been achieved, had the Diesel traction
been replaced by Electric.

6. Availability & energy-efficiency of fuel :-
(A) For electric traction :- India has 7.1% of world’s coal and is the
third largest producer of coal in the world. There is abundance of coal in
India and this high-ash coal can not be put to any other better use.
From the table the weighted energy efficiency of the total grid generated
power, starting from primary fuels works out to 49%.

Assuming HT transmission-loss of 15% :-
The energy efficiency of electricity from generation to Railway’s Traction
Substation = 49% - (15% of 49)% = 41.65%
Taking further loss of energy upto Pantograph as 5%:-
Energy Efficiency of electricity from generation upto Pantograph
= 41.65% – (5% of 41.65)% = 39.6 %
This efficiency will further increase to 42%, with the direct purchase of
electricity from NTPC and commissioning of various UMPPs with super
thermal criticality. Facility of “Regeneration” in 3-Phase Electric Locos
further improves energy-efficiency in electric traction.
The total power generation in 2008-09 was 842.4 billion units and
the entire electric traction on the Railways consumed only 12.242
billion units accounting to only 1.45% of total generation in India.
Traction during off-peak hours improves load-factor of grid system

(B) Availability & energy-efficiency of diesel traction :-
Since both electric & diesel locomotives use electric motors for
traction, energy efficiency from crude oil production / refinery and
upto electricity-generation by power-pack in diesel locos, is to be
considered. Refineries operate at 90% efficiency, whereas best
diesel engine has a maximum efficiency of 45%. Considering some
loss in the transportation, the total efficiency of diesel-traction is
about 36.5%, which is lower than 39.6% for electric.
The availability of crude reserves in India is only 0.5% of world’s
total. Presently, India is the fourth largest oil importer by importing
80% of its oil consumption, which is increasing at an annual rate of
3.7%. The oil import is already 25% of total imports and contributes
to 55% of trade-deficit. “Post-Peak-oil-scenario” is expected in yr
2014, after which low production & high demand will increase its
prices abnormally high.

7. Atmospheric Pollution :-
Unlike petrol engines, the primary residue of a diesel engine is not a
gas but charred particles that are airborne through the exhaust pipe.
It comprises the principal air pollutants like nitrogen oxides and
microscopically fine particles called particulate matter or soot. Diesel
exhaust is one of the most dangerous pollutants because of its
carcinogenic compounds and the toxicity of its fine particles.
An even more significant consideration is that diesel locomotives
running on railways cause pollution along the tracks & inhabited
areas, at ground level, directly affecting people close by. As against
this, pollution due to thermal power stations takes place generally in
remote areas and the exhaust is released into the atmosphere at
very great heights through tall chimneys. Further, noise factor, which
is referred to as noise pollution is a major nuisance, an irritant with
diesels especially when waiting at stations, and when they pass
through inhabited areas.

The CO2 emissions (or GHG) from different fossil fuels while generating
1 kwh of electricity as determined by Environment Protection Agency of
USA (EPA) are given as :-
But since coal-based electricity generation is 64% of total electricity
produced, the weighted CO2 emission due to electric traction is
(1.02x0.64)=0.65 kg/kwh, whereas electricity produced in diesel engines
emit 0.76 kg/kwh, which is 11% higher. Further, if pollution of Oil
Refineries were also included, Diesel traction produces 16% more
emission compared to electric traction.


OTHER BENEFITS OF ELECTRIFICATION
1. Electric Traction is economical, traffic-growth-oriented,
cleaner, and does not require foreign exchange.
2. It provides reliable electric supply to CLS, RRI, UTS etc.
3. Electric Locos have higher HP, higher balancing speeds, and
therefore haul higher loads at higher speeds.
4. Electric locos have short-time overload capacity of upto 150%
5. Electric Locos visit home-sheds less frequently.
6. Electric Locos have less failures than DSL as per RB Stats.
7. High speed passenger corridor has to be electrified.
8. Modern Electric Locos provide the facility of Regeneration.
9. Development of high HP electric locos is possible.
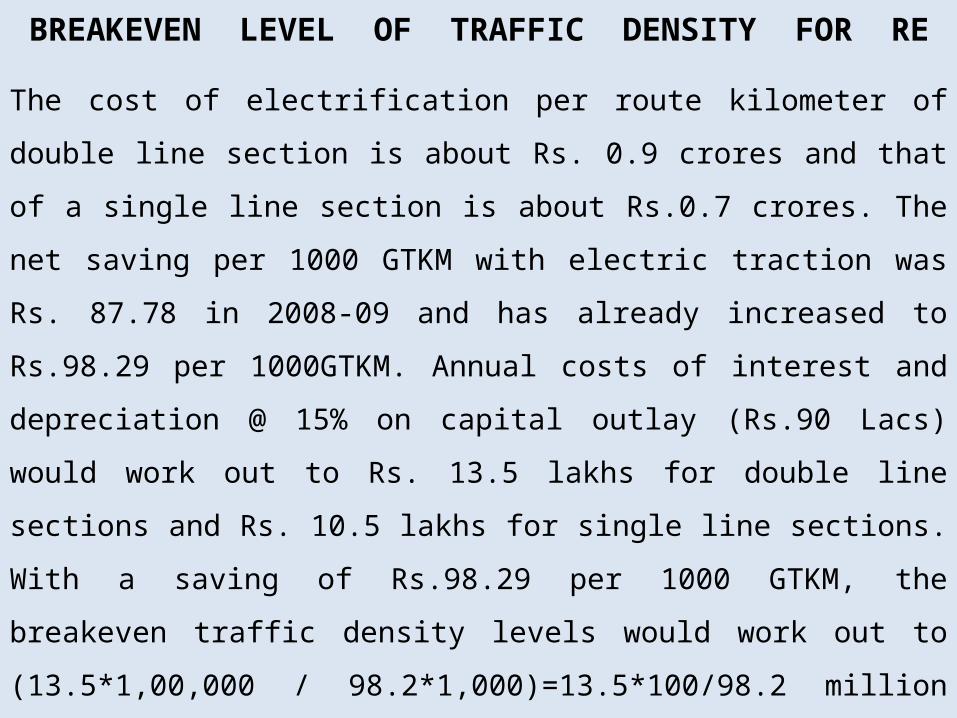
BREAKEVEN LEVEL OF TRAFFIC DENSITY FOR RE
The cost of electrification per route kilometer of double line section is
about Rs. 0.9 crores and that of a single line section is about Rs.0.7
crores. The net saving per 1000 GTKM with electric traction was Rs.
87.78 in 2008-09 and has already increased to Rs.98.29 per
1000GTKM. Annual costs of interest and depreciation @ 15% on capital
outlay (Rs.90 Lacs) would work out to Rs. 13.5 lakhs for double line
sections and Rs. 10.5 lakhs for single line sections.
With a saving of Rs.98.29 per 1000 GTKM, the breakeven traffic density
levels would work out to (13.5*1,00,000 / 98.2*1,000)=13.5*100/98.2
million GTKM per route km. This works out to 13.8 or 14 million GTKM
per route km for double line sections. Likewise, the breakeven traffic
density for single line sections is 10.7 million GTKM per route km.

JUSTIFICATION FOR FURTHER ELECTRIFICATION
1. The average traffic density on balance non-electrified section
is 17.9 MGTKM per annum, whereas even 13.8 MGTKM per
annum is sufficient to justify its electrification.
2. Because of electrification, the traffic density of electrified
section has increased to 47.3 MGTKM per annum.
3. Four types of sections are identified for sanction of
electrification works :-
i) Missing Links ii) Feeder Routes to DFC
iii) High Density Network (HDN) Routes
iv) Part of Blue Print of 2005-06

T H A N K S