re: vapor intrusion assessment report former american ... · 5.1 exposure pathway 11 5.1.1 shallow...
TRANSCRIPT

Lockheed Martin Corporation 6560 Rock Spring Drive, Bethesda, MD 20817 Telephone 301-214-9971 Fax 301-214-9502
February 13, 2007 Re: Vapor Intrusion Assessment Report
Former American Beryllium Company Site OGC #04-1328
Tallevast, Manatee County, Florida Lockheed Martin Corporation is providing you with a copy of the Vapor Intrusion Assessment Report that was developed to address concerns expressed by residents of the Tallevast community regarding potential soil vapors associated with groundwater contamination in the vicinity of the former ABC facility. The report summarizes both historic and recent investigation activities. Specifically, the following information was reviewed and is evaluated in this report:
• Groundwater data as reported in the Site Assessment Report Addendum 3 (SARA 3); • Soil gas data as reported in the SARA; • Indoor air data as reported in the 2005 Vapor Intrusion Sampling Report; • Soil gas and ambient air data collected in June 2006 and October 2006 per the Soil
Vapor Survey Work Plan and Addendum; and • Indoor air data collected and reported by the Manatee County Health Department
(CHD), Florida Department of Health (FDOH), and the Agency for Toxic Substances and Disease Registry (ATSDR) in 2004.
If you have any questions, please contact me at 301-214-9971, or [email protected] Sincerely,
Tina Armstrong, Ph.D. Senior Manager, Environmental Remediation Lockheed Martin Corporation

- 2 -
cc: Mr. Bill Kutash Ms. Deborah Getzoff, FDEP Ms. Nell Tyner, FDEP Ms. Pamala Vazquez, FDEP
Mr. Derek Matory, USEPA Ms. Nancy Malaret Mr. Randy Merchant Mrs. Laura Ward (11 copies) Mrs. Wanda Washington Dr. Tim Varney, Environ The Honorable Vern Buchanan (Newsletter) The Honorable Bill Nelson (Newsletter) The Honorable Bill Galvano (Newsletter) The Honorable Michael Bennett (Newsletter) The Honorable Edwin Hunzeker (Newsletter) Mr. Dan Schlandt (Newsletter) The Honorable Amy Stein (Newsletter) The Honorable Donna Hayes (Newsletter) The Honorable Carol Whitmore (Newsletter) The Honorable Joe McClash (Newsletter) The Honorable Gwen Brown (Newsletter) The Honorable Jane von Hahmann (Newsletter) The Honorable Ron Gettman (Newsletter) Dr. Gladys Branic, Manatee County Health Department Mr. Tom Larkin, Manatee County Health Department
Ms. Karen Collins-Fleming, Manatee County Emergency Management Department Mr. Doug Koenig
Mr. Henry Barbara Mr. Larry Sims

Imagine the result
Lockheed Martin Corporation
Vapor Intrusion Assessment Report
Former American Beryllium Company Site Tallevast, Florida
February 2007

Vapor Intrusion Assessment Report
Gary M. Wroblewski Principal Engineer
Lowell W. McBurney Senior Vice President
Prepared for:
Lockheed Martin Corporation
Prepared by:
ARCADIS U.S., Inc. 8 South River Road Cranbury New Jersey 08512 Tel 609.860.0590 Fax 609.860.0491
Our Ref.:
B0038055.0000
Date:
February 12, 2007

109711427 i
Table of Contents
1. Introduction 1
1.1 General 1
2. Background and Previous Investigations 3
2.1 Background 3
2.2 Previous Investigations 4
2.3 Sampling Rationale 5
3. Investigation Methodology 6
4. Results 8
4.1 Soil Vapor Sampling Results – June 2006 8
4.2 Soil Vapor Sampling Results – October 2006 8
4.3 Ambient Air Results 9
4.3.1 Helium Tracer 9
4.3.2 Barometric Pressure 9
5. Data Evaluation 11
5.1 Exposure Pathway 11
5.1.1 Shallow Hydrogeology 11
5.1.2 Comparative COC Evaluation 12
5.2 Multiple Lines of Evidence Evaluation 13
5.2.1 Site-Specific Data Evaluation 14
5.2.2 Detailed Vapor Intrusion Pathway Assessment 15
5.3 Ambient Air 16
6. Conclusions and Recommendations 18
7. References 20

109711427 ii
Table of Contents
Tables 1 Soil Vapor Analytical Results for June 2006 and October 2006 2 Comparison of June 2006 to October 2006 Sampling Results at the Same
Locations C-1 Method Detection Limits for TO-15 C-2 Sampling and Analysis Summary
Figures 1 Soil Vapor and Ambient Air Sampling Locations – June 2006 2 Soil Vapor and Ambient Air Sampling Locations – October 2006
Appendices A USEPA Subsurface Vapor Intrusion Guidance, Appendix C B Standard Operating Procedure: Soil Vapor Sampling Using USEPA Method TO-15 C Quality Assurance/Quality Control Procedures D Data Review for June and October 2006 Soil Vapor Results E Photoionization Detector Data F Johnson & Ettinger Model Results G Pinellas County 2000 VOC Data Summary

109711427 i
Acronyms
1,1-DCA 1,1-dichloroethane 1,1-DCE 1,1-dichloroethene µg/m3 micrograms per cubic meter ABC American Beryllium Company ATSDR Agency for Toxic Substances and Disease Registry BBL Blasland, Bouck & Lee, Inc. Bgs below ground surface CHD County Health Department cis-1,2-DCE cis-1,2-dichloroethene COCs contaminants of concern EDD electronic data deliverable eV electron volt FAC Florida Administrative Code FAS Floridan Aquifer System FDEP Florida Department of Environmental Protection FDOH Florida Department of Health GC/MS gas chromatograph/mass spectrometer GCTLs Groundwater Cleanup Target Levels GVP gas vapor probe Hg mercury IAS Intermediate Aquifer System J&E Johnson & Ettinger LCS laboratory control sample Lockheed Martin Lockheed Martin Corporation LSAS Lower Surficial Aquifer System MDL Method Detection Limit mL/min milliliters per minute MRL Minimal Risk Level NELAC National Environmental Laboratory Accreditation
Conference OSHA Occupational Safety and Health Administration

109711427 ii
PCE tetrachloroethene PEL Permissible Exposure Limit PID photoionization detector Ppbv parts per billion volume QA/QC quality assurance/quality control QL quantitation limit RL reporting limit SARA Site Assessment Report Addendum SARA 2 Site Assessment Report Addendum 2 SARA 3 Site Assessment Report Addendum 3 SAS Surficial Aquifer System SOP Standard Operating Procedure TCE trichloroethene Tetra Tech Tetra Tech, Inc. USAS Upper Surficial Aquifer System USEPA United States Environmental Protection Agency VOC volatile organic compound

109711427 1
Vapor Intrusion Assessment Report
1. Introduction
1.1 General
Lockheed Martin Corporation (Lockheed Martin) is responsible for the assessment and cleanup of environmental impacts relating to historical operations at the former American Beryllium Company (ABC) facility (facility) located at 1600 Tallevast Road in Tallevast, Manatee County, Florida, and adjoining impacted areas (site). These obligations are being conducted pursuant to the requirements detailed in Consent Order No. 04-1328, executed by and between Lockheed Martin and the Florida Department of Environmental Protection (FDEP), effective July 28, 2004. Furthermore, completion of these assessment activities complies with applicable sections of Chapter 62-780 of the Florida Administrative Code (F.A.C.) and Section 376.30701 of the Florida Statutes. As part of the obligations set forth by the Consent Order and the F.A.C., Blasland, Bouck and Lee, Inc. (BBL) prepared Site Assessment Report Addendum 3 (SARA 3) (BBL, 2006a) on behalf of Lockheed Martin to complete site assessment activities in preparation for the development of a remedial action plan. SARA 3 builds upon previous site assessment activities and addresses specific comments made by the FDEP in a letter dated October 5, 2005 with respect to Site Assessment Report Addendum 2 (SARA 2) (Tetra Tech, Inc. [Tetra Tech], 2005a).
SARA 3 evaluated both the current and potential future risk of exposure to humans and the environment, including multiple pathways of exposure to impacted media. In particular, site-impacted groundwater was evaluated with respect to ingestion, direct contact, and inhalation of compounds that volatilized from groundwater. Site-related contaminants of concern (COCs) were detected in groundwater at concentrations exceeding Florida Groundwater Cleanup Target Levels (GCTLs) in monitoring wells located at the site and in monitoring wells located on residential and light commercial/industrial properties in the vicinity of the facility. Exposure pathways for ingestion and direct contact of site-impacted groundwater have been addressed through control, closure, and/or abandonment of water supply wells in the site area. The exposure pathway via inhalation required further evaluation, which is the subject of this Vapor Intrusion Assessment Report (report). Specifically, site-related COCs have the potential to volatilize from the groundwater into the overlying soil vapor and atmosphere and, potentially, into buildings, thus creating a potential exposure pathway.

109711427 2
Vapor Intrusion Assessment Report
Three previous investigations have focused on the vapor intrusion pathway at the site: Manatee County Health Department (CHD) and Florida Department of Health (FDOH) indoor air sampling in 2004, with a subsequent report by the Agency for Toxic Substances and Disease Registry (ATSDR); the Site Assessment Report Addendum (SARA) that presented the results of soil vapor and groundwater sampling conducted and reported by Tetra Tech on behalf of Lockheed Martin in 2004; and the 2005 Vapor Intrusion Sampling Report (Tetra Tech, 2005b) that presented results of indoor air sampling conducted by Tetra Tech in the former ABC facility buildings. While these three previous investigations did not find any vapor intrusion, new groundwater information, compiled and evaluated as part of SARA 3 subsequent to the completion of the previous vapor investigations, prompted a re-evaluation of the vapor intrusion pathway.
Although vapor intrusion investigations are not specifically a part of the site characterization process described in F.A.C. 62-780, Lockheed Martin has voluntarily conducted additional vapor investigations at the site. Two additional work plans were developed to evaluate the presence of COCs in the vadose zone via soil vapor sampling at selected locations surrounding the facility. BBL collected soil vapor and ambient air samples in June and October 2006, as described in the Soil Vapor Survey Work Plan (BBL, 2006b) and the Soil Vapor Survey Work Plan – Addendum #1 (BBL, 2006c), respectively.
This report provides background information, a description of the rationale and methodology for the investigations, the results of the investigations, and a discussion of the results.

109711427 3
Vapor Intrusion Assessment Report
2. Background and Previous Investigations
2.1 Background
From 1962 until 1996, the facility was owned by Loral Corporation, the parent company of ABC. The facility was operated by ABC as an ultra-precision machine parts manufacturing plant, where metals were milled, lathed, and drilled into various components. Some of the components were finished by electroplating, anodizing, and ultrasonic cleaning. Chemicals used and wastes generated at the facility included oils, fuels, solvents, acids, and metals. Following the acquisition of Loral and its assets (including the ABC facility), Lockheed Martin ceased manufacturing operations in 1996 and initiated site investigations. In 2000, Lockheed Martin sold the facility to BECSD, LLC.
Although no longer the owner, Lockheed Martin has maintained responsibility for past releases from the former ABC facility. Lockheed Martin continued site investigation activities at the site based on previous findings that indicated that there are groundwater impacts. These site investigations were performed by Lockheed Martin in accordance with applicable FDEP regulations and oversight.
Recent investigations (SARA 3 [BBL, 2006a]) included a supplemental groundwater investigation to examine the vertical and lateral extent of impacts in select and outlying perimeter areas. Additional monitoring wells were installed, a total of 95 new and existing monitoring wells (located within the upper surficial aquifer system [USAS]) were sampled, and the groundwater samples were submitted for laboratory analysis. The USAS is considered a significant feature relative to the potential for vapor intrusion because it is the most shallow groundwater unit in the area and has been found to contain site-related COCs.
A summary of results indicated that the horizontal extent of COCs in the USAS appears to be limited to within approximately 800 feet north, 1,400 feet east, 1,200 feet south, and 800 feet west of the facility and to extend beneath residences and light commercial/industrial properties. Based on the information obtained during the site characterization process and described in SARA 3, further investigation was conducted to evaluate the potential for vapor intrusion

109711427 4
Vapor Intrusion Assessment Report
2.2 Previous Investigations
In 2004, Tetra Tech, on behalf of Lockheed Martin, collected 12 soil vapor samples on the former ABC facility property and two samples at off-facility locations. Results were reported by Tetra Tech in the SARA (Tetra Tech, 2005a). The samples were collected at 2 feet below ground surface (bgs), using a gas vapor probe (GVP) kit, based on U.S. Environmental Protection Agency (USEPA) Standard Operating Procedures (SOPs) (USEPA, 2004). Soil vapor samples were collected in 1-liter SUMMA® canisters at the laboratory-set, regulator-controlled, low flow rate of 100 milliliters per minute (mL/min) for approximately 15 to 20 minutes and analyzed by USEPA Method TO-15 for the full suite of analytes. A helium tracer was used to determine the influence of ambient air on the sample. Helium was not detected in any of the samples; therefore, there was no evidence that ambient air was infiltrating the soil vapor samples. The analytical results were compared to Occupational Safety and Health Administration (OSHA) Permissible Exposure Limits (PELs), the ATSDR’s Minimal Risk Levels (MRLs), and the USEPA’s Soil Gas Screening Levels for Scenario-Specific Vapor Attenuation Factors contained in the OSWER Draft Guidance for Evaluating the Vapor Intrusion to Indoor Air Pathway from Groundwater and Soils (Subsurface Vapor Intrusion Guidance) (USEPA, 2002). Tetra Tech (2004) concluded that all detected soil vapor analyte concentrations were less than the three screening criteria, except for one detection of benzene that slightly exceeded its respective ATSDR MRL but was less than its respective USEPA Soil Gas Screening Level. The report describing this study can be found at http://www.tallevast.info/.
In 2005, Tetra Tech, on behalf of Lockheed Martin, collected nine indoor air samples from the five buildings on the former ABC facility property. Results were reported by Tetra Tech in the Indoor Air Assessment Report (Tetra Tech, 2005b). Samples were collected over an approximately 24-hour period using SUMMA® canisters and were analyzed by USEPA Method TO-15. Tetra Tech concluded that only one site COC (trichloroethene [TCE]) was detected in indoor air. Tetra Tech noted that this detection was below the ATSDR MRL and that TCE was present in the chemicals that were being used in the workplace. The report describing this study can be found at http://www.tallevast.info/.
In August 2004, the FDOH and Manatee CHD collected indoor air samples from four buildings near the facility. Integrated indoor air samples were collected over a 24-hour period in 8-hour increments, and one grab sample was collected in the late afternoon at each location. Samples were collected using SUMMA® canisters and analyzed by USEPA Method TO-15. The ATSDR subsequently reported the results and
109711427 5
Vapor Intrusion Assessment Report
summarized the conclusions of this investigation (ATSDR, 2005). The ATSDR concluded that 25 volatile organic compounds (VOCs) were found in the indoor air in at least one of the four locations; however, VOCs found in the groundwater plume beneath the residences were not among those 25 constituents. Constituents detected in a background location identified outside the site-related plume and in homes overlying the plume were consistent, and these constituents are typical of those found in homes due to the everyday use of chemicals in cleaning products, paints, and petroleum products. The report describing this study can be found at http://www.doh.state.fl.us/ and http://www.tallevast.info/.
2.3 Sampling Rationale
In 2002, the USEPA released Subsurface Vapor Intrusion Guidance (USEPA, 2002) that recommends a tiered approach for evaluating the vapor intrusion pathway and includes a series of questions that guides users through a stepwise evaluation of the subsurface vapor intrusion pathway. The USEPA’s recommended approach for assessment of the vapor intrusion pathway includes the evaluation of multiple lines of evidence, if available.
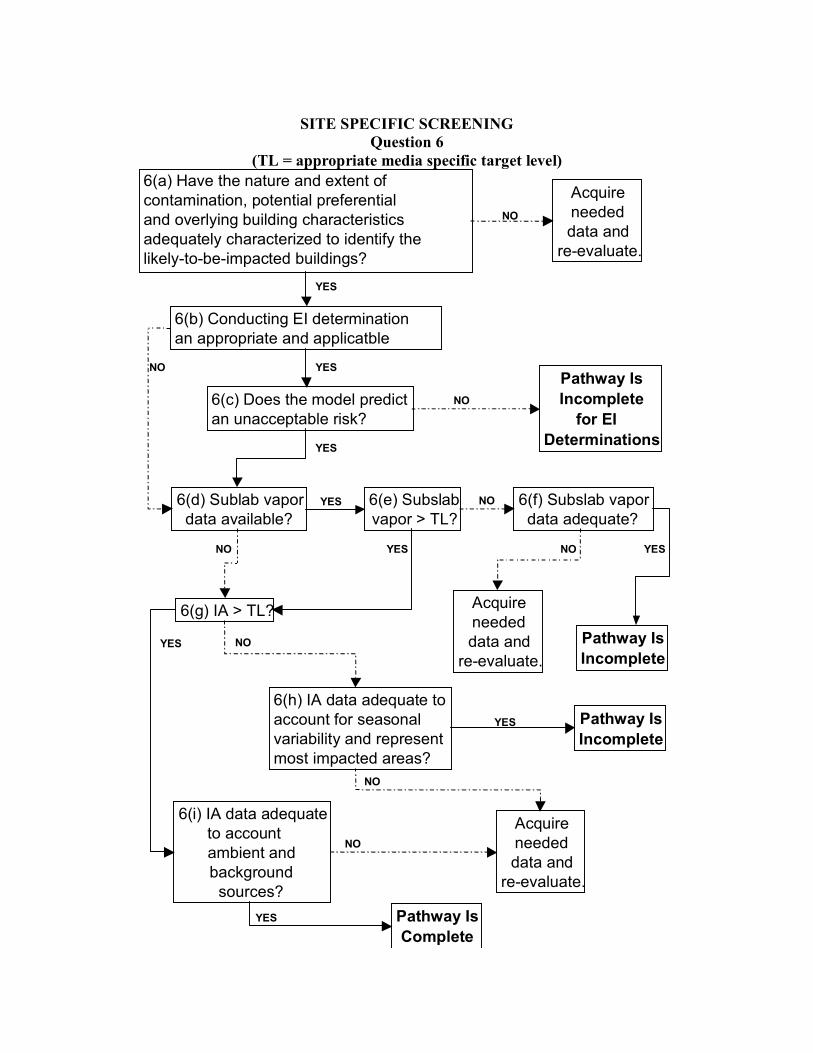
The first tier of the USEPA’s approach to evaluation of the vapor intrusion pathway includes an assessment of COCs for volatility and potential for toxicity. The second tier includes a comparison of analytical data collected in groundwater or soil vapor to conservative screening levels. Target groundwater screening-level concentrations are back-calculated from risk-based target indoor air concentrations and an indoor air to groundwater attenuation factor of 0.001 (USEPA, 2002). If concentrations in groundwater exceed these screening levels, soil vapor samples may also be collected. The analytical data from these soil vapor samples are then compared to conservative soil vapor screening levels. If site conditions or data limitations preclude the use of these screening levels, or if a refined vapor pathway assessment is warranted, a site-specific vapor pathway assessment (Tier 3) may be conducted using the Johnson & Ettinger (J&E) model, additional site-specific data collection, or a combination of the two (USEPA, 2002). Appendix C of the Subsurface Vapor Intrusion Guidance (Appendix A of this report) contains a flow diagram depicting this tiered approach.
Concentrations of TCE, tetrachloroethene (PCE), and cis-1,2-dichloroethene (cis-1,2-DCE) in groundwater samples collected in 2006 from the USAS (as previously reported in SARA 3 [BBL, 2006a]) exceed USEPA Subsurface Vapor Intrusion Guidance (USEPA, 2002) groundwater screening levels. Based on these exceedances, soil vapor samples were collected to refine the vapor intrusion pathway assessment.

109711427 6
Vapor Intrusion Assessment Report
3. Investigation Methodology
Specific elements of the soil vapor investigation that was recently completed by BBL on behalf of Lockheed Martin are summarized below.
Background Information: Background information (e.g., site topography; building construction; location and use of historical and current underground storage tanks, septic systems, sumps, and basement and crawl space location[s]; past chemical usage and spill history at the former ABC facility; description of any localized flooding; historical groundwater data), including information provided by building/property owners, was obtained and compiled.
Pre-sampling Inspection and Surveying: Prior to the start of sampling activities, a field reconnaissance was performed in which BBL personnel inspected the areas proposed for sampling. Sampling locations were targeted based on the distribution of COCs detected in the USAS at concentrations greater than GCTLs. During the pre-sampling inspection, BBL identified and marked each soil vapor sampling location and two ambient air sampling locations (determined in the field) with a wooden stake or other appropriate marker.
Soil Vapor Sampling: Soil vapor samples were collected from a total of 23 temporary sampling points plus two duplicates in June 2006, and six locations were resampled in October 2006 (see Figure 1). One round of soil vapor samples was collected and analyzed for a subset of VOCs using USEPA Method TO-15 (i.e., six analytes representative of the groundwater plume [PCE, TCE, cis-1,2-DCE, 1,1-dichloroethane (1,1-DCA), 1,1-dichloroethene (1,1-DCE), and 1,4-dioxane] in June 2006 and the same analytes in October 2006). Samples were analyzed by an Environmental Laboratory Approval Program-certified laboratory, and all SUMMA® canisters were certified clean. At each sampling point, the soil vapor sample was collected from the interval estimated to be 1 to 2 feet above the water table in the USAS. A helium tracer was used to determine whether ambient air was infiltrating the soil vapor samples. The water-table elevation was estimated using measurements obtained on each day of sampling from nearby upper surficial monitoring wells. Measurements from these wells were converted to elevation in the field and plotted on a scaled base map of the vicinity. Contour lines were interpolated and used to estimate the water-table elevation at each sampling location. Soil vapor sampling depths were determined based on this evaluation on each day of the sampling program for the samples scheduled to be collected on that day. The procedure followed during soil vapor sampling activities is

109711427 7
Vapor Intrusion Assessment Report
presented in Appendix B. Quality assurance/quality control (QA/QC) procedures used during this investigation are presented in Appendix C.
Background (Ambient Air) Sampling: Two ambient air samples from the same location were collected during the June 2006 soil vapor sampling activities, and three ambient air samples were collected from three independent locations during the October 2006 soil vapor sampling activities. The purpose of the ambient air sampling was to document background concentrations of VOCs in ambient air (using USEPA Method TO-15) that may have an impact on soil vapor results and/or vapor intrusion pathways. Pre-sampling inspection, sampling location marking, and a post-sampling survey for the ambient air sampling locations were performed concurrently with the soil vapor sampling activities.
Final Surveying: After sampling was completed, a licensed surveyor surveyed the sample coordinates and ground surface elevations for any sampling points that had to be relocated due to subsurface obstruction or other reasons.

109711427 8
Vapor Intrusion Assessment Report
4. Results
Soil vapor and ambient air samples were collected in June 2006 and October 2006 to evaluate the presence of COCs in the vadose zone (as briefly described in Section 3). Samples were collected in accordance with the following documents:
• Soil Vapor Survey Work Plan (BBL, 2006b) • Soil Vapor Survey Work Plan – Addendum #1 (BBL, 2006c)
This section summarizes the results from these two sampling events.
4.1 Soil Vapor Sampling Results – June 2006
ARCADIS BBL collected a total of 23 soil vapor samples and two ambient air samples on June 2, 2006 and June 5, 2006 (Figure 1). All samples were collected via methodologies presented in the Soil Vapor Survey Work Plan (BBL, 2006b) and analyzed for six site COCs representative of the groundwater plume (PCE, TCE, cis-1,2-DCE, 1,1-DCA, 1,1-DCE, and 1,4-dioxane) using USEPA Method TO-15.
Analytical results indicated no detections of the COCs at 17 of the 23 soil vapor sampling locations. However, detectable concentrations of PCE were identified at five locations (SG-2, SG-6, SG-13, SG-15, and SG-23) at concentrations ranging from 12 micrograms per cubic meter (µg/m3) to 220 µg/m3. In addition, 1,1-DCA was detected at SG-12 at a concentration of 15 µg/m3. Results are summarized in Table 1, and the analytical laboratory report is provided as Appendix D.
4.2 Soil Vapor Sampling Results – October 2006
In October 2006, soil vapor samples were collected at the six locations that exhibited detectable soil vapor concentrations during the June 2006 event. The October 2006 sampling was performed to provide verification of prior sampling results.
A total of nine samples (six soil vapor samples and three ambient air samples) were collected on October 18, 2006 (Figure 2). All samples were collected via methodologies presented in the Soil Vapor Survey Work Plan – Addendum #1 (BBL, 2006b) and analyzed for five COCs previously analyzed for in June 2006 (excluding 1,4-dioxane, due to non-detects during the first round) using USEPA Method TO-15.
In six of the nine samples (four soil vapor and two ambient air sampling locations), all results were below laboratory detection limits. One soil vapor sampling location (SG-

109711427 9
Vapor Intrusion Assessment Report
12RS) exhibited detectable concentrations of TCE and cis-1,2-DCE at 19 µg/m3 and 4.4 µg/m3, respectively. In addition, PCE was detected in one soil vapor sample (SG-23RS) at 15 µg/m3. Results are summarized in Table 1, and the analytical laboratory report is provided as Appendix D. A comparison of the data from the six locations that were sampled during both the June and October 2006 events is summarized in Table 2.
4.3 Ambient Air Results
For the ambient air samples collected during June and October 2006, constituents were non-detect at all locations, except for one ambient air sample collected on June 2, 2006 (AA-6/2/06) and one ambient air sample collected on October 18, 2006 (AA-10/18 Downwind). Analysis of the June 2, 2006 ambient air sample reported concentrations of 3.5 µg/m3 PCE, 9.5 µg/m3 TCE, and 12 µg/m3 cis-1,2-DCE. However, another sample collected on October 18, 2006 at the same location as AA-6/2/06 (AA-10/18 Upwind) was non-detect for these analytes. Analysis of the downwind ambient air sample collected on October 18, 2006 (AA-10/18 Downwind) reported 12 µg/m3 PCE at a location where shallow USAS monitoring wells were non-detect for PCE. Results of the ambient air sampling are summarized in Table 1, and the analytical laboratory report is provided in Appendix D
4.3.1 Helium Tracer
A tracer vapor compound (helium) was used during the soil vapor sampling process to evaluate potential leakage of atmospheric air into the SUMMA® canisters used to collect the soil vapor samples. After the tubing was connected with the SUMMA® canisters and purging was complete, plastic sheeting was placed around the borehole, and helium was added beneath the sheeting near the top of the boring next to the bentonite/clay-sealed sampling point. A field helium detector soil vapor probe was used to evaluate potential seal issues. The data indicated that there was no evidence of outside infiltration. In addition, a photoionization detector (PID) was used to monitor atmospheric background prior to and during sample collection and only one PID reading was noted at one sampling location (see Appendix E).
4.3.2 Barometric Pressure
The influence of barometric pressure on the potential release of soil vapors to ambient air was also evaluated in this investigation. Cyclic changes in atmospheric pressure may cause “barometric pumping,” which creates a “piston-like” force on soil vapor,

109711427 10
Vapor Intrusion Assessment Report
possibly causing a cyclic up and down flow of contaminant vapors in the affected interval. The magnitude of a barometric pressure cycle is typically a small percentage of atmospheric pressure, and its effect decreases with depth. Soil texture, soil air permeability, and moisture content affect the depth to which the pressure change may affect vapor transport. Soil vapor compression and expansion in response to barometric pressure fluctuations may alternately enhance or inhibit vapor intrusion.
The barometric pressure readings were consistent during the sampling events conducted in June and October 2006 (i.e., approximately 29.84 inches on June 2, 2006; 29.95 inches on June 5, 2006; and 29.90 inches on October 18, 2006). In addition, ambient air samples collected in June and October 2006 were non-detect for TCE and PCE, except for the ambient air sample collected on June 2, 2006, which reported 3.5 µg/m3 PCE, 9.5 µg/m3 TCE, and 12 µg/m3 cis-1,2-DCE; and the downwind ambient air sample collected on October 18, 2006, which reported 12 µg/m3 PCE. No COCs were detected in soil vapor near an ambient air detection, except for PCE in SG-13. In addition, as noted above, another sample, collected on October 18, 2006 at the same location as the June 2, 2006 sample, was non-detect for these constituents. Thus, these detections are unlikely to be related to potential effects of barometric pumping on subsurface soil vapor.

109711427 11
Vapor Intrusion Assessment Report
5. Data Evaluation
This section presents a comprehensive evaluation of potential soil vapor intrusion associated with the site. This includes a discussion of whether there are exposure pathways present that may represent a risk to human health. This section presents a multi-tiered evaluation of the vapor intrusion pathway once the potential for such a pathway has been established. For the sake of providing a comprehensive evaluation, this discussion considers previous data in combination with new data.
5.1 Exposure Pathway
The first step in evaluating the potential for soil vapor intrusion is establishing whether a current or potential exposure pathway exists. This step required an examination of the shallow hydrogeology to determine whether VOCs were present in the shallow groundwater, where VOCs would potentially be capable of migrating into soil vapors. In addition, COCs detected during previous soil vapor investigations (described in Section 2.2) were compared with groundwater COCs identified during the site characterization process. The results are described in Section 5.1.2.
5.1.1 Shallow Hydrogeology
A key feature of the site hydrogeology is the presence of two distinct confining layers that limit the migration of constituents from the deeper water-bearing zones to the shallow groundwater. These two confining layers include a “hard streak” and the Venice Clay, as described further below.
Groundwater in the site area occurs in three previously defined hydrostratigraphic units: the Surficial Aquifer System (SAS), the Intermediate Aquifer System (IAS), and the Floridan Aquifer System (FAS). The SAS is subdivided into the USAS and Lower Surficial Aquifer System (LSAS). The USAS is located approximately 2 to 30 feet bgs and is unconfined. The LSAS is located approximately 35 to 45 feet bgs and is separated from the USAS by the hard streak, which was encountered at approximately 20 to 35 feet bgs. The hard streak is conceptualized as a nearly continuous layer throughout the area of investigation, with a depth that generally increases from north to south (ranging from 21 feet bgs in the northern portion of the area of investigation to 47.5 feet bgs in the southern portion). A downward hydraulic gradient has been measured across the hard streak, and groundwater in the LSAS is under confined conditions, indicating that the hard streak can restrict groundwater flow from the USAS to the LSAS. Based on a review of historical and current groundwater monitoring

109711427 12
Vapor Intrusion Assessment Report
results, the USAS is the appropriate hydrostratigraphic unit to reference with respect to shallow soil vapor.
The water table is first encountered in the USAS and may be as shallow as 2 feet bgs. Horizontal hydraulic gradients in the USAS have historically been toward the north, east, west, and south in a radial pattern. This radial flow pattern is the result of a combination of site-specific geologic and hydrologic characteristics, as well as historical and current groundwater extraction activities in the area. As described in SARA 3 (BBL, 2006a), the USAS has been shown to contain site-related COCs at concentrations greater than GCTLs. Thus, it is reasonable to conclude that the COCs in the USAS represent a potential source for a soil vapor intrusion pathway.
The SAS and IAS are separated by a 40- to 50-foot-thick clay layer known as the Venice Clay, which is the uppermost stratigraphic unit of the Peace River Formation at the site. A downward hydraulic gradient has been measured across the Venice Clay, indicating that it can restrict groundwater flow from the LSAS to the IAS. The Venice Clay is conceptualized as a continuous layer throughout the site. Given the depth and structure associated with the IAS and deeper units, these features are not considered to be a potential source of soil vapor.
5.1.2 Comparative COC Evaluation
For an exposure pathway to be complete, COCs must be detected in adjacent media (e.g., groundwater and soil vapor; soil vapor and indoor air). If this is not the case, the exposure pathway is likely incomplete. Three separate comparisons are presented below.
As reported in the SARA (Tetra Tech, 2004), Tetra Tech collected five pairs of co-located samples (one groundwater sample and one soil vapor sample from the same location) to help assess the potential for vapor intrusion. During this sampling event, no analytes were detected in both the soil vapor and the groundwater (see Section 3.7.3.2 of the SARA and Section 2.2 of this report).
In August 2004, the Manatee CHD and the FDOH conducted indoor air sampling at four locations in the vicinity of the facility. These four locations are above groundwater known to be impacted by site COCs. The ATSDR issued a report on the results of this sampling (ATSDR, 2005). Analytes detected in the indoor air at these locations did not correspond to the site COCs. These results are also discussed in Section 2.2 of this report.

109711427 13
Vapor Intrusion Assessment Report
Soil vapor and ambient air sampling was completed in June and October 2006 at multiple site locations. The soil vapor sampling locations were above groundwater known to be impacted by site COCs. Results of the sampling indicated that 17 of 23 soil vapor locations from the June sampling and four of the six soil vapor locations from the October sampling did not contain site COCs. The detection levels for the non-detect samples were below the USEPA shallow soil gas screening values in Table 2c of the Subsurface Vapor Intrusion Guidance Document (USEPA, 2002), except for TCE, which was detected at levels below the soil gas screening value in Table 3c-SG (see Section 5.2). Detections of site COCs, including PCE, 1,1-DCA, TCE, and cis-1,2-DCE, were noted in eight of the 29 soil vapor samples. Detections of site COCs, including PCE, TCE, and cis-1,2-DCE, were noted in two of five ambient air samples. These results are also discussed in Sections 4.1 and 4.2.
The results of these three investigations indicate that site COCs in groundwater are not typically detected in soil vapor or indoor air. However, recent (2006) soil vapor data indicated that the vapor intrusion pathway could, potentially, be complete at times. Therefore, further evaluation of the potential significance of this pathway was conducted.
5.2 Multiple Lines of Evidence Evaluation
Once the potential for a vapor intrusion pathway via the USAS was established, it was appropriate to evaluate whether physical and/or chemical processes completed this pathway and, if so, to evaluate the potential risk to human health. This section presents a discussion of multiple lines of evidence used in this evaluation. This evaluation is consistent with the USEPA’s recommended approach for assessment of the vapor intrusion pathway, as described in Section 2.3. This tiered approach includes the following:
• Tier 1 – Screening – Assessment of the chemical and physical properties of the COCs for volatility and toxicity potential.
• Tier 2 – Site-Specific Data Evaluation – A comparison of analytical data collected in groundwater or soil vapor to conservative screening levels. Target groundwater screening-level concentrations are back-calculated from risk-based target indoor air concentrations and an indoor air to groundwater attenuation factor of 0.001 (USEPA, 2002). If concentrations in groundwater exceed these screening levels, soil vapor samples may also be collected. The

109711427 14
Vapor Intrusion Assessment Report
analytical data from these soil vapor samples are then compared to conservative soil gas screening levels.
• Tier 3 – Detailed Vapor Intrusion Pathway Assessment – If site conditions or data limitations preclude the use of these screening levels, or if a refined vapor pathway assessment is warranted, a site-specific vapor pathway assessment (Tier 3) may be conducted using the Johnson & Ettinger (J&E) model, additional site-specific data collection, or a combination of the two (USEPA, 2002).
Appendix C of the Subsurface Vapor Intrusion Guidance (Appendix A of this report) contains a flow diagram depicting this tiered approach.
5.2.1 Site-Specific Data Evaluation
Question 4(g) of the USEPA (2002) Subsurface Vapor Intrusion Guidance asks, “Do measured or reasonably estimated soil gas concentrations exceed generic target media-specific concentrations given in Tables 2(a), 2(b) or 2(c)?” The decision-making process used to answer this question is illustrated in Appendix C of the guidance document and is reproduced in Appendix A of this report. The following table presents a comparison of the screening levels in Table 2(c) of the guidance document to the maximum detected concentrations in shallow soil vapor.
Compound
Table 2c Screening
Level (µg/m3)
June 2006 Maximum Detected
Concentration (µg/m3)
October 2006 Maximum Detected Concentration
(µg/m3) PCE 8.1 220 (SG-2) 15 (SG-23RS) TCE 0.22 < 4 (Not Detected) 19 (SG-12RS)
cis-1,2-DCE 350 <4 (Not Detected) 4.4 (SG-12RS) 1,1-DCA 5,000 15 (SG-12) < 4 (Not Detected)
The screening levels presented above include an attenuation factor of 0.1 and an incremental risk of 1x10⁻⁶. Concentrations detected in samples collected in June 2006 from locations SG-2, SG-6, SG-13, SG-15, and SG-23 exceeded the PCE criterion (see Section 4.2.3.1.1). In October 2006, concentrations detected in SG-23RS exceeded the PCE criterion, and concentrations detected in SG-12RS exceeded the TCE criterion (see Section 4.2.3.1.2).

109711427 15
Vapor Intrusion Assessment Report
If samples exceed screening criteria, the user may evaluate the results using scenario-specific attenuation factors under Question 5 of the USEPA guidance document; however, the USEPA notes that groundwater or soil vapor samples collected at depths less than 5 feet below building foundations should not be evaluated using this method. The June and October 2006 samples were collected at depths typically ranging between 3 and 3.5 feet due to the location of the water table; however, homes near the site are built slab on grade, and foundations do not interface directly with groundwater. Therefore, it was deemed acceptable to compare detected concentrations to the more refined screening levels found in Table 3c-SG (Question 5 the USEPA [2002] guidance document). The vapor attenuation factor (α) was selected from Figure 3a based on soil type and depth to contamination and was determined to be 2x10⁻³. The following table presents a comparison of the screening levels in Table 3(c) of the guidance document to the maximum detected concentrations in shallow soil vapor.
Compound
Table 3c Screening
Level (µg/m3)
June 2006 Maximum Detected
Concentration (µg/m3)
October 2006 Maximum Detected
Concentration (µg/m3) PCE 410 220 (SG-2) 15 (SG-23RS) TCE 11 < 4 (Not Detected) 19 (SG-12RS)
cis-1,2-DCE 18,000 < 4 (Not Detected) 4.4 (SG-12RS) 1,1-DCA 250,000 15 (SG-12) < 4 (Not Detected)
All detected results for the June and October 2006 sampling events were below their respective criteria, except sample SG-12RS, which had a detection of TCE at 19 µg/m3. Based on these results, a site-specific vapor risk assessment was conducted, as described below.
5.2.2 Detailed Vapor Intrusion Pathway Assessment
A site-specific vapor intrusion pathway assessment was conducted using the USEPA J&E model for soil gas based upon a conservative residential exposure scenario. This model assumes that there is a complete exposure pathway (i.e., vapors can migrate from sub-slab soils to indoor air). The exposure point concentrations used in the site-specific vapor assessment to predict indoor air concentrations were based on the average concentration of the June and October 2006 samples, using the full detection limit for non-detected analytes. All modeled indoor air concentrations resulted in predicted incremental risk below 1x10⁻⁶ and non-carcinogenic hazard indices of less than one.

109711427 16
Vapor Intrusion Assessment Report
The assumptions used in the J&E model were based on the depth of soil vapor samples, sandy geology, and other default USEPA assumptions. The estimation of indoor air concentration was completed using the J&E model default parameters indicated below:
• Soil vapor sampling depth below grade = 80 centimeters (3 feet) • Total Porosity = 0.385
• Bulk Density = 1.63 grams per cubic centimeter (g cm-3 )
• Water-filled Porosity = 0.197
Cancer risk calculations for the resulting exposure point concentration were performed within the USEPA J&E model using equations from the USEPA Risk Assessment Guidance for Superfund (RAGS) (USEPA 1989):
• Unit Risk Factors for TCE and PCE = 1.1x10⁻⁴ and 5.9x10⁻⁶ (µg/m3)-1
• Body Weight = 70 kilograms
• Averaging Time = 25,550 days (70 years for carcinogens); 10,950 days (30 years for non-carcinogens)
• Exposure Duration = 30 years (residential; most conservative)
• Inhalation Rate = 20 cubic meters per day
The output from the J&E model is provided in Appendix F. These results indicate that it is unlikely that the COCs dissolved in groundwater beneath the businesses and residential properties in the vicinity of the former ABC facility lead to elevated risk from exposure to indoor air.
5.3 Ambient Air
This section discusses the results of ambient air sampling and analysis as they relate to the vapor intrusion assessment. Analysis of outdoor ambient air provides an indication of contaminant levels in the atmosphere that may be present due to human activities unrelated to the presence of COCs in the subsurface. Emissions from

109711427 17
Vapor Intrusion Assessment Report
everyday activities, such as those from automobiles, commercial properties, or industrial activities, are regularly present in the ambient air.
As summarized in Section 4.3, ambient air samples were collected during the June 2006 and October 2006 investigations. TCE, PCE, and cis-1,2-DCE were detected in ambient air samples during these events. TCE, PCE, and cis-1,2-DCE detected in ambient air on June 2, 2006 were not detected in ambient air on June 5, 2006. Additionally, there were no detections of TCE or cis-1,2-DCE in the soil vapor during the June events. During the October 18, 2006 sampling event, PCE was the only compound detected in one of three ambient air samples collected. There were no detections of PCE in the soil vapor sample (SG-6RS) nearest this ambient air location. This indicates that, although these COCs can periodically be found in background ambient air, the location and magnitude of the detections are not consistent across sampling events and do not seem to be co-located with detections in soil vapor.
Pinellas and Hillsborough counties conduct a regional toxic air pollutant monitoring program at various monitoring stations. This sampling is part of the USEPA National Air Toxics Trend Sites monitoring program that provides information regarding compound concentrations in different parts of the country. A summary of VOC data detected in Pinellas County in 2000 is provided in Appendix G. These data indicate that chlorinated compounds such as TCE and PCE are found in background ambient air in other parts of Florida.
The intermittent detection of COCs in ambient air during the site investigation and the detection of similar COCs in regional background ambient air samples collected by the Pinellas County Department of Environmental Management (DEM) indicates that background concentrations of VOCs in ambient air may be attributable to local, ubiquitous sources, such as dry cleaners, automobile repair and paint shops, furniture stripping/painting/varnishing operations, and other light industrial and/or commercial operations. Although cis-1,2-DCE, which is not as frequently associated with ubiquitous sources as TCE or PCE, was detected in the ambient air sample collected during the June 2, 2006 event, it was not detected in the ambient air during the June 5, 2006 or October 18, 2006 events. Additionally, there were no detections of cis-1,2-DCE in the soil vapor samples collected during the June 2 or June 5 event, indicating that the presence of cis-1,2-DCE in ambient air is not likely the result of barometric pumping. These data indicate that the ambient air detections of TCE, PCE, and cis-1,2-DCE are infrequent, sporadic in nature, and are likely not due to site COCs.

109711427 18
Vapor Intrusion Assessment Report
6. Conclusions and Recommendations
The multiple lines of evidence described in Section 5 demonstrate that subsurface vapor intrusion does not pose an elevated risk to human health in the vicinity of the former ABC facility.
The multiple lines of evidence supporting this conclusion are summarized below:
• The hydrology of the site indicates that only COCs in the USAS could potentially be available for vapor migration. Previous investigation results for co-located groundwater and soil vapor samples indicated no correlation between analytes detected in groundwater and analytes detected in soil vapor. In the most recent sampling (October 2006), only two compounds at one location (TCE and cis-1,2-DCE at SG-12RS) and one compound at another location (PCE at SG-23RS) were detected in both the groundwater and soil vapor. These results indicate that COCs in groundwater are not typically present in soil vapor.
• In the 2004 soil vapor sampling results, there were no exceedances of three different sets of screening levels (OSHA PELs, ATSDR MRLs, and USEPA soil gas screening levels), except for benzene, which was reported at concentrations greater than the ATSDR MRL at one location. Benzene is not a site-related COC.
• Indoor air sampling conducted by the FDOH and the Manatee CHD in August 2004 did not detect any of the site COCs in indoor air samples.
• Indoor air sampling conducted by Tetra Tech on behalf of Lockheed Martin in 2005 did not detect any of the site COCs in indoor air samples at concentrations greater than ATSDR MRLs.
• The soil vapor sampling conducted in June 2006 detected no site COCs in 17 of the 23 locations sampled. Confirmation sampling of the other six locations in October 2006 detected a concentration of TCE in SG-12RS that was slightly greater than the USEPA’s TCE refined screening level. Further evaluation of this detection using the J&E model predicted an incremental risk of less than 1x10⁻⁶ from this detection. Levels of COCs in the other five resampled locations were below the applicable USEPA screening levels.

109711427 19
Vapor Intrusion Assessment Report
• Ambient air sampling results indicate that background PCE, TCE, and cis-1,2-DCE concentrations may be present on an infrequent basis. However, detections of these compounds are not consistent from event to event and do not appear to be co-located with COC detections in soil vapor, indicating that it is unlikely that their presence is related to site conditions.
In combination, these multiple lines of evidence support elimination of the vapor intrusion pathway from further consideration.

109711427 20
Vapor Intrusion Assessment Report
7. References
Agency for Toxic Substances and Disease Registry. 2005. Health Consultation, Exposure Investigation Report, Indoor Air Testing.
Blasland, Bouck & Lee, Inc. 2006a. Site Assessment Report Addendum 3.
Blasland, Bouck & Lee, Inc. 2006b. Soil Vapor Survey Work Plan.
Blasland, Bouck & Lee, Inc. 2006c. Soil Vapor Survey Work Plan – Addendum #1.
Tetra Tech, Inc. 2004. Site Assessment Report Addendum.
Tetra Tech, Inc. 2005a. Site Assessment Report Addendum 2.
Tetra Tech, Inc., 2005b. Vapor Intrusion Sampling Report.
United States Environmental Protection Agency. 1989. Risk Assessment Guidance for Superfund (RAGS).
United States Environmental Protection Agency. 2002. OSWER Draft Guidance for Evaluating the Vapor Intrusion to Indoor Air Pathway from Groundwater and Soils.
United States Environmental Protection Agency. 2004. Standard Operating Procedures for Installation of Sub-Slab Vapor Probes and Sampling Using EPA Method TO-15 to Support Vapor Intrusion Investigations.

Tables

TABLE 1SOIL-VAPOR ANALYTICAL RESULTS
JUNE 2006VAPOR INTRUSION ASSESSMENT REPORT
ABC COMPANY - TALLEVAST, FLORIDA(Results presented in µg/m3)
Sample ID: AA-6/2/06 AA-6/5/06 FB-6/6/06 SG-1 SG-2 SG-3 SG-4 SG-5 SG-6 SG-7Date Collected: 06/02/06 06/05/06 06/06/06 06/05/06 06/05/06 06/05/06 06/05/06 06/05/06 06/05/06 06/05/06
Tetrachloroethene 3.5 <1.4 <1.4 <6.8 220 <6.8 <6.8 <6.8 12 <6.8Trichloroethene 9.5 <1.1 <1.1 <5.4 <5.4 <5.4 <5.4 <5.4 <5.4 <5.41,1-Dichloroethane <0.81 <0.81 <0.81 <4 <4 <4 <4 <4 <4 <41,1-Dichloroethene <0.79 <0.79 <0.79 <4 <4 <4 <4 <4 <4 <4cis-1,2-Dichloroethene 12 <0.79 <0.79 <4 <4 <4 <4 <4 <4 <41,4-Dioxane NP NP NP NP NP NP NP NP NP NP
Sample ID: SG-8 SG-9 SG-9D SG-10 SG-11 SG-12 SG-13 SG-14 SG-15 SG-17Date Collected: 06/05/06 06/05/06 06/05/06 06/05/06 06/02/06 06/02/06 06/02/06 06/02/06 06/05/06 06/05/06
Tetrachloroethene <6.8 <6.8 <6.8 <6.8 <6.8 <6.8 32 <6.8 89 <6.8Trichloroethene <5.4 <5.4 <5.4 <5.4 <5.4 <5.4 <5.4 <5.4 <5.4 <5.41,1-Dichloroethane <4 <4 <4 <4 <4 15 <4 <4 <4 <41,1-Dichloroethene <4 <4 <4 <4 <4 <4 <4 <4 <4 <4cis-1,2-Dichloroethene <4 <4 <4 <4 <4 <4 <4 <4 <4 <41,4-Dioxane NP NP NP NP NP NP NP NP NP NP
Sample ID: SG-18 SG-18D SG-20 SG-21 SG-22 SG-23 SG-24 SG-25Date Collected: 06/05/06 06/05/06 06/05/06 06/05/06 06/05/06 06/05/06 06/05/06 06/05/06
Tetrachloroethene <6.8 <6.8 <6.8 <6.8 <6.8 30 <6.8 <6.8Trichloroethene <5.4 <5.4 <5.4 <5.4 <5.4 <5.4 <5.4 <5.41,1-Dichloroethane <4 <4 <4 <4 <4 <4 <4 <41,1-Dichloroethene <4 <4 <4 <4 <4 <4 <4 <4cis-1,2-Dichloroethene <4 <4 <4 <4 <4 <4 <4 <41,4-Dioxane NP NP NP NP NP NP NP NP
Notes:µg/m3 - micrograms per cubic meterAA - Ambient Air SamplesNP - Not Present in Tentatively Identified Compound SearchFB - Field BlankSG-9D and SG-18D are duplicate samples of SG-9 and SG-18, respectively. ND - Not Detected1.4 Dioxane not included within current volatile and toxic chemical listing and therefore no risk factors exist (Draft Guidance For Evaluating the Vapor Intrusion to Indoor Air Pathway From Groundwater and Soils - EPA, 2002)

TABLE 1SOIL-VAPOR ANALYTICAL RESULTS
OCTOBER 2006VAPOR INTRUSION ASSESSMENT REPORT
ABC COMPANY - TALLEVAST, FLORIDA(Results presented in µg/m3)
Sample ID: AA-10/18 Upwind AA-10/18 Mid AA-10/18 Downwind SG-2RS SG-6RS SG-12RS SG-13RS SG-15RS SG-23RS
Tetrachloroethene <1.4 <1.4 12 <6.8 <6.8 <6.8 <6.8 <6.8 15Trichloroethene <1.1 <1.1 <1.1 <5.4 <5.4 19 <5.4 <5.4 <5.41,1-Dichloroethane <0.81 <0.81 <0.81 <4 <4 <4 <4 <4 <41,1-Dichloroethene <0.79 <0.79 <0.79 <4 <4 <4 <4 <4 <4cis-1,2-Dichloroethene <0.79 <0.79 <0.79 <4 <4 4.4 <4 <4 <4
Notes:µg/m3 - micrograms per cubic meterAA - Ambient Air SamplesFB - Field Blank< - Below laboratory detection limit (laboratory detection limit shown). Samples collected on October 18, 2006
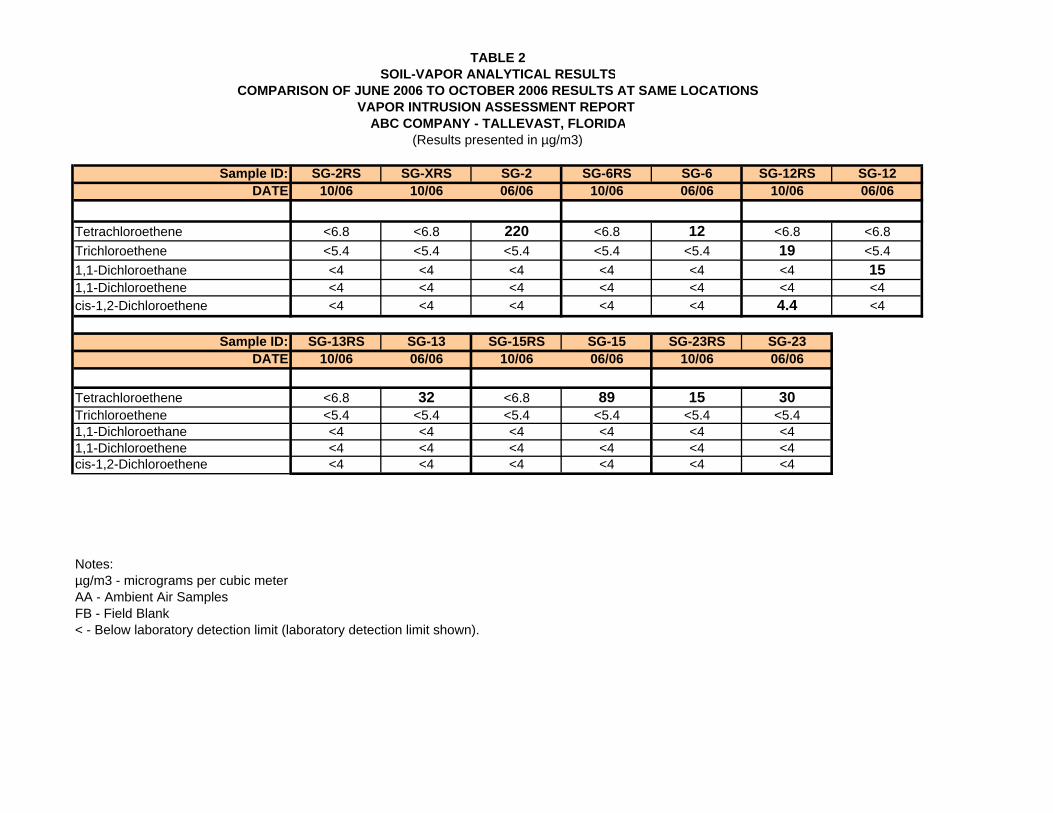
TABLE 2SOIL-VAPOR ANALYTICAL RESULTS
COMPARISON OF JUNE 2006 TO OCTOBER 2006 RESULTS AT SAME LOCATIONSVAPOR INTRUSION ASSESSMENT REPORT
ABC COMPANY - TALLEVAST, FLORIDA(Results presented in µg/m3)
Sample ID: SG-2RS SG-XRS SG-2 SG-6RS SG-6 SG-12RS SG-12DATE 10/06 10/06 06/06 10/06 06/06 10/06 06/06
Tetrachloroethene <6.8 <6.8 220 <6.8 12 <6.8 <6.8Trichloroethene <5.4 <5.4 <5.4 <5.4 <5.4 19 <5.41,1-Dichloroethane <4 <4 <4 <4 <4 <4 151,1-Dichloroethene <4 <4 <4 <4 <4 <4 <4cis-1,2-Dichloroethene <4 <4 <4 <4 <4 4.4 <4
Sample ID: SG-13RS SG-13 SG-15RS SG-15 SG-23RS SG-23DATE 10/06 06/06 10/06 06/06 10/06 06/06
Tetrachloroethene <6.8 32 <6.8 89 15 30Trichloroethene <5.4 <5.4 <5.4 <5.4 <5.4 <5.41,1-Dichloroethane <4 <4 <4 <4 <4 <41,1-Dichloroethene <4 <4 <4 <4 <4 <4cis-1,2-Dichloroethene <4 <4 <4 <4 <4 <4
Notes:µg/m3 - micrograms per cubic meterAA - Ambient Air SamplesFB - Field Blank< - Below laboratory detection limit (laboratory detection limit shown).

Figures

SOIL VAPOR AND AMBIENT AIR SAMPLING LOCATIONS JUNE 2006
FORMER AMERICAN BERYLLIUM COMPANYTALLEVAST, FLORIDA
VAPOR INTRUSION ASSESSMENT REPORT
1

SOIL VAPOR AND AMBIENT AIR SAMPLING LOCATIONS OCTOBER 2006
FORMER AMERICAN BERYLLIUM COMPANYTALLEVAST, FLORIDA
VAPOR INTRUSION ASSESSMENT REPORT
2

Appendix A
USEPA Subsurface Vapor Intrusion Guidance, Appendix C

APPENDIX C
DETAILED FLOW DIAGRAMS OF THE EVALUATION APPROACH
USED IN THE GUIDANCE

PRIMARY SCREENING
1. Are chemicals of sufficient
volatility and toxicity present?
3. Does evidence suggest
immediate action may be
warranted?
2. Are currently (or potentially)
inhabited buildings or areas of
concern under future
development scenarios located
near subsurface
contaminants of potential
concern identified in Q1?
Pathway Is
Incomplete
Pathway Is
Incomplete
Proceed with
Appropriate
Action
Proceed to
Secondary
Screening
YES
NO
NO
YES
YES
NO

SECONDARY SCREENING
Question 4 – Generic Screening
(TL = appropriate media specific target level)
4(c) Does contamination
(source of vapors) occur in
unsaturated zone soil at any
depth above the water table?
4(d) GW > TL? 4(e) Groundwater
characterization
adequate?
4(f) Precluding
factors present?
4(g) SG > TL?
Proceed to Q6
Site Specific
Assessment
Acquire
needed
data and
re-evaluate.
4(h) Soil gas data
adequate?
Acquire
needed
data and
re-evaluate.
Proceed to Q6
Site Specific
Assessment
4(i) Precluding
factors present?
Soil Gas Assessement
Indicates Pathway Incomplete
Proceed
to Q5
Groundwater Assessment
Indicates Pathway Incomplete
YES
NO
NO
NO
NO
NO
YES
YES
YES
YES YES
YES
NO
NO
4(b) IA > TL?
4(a) Indoor air
data available? Proceed to Q6
Site Specific
AssessmentNO NO
YES
YES
IA data
adequate?
Pathway Is
Incomplete
YES
NO
Recommended
If soil gas data are
available proceed
to 4(g), otherwise
proceed to Q5.
Recommended
Recommended.
Check GW data

SECONDARY SCREENING
Question 5 – Semi-Site Specific Screening
(TL = appropriate media specific target level)
5(c) Depth to water
and soil type data
adequate?
5(d) Does contamination
(source of vapors)
occur in the unsaturated
zone at any depth
above the water table?
5(e) GW > TL?
5(b) Precluding
factors
present?
5(f) SG > TL?
Proceed to Q6
Site Specific
Assessment
Acquire needed
data and re-evaluate.
Proceed to Q6
Site Specific Assessment
YES
NO
NO
NO
YES
YES
YES
NO
YES
Groundwater Assessment
Indicates Pathway Incomplete
Soil Gas Assessement
Indicates Pathway Incomplete
NO
Recommended
If soil gas data are
available proceed
to 5(f), otherwise
proceed to Q6
Recommended
5(a) For any COPC,
are GW or SG
concentrations
> 50x TL?
Proceed to Q6
Site Specific
Assessment
YES
NO
Recommended.
Check GW data
SITE SPECIFIC SCREENING
Question 6
(TL = appropriate media specific target level)
6(d) Sublab vapor
data available?
6(e) Subslab
vapor > TL?
6(f) Subslab vapor
data adequate?
6(g) IA > TL?
6(i) IA data adequate
to account
ambient and
background
sources?
6(h) IA data adequate to
account for seasonal
variability and represent
most impacted areas?
Pathway Is
Incomplete
Pathway Is
Complete
Pathway Is
Incomplete
Acquire
needed
data and
re-evaluate.
Acquire
needed
data and
re-evaluate.
NO
YES
NO
NO
NO
NO
YES
YES
YES
YES
YES
NO
6(a) Have the nature and extent of
contamination, potential preferential
and overlying building characteristics
adequately characterized to identify the
likely-to-be-impacted buildings?
YES
Acquire
needed
data and
re-evaluate.
NO
6(b) Conducting EI determination
an appropriate and applicatble
6(c) Does the model predict
an unacceptable risk?
YES
YES
NO
Pathway Is
Incomplete
for EI
Determinations
NO
Appendix B
Standard Operating Procedure: Soil-Gas Sampling Using USEPA Method TO-15

c:\documents and settings\gmw\my documents\lockheed\vi report\037711063.doc 1
Appendix B – Standard Operating Procedure: Soil Vapor Sampling Using USEPA Method TO-15
B.1 SCOPE AND APPLICATION
This Standard Operating Procedure (SOP) describes the procedures to collect soil vapor samples for the analysis of volatile organic compounds (VOCs) by United States Environmental Protection Agency (USEPA) Method TO-15 (TO-15). The TO-15 method uses a 6-liter SUMMA® passivated stainless-steel canister. An evacuated 6-liter SUMMA® canister (<28 inches of mercury [Hg]) will provide a recoverable whole-gas sample of approximately 5.5 liters when allowed to fill to a vacuum of 2 inches of Hg. The whole-air sample will be analyzed for VOCs using a quadrupole or ion-trap gas chromatograph/mass spectrometer (GC/MS) system to provide compound detection limits of 0.5 parts per billion volume (ppbv).
The following sections list the necessary equipment and provide detailed instructions for the installation of soil vapor probes and the collection of soil vapor samples for VOC analysis during the offsite soil vapor investigation performed by Lockheed Martin Corporation at the former American Beryllium Company facility (facility) in Tallevast, Florida.
B.2 PERSONNEL QUALIFICATIONS
Field sampling personnel will have current health and safety training.
B.3 EQUIPMENT LIST
Temporary Soil Vapor Probe
The equipment required to install a temporary soil vapor probe is presented below:
• hand auger with a 1- or 2-inch bucket
• preassembled soil vapor probe (Geoprobe® or similar)
• photoionization detector (with a lamp of 11.7 electron volts [eV])
• ¼-inch tubing (Teflon®, polyethylene, or similar)
• clean sand (or similar fill)
• bentonite

c:\documents and settings\gmw\my documents\lockheed\vi report\037711063.doc 2
Appendix B – Standard Operating Procedure: Soil Vapor Sampling Using USEPA Method TO-15
• air tight seal
• wooden stake
Soil Vapor Collection
The equipment required for soil vapor sample collection is presented below:
• 6-liter, stainless-steel SUMMA® canisters (at least two extra canisters will be available during sampling)
• flow controllers with in-line particulate filters and vacuum gauges. Flow controllers are pre-calibrated to specified sample duration (e.g., 60 minutes) or flow rate (e.g., 100 milliliters per minute [mL/min]). Confirm with lab that the flow controller comes with in-line particulate filter and pressure gauge (order at least one extra, if feasible)
• ¼-inch tubing (Teflon®, polyethylene, or similar)
• stainless steel “T” fitting (for connection to SUMMA® canisters and Teflon® tubing to collect duplicate samples)
• portable vacuum pump (or syringe) capable of producing very low flow rates (e.g., 100 mL/min)
• flow meter
• helium gas canister
• field helium detector
• plastic sheeting
• PID (with a lamp of 11.7 eV)
• 9/16-inch open-end wrench
• field camera

c:\documents and settings\gmw\my documents\lockheed\vi report\037711063.doc 3
Appendix B – Standard Operating Procedure: Soil Vapor Sampling Using USEPA Method TO-15
• chain-of-custody forms
• soil vapor sample collection log (a blank log is attached)
• field notebook
B.4 SAMPLING CARE
Care will be used during all aspects of sample collection to minimize sampling error and obtain high-quality data. For example, care will be used to properly seal around the soil vapor probe at the ground surface to prevent leakage of atmospheric air into the probe during purging and sampling. In addition, the sampling team will avoid actions (e.g., fueling vehicles, using permanent marking pens, and wearing freshly dry-cleaned clothing or personal fragrances) that could potentially cause sample interference in the field.
B.5 HEALTH AND SAFETY CONSIDERATIONS
Field sampling personnel will follow and adhere to all procedures and requirements as outlined in the project-specific Health and Safety Plan.
B.6 PROCEDURES
Temporary Soil Vapor Probe Installation
1. Measure nearby upper surficial aquifer monitoring wells and calculate current water elevation. Advance a hand auger with a 1- or 2-inch diameter to 1.5 to 2 feet above the local water elevation.
2. Attach tubing to pre-assembled soil vapor probe, lower into borehole, and hold probe upright until sand pack is added.
3. Fill annular space between the pre-assembled soil vapor probe with clean sand to approximately 1 foot above the vapor probe. Fill remaining borehole with bentonite.
4. Allow at least 30 minutes for bentonite mixture to hydrate and proceed to soil vapor sample collection.
c:\documents and settings\gmw\my documents\lockheed\vi report\037711063.doc 4
Appendix B – Standard Operating Procedure: Soil Vapor Sampling Using USEPA Method TO-15
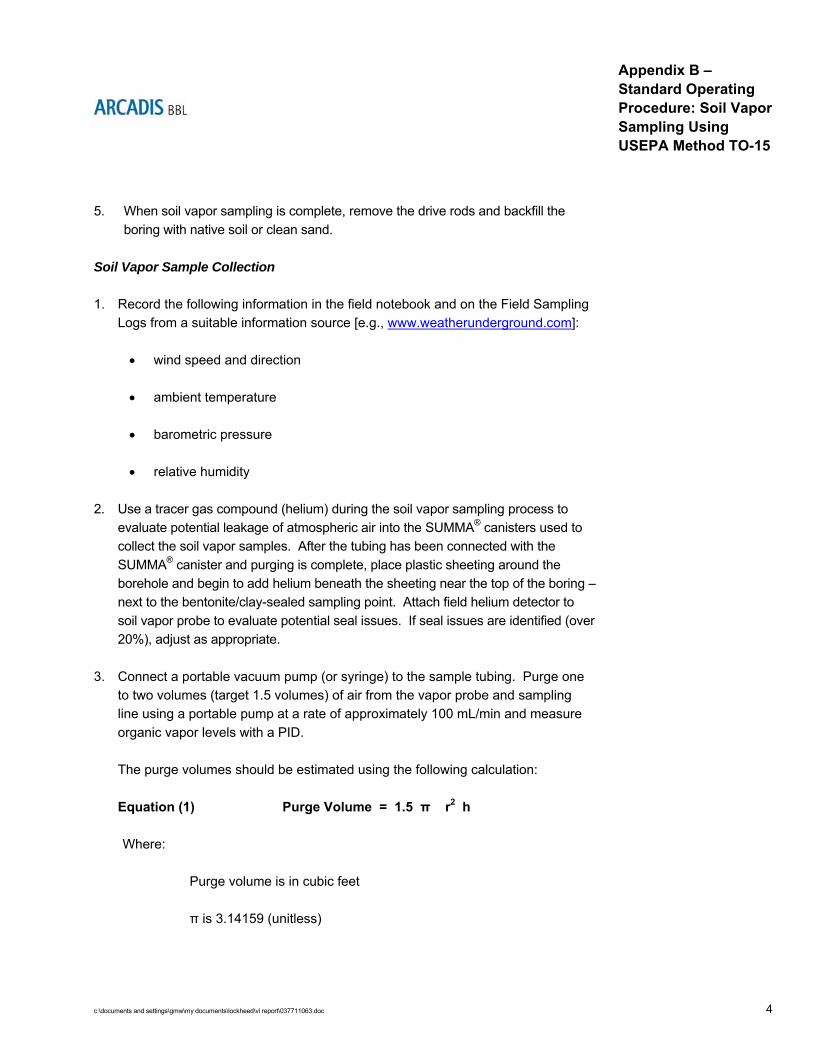
5. When soil vapor sampling is complete, remove the drive rods and backfill the boring with native soil or clean sand.
Soil Vapor Sample Collection
1. Record the following information in the field notebook and on the Field Sampling Logs from a suitable information source [e.g., www.weatherunderground.com]:
• wind speed and direction
• ambient temperature
• barometric pressure
• relative humidity
2. Use a tracer gas compound (helium) during the soil vapor sampling process to evaluate potential leakage of atmospheric air into the SUMMA® canisters used to collect the soil vapor samples. After the tubing has been connected with the SUMMA® canister and purging is complete, place plastic sheeting around the borehole and begin to add helium beneath the sheeting near the top of the boring – next to the bentonite/clay-sealed sampling point. Attach field helium detector to soil vapor probe to evaluate potential seal issues. If seal issues are identified (over 20%), adjust as appropriate.
3. Connect a portable vacuum pump (or syringe) to the sample tubing. Purge one to two volumes (target 1.5 volumes) of air from the vapor probe and sampling line using a portable pump at a rate of approximately 100 mL/min and measure organic vapor levels with a PID.
The purge volumes should be estimated using the following calculation:
Equation (1) Purge Volume = 1.5 π r2 h
Where:
Purge volume is in cubic feet
π is 3.14159 (unitless)

c:\documents and settings\gmw\my documents\lockheed\vi report\037711063.doc 5
Appendix B – Standard Operating Procedure: Soil Vapor Sampling Using USEPA Method TO-15
r is radius of borehole (feet)
h is height from bottom of borehole (feet)
4. Connect the flow controller with in-line particulate filter and vacuum gauge to the SUMMA® canister. Do not open the valve on the SUMMA® canister. Record the flow controller number with the appropriate SUMMA® canister number in the field notebook. Collect duplicate samples sequentially.
5. Connect the sample collection tubing to the flow controller and the SUMMA® canister valve. Record in the field notebook the time sampling began and the canister pressure. The first samples collected will be carefully observed to verify that the canister is filling at an appropriate rate (i.e., between 100 and 200 mL/min).
6. Arrive at the SUMMA® canister location at least 15 minutes prior to the end of the sampling interval (30 to 60 minutes). Record the final vacuum pressure. Stop collecting the sample by closing the SUMMA® canister valves. Confirm that the canister has a minimum amount of vacuum (approximately 2 inches of Hg or slightly greater). Leaving some vacuum in the canister provides a way to assess whether the canister leaks while in transit to the laboratory.
7. Disconnect the sample collection tubing from the flow controller. Remove the flow controller with in-line particulate filter and vacuum gauge from the SUMMA® canister. Package the canister and flow controller in the shipping container supplied by the laboratory for return shipment to the laboratory. The SUMMA® canister does not require preservation with ice or refrigeration during shipment.
8. Complete the appropriate forms (e.g., chain of custody) and sample labels. Properly attach sample labels to each SUMMA® canister and include all appropriate forms into shipping containers. Secure each shipping container (e.g., with packing tape) and attach appropriate shipping labels.
Ship all containers via overnight courier. As soon as reasonably possible, verify laboratory receipt of the sample shipment.

c:\documents and settings\gmw\my documents\lockheed\vi report\037711063.doc 6
Appendix B – Standard Operating Procedure: Soil Vapor Sampling Using USEPA Method TO-15
B.7 WASTE MANAGEMENT
Field personnel will collect and remove all investigation-derived waste materials (including disposable equipment) for proper disposal.
B.8 DATA RECORDING AND MANAGEMENT
Measurements will be recorded in the field notebook and Field Sampling Logs at the time of measurement with notations of project name, sample date, sample start and finish time, sampling location (e.g., global positioning system coordinates), canister serial number, flow controller serial number, initial vacuum reading, and final pressure reading. Field sampling logs and chain-of-custody records will be referenced in the project report submitted to the agencies. An example of the Field Sampling Log is attached.
B.9 QUALITY ASSURANCE/QUALITY CONTROL
Soil vapor sample analysis will be performed using USEPA TO-15 methodology. This method uses a quadrupole or ion-trap GC/MS with a capillary column to provide optimum detection limits. The GC/MS system requires a 1-liter gas sample (which can easily be recovered from a 6-liter canister) to provide the specified detection limit (see Table C-1). The 6-liter canister also provides several additional 1-liter samples in case subsequent re-analyses or dilutions are required. This system also offers the advantage of the GC/MS detector, which confirms the identity of detected compounds by evaluating their mass spectra.
Duplicate and split samples will not be collected as part of this project and as advised by the agencies.
Additional information regarding quality assurance/quality control may be found in Appendix C.
B.10 REFERENCES
Environmental Protection Agency. 2002. Draft Guidance for Evaluating the Vapor Intrusion to Indoor Air Pathway from Groundwater and Soils.

BBL Soil Gas LogR.doc 2/9/2007
Soil Gas Sample Collection Log Sample ID:
Client: Date/Day: Project: Weather: Location: Temperature: Project #: Wind Speed/Direction: Samplers: Subcontractor: Logged By: Equipment:
Coordinates: Moisture Content of Sampling Zone (circle one):
Dry / Moist
Sampling Depth: Approximate Purge
Volume:
Time of Collection: Background PID
Ambient Air Reading:
Nearby Groundwater Monitoring Wells/Water Levels:
Well ID Depth to Groundwater (feet)
SUMMA Canister Information Size (circle one): 1 L 6 L
Canister ID:
Flow Controller ID: Tracer Gas Information (if applicable)
Tracer Gas:
Canister Pressure (inches Hg): Reported By Laboratory Measured Prior to Sample Collection Measured Following Sample Collection
Tracer Gas Concentration (if applicable):
Measured in Purge Effluent Measured in ‘Concentrated’ Area Prior to Sample Collection
Measured in ‘Concentrated’ Area Following Sample Collection
General Observations/Notes:
Approximating One-Well Volume (for purging): When using 1¼-inch “Dummy Point” and a 6-inch sampling interval, the sampling space will have a volume of approximately 150 mL. Each foot of ¼-inch tubing will have a volume of approximately 10 mL.

Appendix C
Quality Assurance/Quality Control Procedures

c:\documents and settings\gmw\my documents\lockheed\vi report\038711063.doc 1
Appendix C – Quality Assurance/Quality Control Procedures
This attachment summarizes the quality assurance/quality control (QA/QC) procedures to be implemented in conjunction with the soil vapor sampling and analysis activities at the former American Beryllium Company Facility (facility) located in Tallevast, Florida. A summary of compounds to be analyzed and a summary of the Sampling and Analysis Plan are provided as Table C-1 and C-2, respectively.
C.1 LABORATORY QUALIFICATIONS
Analytical laboratory services must be provided by a qualified Environmental Laboratory Approval Program-certified laboratory experienced in the analyses of soil vapor, ambient air, and groundwater samples using the methods specified herein.
C.2 LABORATORY QA/QC REQUIREMENTS
C.2.1 Quality Assurance/Quality Control for Laboratory Analysis
Specific procedures related to project-specific QA/QC for soil vapor and ambient air samples are described in the following subsections.
Method Blank Samples
A method blank will be analyzed by the laboratory at a frequency of 1 per 20 (or fewer) analyses. The method blank (consisting of an aliquot of humidified volatile organic compound-free air or nitrogen) will be carried through the entire analytical procedures.
Laboratory Control Samples
A Laboratory Control Sample (LCS) will be analyzed by the laboratory at a frequency of 1 per 20 (or fewer) investigative samples or once per tune period for the mass spectrometer, whichever is more frequent. The LCS will consist of a known standard prepared from a source other than the supplier of the calibration standard. The LCS will be used to evaluate accuracy of the analytical system, based on consistency with the control limits listed below. The following compounds will be part of the LCS standard: benzene, 1,4-dichlorobenzene, ethylbenzene, 1,1,1-trichloroethane, trichloroethene, and vinyl chloride.

c:\documents and settings\gmw\my documents\lockheed\vi report\038711063.doc 2
Appendix C – Quality Assurance/Quality Control Procedures
Analyte Concentration Spiked (ppbv)
Lower Control Limit %
Upper Control Limit %
Benzene 10.65 70 150 1,4-Dichlorobenzene 10.6 37 149
Ethylbenzene 10.9 65 145 1,1,1-Trichloroethane 10.9 81 157
Trichloroethene 10.9 65 144 Vinyl chloride 10.25 68 135
Note: ppbv – parts per billion volume
Trip Blanks
A trip blank sample will accompany field samples at a rate of one trip blank per shipment container. Trip blanks will originate at the analytical laboratory. Each trip blank will consist of a canister identical to those used for the sampling. Each trip blank canister will be provided as evacuated canister, sent to the field with other canisters, and returned without being opened. The canister will be filled with humidified nitrogen (the same gas used for method blanks) upon return to the laboratory and will be analyzed. The trip blanks will accompany the sample containers throughout transport and sampling activities and will be returned to the laboratory with the field samples.
Duplicate Samples
Duplicate samples will be collected at a rate of 1 per 20 samples. Duplicate samples will be collected from one borehole and will employ the use of a “T” fitting to properly split the sample between SUMMA® canisters.
C.2.2 Calibration Procedures and Frequency
Calibration of instrumentation is required to ensure that the analytical system is operating correctly and functioning at the property sensitivity to meet established quantitation and reporting limits.
The quantitation limit (QL) is the value at which an instrument or method can measure an analyte at a specified level of accuracy. The QL is established by the upper and lower limits of the calibration range with the lower QL set at the concentration of the low calibration standard. Due to the significant amount of error

c:\documents and settings\gmw\my documents\lockheed\vi report\038711063.doc 3
Appendix C – Quality Assurance/Quality Control Procedures
(~±100%) associated with results near the Method Detection Limit (MDL), the lower QL should be at least three times the MDL or greater.
The reporting limit (RL) is a threshold value for which results are reported as non-detected. In the absence of project-specific or method requirements, the laboratory sets the RL at the same value as the QL (i.e., the RL is associated with the low calibration standard). When project specific RLs are established below the QL, sample results below the QL are qualified as estimated. If very low levels of quantitation are required, and data cannot be estimated due to a risk assessment or compliance issue, the laboratory will analyze a RL check standard (taken through appropriate sample prep procedures) upon client request to assess accuracy at this concentration. The performance criteria and/or any method modifications required to achieve a project RL are determined in conjunction with the client.
This procedure is based on 40 Code of Federal Regulations Part 136, Appendix B and is intended to meet the requirements of the National Environmental Laboratory Accreditation Conference (NELAC) Quality Systems Standard, July 2001; the Department of Defense Quality Systems Manual, Final Version, June 2002; and the United States Army Corps of Engineers Shell for Analytical Chemistry.
Each instrument will be calibrated with certified standard solutions, and the linear range will be established for the analytical method. The frequency of calibration and the concentration of calibration standards will be determined by the analytical method.
Standards containing the compounds of interest will be analyzed at various concentrations to establish the linear range of the detector, the limit of detection, and the retention time windows. All calibrations will be performed using either average response factors or first-order linear regression. Higher-order fits will be allowed if permitted by the method if method criteria are met. The resulting calibration curves must meet all method-specified criteria prior to sample analyses.
The calibration curve or average response factor will be verified each day at a frequency specified in the appropriate analytical method. The response from the continuing calibration standard will be checked against the average response factors or calibration curve established during initiation calibration.

c:\documents and settings\gmw\my documents\lockheed\vi report\038711063.doc 4
Appendix C – Quality Assurance/Quality Control Procedures
C.2.3 Data Validation
Data assessment will be accomplished by the joint efforts of the Project QA/QC Officer and the Project Manager. The data assessment of the Project Manager will be based on the criteria that the sample was properly collected and handled according to the Standard Operating Procedure: Soil Vapor Sampling Using USEPA Method TO-15 (Appendix B). The Project Manager will review field notebooks, Field Sampling Logs, and sampling reports to monitor the integrity of all field operations.
All analytical data will be reported by the laboratory with the appropriate, project-defined deliverables package. An electronic data deliverable (EDD) will also be provided by the laboratory. The EDD will facilitate transfer of date into the existing project database for the site. A copy of the laboratory data package and/or the EDD will be provided to the agencies upon request.
A chemist(s) not employed by the analytical laboratory will validate the data generated by the contract laboratory. The chemist(s) will be experienced in performing data validations and will be familiar with the analytical methods used. The applicable analytical methods and the following document will be used to validate all data generated by the laboratory:
• USEPA. 1999. Contract Laboratory Program National Functional Guidelines for Organic Data Review. EPA 540/R-99-008 (October 1999).
C.3 DATA DOCUMENTATION AND REPORTING
A project file will be maintained that contains project plans, field notebooks, Field Sampling Logs and data records, maps and drawings, sample identification documents, chain-of-custody records, the entire analytical data package provided by the laboratory (including QA/QC documentation, data validation notes, references, and literature), report notes and calculations, progress and technical reports, correspondence, and other pertinent information. A project file will be kept at ARCADIS BBL’s office in Syracuse, New York, and the file will be maintained for the duration of the project.
The analytical laboratory will review appropriate QC data to verify the validity of the analytical results. The analytical laboratory will prepare and retain full analytical and QA/QC documentation and required by the analytical methods used.

c:\documents and settings\gmw\my documents\lockheed\vi report\038711063.doc 5
Appendix C – Quality Assurance/Quality Control Procedures
All results of chemical analyses will be supplied in a laboratory report that includes the following items: custody documentation; methodology review, non-conformance summary; sample results summary; QC summary, including method blank, matrix spike, duplicate and laboratory control sample results; and initial and continuing calibration results. The analytical laboratory will supply one hard copy of the analytical and QA/QC documentation to ARCADIS BBL, and it will be included with the reports of analyses in the project file.
C.4 REFERENCES
United States Environmental Protection Agency. 2002. Draft Guidance for Evaluating Vapor Intrusion to Indoor Air Pathway from Groundwater and Soils.
40 Code of Federal Regulations Part 136, Appendix B.
Department of Defense. 2002. Quality Systems Manual, Final Version (June 2002).
United States Army Corps of Engineers. 2001. Shell for Analytical Chemistry

Sample MatrixAnalytical Parameter Analytical Method
Investigative Samples
Method Blanks
Laboratory Control Samples Trip Blanks
Duplicate Samples
Equipment Rinse Blanks MS/MSD
Soil-GasVolatile Organic
Compounds TO-15 21 1 11 per shipping
container 2 NA (1) NA (2)
Notes:(1) - QA/QC samples for soil-gas will include method blanks, laboratory control samples, trip blanks, and field duplicates; no rinse blanks for the soil-gas samples will be necessary.(2) - Because the use of SUMMA® canisters does not allow for "spiking" air samples, a matrix spike/matrix spike duplicate (MS/MSD) analysis cannot be performed on the soil-gas samples.
SOIL-VAPOR SAMPLING AND ANALYSIS SUMMARY
SOIL VAPOR SURVEYTABLE C-1
FORMER AMERICAN BERYLLIUM COMPANYTALLEVAST, FLORIDA
2/7/2007C:\tallevast\soil gas workplan\Table C1.xls Page 1 of 1

CompoundCAS
NumberMolecular
WeightReporting Limit ppbv
Reporting Limit ug/m3
Acetone (2-propanone) 67-64-1 58.08 5.0 12Benzene 71-43-2 78.11 0.20 0.64Bromodichloromethane 75-27-4 163.83 0.20 1.3Bromoethene 593-60-2 106.96 0.20 0.87Bromoform 75-25-2 252.75 0.20 2.1Bromomethane (Methyl bromide) 74-83-9 94.95 0.20 0.781,3-Butadiene 106-99-0 60.14 0.20 0.492-Butanone (Methyl ethyl ketone) 78-93-3 72.11 0.50 1.5Carbon disulfide 75-15-0 76.14 0.50 1.6Carbon tetrachloride 56-23-5 153.84 0.20 1.3Chlorobenzene 108-90-7 112.56 0.20 0.92Chloroethane 75-00-3 64.52 0.20 0.53Chloroform 67-66-3 119.39 0.20 0.98Chloromethane (Methyl chloride) 74-87-3 50.49 0.20 0.413-Chloropropene (allyl chloride) 107-05-1 76.53 0.20 0.632-Chlorotoluene (o-Chlorotoluene) 95-49-8 126.59 0.20 1.04Cyclohexane 110-82-7 84.16 0.20 0.69Dibromochloromethane 124-48-1 242.74 0.20 2.01,2-Dibromoethane 106-93-4 187.88 0.20 1.51,2-Dichlorobenzene 95-50-1 147.01 0.20 1.21,3-Dichlorobenzene 541-73-1 147.01 0.20 1.21,4-Dichlorobenzene 106-46-7 147.01 0.20 1.2Dichlorodifluoromethane (Freon 12) 75-71-8 120.92 0.20 0.991,1-Dichloroethane 75-34-3 98.97 0.20 0.811,2-Dichloroethane 107-06-2 98.96 0.20 0.811,1-Dichloroethene 75-35-4 96.95 0.20 0.79cis-1,2-Dichloroethene 156-59-2 96.95 0.20 0.79trans-1,2-Dichloroethene 156-60-5 96.95 0.20 0.791,2-Dichloropropane 78-87-5 112.99 0.20 0.92cis-1,3-Dichloropropene 10061-01-5 110.98 0.20 0.91trans-1,3-Dichloropropene 10061-02-6 110.98 0.20 0.911,2-Dichlorotetrafluoroethane (Freon 114) 76-14-2 170.93 0.20 1.4Ethylbenzene 100-41-4 106.16 0.20 0.874-Ethyltoluene (p-Ethyltoluene) 622-96-8 120.2 0.20 0.98n-Heptane 142-82-5 101.2 0.20 0.83Hexachlorobutadiene 87-68-3 260.76 0.20 2.1n-Hexane 110-54-3 86.18 0.20 0.70Methylene chloride 75-09-2 84.94 0.50 1.74-Methyl-2-pentanone (MIBK) 108-10-1 100.16 0.50 2.05MTBE (Methyl tert-butyl ether) 1634-04-4 88.15 0.50 1.8Styrene 100-42-5 104.14 0.20 0.85Tertiary butyl alcohol (TBA) 75-65-0 74.12 5.0 151,1,2,2-Tetrachloroethane 79-34-5 167.86 0.20 1.4Tetrachloroethene (PCE) 127-18-4 165.85 0.20 1.4Toluene 108-88-3 92.13 0.20 0.751,2,4-Trichlorobenzene 120-82-1 181.46 0.50 3.71,1,1-Trichloroethane 71-55-6 133.42 0.20 1.11,1,2-Trichloroethane 79-00-5 133.42 0.20 1.11,1,2-Trichloro-1,2,2-trifluoroethane (Freon TF) 76-13-1 187.38 0.20 1.5Trichloroethene (TCE) 79-01-6 131.4 0.20 1.07Trichlorofluoromethane (Freon 11) 75-69-4 137.38 0.20 1.11,2,4-Trimethylbenzene 95-63-6 120.19 0.20 0.981,3,5-Trimethylbenzene 108-67-8 120.19 0.20 0.982,2,4-Trimethylpentane 540-84-1 132.38 0.20 1.08Vinyl chloride 75-01-4 62.5 0.20 0.51Xylenes (m&p) 1330-20-7 106.16 0.20 0.87Xylenes (o) 95-47-6 106.16 0.20 0.871,2-Dichloroethene (total) 540-59-0 96.95 0.20 0.791,4-Dioxane 123-91-1 88.11 5.0 18Isopropyl Alcohol 67-63-0 61.09 5.0 12.5Methyl Butyl Ketone 591-78-6 100.16 0.50 2.05Methyl methacrylate (upon request only) 80-62-6 100.1 0.50 2.05Naphthalene (upon request only) 91-20-3 142.2 0.50 2.9Tetrahydrofuran 109-99-9 72.11 5.0 15
TABLE C-2SOIL VAPOR SURVEY
FORMER AMERICAN BERYLLIUM COMPANYTELLEVAST, FLORIDA
METHOD DETECTION LIMITS / LIMITS OF QUANTITATION
STL Burlington Page 1 of 1 2/7/200712:20 PM

Appendix D
Data Review for June and October 2006 Soil Gas Results

DATA REVIEW FOR
FORMER AMERICAN BERYLLIUM COMPANY SITE
TALLEVAST, MANATEE COUNTY, FLORIDA
SDG #H6F070221
AIR VOLATILE ANALYSES
Analyses performed by:
Severn Trent Laboratories Knoxville, Tennessee
Review performed by:
Syracuse, New York Report #5803R

5803R.doc
Summary The following is an assessment of the data package for Sample Delivery Group (SDG) #H6F070221 for sampling from the Former American Beryllium Company site. Included with this assessment are the data review check sheets used in the review of the package and corrected sample results. Analyses were performed on the following samples:
Analysis
Sample ID
Lab ID
Matrix
Sample
Date VOC
SVOC
PCB
MET
MISC
SG-18 H6WD81AA Air 6/5/2006 X AA-6/5/06 H6WE21AA Air 6/5/2006 X SG-25 H6WE71AA Air 6/5/2006 X SG-12 H6WED1AA Air 6/2/2006 X SG-14 H6WEH1AA Air 6/2/2006 X SG-11 H6WEJ1AA Air 6/2/2006 X SG-10 H6WEV1AA Air 6/5/2006 X SG-18D H6WF11AA Air 6/5/2006 X SG-13 H6WF31AA Air 6/2/2006 X SG-17 H6WF41AA Air 6/2/2006 X AA-6/2/06 H6WF51AA Air 6/2/2006 X SG-2 H6WF61AA Air 6/5/2006 X SG-24 H6WF71AA Air 6/5/2006 X SG-20 H6WF81AA Air 6/5/2006 X SG-3 H6WFC1AA Air 6/5/2006 X SG-21 H6WFF1AA Air 6/5/2006 X SG-15 H6WFG1AA Air 6/5/2006 X SG-5 H6WFM1AA Air 6/5/2006 X SG-1 H6WFR1AA Air 6/5/2006 X SG-9D H6WFT1AA Air 6/5/2006 X SG-9 H6WFW1AA Air 6/5/2006 X SG-23 H6WFX1AA Air 6/5/2006 X SG-7 H6WGD1AA Air 6/5/2006 X SG-8 H6WGE1AA Air 6/5/2006 X SG-22 H6WGF1AA Air 6/5/2006 X SG-4 H6WGG1AA Air 6/5/2006 X FB 6/6/06 H6WGH1AA Air 6/6/2006 X SG-6 H6WGL1AA Air 6/5/2006 X

5803R.doc
AIR VOLATILE ORGANIC COMPOUND (VOC) ANALYSES

5803R.doc
Introduction Analyses were performed according to (United Stated Environmental Protection Agency) USEPA Method TO-15. Data were reviewed in accordance with USEPA National Functional Guidelines of October 1999. The data review process is an evaluation of data on a technical basis rather than a determination of contract compliance. As such, the standards against which the data are being weighed may differ from those specified in the analytical method. It is assumed that the data package represents the best efforts of the laboratory and had already been subjected to adequate and sufficient quality review prior to submission. During the review process, laboratory qualified and unqualified data are verified against the supporting documentation. Based on this evaluation, qualifier codes may be added, deleted, or modified by the data reviewer. Results are qualified with the following codes in accordance with USEPA National Functional Guidelines:
U The compound was analyzed for but not detected. The associated value is the compound quantitation limit.
J The compound was positively identified; however, the associated numerical value is an
estimated concentration only.
B The compound has been found in the sample as well as its associated blank, its presence in the sample may be suspect.
N The analysis indicates the presence of a compound for which there is presumptive evidence to
make a tentative identification.
JN The analysis indicates the presence of a compound for which there is presumptive evidence to make a tentative identification. The associated numerical value is an estimated concentration only.
E The compound was quantitated above the calibration range.
D Concentration is based on a diluted sample analysis.
UJ The compound was not detected above the reported sample quantitation limit. However, the
reported limit is approximate and may or may not represent the actual limit of quantitation.
R The sample results are rejected. Two facts should be noted by all data users. First, the "R" flag means that the associated value is unusable. In other words, due to significant quality control (QC) problems, the analysis is invalid and provides no information as to whether the compound is present or not. "R" values should not appear on data tables because they cannot be relied upon, even as a last resort. The second fact to keep in mind is that no compound concentration, even if it has passed all QC tests, is guaranteed to be accurate. Strict QC serves to increase confidence in data but any value potentially contains error.
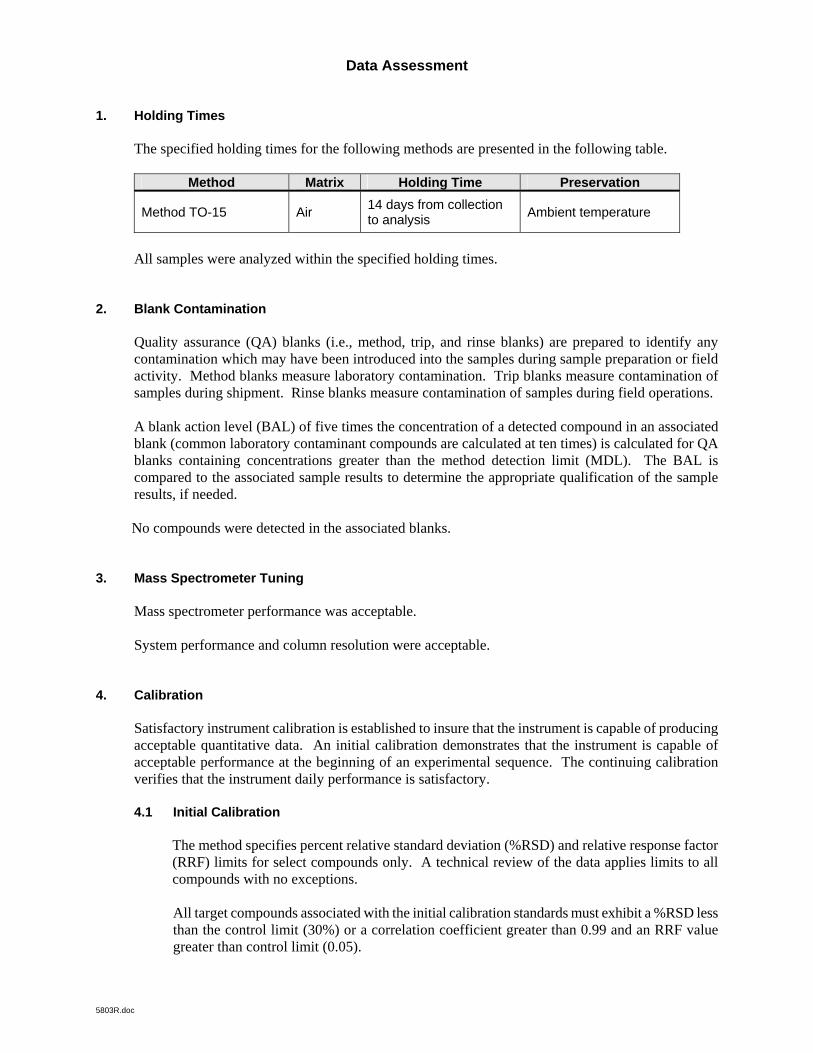
5803R.doc
Data Assessment 1. Holding Times The specified holding times for the following methods are presented in the following table.
Method Matrix Holding Time Preservation
Method TO-15 Air 14 days from collection to analysis Ambient temperature
All samples were analyzed within the specified holding times. 2. Blank Contamination
Quality assurance (QA) blanks (i.e., method, trip, and rinse blanks) are prepared to identify any contamination which may have been introduced into the samples during sample preparation or field activity. Method blanks measure laboratory contamination. Trip blanks measure contamination of samples during shipment. Rinse blanks measure contamination of samples during field operations. A blank action level (BAL) of five times the concentration of a detected compound in an associated blank (common laboratory contaminant compounds are calculated at ten times) is calculated for QA blanks containing concentrations greater than the method detection limit (MDL). The BAL is compared to the associated sample results to determine the appropriate qualification of the sample results, if needed. No compounds were detected in the associated blanks.
3. Mass Spectrometer Tuning
Mass spectrometer performance was acceptable.
System performance and column resolution were acceptable. 4. Calibration
Satisfactory instrument calibration is established to insure that the instrument is capable of producing acceptable quantitative data. An initial calibration demonstrates that the instrument is capable of acceptable performance at the beginning of an experimental sequence. The continuing calibration verifies that the instrument daily performance is satisfactory.
4.1 Initial Calibration
The method specifies percent relative standard deviation (%RSD) and relative response factor (RRF) limits for select compounds only. A technical review of the data applies limits to all compounds with no exceptions. All target compounds associated with the initial calibration standards must exhibit a %RSD less than the control limit (30%) or a correlation coefficient greater than 0.99 and an RRF value greater than control limit (0.05).
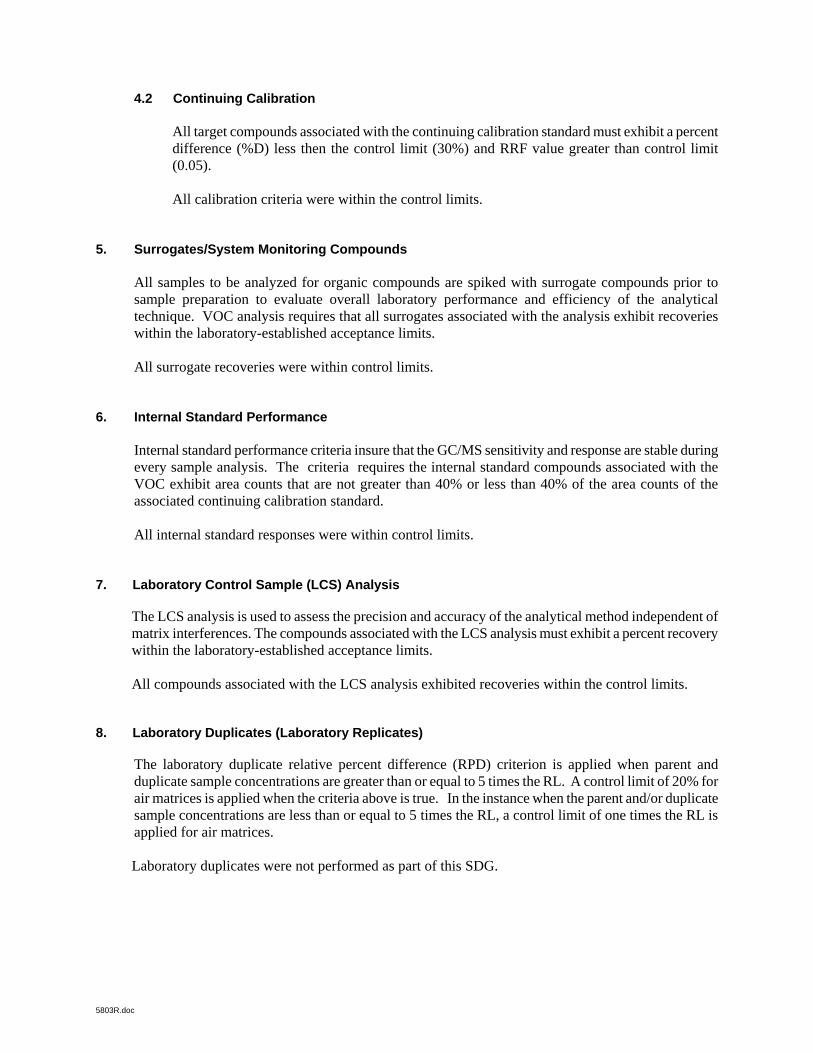
5803R.doc
4.2 Continuing Calibration
All target compounds associated with the continuing calibration standard must exhibit a percent difference (%D) less then the control limit (30%) and RRF value greater than control limit (0.05). All calibration criteria were within the control limits.
5. Surrogates/System Monitoring Compounds
All samples to be analyzed for organic compounds are spiked with surrogate compounds prior to sample preparation to evaluate overall laboratory performance and efficiency of the analytical technique. VOC analysis requires that all surrogates associated with the analysis exhibit recoveries within the laboratory-established acceptance limits.
All surrogate recoveries were within control limits.
6. Internal Standard Performance
Internal standard performance criteria insure that the GC/MS sensitivity and response are stable during every sample analysis. The criteria requires the internal standard compounds associated with the VOC exhibit area counts that are not greater than 40% or less than 40% of the area counts of the associated continuing calibration standard.
All internal standard responses were within control limits.
7. Laboratory Control Sample (LCS) Analysis
The LCS analysis is used to assess the precision and accuracy of the analytical method independent of matrix interferences. The compounds associated with the LCS analysis must exhibit a percent recovery within the laboratory-established acceptance limits. All compounds associated with the LCS analysis exhibited recoveries within the control limits.
8. Laboratory Duplicates (Laboratory Replicates)
The laboratory duplicate relative percent difference (RPD) criterion is applied when parent and duplicate sample concentrations are greater than or equal to 5 times the RL. A control limit of 20% for air matrices is applied when the criteria above is true. In the instance when the parent and/or duplicate sample concentrations are less than or equal to 5 times the RL, a control limit of one times the RL is applied for air matrices. Laboratory duplicates were not performed as part of this SDG.

5803R.doc
9. Field Duplicate Analysis
Field duplicate analysis is used to assess the precision and accuracy of the field sampling procedures and analytical method. A control limit of 20% for air matrices, 50% for water matrices and 100% for soil matrices is applied to the RPD between the parent sample and the field duplicate. Results for duplicate samples are summarized in the following table.
Sample ID/Duplicate ID Compound Sample Result
Duplicate Result RPD
SG-9/SG-9D All compounds ND ND AC
SG-18/SG-18D All compounds ND ND AC ND = Not detected. AC = The field duplicate RPD is acceptable when the RPD between parent sample and field duplicate sample
is less than two times the RL and where the parent sample and/or duplicate concentration is less than five times the RL.
The calculated RPDs between the parent sample and field duplicate were acceptable.
10. Compound Identification
Compounds are identified on the GC/MS by using the analytes relative retention time and ion spectra. All identified compounds met the specified criteria. All samples within this SDG were subject to a library search to identify the presence or absence of 1,4-Dioxane. The laboratory instrumentation was not calibrated for the 1,4-Dioxane; therefore the ability of the laboratory to detect or not detect the compound was not demonstrated. The associate 1,4-Dioxane sample results were changed from nondetect to not present. All identified compounds met the specified criteria.
11. System Performance and Overall Assessment
Overall system performance was acceptable. Other than for those deviations specifically mentioned in this review, the overall data quality is within the guidelines specified in the method.

5803R.doc
CORRECTED SAMPLE ANALYSIS DATA SHEETS
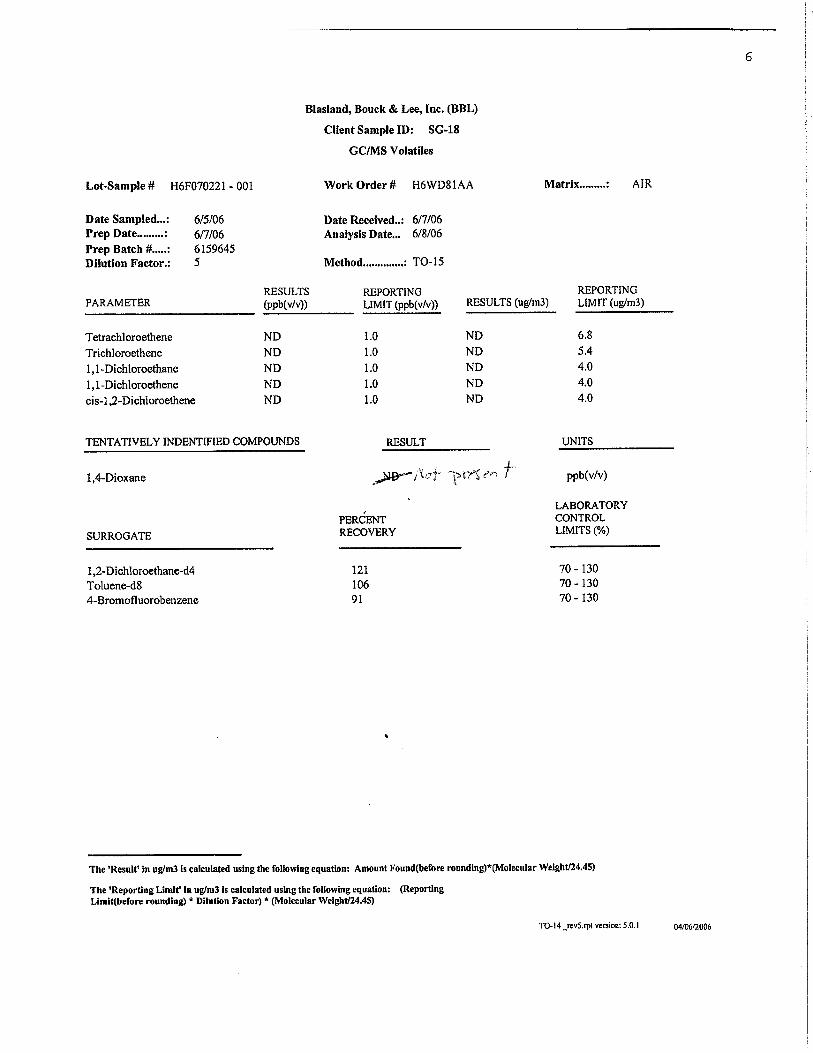


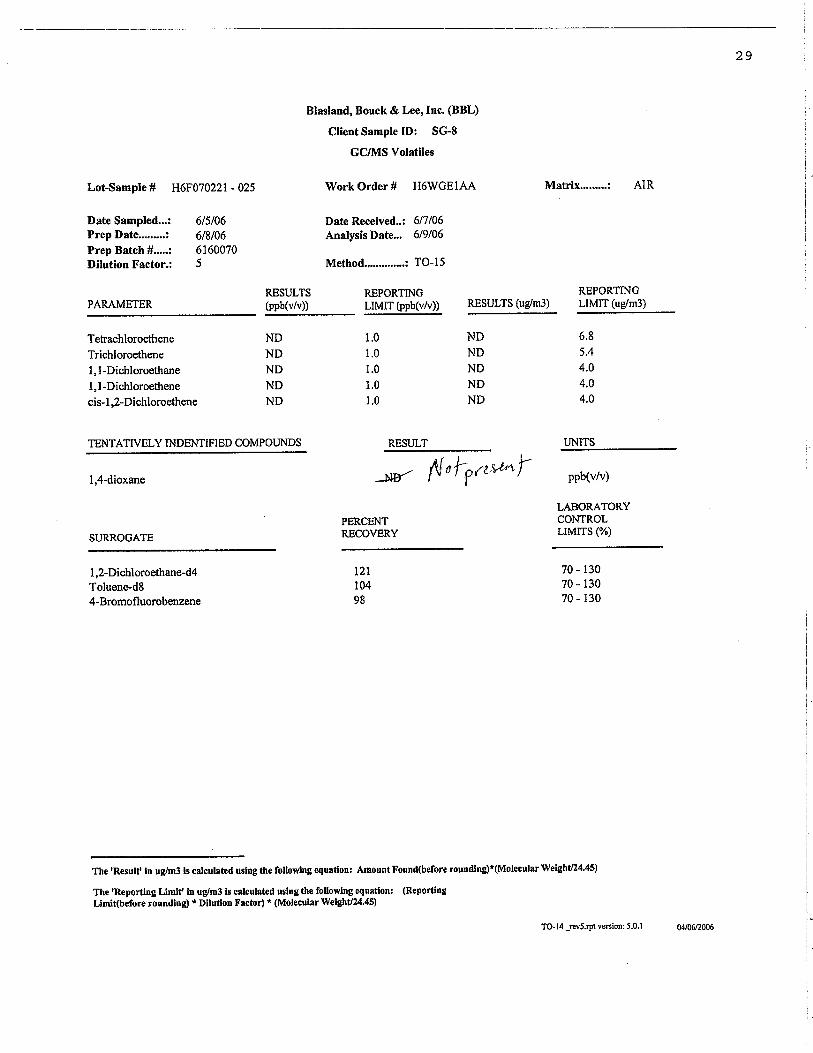


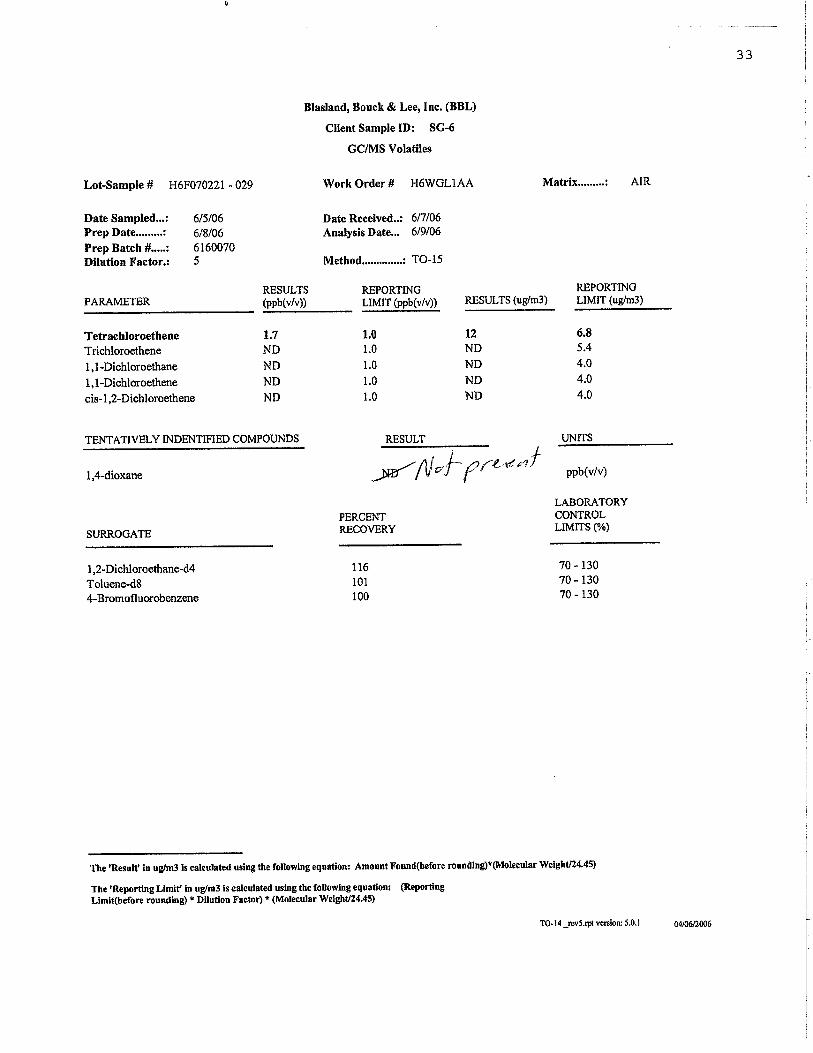
5803R.doc
SAMPLE COMPLIANCE REPORT
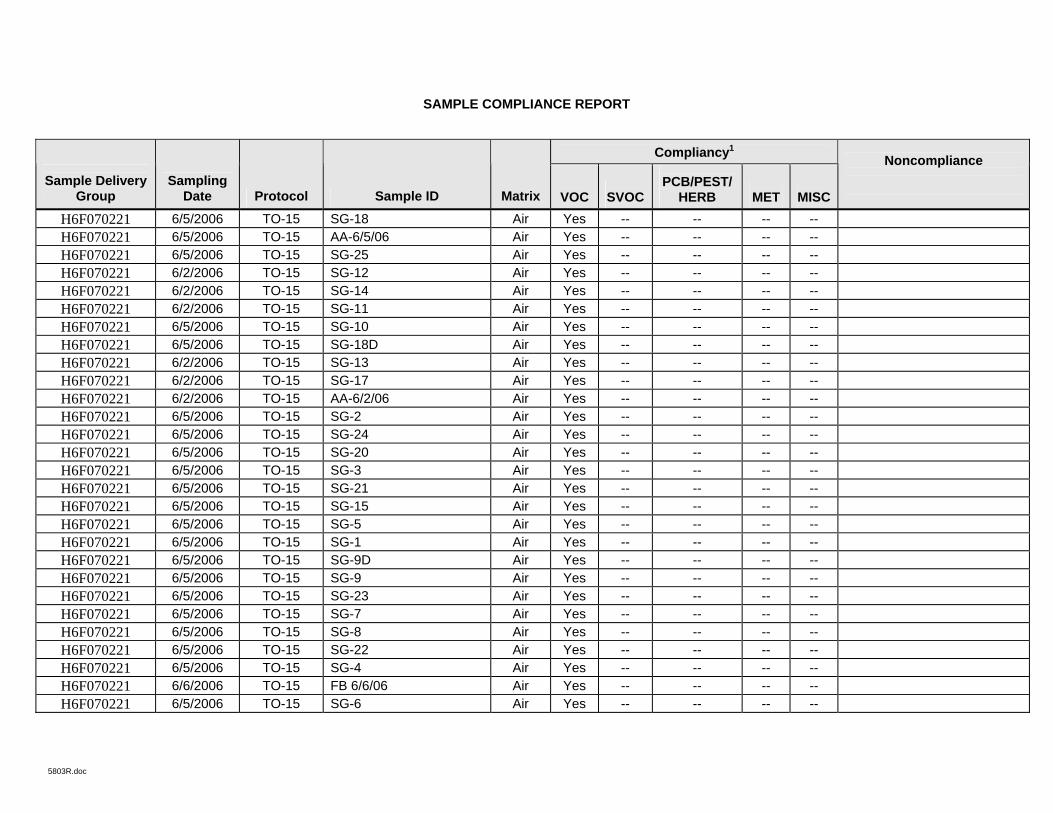
5803R.doc
SAMPLE COMPLIANCE REPORT
Compliancy1 Sample Delivery
Group Sampling
Date Protocol Sample ID Matrix VOC
SVOC
PCB/PEST/
HERB MET
MISC
Noncompliance
H6F070221 6/5/2006 TO-15 SG-18 Air Yes -- -- -- -- H6F070221 6/5/2006 TO-15 AA-6/5/06 Air Yes -- -- -- -- H6F070221 6/5/2006 TO-15 SG-25 Air Yes -- -- -- -- H6F070221 6/2/2006 TO-15 SG-12 Air Yes -- -- -- -- H6F070221 6/2/2006 TO-15 SG-14 Air Yes -- -- -- -- H6F070221 6/2/2006 TO-15 SG-11 Air Yes -- -- -- -- H6F070221 6/5/2006 TO-15 SG-10 Air Yes -- -- -- -- H6F070221 6/5/2006 TO-15 SG-18D Air Yes -- -- -- -- H6F070221 6/2/2006 TO-15 SG-13 Air Yes -- -- -- -- H6F070221 6/2/2006 TO-15 SG-17 Air Yes -- -- -- -- H6F070221 6/2/2006 TO-15 AA-6/2/06 Air Yes -- -- -- -- H6F070221 6/5/2006 TO-15 SG-2 Air Yes -- -- -- -- H6F070221 6/5/2006 TO-15 SG-24 Air Yes -- -- -- -- H6F070221 6/5/2006 TO-15 SG-20 Air Yes -- -- -- -- H6F070221 6/5/2006 TO-15 SG-3 Air Yes -- -- -- -- H6F070221 6/5/2006 TO-15 SG-21 Air Yes -- -- -- -- H6F070221 6/5/2006 TO-15 SG-15 Air Yes -- -- -- -- H6F070221 6/5/2006 TO-15 SG-5 Air Yes -- -- -- -- H6F070221 6/5/2006 TO-15 SG-1 Air Yes -- -- -- -- H6F070221 6/5/2006 TO-15 SG-9D Air Yes -- -- -- -- H6F070221 6/5/2006 TO-15 SG-9 Air Yes -- -- -- -- H6F070221 6/5/2006 TO-15 SG-23 Air Yes -- -- -- -- H6F070221 6/5/2006 TO-15 SG-7 Air Yes -- -- -- -- H6F070221 6/5/2006 TO-15 SG-8 Air Yes -- -- -- -- H6F070221 6/5/2006 TO-15 SG-22 Air Yes -- -- -- -- H6F070221 6/5/2006 TO-15 SG-4 Air Yes -- -- -- -- H6F070221 6/6/2006 TO-15 FB 6/6/06 Air Yes -- -- -- -- H6F070221 6/5/2006 TO-15 SG-6 Air Yes -- -- -- --

5803R.doc
1 Samples which are compliant with no added validation qualifiers are listed as "yes". Samples which are non-compliant or which have added qualifiers are
listed as "no". A "no" designation does not necessarily indicate that the data have been rejected or are otherwise unusable.

5803R.doc
CHAIN OF CUSTODY


DATA REVIEW FOR
FORMER AMERICAN BERYLLIUM COMPANY SITE
TALLEVAST, MANATEE COUNTY, FLORIDA
SDG #H6J200177
AIR VOLATILE ANALYSES
Analyses performed by:
Severn Trent Laboratories Knoxville, Tennessee
Review performed by:
Syracuse, New York Report #6242R

6242R.doc
Summary The following is an assessment of the data package for Sample Delivery Group (SDG) #H6J200177 for sampling from the Former American Beryllium Company site. Included with this assessment are the data review check sheets used in the review of the package and corrected sample results. Analyses were performed on the following samples:
Analysis
Sample ID
Lab ID
Matrix
Sample
Date VOC
SVOC
PCB
MET
MISC
SG-12RS H6J200177-001 Air 10/18/06 X SG-13RS H6J200177-002 Air 10/18/06 X SG-15RS H6J200177-003 Air 10/18/06 X SG-23RS H6J200177-004 Air 10/18/06 X SG-6RS H6J200177-005 Air 10/18/06 X SG-2RS H6J200177-006 Air 10/18/06 X SG-XRS H6J200177-007 Air 10/18/06 X AA-10/18 DOWNWIND H6J200177-008 Air 10/18/06 X AA-10/18 UPWIND H6J200177-009 Air 10/18/06 X AA-10/18 MID H6J200177-010 Air 10/18/06 X FB-10/18 H6J200177-011 Air 10/18/06 X

6242R.doc
VOLATILE ORGANIC COMPOUND (VOC) ANALYSES

6242R.doc
Introduction Analyses were performed according to (United Stated Environmental Protection Agency) USEPA Method TO-15. Data were reviewed in accordance with USEPA National Functional Guidelines of October 1999. The data review process is an evaluation of data on a technical basis rather than a determination of contract compliance. As such, the standards against which the data are being weighed may differ from those specified in the analytical method. It is assumed that the data package represents the best efforts of the laboratory and had already been subjected to adequate and sufficient quality review prior to submission. During the review process, laboratory qualified and unqualified data are verified against the supporting documentation. Based on this evaluation, qualifier codes may be added, deleted, or modified by the data reviewer. Results are qualified with the following codes in accordance with USEPA National Functional Guidelines:
U The compound was analyzed for but not detected. The associated value is the compound quantitation limit.
J The compound was positively identified; however, the associated numerical value is an
estimated concentration only.
B The compound has been found in the sample as well as its associated blank, its presence in the sample may be suspect.
N The analysis indicates the presence of a compound for which there is presumptive evidence to
make a tentative identification.
JN The analysis indicates the presence of a compound for which there is presumptive evidence to make a tentative identification. The associated numerical value is an estimated concentration only.
E The compound was quantitated above the calibration range.
D Concentration is based on a diluted sample analysis.
UJ The compound was not detected above the reported sample quantitation limit. However, the
reported limit is approximate and may or may not represent the actual limit of quantitation.
R The sample results are rejected. Two facts should be noted by all data users. First, the "R" flag means that the associated value is unusable. In other words, due to significant quality control (QC) problems, the analysis is invalid and provides no information as to whether the compound is present or not. "R" values should not appear on data tables because they cannot be relied upon, even as a last resort. The second fact to keep in mind is that no compound concentration, even if it has passed all QC tests, is guaranteed to be accurate. Strict QC serves to increase confidence in data but any value potentially contains error.

6242R.doc
Data Assessment 1. Holding Times The specified holding times for the following methods are presented in the following table.
Method Matrix Holding Time Preservation
Method TO-15 Air 14 days from collection to analysis Ambient temperature
All samples were analyzed within the specified holding times. 2. Blank Contamination
Quality assurance (QA) blanks (i.e., method, trip, and rinse blanks) are prepared to identify any contamination which may have been introduced into the samples during sample preparation or field activity. Method blanks measure laboratory contamination. Trip blanks measure contamination of samples during shipment. Rinse blanks measure contamination of samples during field operations. A blank action level (BAL) of five times the concentration of a detected compound in an associated blank (common laboratory contaminant compounds are calculated at ten times) is calculated for QA blanks containing concentrations greater than the method detection limit (MDL). The BAL is compared to the associated sample results to determine the appropriate qualification of the sample results, if needed. No compounds were detected in the associated blanks.
3. Mass Spectrometer Tuning
Mass spectrometer performance was acceptable.
System performance and column resolution were acceptable. 4. Calibration
Satisfactory instrument calibration is established to insure that the instrument is capable of producing acceptable quantitative data. An initial calibration demonstrates that the instrument is capable of acceptable performance at the beginning of an experimental sequence. The continuing calibration verifies that the instrument daily performance is satisfactory.
4.1 Initial Calibration
The method specifies percent relative standard deviation (%RSD) and relative response factor (RRF) limits for select compounds only. A technical review of the data applies limits to all compounds with no exceptions. All target compounds associated with the initial calibration standards must exhibit a %RSD less than the control limit (30%) or a correlation coefficient greater than 0.99 and an RRF value greater than control limit (0.05).

6242R.doc
4.2 Continuing Calibration
All target compounds associated with the continuing calibration standard must exhibit a percent difference (%D) less then the control limit (30%) and RRF value greater than control limit (0.05). All compounds associated with the calibrations were within the specified control limits, with the exception of the compounds presented in the following table.
Sample Locations Compound Initial/Continuing Criteria
SG-12RS SG-13RS SG-15RS SG-23RS SG-6RS SG-2RS SG-XRS AA-10/18 DOWNWIND AA-10/18 UPWIND AA-10/18 MID FB-10/18
1,1-Dichloroethane CCV %D 35.5
The criteria used to evaluate the initial and continuing calibration are presented in the following table. In the case of a calibration deviation, the sample results are qualified.
Initial/Continuing Criteria Sample Result Qualification
Non-detect R RRF <0.05
Detect J
Non-detect R RRF <0.0051
RRF <0.012
Detect J
Non-detect
Initial and Continuing Calibration
RRF >0.05 RRF >0.0051 RRF >0.012 Detect
No Action
Non-detect UJ Initial Calibration
%RSD > 15% or a correlation coefficient <0.99 Detect J
Non-detect No Action Continuing Calibration
%D >20% (50% for 1,4-Dioxane) (increase in sensitivity) Detect J
Non-detect UJ Continuing Calibration
%D >20% (50% for 1,4-Dioxane) (decrease in sensitivity) Detect J

6242R.doc
1. RRF of 0.005 is applied to 1,4-Dioxane as referenced in Exhibit D of Analytical Method for the Analysis of Trace Concentrations of Volatile Organic Compounds.
2. RRF of 0.01 only applies to compounds which are typically poor responding compounds (i.e. ketones, etc.)
5. Internal Standard Performance
Internal standard performance criteria insure that the GC/MS sensitivity and response are stable during every sample analysis. The criteria requires the internal standard compounds associated with the VOC exhibit area counts that are not greater than 40% or less than 40% of the area counts of the associated continuing calibration standard.
All internal standard responses were within control limits.
6. Laboratory Control Sample (LCS) Analysis
The LCS analysis is used to assess the precision and accuracy of the analytical method independent of matrix interferences. The compounds associated with the LCS analysis must exhibit a percent recovery within the laboratory-established acceptance limits.
Sample locations associated with LCS analysis exhibiting recoveries outside of the control limits presented in the following table.
Sample Locations Compound LCS Recovery
SG-12RS SG-13RS SG-15RS SG-23RS SG-6RS SG-2RS SG-XRS AA-10/18 DOWNWIND AA-10/18 UPWIND AA-10/18 MID FB-10/18
1,1-Dichloroethane >UL
The criteria used to evaluate the LCS recoveries are presented in the following table. In the case of an LCS deviation, the sample results are qualified as documented in the table below.
Control Limit Sample Result Qualification
Non-detect No Action > the upper control limit (UL) Detect J Non-detect J
< the lower control limit (LL) but > 10% Detect J Non-detect R
< 10% Detect J

6242R.doc
7. Laboratory Duplicates (Laboratory Replicates)
The laboratory duplicate relative percent difference (RPD) criterion is applied when parent and duplicate sample concentrations are greater than or equal to 5 times the RL. A control limit of 20% for air matrices is applied when the criteria above is true. In the instance when the parent and/or duplicate sample concentrations are less than or equal to 5 times the RL, a control limit of one times the RL is applied for air matrices.
Laboratory duplicates were not performed on a sample location within this SDG.
8. Field Duplicate Analysis
Field duplicate analysis is used to assess the precision and accuracy of the field sampling procedures and analytical method. A control limit of 20% for air matrices, 50% for water matrices and 100% for soil matrices is applied to the RPD between the parent sample and the field duplicate.
Field duplicates were not performed on a sample location within this SDG.
9. Compound Identification
Compounds are identified on the GC/MS by using the analytes relative retention time and ion spectra. All identified compounds met the specified criteria. All samples within this SDG were subject to a library search to identify the presence or absence of 1,4-Dioxane. The laboratory instrumentation was not calibrated for the 1,4-Dioxane; therefore the ability of the laboratory to detect or not detect the compound was not demonstrated. The associate 1,4-Dioxane sample results were changed from nondetect to not present. All identified compounds met the specified criteria.
10. System Performance and Overall Assessment
Overall system performance was acceptable. Other than for those deviations specifically mentioned in this review, the overall data quality is within the guidelines specified in the method.
6242R.doc
CORRECTED SAMPLE ANALYSIS DATA SHEETS


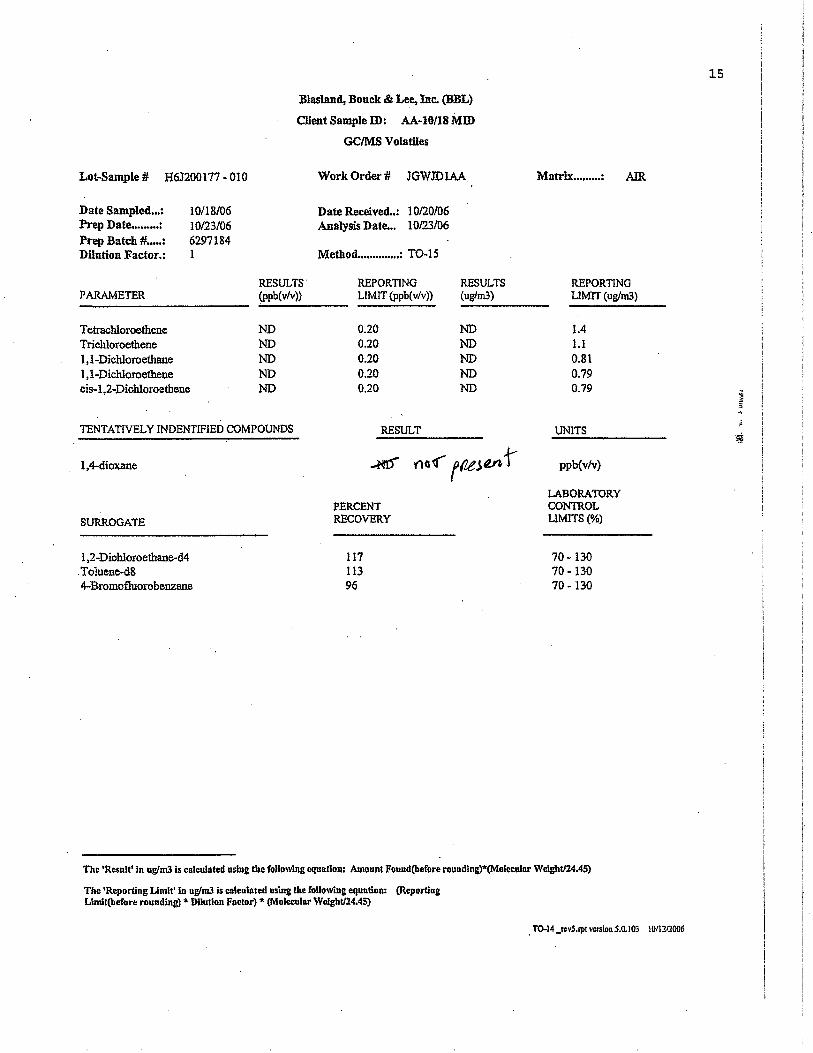


6242R.doc
SAMPLE COMPLIANCE REPORT

6242R.doc
SAMPLE COMPLIANCE REPORT
Compliancy1 Sample Delivery
Group Sampling
Date Protocol Sample ID Matrix VOC
SVOC
PCB/PEST/
HERB MET
MISC
Noncompliance
H6J200177 10/18/2006 TO-15 SG-12RS Air Yes -- -- -- -- H6J200177 10/18/2006 TO-15 SG-13RS Air Yes -- -- -- -- H6J200177 10/18/2006 TO-15 SG-15RS Air Yes -- -- -- -- H6J200177 10/18/2006 TO-15 SG-23RS Air Yes -- -- -- -- H6J200177 10/18/2006 TO-15 SG-6RS Air Yes -- -- -- -- H6J200177 10/18/2006 TO-15 SG-2RS Air Yes -- -- -- -- H6J200177 10/18/2006 TO-15 SG-XRS Air Yes -- -- -- -- H6J200177 10/18/2006 TO-15 AA-10/18 DOWNWIND Air Yes -- -- -- -- H6J200177 10/18/2006 TO-15 AA-10/18 UPWIND Air Yes -- -- -- -- H6J200177 10/18/2006 TO-15 AA-10/18 MID Air Yes -- -- -- -- H6J200177 10/18/2006 TO-15 FB-10/18 Air Yes -- -- -- --
1 Samples which are compliant with no added validation qualifiers are listed as "yes". Samples which are non-compliant or which have added qualifiers are
listed as "no". A "no" designation does not necessarily indicate that the data have been rejected or are otherwise unusable.

6242R.doc
CHAIN OF CUSTODY


Appendix E
Photoionization Detector Data


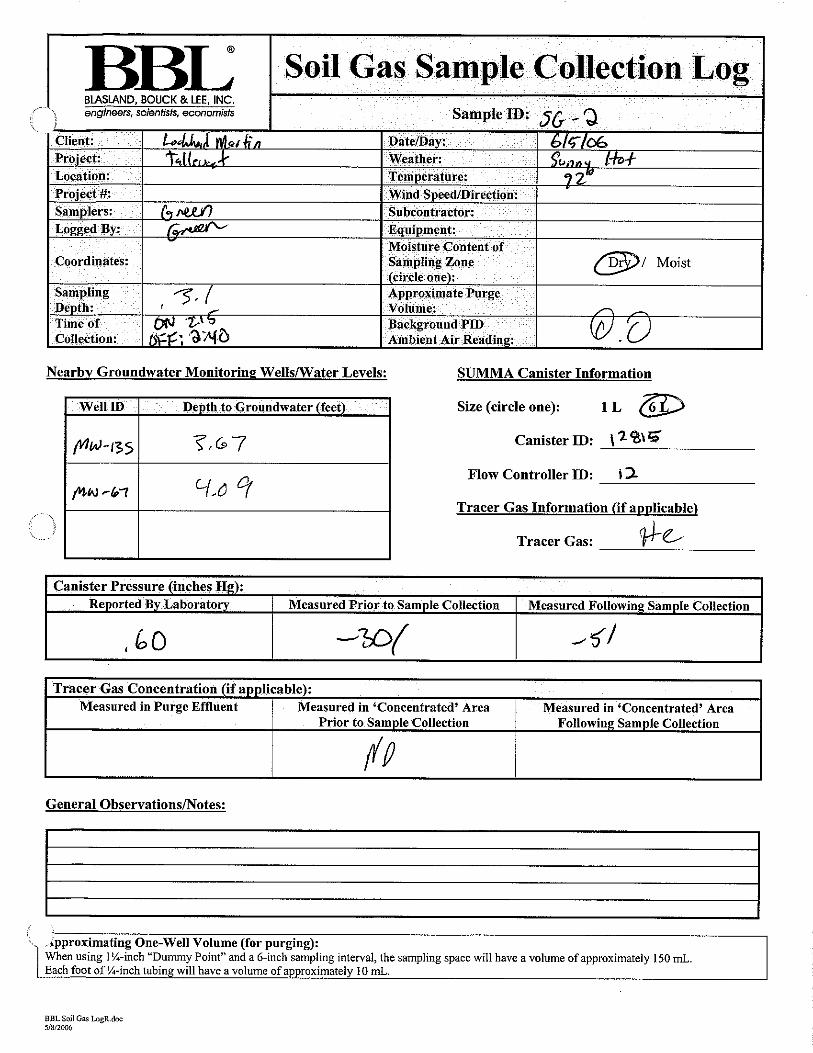

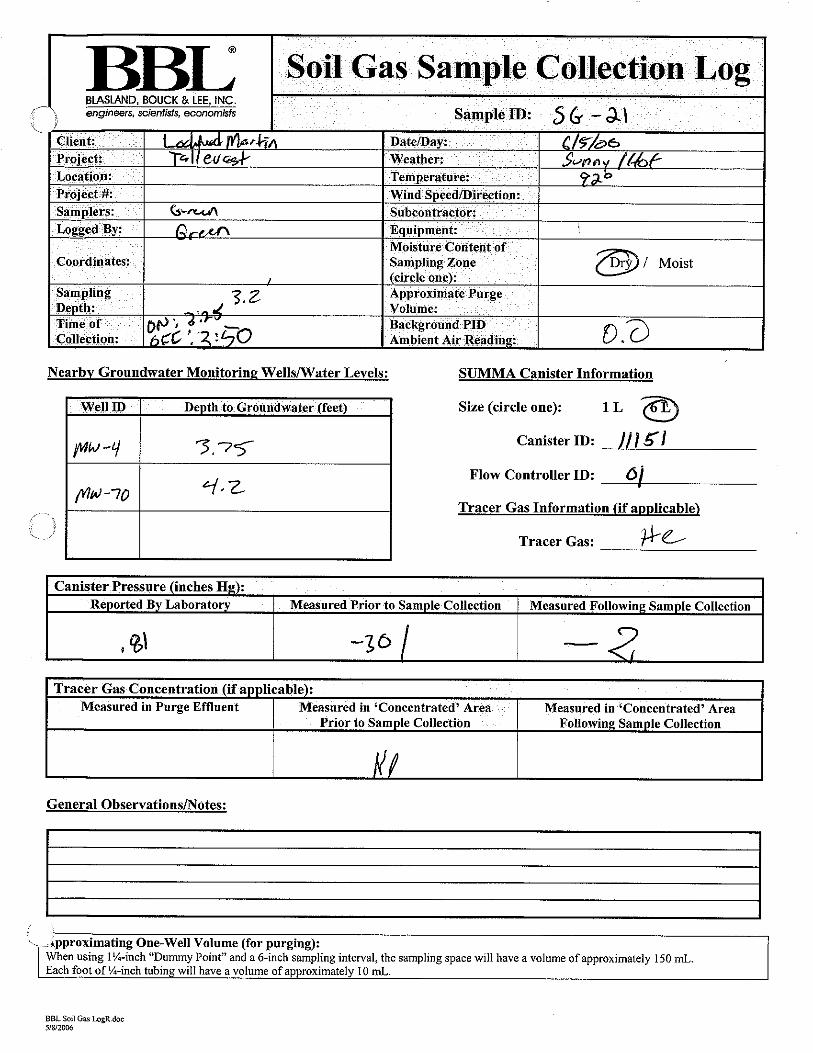
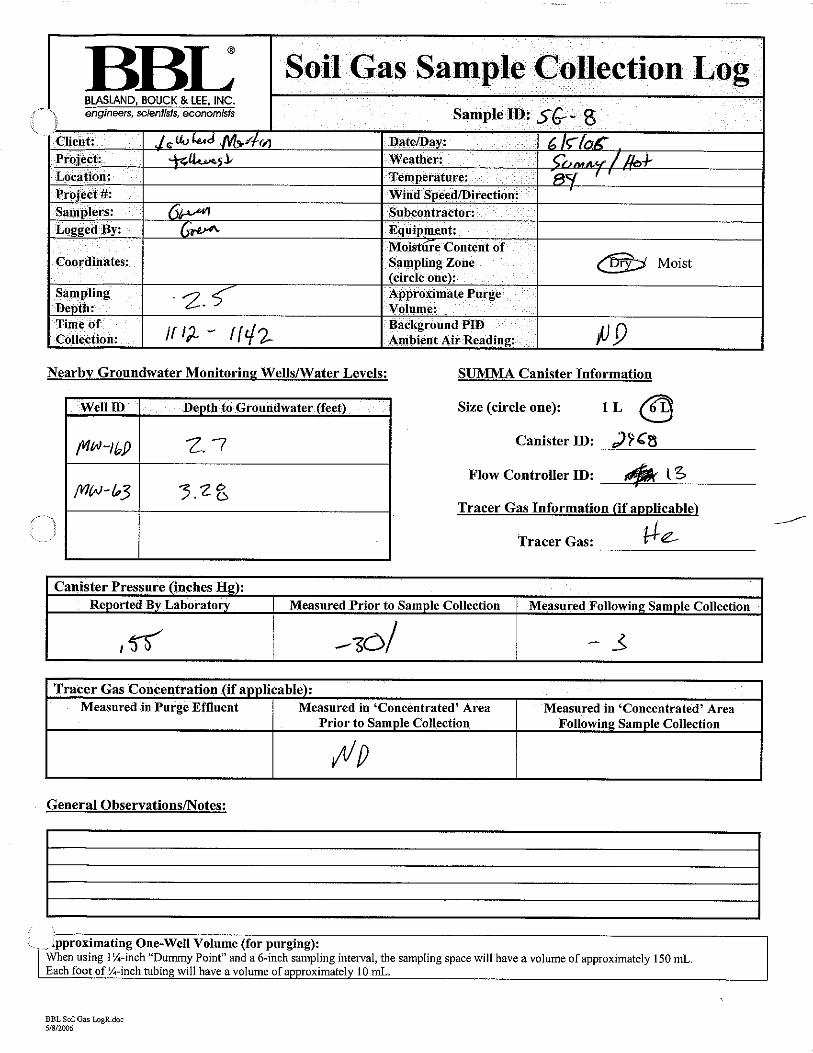


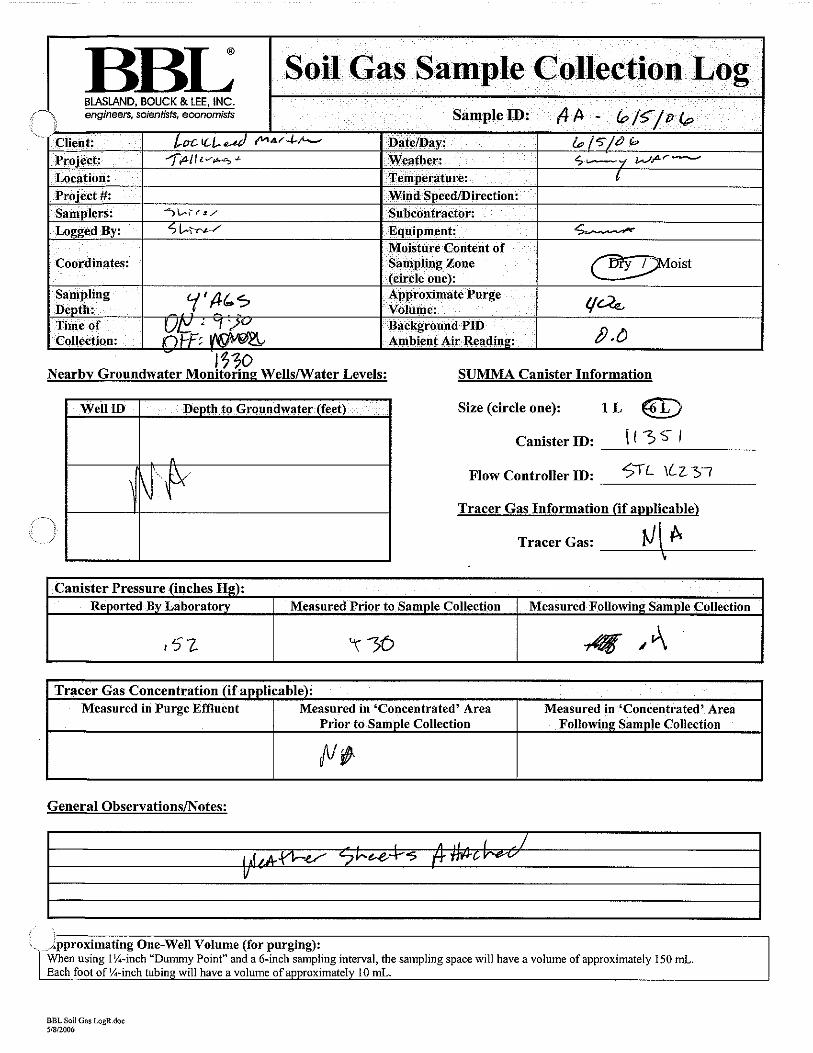


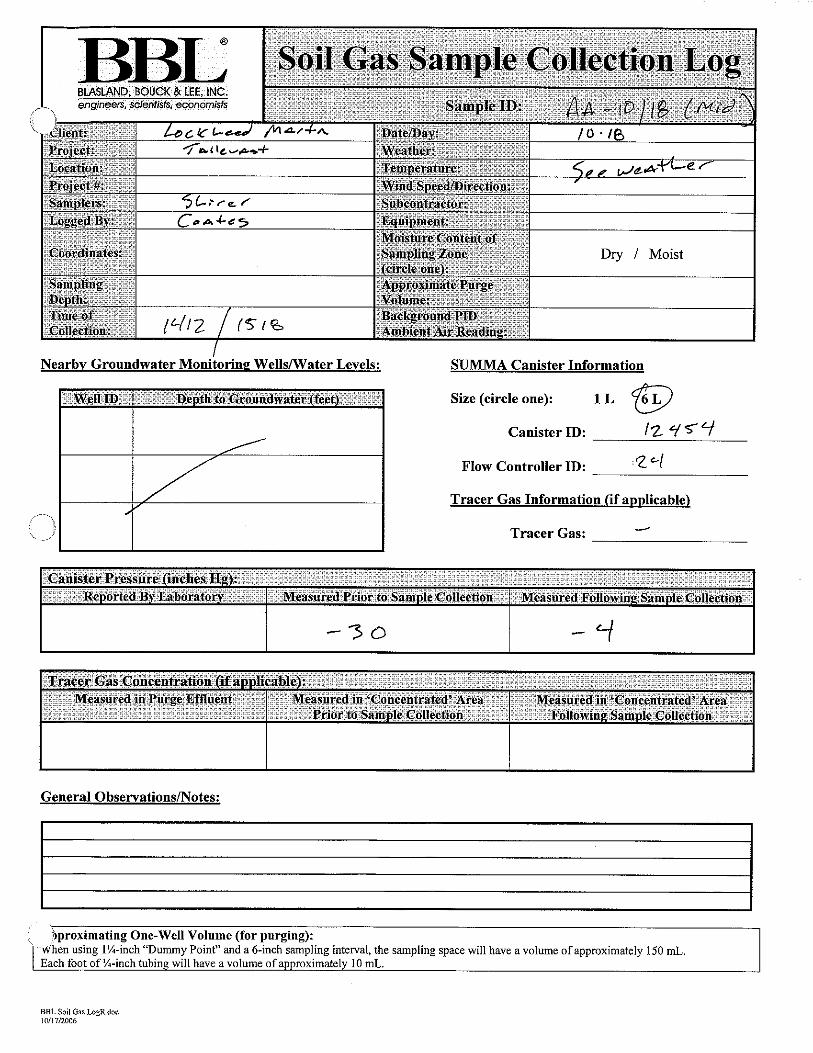


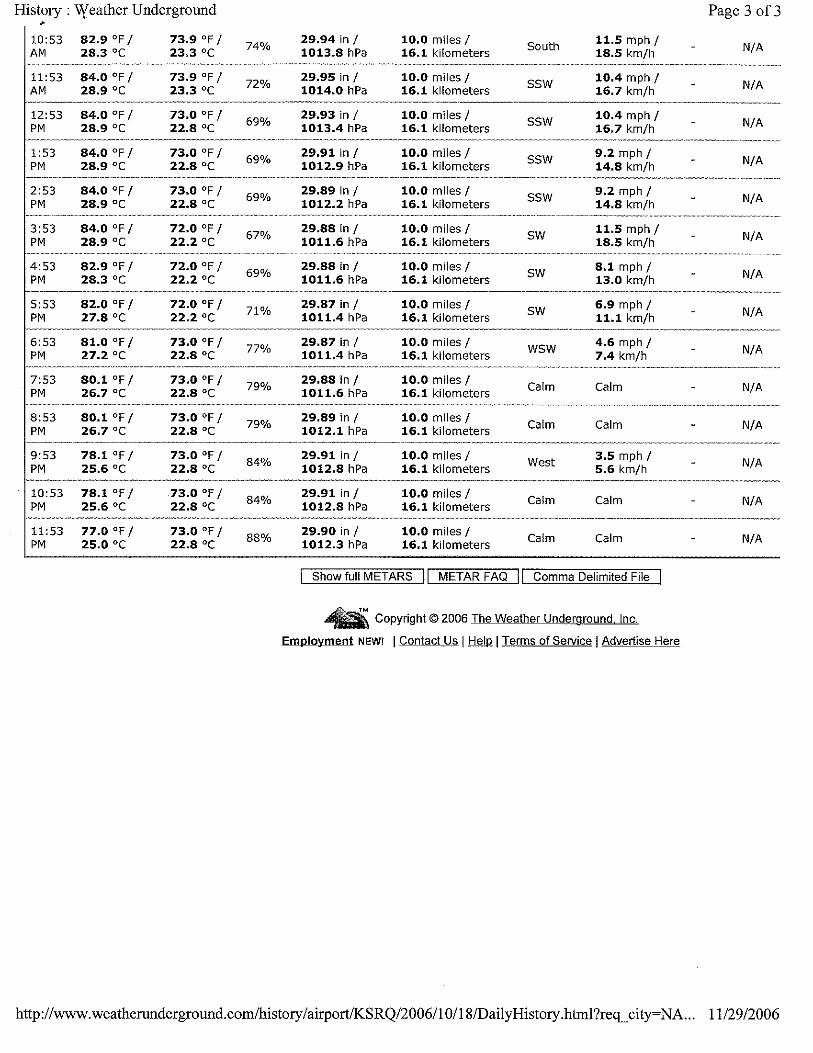

Appendix F
Johnson & Ettinger Model Results

DATA ENTRY SHEET
ENTER ENTER ENTERSoil Soil
Chemical gas OR gasCAS No. conc., conc.,
(numbers only, Cg Cg
no dashes) (μg/m3) (ppmv) Chemical
79016 1.20E+01 Trichloroethylene
ENTER ENTER ENTER ENTER ENTERDepth
MORE below grade Soil gas Vadose zone User-definedto bottom sampling Average SCS vadose zone
of enclosed depth soil soil type soil vaporspace floor, below grade, temperature, (used to estimate OR permeability,
LF Ls TS soil vapor kv
(15 or 200 cm) (cm) (oC) permeability) (cm2)
15 80 10 C
ENTER ENTER ENTER ENTER ENTERMORE Vandose zone Vadose zone Vadose zone Vadose zone Average vapor
SCS soil dry soil total soil water-filled flow rate into bldg.soil type bulk density, porosity, porosity, (Leave blank to calculate)
ρbA nV θw
V Qsoil
(g/cm3) (unitless) (cm3/cm3) (L/m)
SC 1.63 0.385 0.197 5
MOREENTER ENTER ENTER ENTER
Averaging Averagingtime for time for Exposure Exposure
carcinogens, noncarcinogens, duration, frequency,ATC ATNC ED EF(yrs) (yrs) (yrs) (days/yr)
70 30 30 350
END
Soil Gas Concentration Data
SG-SCREENVersion 3.1; 02/04
Reset to Defaults
Lookup Soil Parameters
1 of 1
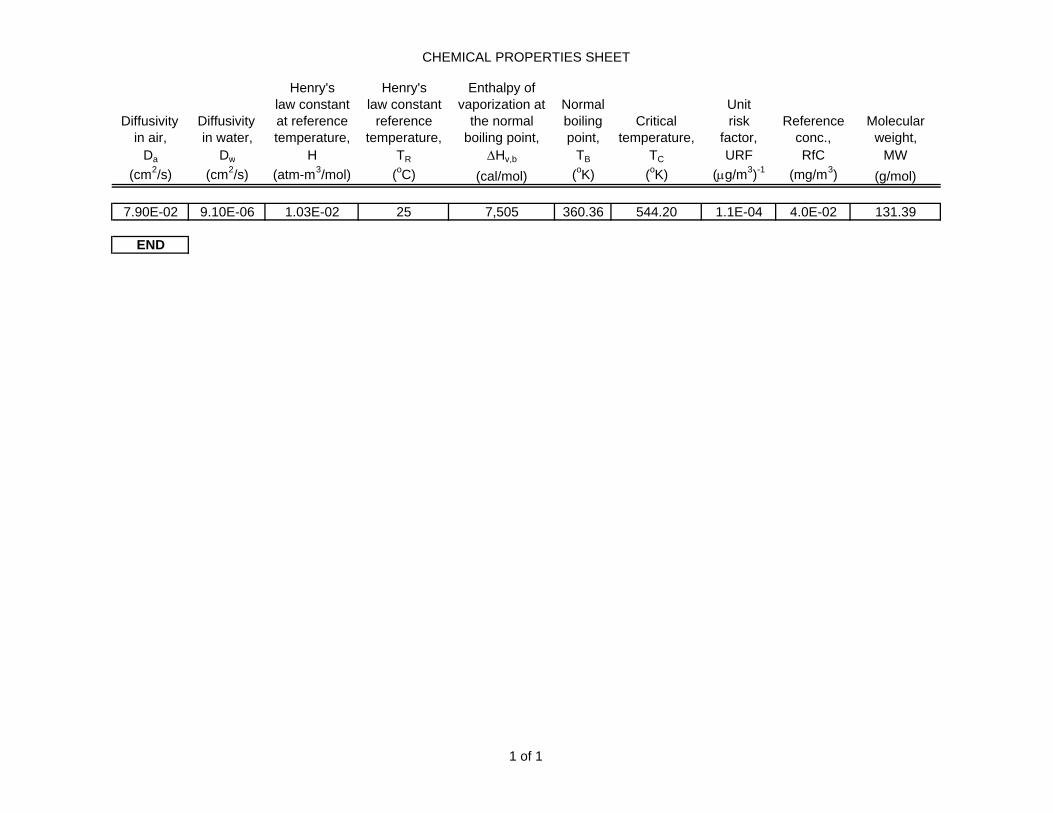
CHEMICAL PROPERTIES SHEET
Henry's Henry's Enthalpy oflaw constant law constant vaporization at Normal Unit
Diffusivity Diffusivity at reference reference the normal boiling Critical risk Reference Molecularin air, in water, temperature, temperature, boiling point, point, temperature, factor, conc., weight,
Da Dw H TR ΔHv,b TB TC URF RfC MW(cm2/s) (cm2/s) (atm-m3/mol) (oC) (cal/mol) (oK) (oK) (μg/m3)-1 (mg/m3) (g/mol)
7.90E-02 9.10E-06 1.03E-02 25 7,505 360.36 544.20 1.1E-04 4.0E-02 131.39
END
1 of 1

INTERMEDIATE CALCULATIONS SHEET
Vadose zone Vadose zone Vadose zone Vadose zone Vadose zone Floor-Source- soil effective soil soil soil wall Bldg.building air-filled total fluid intrinsic relative air effective vapor seam Soil ventilation
separation, porosity, saturation, permeability, permeability, permeability, perimeter, gas rate,LT θa
V Ste ki krg kv Xcrack conc. Qbuilding
(cm) (cm3/cm3) (cm3/cm3) (cm2) (cm2) (cm2) (cm) (μg/m3) (cm3/s)
65 0.188 0.345 2.26E-09 0.808 1.83E-09 4,000 1.20E+01 1.69E+04
Area of Vadoseenclosed Crack- Crack Enthalpy of Henry's law Henry's law Vapor zone
space to-total depth vaporization at constant at constant at viscosity at effective Diffusionbelow area below ave. soil ave. soil ave. soil ave. soil diffusion pathgrade, ratio, grade, temperature, temperature, temperature, temperature, coefficient, length,
AB η Zcrack ΔHv,TS HTS H'TS μTS DeffV Ld
(cm2) (unitless) (cm) (cal/mol) (atm-m3/mol) (unitless) (g/cm-s) (cm2/s) (cm)
1.00E+06 4.00E-04 15 8,557 4.78E-03 2.06E-01 1.75E-04 2.04E-03 65
Exponent of InfiniteAverage Crack equivalent source Infinite
Convection Source vapor effective foundation indoor sourcepath vapor Crack flow rate diffusion Area of Peclet attenuation bldg.
length, conc., radius, into bldg., coefficient, crack, number, coefficient, conc.,Lp Csource rcrack Qsoil Dcrack Acrack exp(Pef) α Cbuilding
(cm) (μg/m3) (cm) (cm3/s) (cm2/s) (cm2) (unitless) (unitless) (μg/m3)
15 1.20E+01 0.10 8.33E+01 2.04E-03 4.00E+02 #NUM! 1.35E-03 1.62E-02
Unitrisk Reference
factor, conc.,URF RfC
(μg/m3)-1 (mg/m3)
1.1E-04 4.0E-02
END
1 of 1
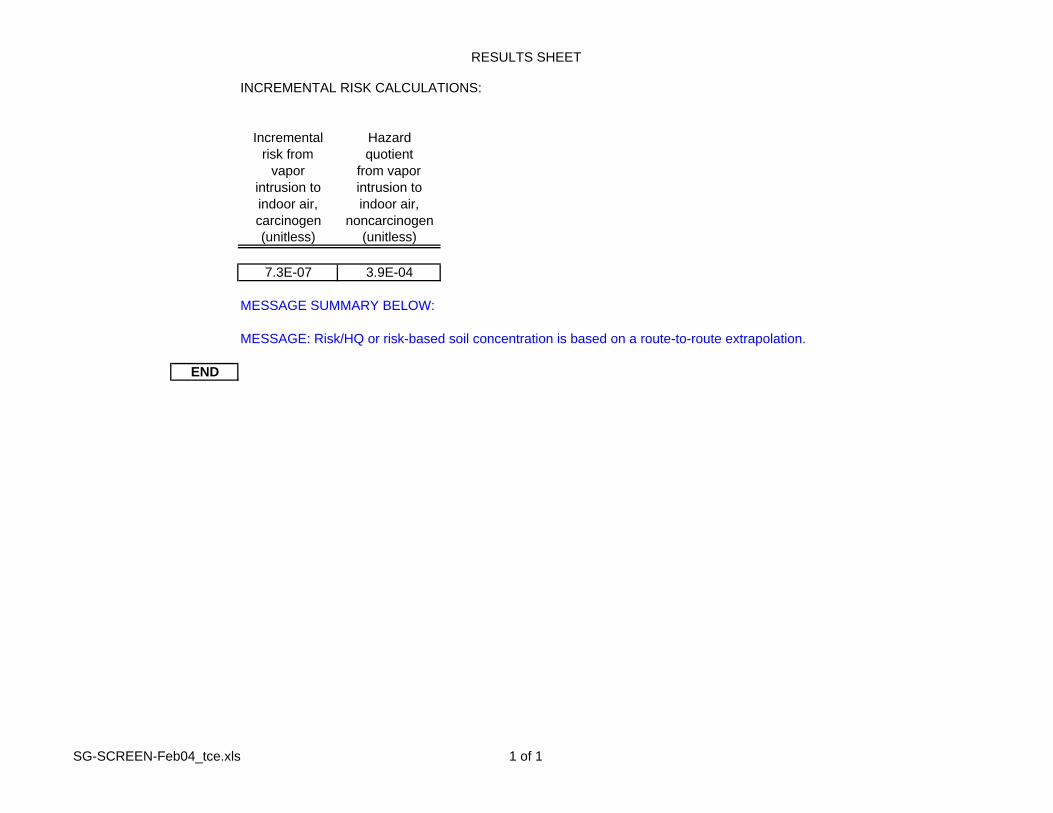
RESULTS SHEET
INCREMENTAL RISK CALCULATIONS:
Incremental Hazardrisk from quotient
vapor from vaporintrusion to intrusion toindoor air, indoor air,carcinogen noncarcinogen(unitless) (unitless)
7.3E-07 3.9E-04
MESSAGE SUMMARY BELOW:
MESSAGE: Risk/HQ or risk-based soil concentration is based on a route-to-route extrapolation.
END
SG-SCREEN-Feb04_tce.xls 1 of 1

DATA ENTRY SHEET
ENTER ENTER ENTERSoil Soil
Chemical gas OR gasCAS No. conc., conc.,
(numbers only, Cg Cg
no dashes) (μg/m3) (ppmv) Chemical
127184 1.13E+02 Tetrachloroethylene
ENTER ENTER ENTER ENTER ENTERDepth
MORE below grade Soil gas Vadose zone User-definedto bottom sampling Average SCS vadose zone
of enclosed depth soil soil type soil vaporspace floor, below grade, temperature, (used to estimate OR permeability,
LF Ls TS soil vapor kv
(15 or 200 cm) (cm) (oC) permeability) (cm2)
15 80 10 C
ENTER ENTER ENTER ENTER ENTERMORE Vandose zone Vadose zone Vadose zone Vadose zone Average vapor
SCS soil dry soil total soil water-filled flow rate into bldg.soil type bulk density, porosity, porosity, (Leave blank to calculate)
ρbA nV θw
V Qsoil
(g/cm3) (unitless) (cm3/cm3) (L/m)
SC 1.63 0.385 0.197 5
MOREENTER ENTER ENTER ENTER
Averaging Averagingtime for time for Exposure Exposure
carcinogens, noncarcinogens, duration, frequency,ATC ATNC ED EF(yrs) (yrs) (yrs) (days/yr)
70 30 30 350
END
Soil Gas Concentration Data
SG-SCREENVersion 3.1; 02/04
Reset to Defaults
Lookup Soil Parameters
1 of 1

CHEMICAL PROPERTIES SHEET
Henry's Henry's Enthalpy oflaw constant law constant vaporization at Normal Unit
Diffusivity Diffusivity at reference reference the normal boiling Critical risk Reference Molecularin air, in water, temperature, temperature, boiling point, point, temperature, factor, conc., weight,
Da Dw H TR ΔHv,b TB TC URF RfC MW(cm2/s) (cm2/s) (atm-m3/mol) (oC) (cal/mol) (oK) (oK) (μg/m3)-1 (mg/m3) (g/mol)
7.20E-02 8.20E-06 1.84E-02 25 8,288 394.40 620.20 5.9E-06 6.0E-01 165.83
END
1 of 1

INTERMEDIATE CALCULATIONS SHEET
Vadose zone Vadose zone Vadose zone Vadose zone Vadose zone Floor-Source- soil effective soil soil soil wall Bldg.building air-filled total fluid intrinsic relative air effective vapor seam Soil ventilation
separation, porosity, saturation, permeability, permeability, permeability, perimeter, gas rate,LT θa
V Ste ki krg kv Xcrack conc. Qbuilding
(cm) (cm3/cm3) (cm3/cm3) (cm2) (cm2) (cm2) (cm) (μg/m3) (cm3/s)
65 0.188 0.345 2.26E-09 0.808 1.83E-09 4,000 1.13E+02 1.69E+04
Area of Vadoseenclosed Crack- Crack Enthalpy of Henry's law Henry's law Vapor zone
space to-total depth vaporization at constant at constant at viscosity at effective Diffusionbelow area below ave. soil ave. soil ave. soil ave. soil diffusion pathgrade, ratio, grade, temperature, temperature, temperature, temperature, coefficient, length,
AB η Zcrack ΔHv,TS HTS H'TS μTS DeffV Ld
(cm2) (unitless) (cm) (cal/mol) (atm-m3/mol) (unitless) (g/cm-s) (cm2/s) (cm)
1.00E+06 4.00E-04 15 9,553 7.81E-03 3.36E-01 1.75E-04 1.86E-03 65
Exponent of InfiniteAverage Crack equivalent source Infinite
Convection Source vapor effective foundation indoor sourcepath vapor Crack flow rate diffusion Area of Peclet attenuation bldg.
length, conc., radius, into bldg., coefficient, crack, number, coefficient, conc.,Lp Csource rcrack Qsoil Dcrack Acrack exp(Pef) α Cbuilding
(cm) (μg/m3) (cm) (cm3/s) (cm2/s) (cm2) (unitless) (unitless) (μg/m3)
15 1.13E+02 0.10 8.33E+01 1.86E-03 4.00E+02 #NUM! 1.26E-03 1.42E-01
Unitrisk Reference
factor, conc.,URF RfC
(μg/m3)-1 (mg/m3)
5.9E-06 6.0E-01
END
1 of 1

RESULTS SHEET
INCREMENTAL RISK CALCULATIONS:
Incremental Hazardrisk from quotient
vapor from vaporintrusion to intrusion toindoor air, indoor air,carcinogen noncarcinogen(unitless) (unitless)
3.4E-07 2.3E-04
MESSAGE SUMMARY BELOW:
END
SG-SCREEN-Feb04_pce.xls 1 of 1

Appendix G
Pinellas County 2000 VOC Data Summary

Page 1 of 1
1/12/2007http://www.pinellascounty.org/Environment/webImages/VOC.gif