re-use of recycled materials in food contact applications
TRANSCRIPT

FED
ERA
L IN
STIT
UTE
FO
R R
ISK
ASS
ESSM
ENT Re-use of recycled materials in food
contact applications in the perspective of consumer protection
Karla Pfaff
Dr. Karla Pfaff, 2012-05-08, Riskcycle Page 2
Basic requirements for food contact materials
Regulation (EC) No 1935/2004 on materials and articles intended to come into contact with food Article 3 Materials and articles shall be manufactured in compliance with good manufacturing practice so that, under normal or foreseeable conditions of use, they do not transfer their constituents to food in quantities which could: (a) endanger human health; or (b) bring about an unacceptable change in the composition of the food; or (c) bring about a deterioration in the organoleptic characteristics thereof.
These requirements apply for virgin and recycled materials.
Dr. Karla Pfaff, 2012-05-08, Riskcycle Page 3
Safety of recycled materials in contact with food
- Contaminants which may be introduced by the presence of materials in the input stream which have not been manufactured for food contact applications.
- Incidental contaminants from previous uses including possible misuse.
- Chemicals used in the recycling process.
- Degradation products caused by multiple processing.
Risks associated with the use of recycled materials come from the possible migration of chemicals such as
Dr. Karla Pfaff, 2012-05-08, Riskcycle Page 4
Plastics recycling
Excluded are: - Materials and articles made with substances derived from chemical recycling (by
depolymerisation). - Recycled plastic materials and articles made from unused plastic production offcuts
and/or process scraps recycled within the manufacturing site. - Recycled plastics used behind a functional barrier.
Regulation 282/2008/EC on recycled plastic materials and articles intended to come into contact with foods
The recycled plastic materials and articles remain subject to Regulation 10/2011/EU on plastics for food contact.
Scope: Materials and articles intended to come into contact with food which contain recycled plastics.
Dr. Karla Pfaff, 2012-05-08, Riskcycle Page 5
Plastics recycling
Regulation 282/2008/EC
Principles: Individual authorisation of recycling processes based on an application and an
evaluation by the European Food Safety Authority (EFSA).
EFSA-guidance for the safety evaluation of recycling processes.
Starting material: Plastics manufactured according to Regulation 10/2011/EU.
Plastic input must originate from a closed product loop or it must be demonstrated e.g. in a challenge test, that the process is able to reduce any contamination of the plastic input to a concentration that does not pose a risk to human health.
Quality of plastic input (level of contamination) must be characterised and controlled in accordance with pre-established criteria.
Dr. Karla Pfaff, 2012-05-08, Riskcycle Page 6
Plastics recycling
Regulation 282/2008/EC
Principles: Quality assurance system for plastic recycling processes (e.g. quality control plans,
input and recycled plastic characterisation, suppliers’ qualification, sorting processes, washing processes, deep cleansing processes, critical control points, analytical protocols).
Community register of authorised recycling processes within the European community and in third countries.
Verification that the recycling process corresponds to the conditions of authorisation and that an effective quality assurance system is in place by official controls.
Dr. Karla Pfaff, 2012-05-08, Riskcycle Page 7
http://www.efsa.europa.eu/en/efsajournal/doc/717.pdf
EFSA Guidelines
Dr. Karla Pfaff, 2012-05-08, Riskcycle Page 8
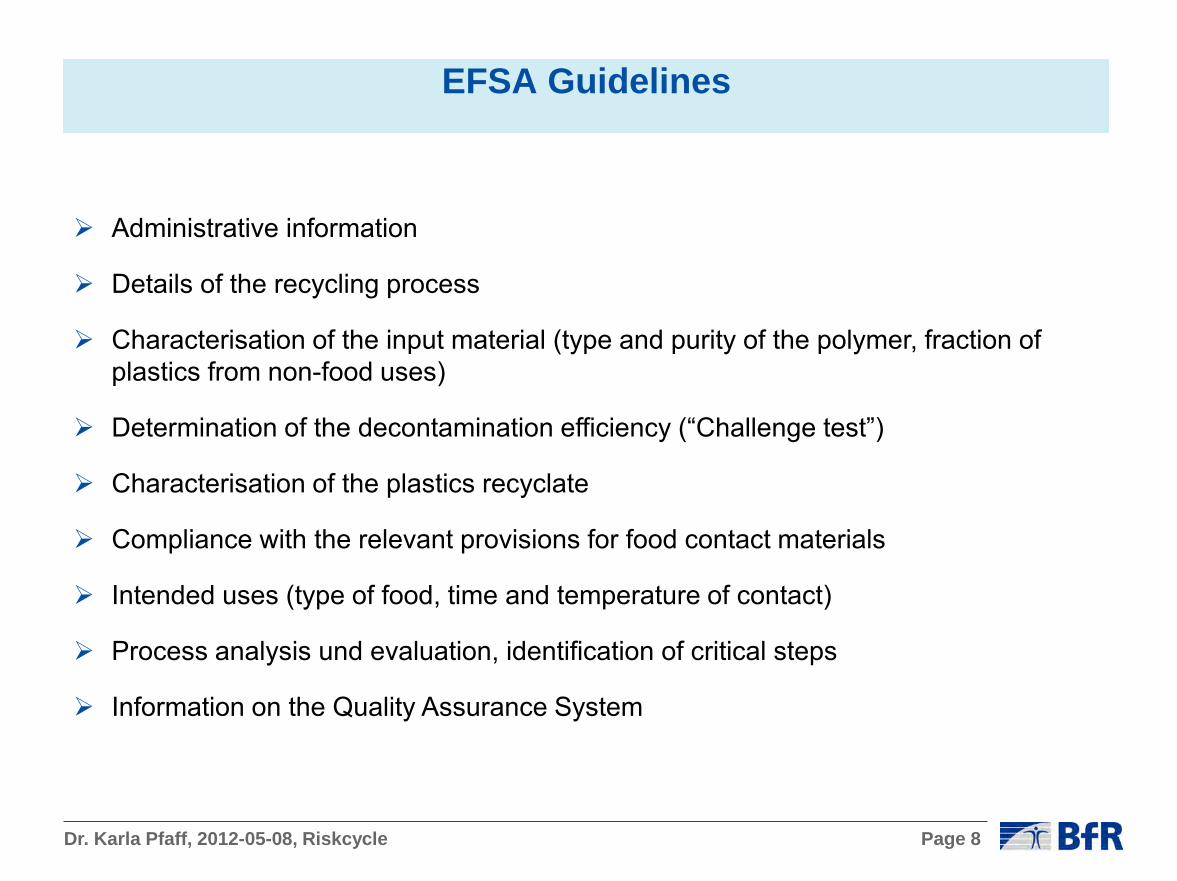
Administrative information
Details of the recycling process
Characterisation of the input material (type and purity of the polymer, fraction of plastics from non-food uses)
Determination of the decontamination efficiency (“Challenge test”)
Characterisation of the plastics recyclate
Compliance with the relevant provisions for food contact materials
Intended uses (type of food, time and temperature of contact)
Process analysis und evaluation, identification of critical steps
Information on the Quality Assurance System
EFSA Guidelines
Dr. Karla Pfaff, 2012-05-08, Riskcycle Page 9
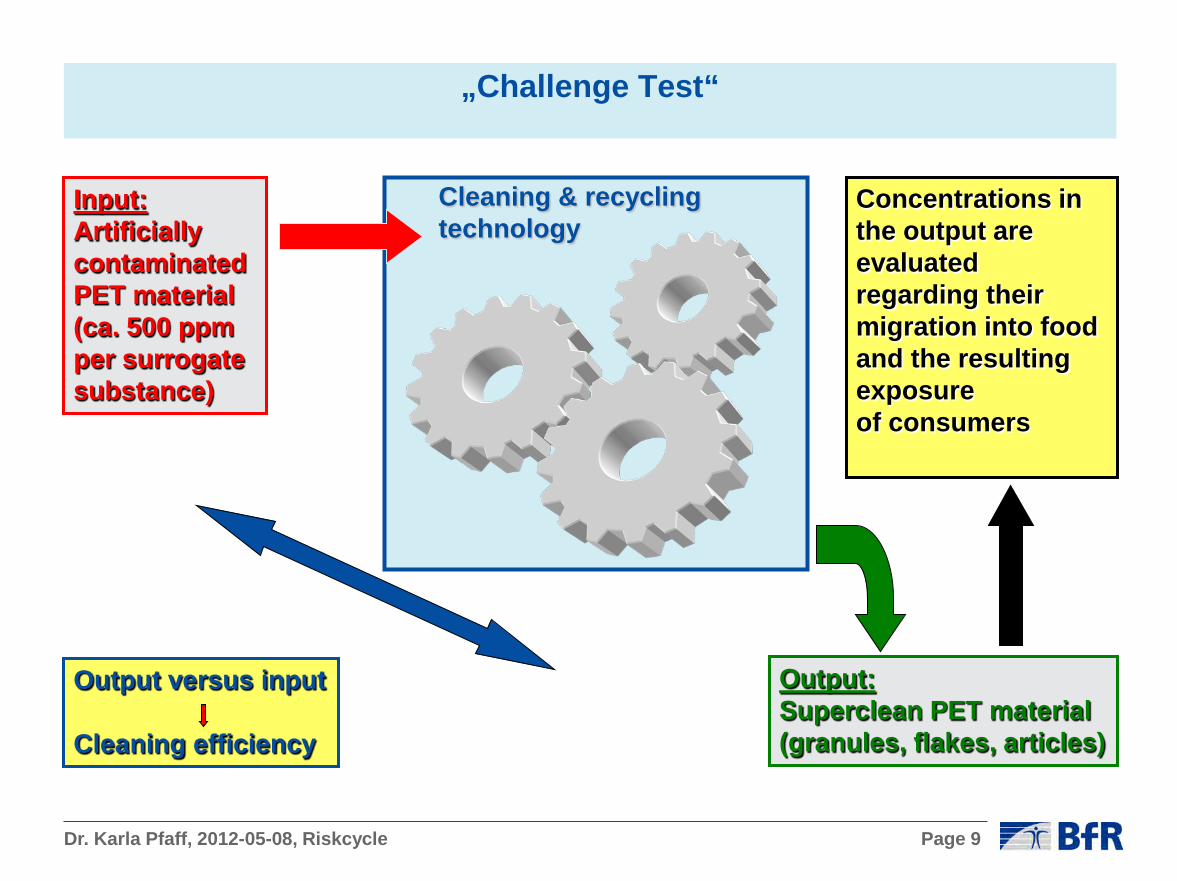
„Challenge Test“
Cleaning & recycling technology
Output: Superclean PET material (granules, flakes, articles)
Input: Artificially contaminated PET material (ca. 500 ppm per surrogate substance)
Concentrations in the output are evaluated regarding their migration into food and the resulting exposure of consumers
Output versus input Cleaning efficiency
Dr. Karla Pfaff, 2012-05-08, Riskcycle Page 10
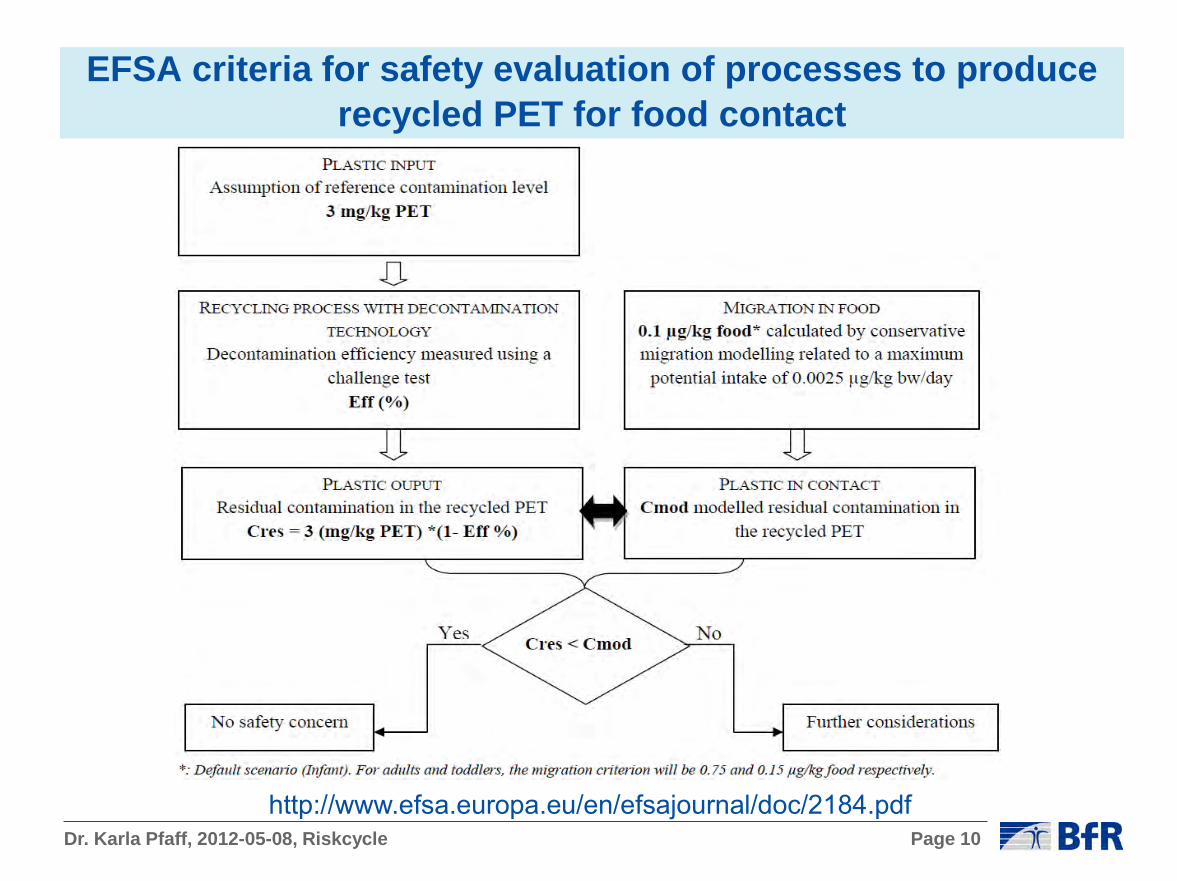
EFSA criteria for safety evaluation of processes to produce recycled PET for food contact
http://www.efsa.europa.eu/en/efsajournal/doc/2184.pdf
Dr. Karla Pfaff, 2012-05-08, Riskcycle Page 11
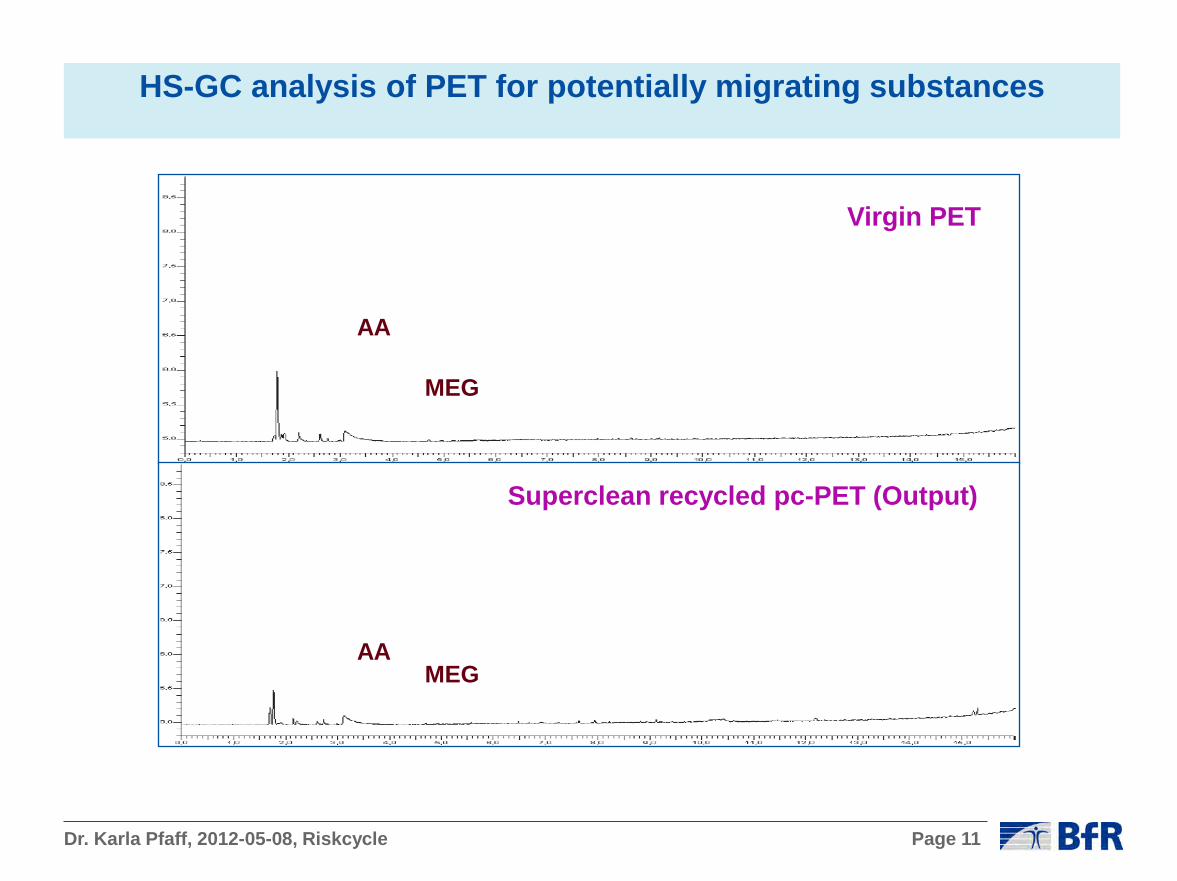
HS-GC analysis of PET for potentially migrating substances
AA
MEG
MEG AA
Virgin PET
Superclean recycled pc-PET (Output)
Dr. Karla Pfaff, 2012-05-08, Riskcycle Page 12
EU legislation has prompted 99 petitions for evaluation of recycling processes since 2009.
Dossiers arriving at EFSA are predominantly related to PET (ca. 95% ).
Suitability of recycled PET for re-use in food contact is in first instance based on its low diffusivity.
For PET recycling, processes with high decontamination efficacy are in place.
Plastics recycling

Dr. Karla Pfaff, 2012-05-08, Riskcycle Page 13
Specific legislation for use of paper and board in food contact is not available.
BfR recommendation XXXVI lists recycled fibres as raw material with specific
requirements laid down in an annex (e.g. migration limits for known contaminants).
Use of recycled fibres in hot filtration papers, baking paper and absorber pads is not foreseen according to the corresponding BfR recommendations.
Contamination of the recycling feedstock is caused e.g. by printing inks, glues, and
carbonless copy paper.
For dry, non-fatty foodstuffs having a large surface area (e.g. flour, semolina, rice, breakfast cereals, breadcrumbs), transfer of volatile and hydrophobic substances via the gas phase has to be considered particularly.
Recycling of paper and board

Dr. Karla Pfaff, 2012-05-08, Riskcycle Page 14
Recycling of paper and board
Case 1 - Di-isopropylnaphthalene (DIPN) Up to 120 mg/kg in recycled paper from use as solvent in carbonless copy paper
(CCP).
Transfer into food was detected up to 2 mg/kg (pasta, rice).
Levels in food are not of toxicological concern but present an unwanted contamination.
By joint action of health and environmental authorities as well as industry, contamination of recycled paper was decreased to 50 mg/kg on average. CCP as recovered paper grade is now separeted from the general input stream and is mainly recycled for sanitary papers.
Dr. Karla Pfaff, 2012-05-08, Riskcycle Page 15
Recycling of paper and board
Case 2 - Di-isobutylphthalate (DiBP) Up to 70 mg/kg in recycled paper from use as plasticiser in dispersion adhesives
used for instance in folding boxes and corrugated board for non-food applications and for print products.
Transfer into food was detected up to 5 mg/kg (pasta, rice).
Toxic for reproduction, SVHC candidate list, migration limit in food 0.3 mg/kg (BfR)
„Initiative for reduction of DiBP in paper and board“ was signed November 2007, joined by 9 industrial associations, addressed to the Federal Institute for Risk Assessment and the Federal Environment Agency.
No products which contain DiBP - in particular adhesives - should be used in all paper products in order to reach a reduction of the transfer of DiBP into food to a level of < 0.3 mg/kg until 2010. This limit applies from 2011.
Dr. Karla Pfaff, 2012-05-08, Riskcycle Page 16
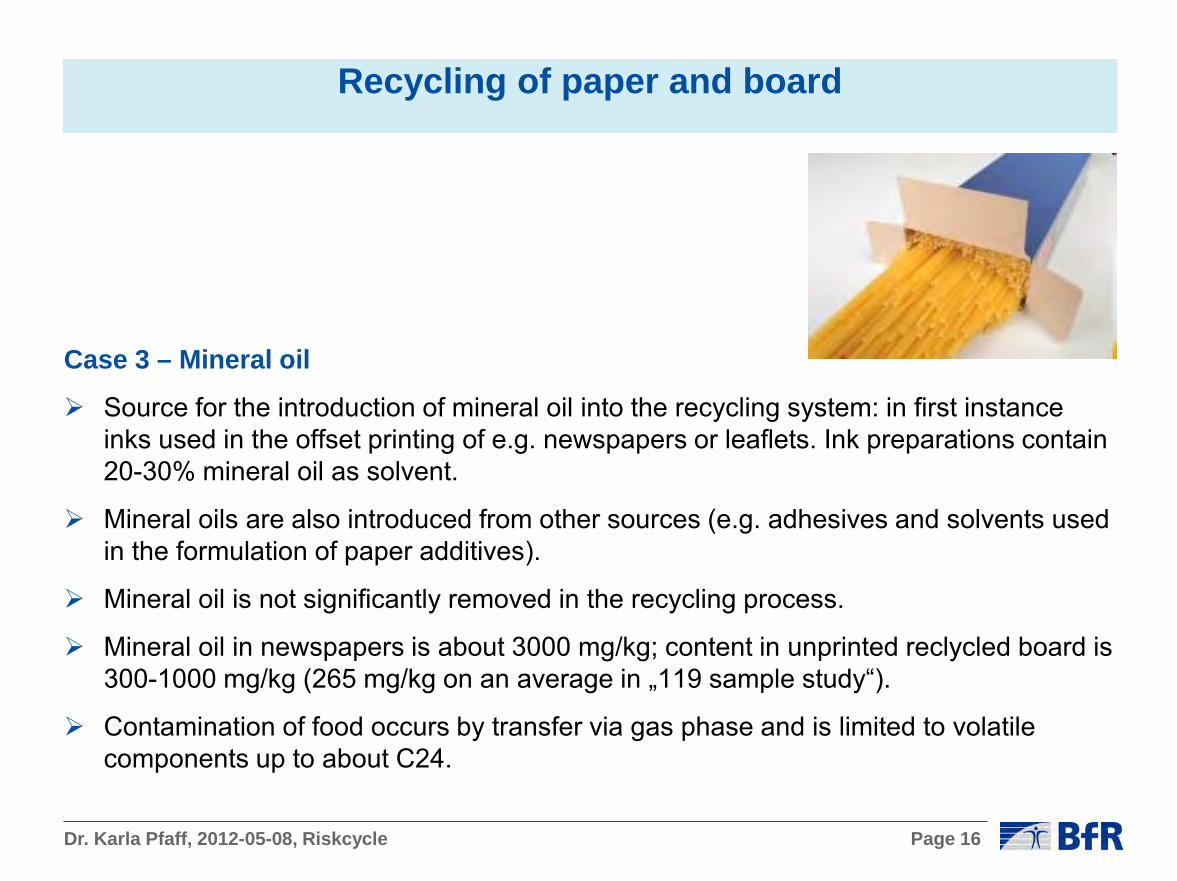
Recycling of paper and board
Case 3 – Mineral oil
Source for the introduction of mineral oil into the recycling system: in first instance inks used in the offset printing of e.g. newspapers or leaflets. Ink preparations contain 20-30% mineral oil as solvent.
Mineral oils are also introduced from other sources (e.g. adhesives and solvents used in the formulation of paper additives).
Mineral oil is not significantly removed in the recycling process.
Mineral oil in newspapers is about 3000 mg/kg; content in unprinted reclycled board is 300-1000 mg/kg (265 mg/kg on an average in „119 sample study“).
Contamination of food occurs by transfer via gas phase and is limited to volatile components up to about C24.
Dr. Karla Pfaff, 2012-05-08, Riskcycle Page 17
Mineral oil
Composition:
„Mineral Oil Saturated Hydrocarbons“ (MOSH) Paraffinic (open chain, mostly branched) and naphthenic (cyclic) hydrocarbons, distribution of chain length is centered at C17 – C19.
„Mineral Oil Aromatic Hydrocarbons“ (MOAH) 10 – 25 %, 1 – 4 aromatic rings, partly hydrogenated, mostly highly alkylated (> 97 %). Max. content in food: ( “119 sample study”, semolina) MOSH : 100 mg/kg MOAH: 16 mg/kg
Data on oral toxicology of the mineral oil mixture is not available.

Dr. Karla Pfaff, 2012-05-08, Riskcycle Page 18
Mineral oil
Toxicological data available for MOSH : Genotoxicity, sub/chronical toxicity, cancerogenicity, accumulation in the body.
Acceptable daily intakes (ADI) differ in several orders of magnitude. For the relevant fraction a temporary ADI of 0.01 mg/kg b.w. is available (JECFA). SCF (1995): http://ec.europa.eu/food/fs/sc/scf/reports/scf_reports_37.pdf, EFSA (2006): http://www.efsa.europa.eu/EFSA/efsa_locale-1178620753812_1178620770938.htm, JECFA (2002, 2009): http://whqlibdoc.who.int/trs/WHO_TRS_913.pdf
Toxicogical effects (inflammation, histiocytosis) were dependent on the viscosity (chain length) of the mineral oils and on their accumulation in the body. Accumulation was found in lymph nodes, liver and spleen after oral exposure (90 d-stuy on rats).
Temporary ADI is regularly exceeded by the transfer from recycled paper and board. Temporary ADI is regularly exceeded by the transfer from recycled paper and board.

Dr. Karla Pfaff, 2012-05-08, Riskcycle Page 19
Mineral oil
Toxicological data available for MOAH :
Toxicological evaluation and derivation of tolerable intake is not possible due to the lack of data. The reduction of the contamination is necessary.
Presence of aromatic hydrocarbons in mineral oils – in particular of polycyclic aromatic compounds – results in mutagenic and cancerogenic effects. (Doak et al., 1983; Roy et al., 1988)
Alkylated aromatic hydrocarbons are insufficiently investigated to date (insufficient data on genotoxicity, no oral studies on cancerogenicity). Data on occurence, metabolism and toxicological effects are limited to few congeners, only.
Alkylation of aromatic ring systems may influence metabolism and biological activity of the compounds and may result in different toxicological properties:
Some alkylated aromatics are known to be cancerogenic in animal experiments in contrary to their non alkylated aromatic homologues (LaVoie et al., 1985; Rice et al., 1987) or to have a much higher cancerogenic potency (Coombs et al., 1976).
Dr. Karla Pfaff, 2012-05-08, Riskcycle Page 20
Recycling of paper and board
Recycling processes are not efficient in removal of most contaminants.
Reduction strategies to minimise transfer of contaminants into food are needed.
Dr. Karla Pfaff, 2012-05-08, Riskcycle Page 21
Recycling of paper and board
Possible options:
Use of alternative packaging materials including the use of virgin fiber materials (in combination with suitable printing inks).
Restrictions in use of recycled paper and board (e.g. exclusion of direct contact with dry food having a high specific surface area).
Exclusion of newspapers as input material by sorting processes.
Phasing out printing inks containing mineral oils and switching to other kinds of printing inks (e.g. soya oil-based inks).
Improving cleaning efficiency in the recycling processes.
Use of functional barriers - Bag-in-Box systems i.e. inner bags with barrier function (e.g. PET, aluminum >7 µm) - Barrier coatings e.g. based on polyesters, polyacrylates, polyamides.

FED
ERA
L IN
STIT
UTE
FO
R R
ISK
ASS
ESSM
ENT Thank you for your attention
Dr. Karla Pfaff
Federal Institute for Risk Assessment Max-Dohrn-Str. 8 - 11 D-10589 Berlin www.bfr.bund.de [email protected] Tel. +49 30 18412 3669
© Fraunhofer IVV
Dr. Martin Schlummer, Dr. Andreas Mäurer Fraunhofer Institute IVV, Dep. Polymer Recycling, Freising
Fate of BFR during treatment of plastics from WEEE
© Fraunhofer IVV
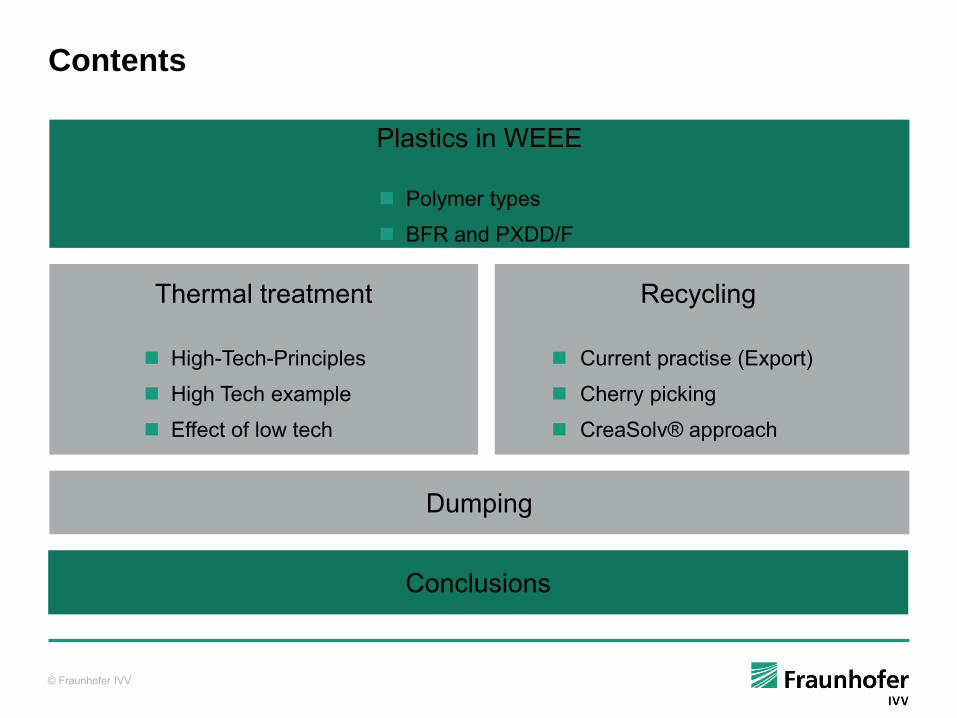
Contents
Plastics in WEEE
Polymer types
BFR and PXDD/F
Thermal treatment
High-Tech-Principles
High Tech example
Effect of low tech
Recycling
Current practise (Export)
Cherry picking
CreaSolv® approach
Dumping
Conclusions

© Fraunhofer IVV
Plastics in WEEE
Polymer share of WEEE rises
ABS, PS and PP are the dominating polymer types
Separation / recovery of plastics from WEEE is not state of the art
Dismantling fractions
Plastics Shred
Dimitrakakis, Janz, Bilitewski, Gidarakos (2009)
© Fraunhofer IVV
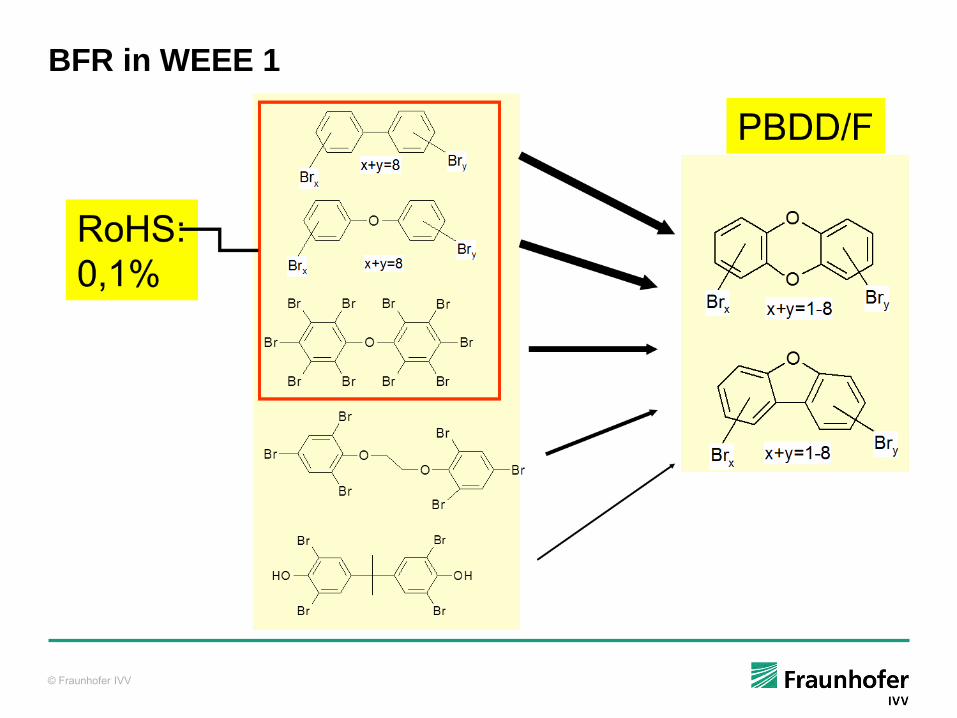
BFR in WEEE 1

© Fraunhofer IVV
Contaminants (BFR) in WEEE 2
No PBB anymore and decreasing amounts of OctaBDE
Data of a running screening project on BFR in WEEE plastics sampled in Nigeria still high shares of BFR materials
© Fraunhofer IVV
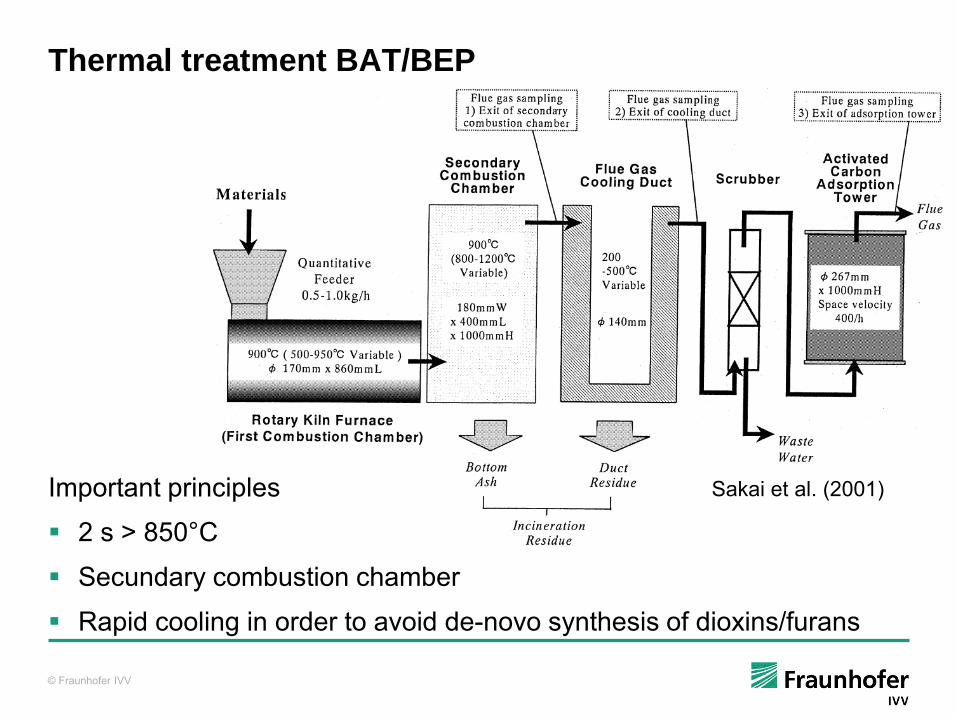
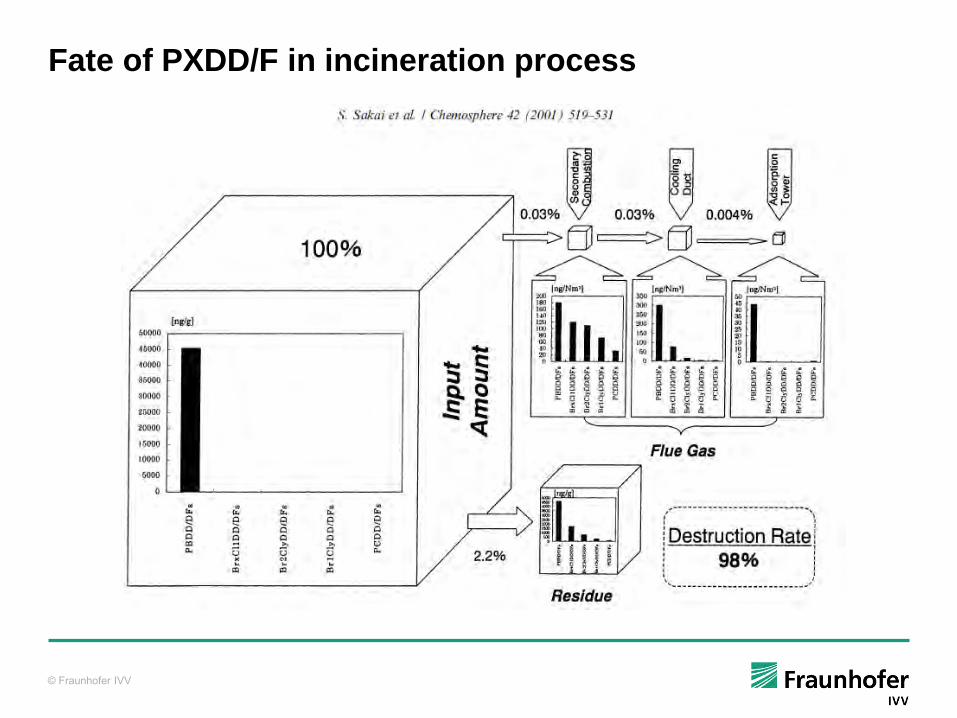
Thermal treatment BAT/BEP
Important principles
2 s > 850°C
Secundary combustion chamber
Rapid cooling in order to avoid de-novo synthesis of dioxins/furans
Sakai et al. (2001)

© Fraunhofer IVV
Thermal treatment BAT/BEP
Fate of BFR
>98%
Sakai et al. (2001)
© Fraunhofer IVV
Fate of PXDD/F in incineration process
© Fraunhofer IVV
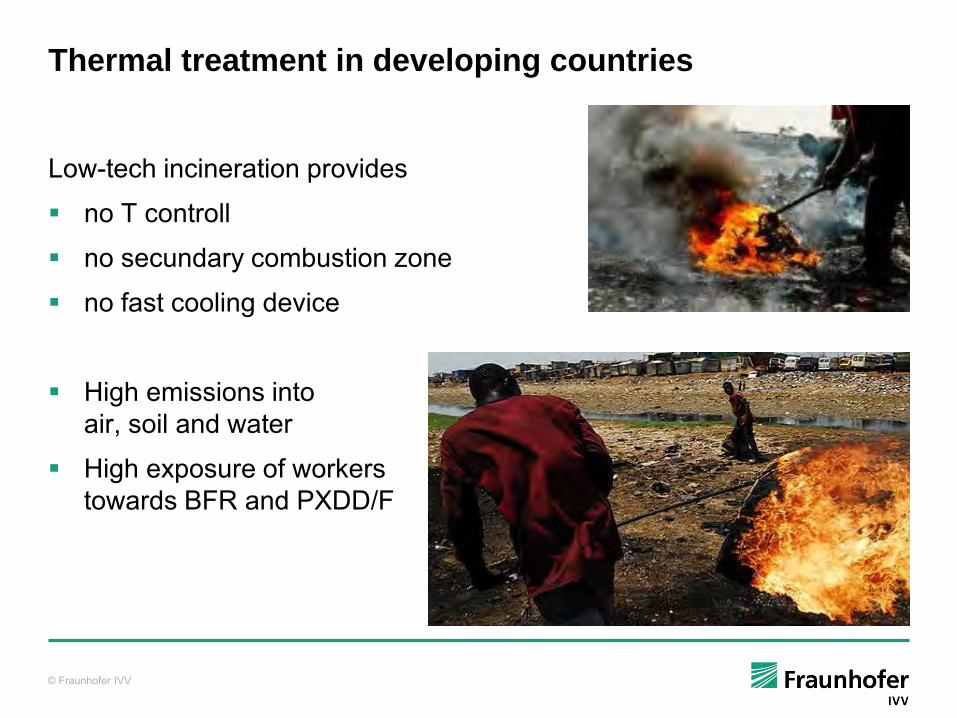
Thermal treatment in developing countries
Low-tech incineration provides
no T controll
no secundary combustion zone
no fast cooling device
High emissions into air, soil and water
High exposure of workers towards BFR and PXDD/F
© Fraunhofer IVV
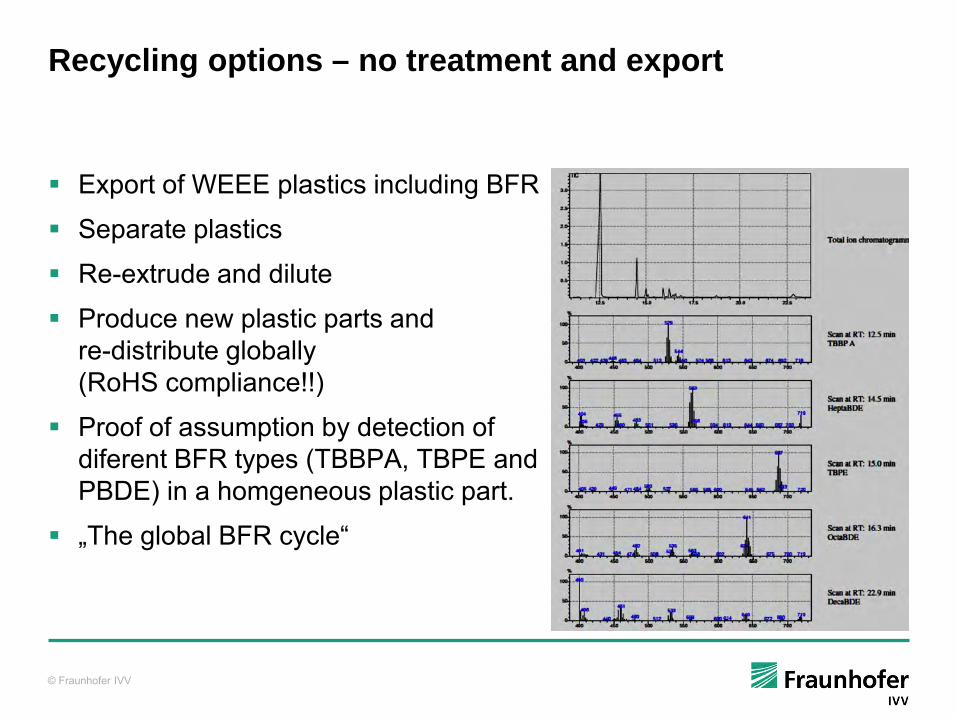
Recycling options – no treatment and export
Export of WEEE plastics including BFR
Separate plastics
Re-extrude and dilute
Produce new plastic parts and re-distribute globally (RoHS compliance!!)
Proof of assumption by detection of diferent BFR types (TBBPA, TBPE and PBDE) in a homgeneous plastic part.
„The global BFR cycle“

© Fraunhofer IVV
Recycling options – Cherry picking (BFR free)
Separation of BFR containing polymers (e.g. by density or X-ray): BFR increase density of base polymer if applied in percentage range (BFR elimination from TV sets ~95%)
Does not work to separate low BFR plastics (~1000 ppm bromine)
Low BFR fraction provides good quality and RoHS compliance
Treat BFR rich fraction (incineration or CreaSolv®) and recycle and distribute only the low BFR fraction
Option to take BFR out of the global BFR cycle
© Fraunhofer IVV
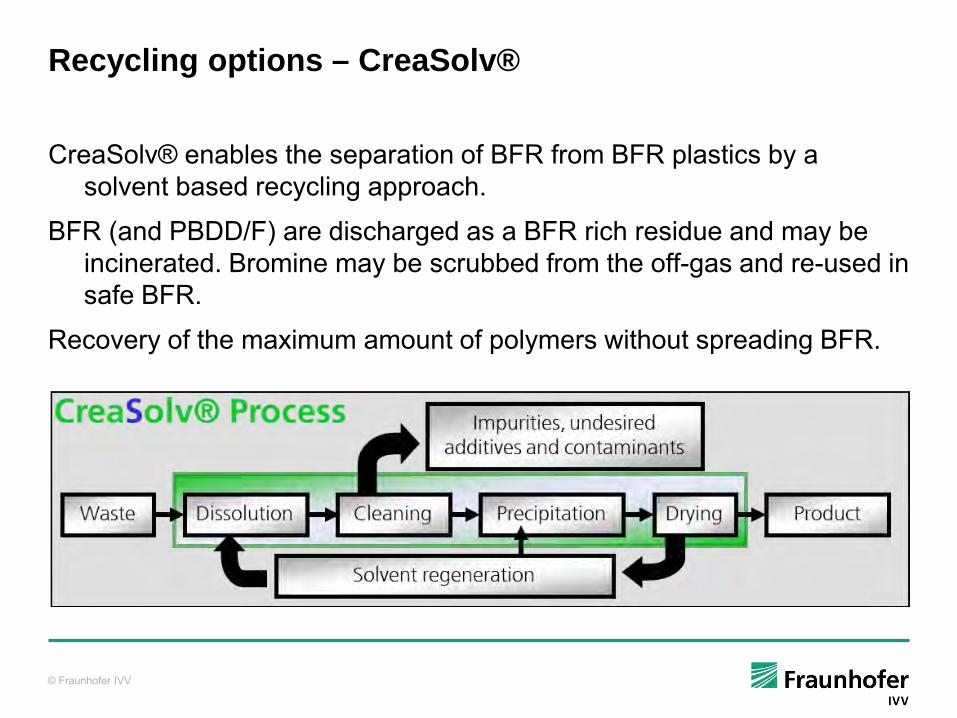
Recycling options – CreaSolv®
CreaSolv® enables the separation of BFR from BFR plastics by a solvent based recycling approach.
BFR (and PBDD/F) are discharged as a BFR rich residue and may be incinerated. Bromine may be scrubbed from the off-gas and re-used in safe BFR.
Recovery of the maximum amount of polymers without spreading BFR.

© Fraunhofer IVV
Recycling options – CreaSolv®
CreaSolv is not available at industrial scale
An external evaluation has shown that it is a profitable process at larger scale (5-10.000 tones per anno) (WRAP 2006)
Current project (PolyRessource) improves economy by
Optimising the pre-treatment
Changing batch process steps into continous ones
Technical upgrade of recycled polymers
Test of recyclates with 2 OEMs
© Fraunhofer IVV
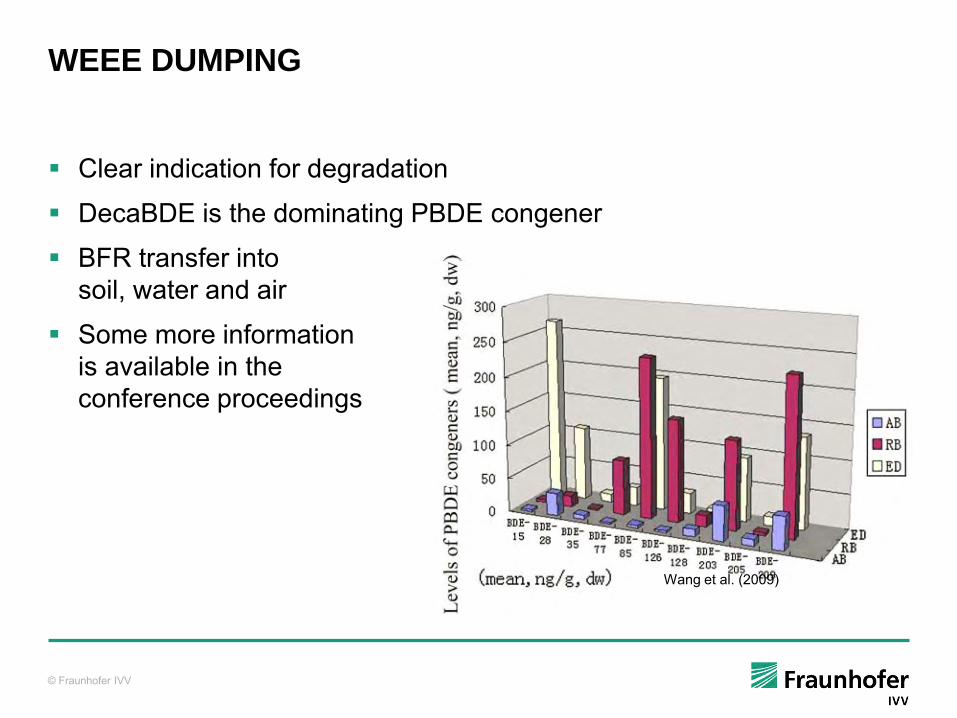
WEEE DUMPING
Clear indication for degradation
DecaBDE is the dominating PBDE congener
BFR transfer into soil, water and air
Some more information is available in the conference proceedings
Wang et al. (2009)
© Fraunhofer IVV
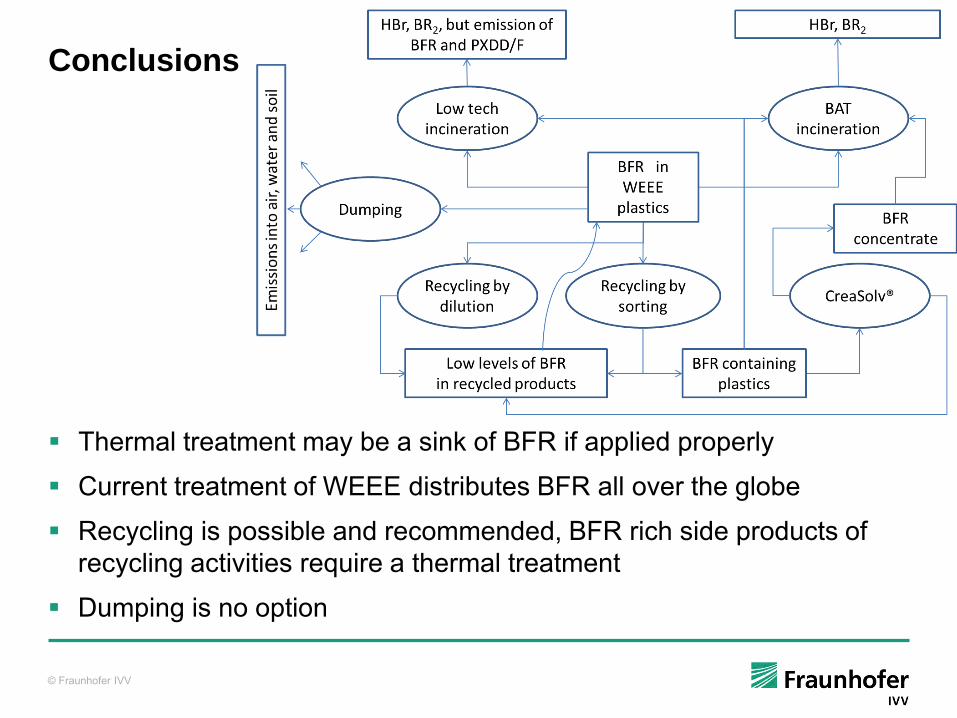
Conclusions
Thermal treatment may be a sink of BFR if applied properly
Current treatment of WEEE distributes BFR all over the globe
Recycling is possible and recommended, BFR rich side products of recycling activities require a thermal treatment
Dumping is no option

© Fraunhofer IVV
Thank you very much for your attention !!
Fraunhofer IVV
Literature:
Guidelines on Best Available Techniques and Best Environmental Practice for the Recycling and Disposal of Articles containing Polybrominated Diphenyl Ethers (PBDEs) under the Stockholm Convention on Persistent Organic Pollutants. UNEP 2012. Draft circulating
Chicago Tribune
Qualitative and quantitative determination of antioxidants and UV-stabilizers in recycled
plastics, before and after recycling
Momina Bibi Swedish Environmental Research Institute
[Momina Bibi]
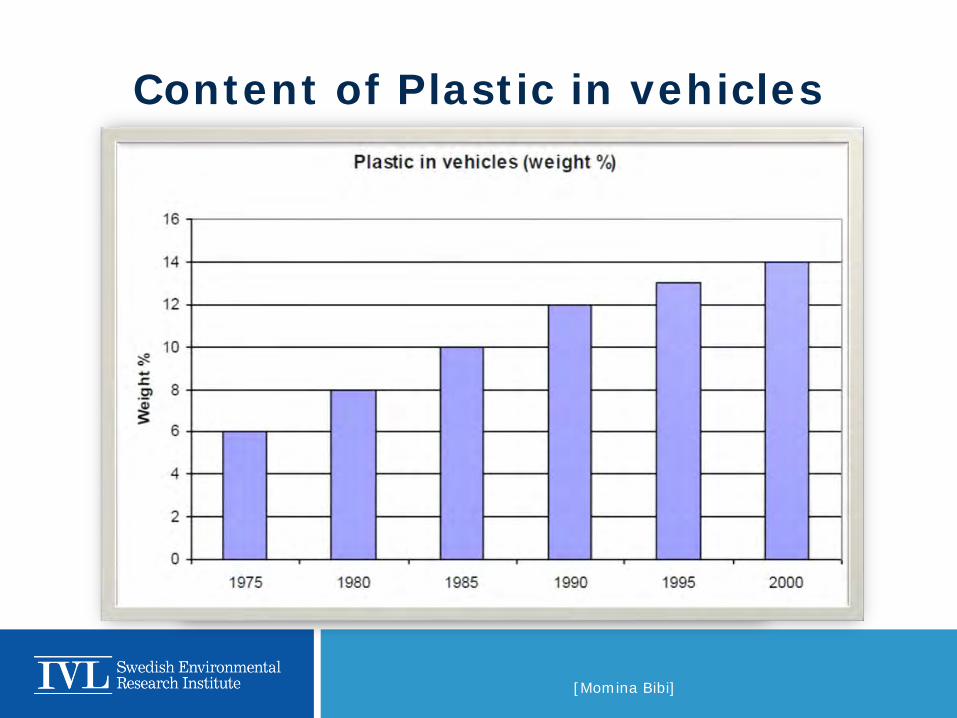
Content of Plastic in vehicles
[Momina Bibi]
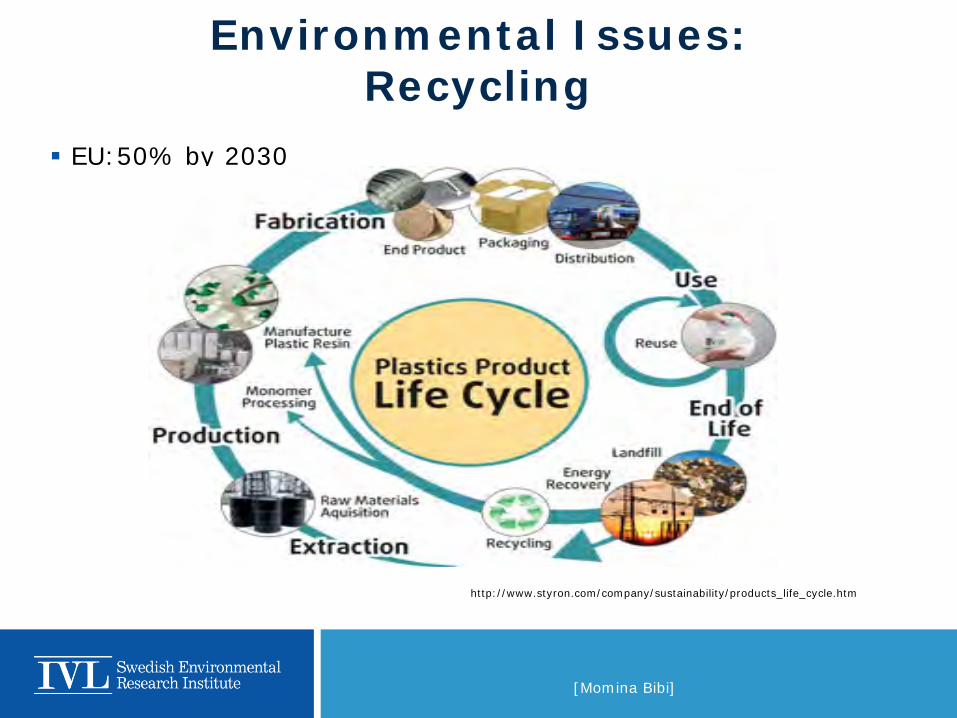
EU:50% by 2030
http://www.styron.com/company/sustainability/products_life_cycle.htm
Environmental Issues: Recycling
[Momina Bibi]
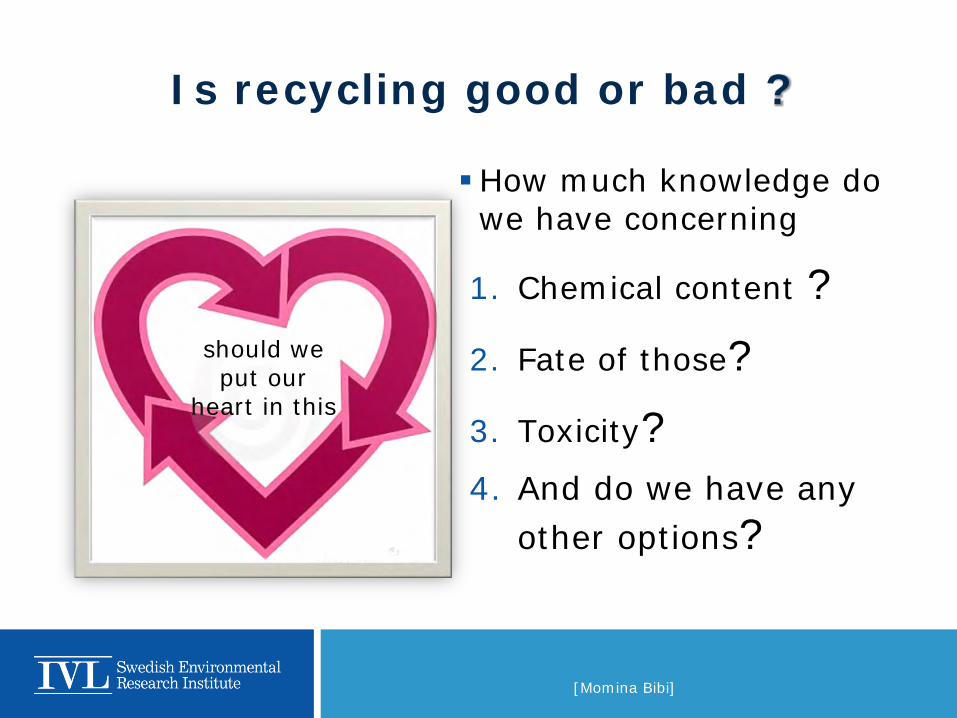
How much knowledge do we have concerning
1. Chemical content ? 2. Fate of those? 3. Toxicity? 4. And do we have any
other options?
Is recycling good or bad ?
should we put our
heart in this
[Momina Bibi]
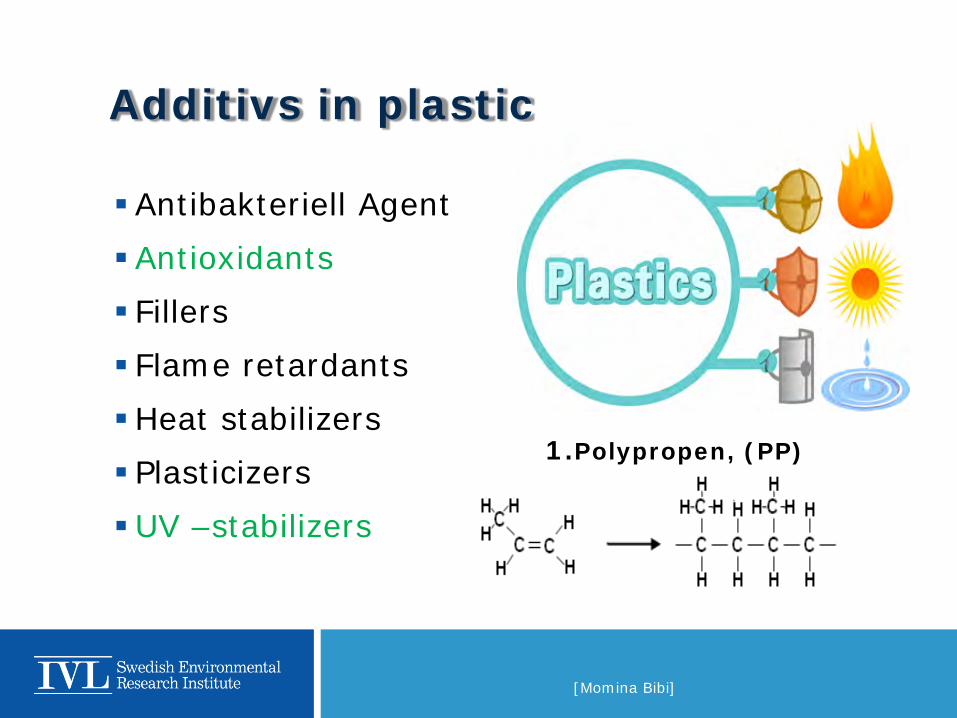
Antibakteriell Agent Antioxidants Fillers Flame retardants Heat stabilizers Plasticizers UV –stabilizers
Additivs in plastic
1.Polypropen, (PP)

[Momina Bibi]
Compounds MW g/mol
LogKow Mode of action
BHA 180,3 3,2 antioxidant
BHT 220,4 5,3 antioxidant
BHT-CHO 234,3 4,4 antioxidant metabolite
Cyanox 1790 699,9 10 antioxidant
Irgafos 168 646,9 15,5 antioxidant
Irganox 1010 1 177,6 19,4 antioxidant
Irganox 1076 530,9 13,8 antioxidant
Lowinox 358,5 7,4 antioxidant
Quinone 220,3 3,4 antioxidant metabolite
Tinuvin 123 737,2 <10 UV-stabilizer
Tinuvin 770 480,7 6,3 UV-stabilizer
Tinuvin 99-2 451,6 7,3 UV-stabilizer
Antioxidants and UV stabilizers
Tinuvin123
Tinuvin770
Tinuvin99-2
BHT
Quinone
BHT-CHO
BHA
Cyanox1790
Irganox1076
Irganox1010
Irgafos168
Lowinox
[Momina Bibi]
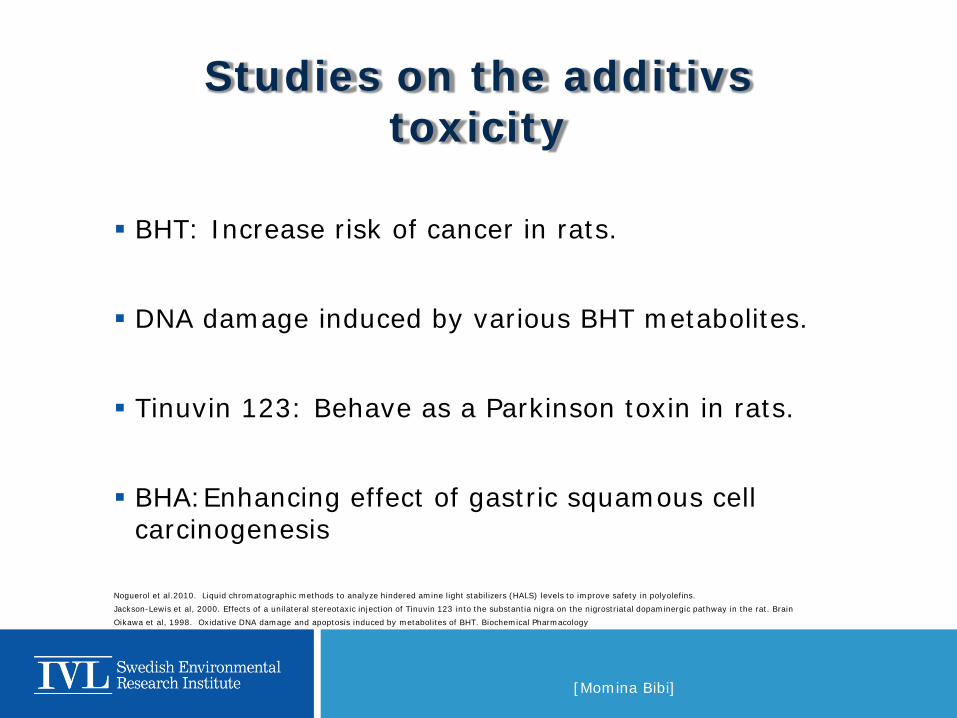
BHT: Increase risk of cancer in rats. DNA damage induced by various BHT metabolites. Tinuvin 123: Behave as a Parkinson toxin in rats. BHA:Enhancing effect of gastric squamous cell
carcinogenesis
Noguerol et al.2010. Liquid chromatographic methods to analyze hindered amine light stabilizers (HALS) levels to improve safety in polyolefins. Jackson-Lewis et al, 2000. Effects of a unilateral stereotaxic injection of Tinuvin 123 into the substantia nigra on the nigrostriatal dopaminergic pathway in the rat. Brain Oikawa et al, 1998. Oxidative DNA damage and apoptosis induced by metabolites of BHT. Biochemical Pharmacology
Studies on the additivs toxicity
[Momina Bibi]
Fate of antioxidants and UV-stabilizers. . In Polypropen polymer Development of the extraction method . Compare two different extraction methods Development of the analytical method . Qualitative and quantitative
Purpose of the study
[Momina Bibi]
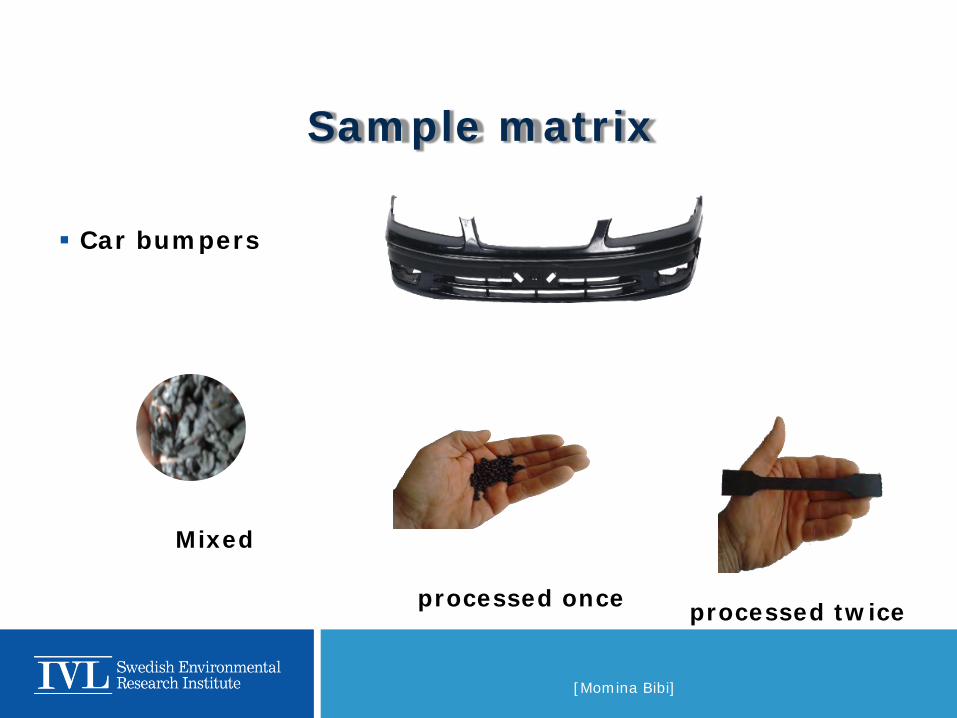
Car bumpers
Sample matrix
processed once processed twice
Mixed

[Momina Bibi]
Repeatability and reproducibility: Instrument LC-ESI-MS/MS Extraction methods UAE,MAE
Limit of detection and Limit of quantitation: LOD 0,008-3,6 ng/ml LOQ 0,018-8,5 ng/ml
Recovery: Instrument Extraction method
METHOD VALIDATION

[Momina Bibi]
Microwave-Assisted Extraction (MAE)
Ultrasonic Assisted Extraction (UAE)
Analytical method for extraction
[Momina Bibi]
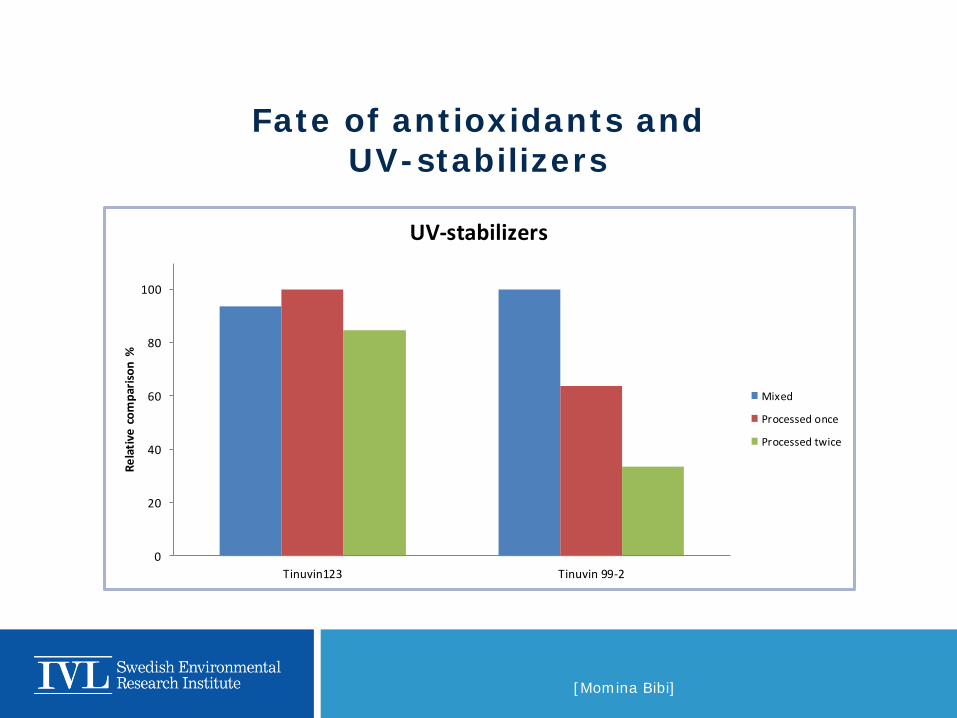
Fate of antioxidants and UV-stabilizers
0
20
40
60
80
100
Tinuvin123 Tinuvin 99-2
Rela
tive
com
paris
on %
UV-stabilizers
Mixed
Processed once
Processed twice
[Momina Bibi]
Fate of antioxidants and UV-stabilizers
0
20
40
60
80
100
120
Cyanox 1790 BHA
Rela
tive
com
paris
on %
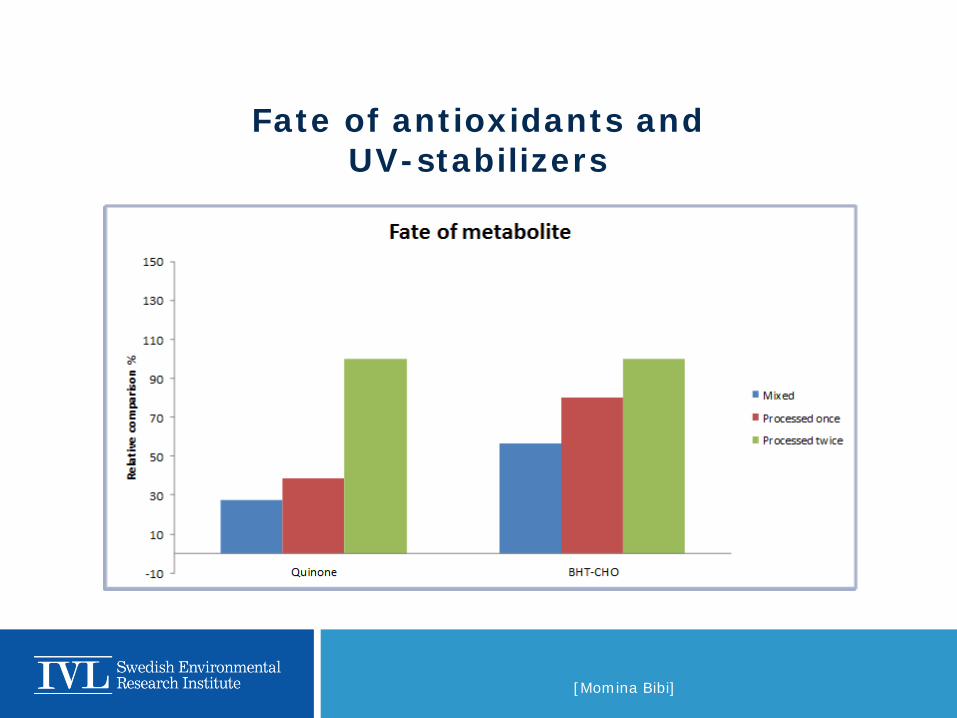
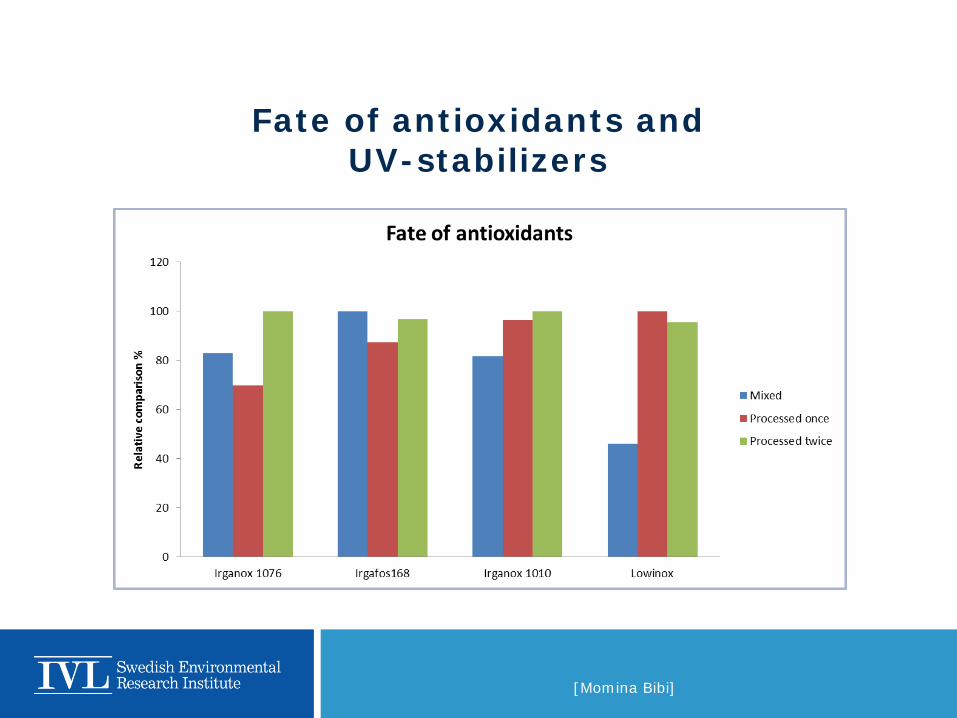
Fate of antioxidants
Mixed
Processed once
Processed twice
[Momina Bibi]
Fate of antioxidants and UV-stabilizers

[Momina Bibi]
Quantity of antioxidants and UV-stabilizers in processed plastic
32%
27%
8%
30%
2% 1%
ug/g plastic
Tinuvin 99-2
Irganox 1076
Irganox 1010
Irgafos168
BHT-CHO
Lowinox
93%
2% 4%
1%
ng/g plastic
Quinone
BHA
Cyanox 1790
Tinuvin 123

[Momina Bibi]
Emissions to air
0,000
0,100
0,200
0,300
0,400
0,500
0,600
0,700
Quinone BHT-CHO Cyanox 1790 Irganox 1076 Irganox 1010 BHA Lowinox
ng/g
pla
stic
h-1
Flow rate: 500ml/min Temperature: 35°C Plastics: car bumpers 2
[Momina Bibi]
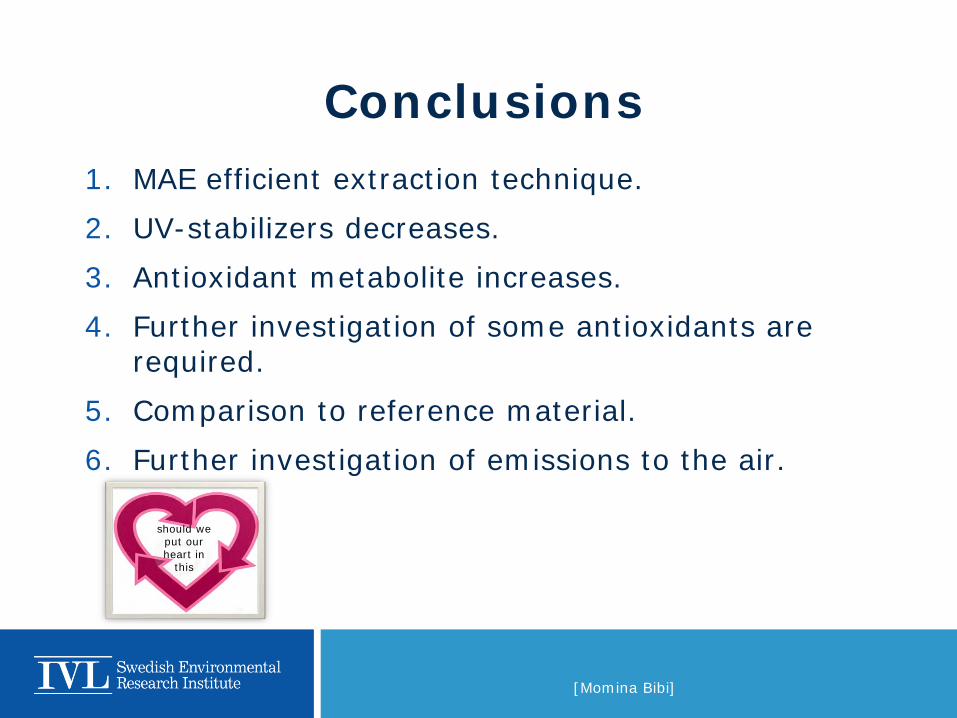
1. MAE efficient extraction technique. 2. UV-stabilizers decreases. 3. Antioxidant metabolite increases. 4. Further investigation of some antioxidants are
required. 5. Comparison to reference material. 6. Further investigation of emissions to the air.
Conclusions
should we put our heart in
this
[Momina Bibi]

[Momina Bibi]
Experimental design for optimization by MOODE Variables Response 1.Time (min) Area/Conc. 2. Temperature 3. Solvent %
Extraction was challenging task
[Momina Bibi]
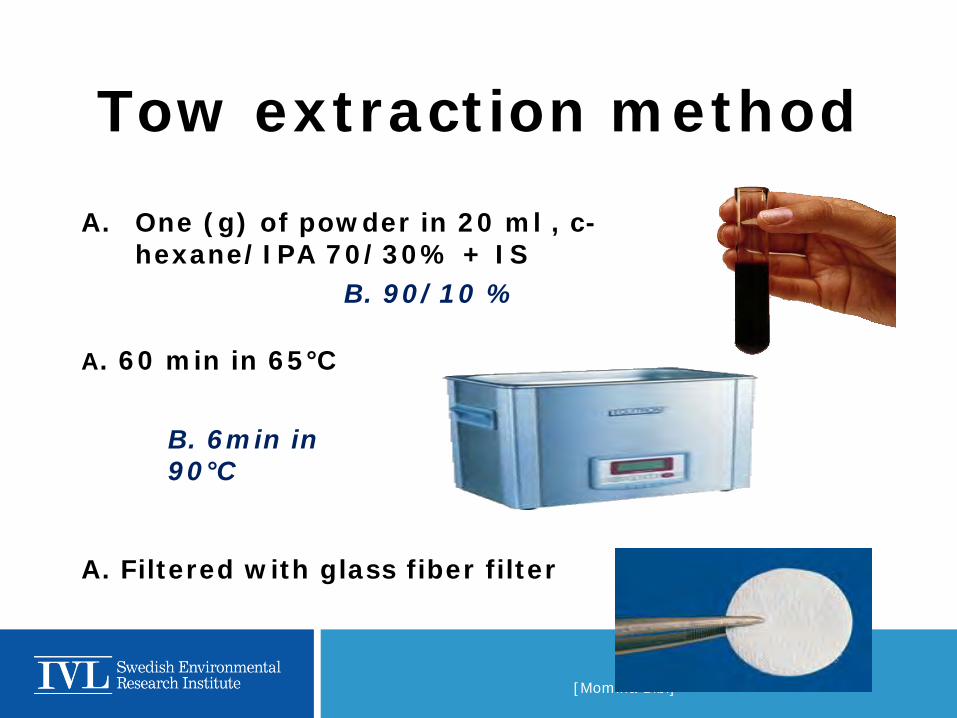
Tow extraction method A. One (g) of powder in 20 ml , c-
hexane/IPA 70/30% + IS
A. 60 min in 65°C
A. Filtered with glass fiber filter
B. 90/10 %
B. 6min in 90°C
[Momina Bibi]
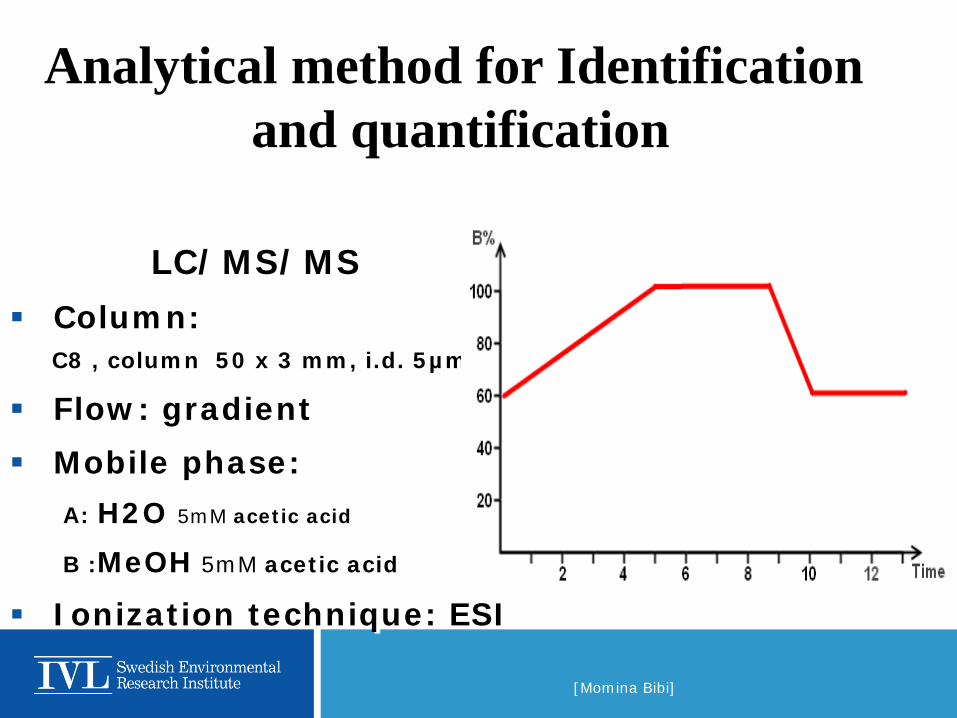
LC/MS/MS Column: C8 , column 50 x 3 mm, i.d. 5µm
Flow: gradient Mobile phase: A: H2O 5mM acetic acid
B :MeOH 5mM acetic acid
Ionization technique: ESI
Analytical method for Identification and quantification
[Momina Bibi]
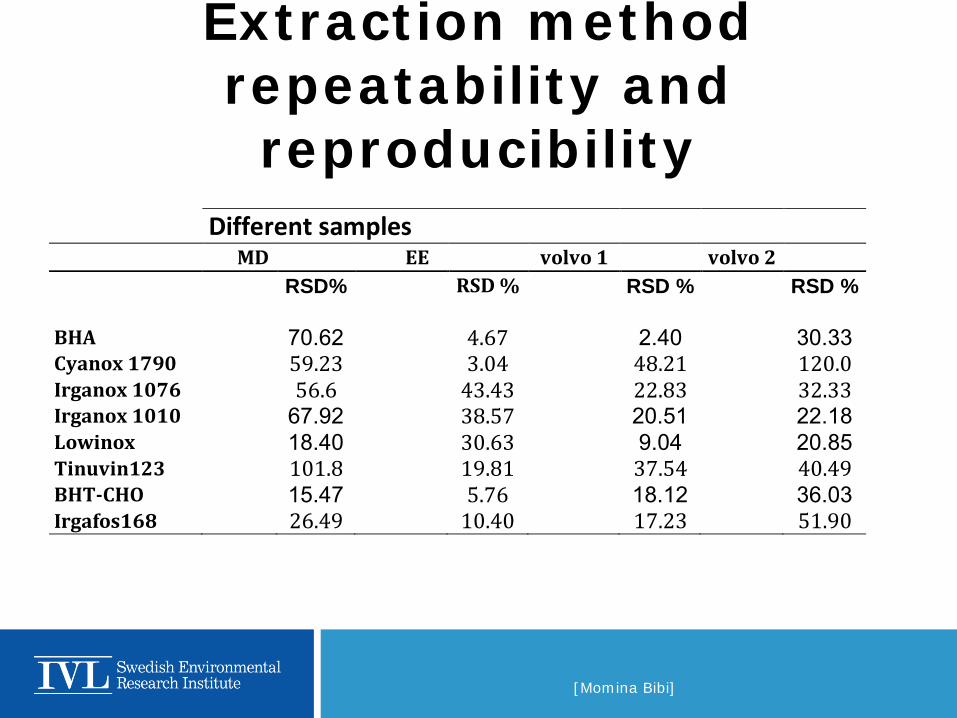
Extraction method repeatability and reproducibility
Different samples
MD EE volvo 1 volvo 2
RSD% RSD % RSD % RSD % BHA 70.62 4.67 2.40 30.33 Cyanox 1790 59.23 3.04 48.21 120.0 Irganox 1076 56.6 43.43 22.83 32.33 Irganox 1010 67.92 38.57 20.51 22.18 Lowinox 18.40 30.63 9.04 20.85 Tinuvin123 101.8 19.81 37.54 40.49 BHT-CHO 15.47 5.76 18.12 36.03 Irgafos168 26.49 10.40 17.23 51.90
[Momina Bibi]
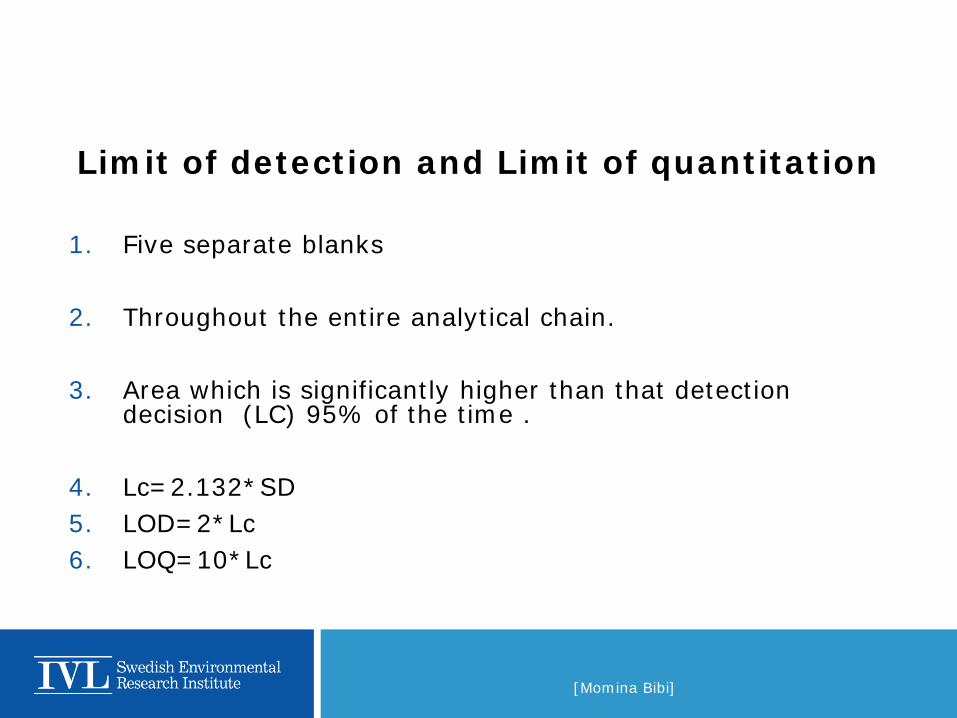
1. Five separate blanks
2. Throughout the entire analytical chain.
3. Area which is significantly higher than that detection
decision (LC) 95% of the time .
4. Lc=2.132*SD 5. LOD=2*Lc 6. LOQ=10*Lc
Limit of detection and Limit of quantitation

[Momina Bibi]
aBlank(ng/ml)
Compound SD Lc LOD LOQ BHA - - No Peak No Peak BHT-CHO - - No Peak No Peak Cyanox 1790 - - No Peak No Peak Irganox 1010 0.846 1.8 3.6 8.46 Irganox 1076 0.002 0.004 0.008 0.018 Lowinox - - No Peak No Peak Tinuvin 123 - - No Peak No Peak Tinuvin 99-2 0.017 0.037 0.074 0.173
a=5
[Momina Bibi]
[Momina Bibi]

Recycled paper-paperboard for food contact materials: contaminants suspected, migration models and
healthy concerns.
Francesca Tiberto, Nicoleta Suciu, Marco Trevisan Institute of Agricultural and Environmental Chemistry
Piacenza, Italy [email protected]
Summary
Introduction Objectives First part: determination of the contaminants Second part: migration tests Conclusions

Introduction
Food packaging is the most common way to: - store foods at different environmental conditions; - extend the shelf-life of the products; - safeguard foods from natural agents; - protect foods from any type of external pollution. packaging is necessary to preserve the quality and the safety of the foods.
In some cases packaging can become a new source of contaminants that can affect the organoleptic properties of the foods and make them hazardous to the food consumers. it is necessary to control the composition of the packaging and assess the potential migrations of the compounds to the foods.
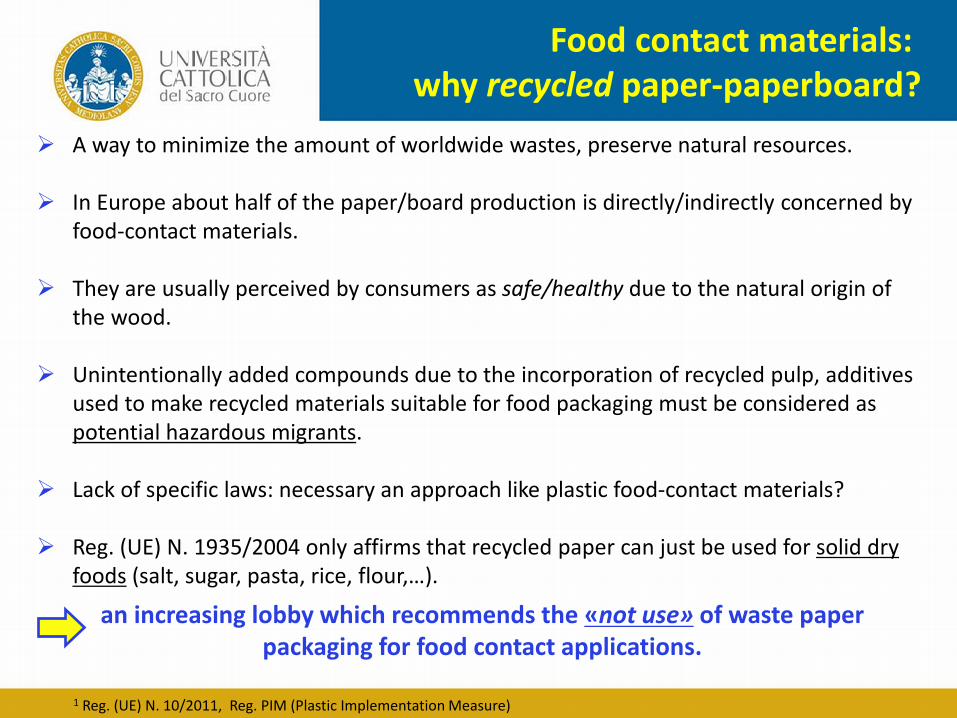
Food contact materials: why recycled paper-paperboard?
A way to minimize the amount of worldwide wastes, preserve natural resources.
In Europe about half of the paper/board production is directly/indirectly concerned by food-contact materials.
They are usually perceived by consumers as safe/healthy due to the natural origin of the wood.
Unintentionally added compounds due to the incorporation of recycled pulp, additives used to make recycled materials suitable for food packaging must be considered as potential hazardous migrants.
Lack of specific laws: necessary an approach like plastic food-contact materials?
Reg. (UE) N. 1935/2004 only affirms that recycled paper can just be used for solid dry foods (salt, sugar, pasta, rice, flour,…).
an increasing lobby which recommends the «not use» of waste paper packaging for food contact applications.
1 Reg. (UE) N. 10/2011, Reg. PIM (Plastic Implementation Measure)
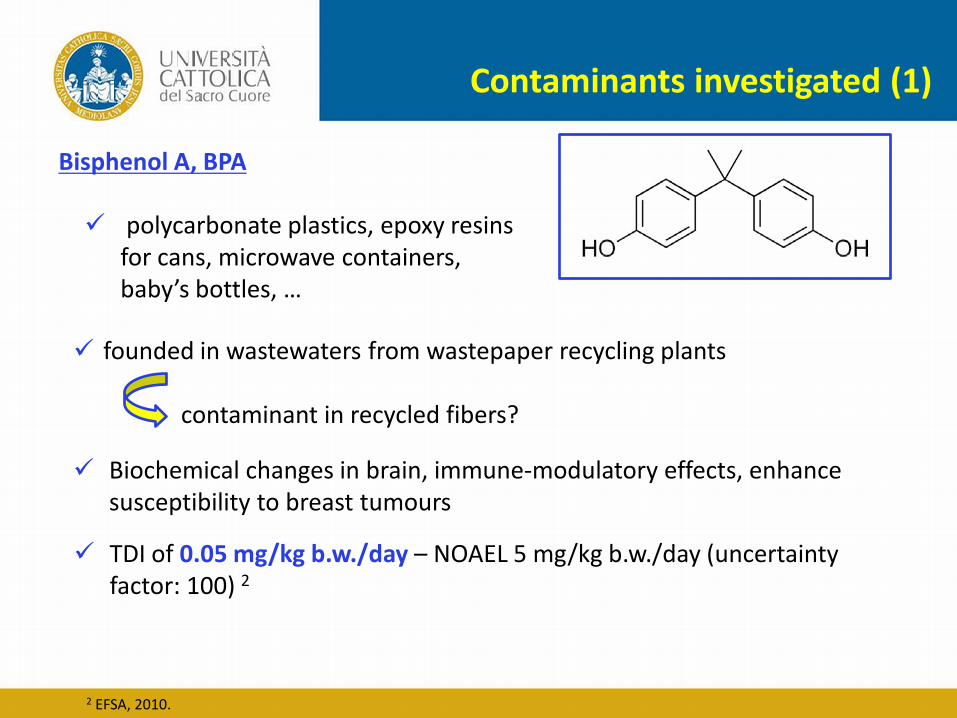
Contaminants investigated (1)
Bisphenol A, BPA
TDI of 0.05 mg/kg b.w./day – NOAEL 5 mg/kg b.w./day (uncertainty factor: 100) 2
Biochemical changes in brain, immune-modulatory effects, enhance susceptibility to breast tumours
2 EFSA, 2010.
polycarbonate plastics, epoxy resins for cans, microwave containers, baby’s bottles, …
founded in wastewaters from wastepaper recycling plants
contaminant in recycled fibers?

Contaminants investigated (2)
Bis(2-ethylhexyl)phthalate, DEHP
Since 1930 industrial success as additive to
PVC to increase flexibility
Exponential applicability
adhesives, lacquers, waxes, inks, cosmetics, insecticides,…
present in paper-paperboard food packaging: contamination of raw materials and/or process
Endocrine disruption properties, reducing man fertility TDI of 0.05 mg/kg bw/day - NOAEL of 5 mg/kg bw/day (uncertainty factor:
100) 3
3 EFSA, 2010.

Contaminants investigated (3)
Nonylphenol monoethoxylate, NMP - Nonylphenol diethoxylate, NDP
Environmental ubiquitous contaminants (aquatic systems): contamination of raw
materials? in lubricants, detergents, resins, plasticizers, herbicides, cosmetics,…
used as dispersing/stabilizing agents in paper food packaging process
oestrogenic activity - endocrine disrupting effects in vitro/in vivo experiments activity on the reproductive system /carcinogenics
Objectives
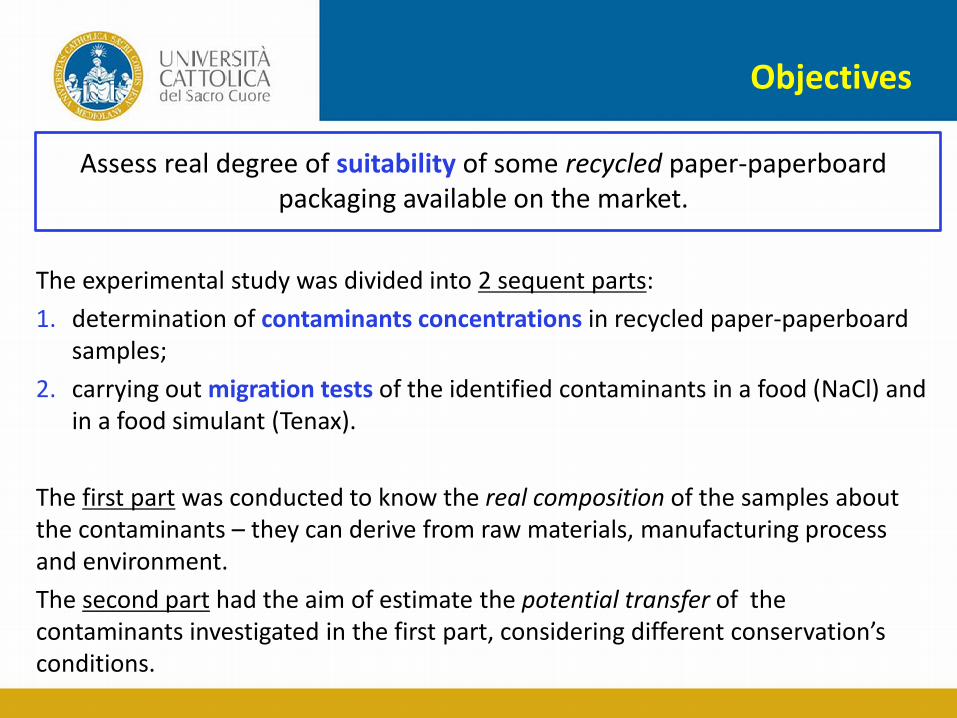
Assess real degree of suitability of some recycled paper-paperboard packaging available on the market.
The experimental study was divided into 2 sequent parts: 1. determination of contaminants concentrations in recycled paper-paperboard
samples; 2. carrying out migration tests of the identified contaminants in a food (NaCl) and
in a food simulant (Tenax). The first part was conducted to know the real composition of the samples about the contaminants – they can derive from raw materials, manufacturing process and environment. The second part had the aim of estimate the potential transfer of the contaminants investigated in the first part, considering different conservation’s conditions.
First part: materials and methods (1)
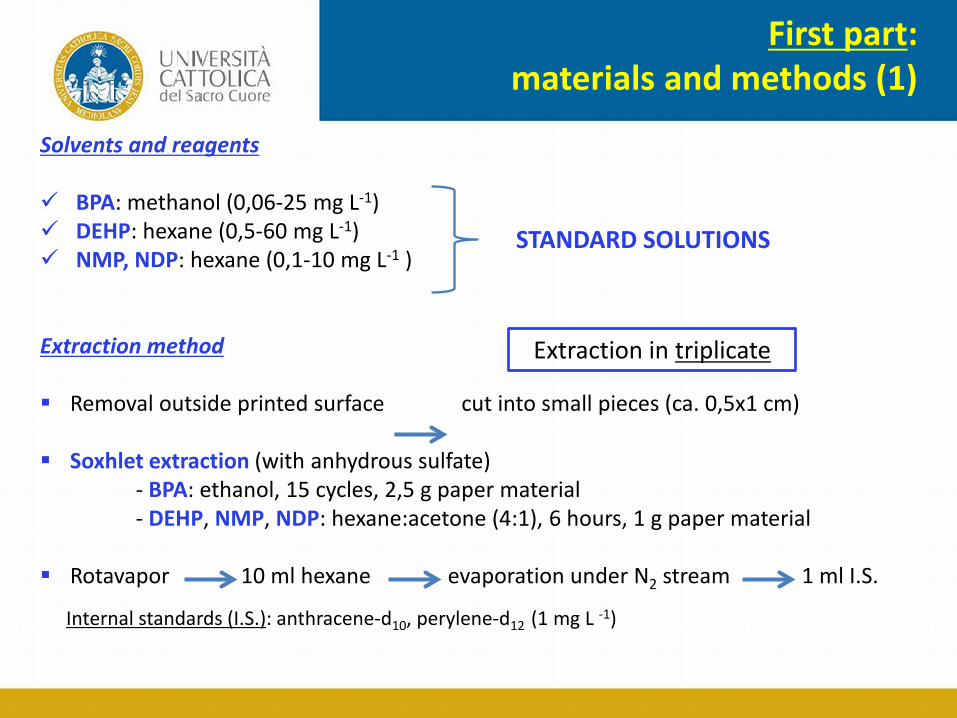
Solvents and reagents BPA: methanol (0,06-25 mg L-1) DEHP: hexane (0,5-60 mg L-1) NMP, NDP: hexane (0,1-10 mg L-1 ) Extraction method Removal outside printed surface cut into small pieces (ca. 0,5x1 cm) Soxhlet extraction (with anhydrous sulfate) - BPA: ethanol, 15 cycles, 2,5 g paper material - DEHP, NMP, NDP: hexane:acetone (4:1), 6 hours, 1 g paper material Rotavapor 10 ml hexane evaporation under N2 stream 1 ml I.S.
STANDARD SOLUTIONS
Extraction in triplicate
Internal standards (I.S.): anthracene-d10, perylene-d12 (1 mg L -1)
First part: materials and methods (2)
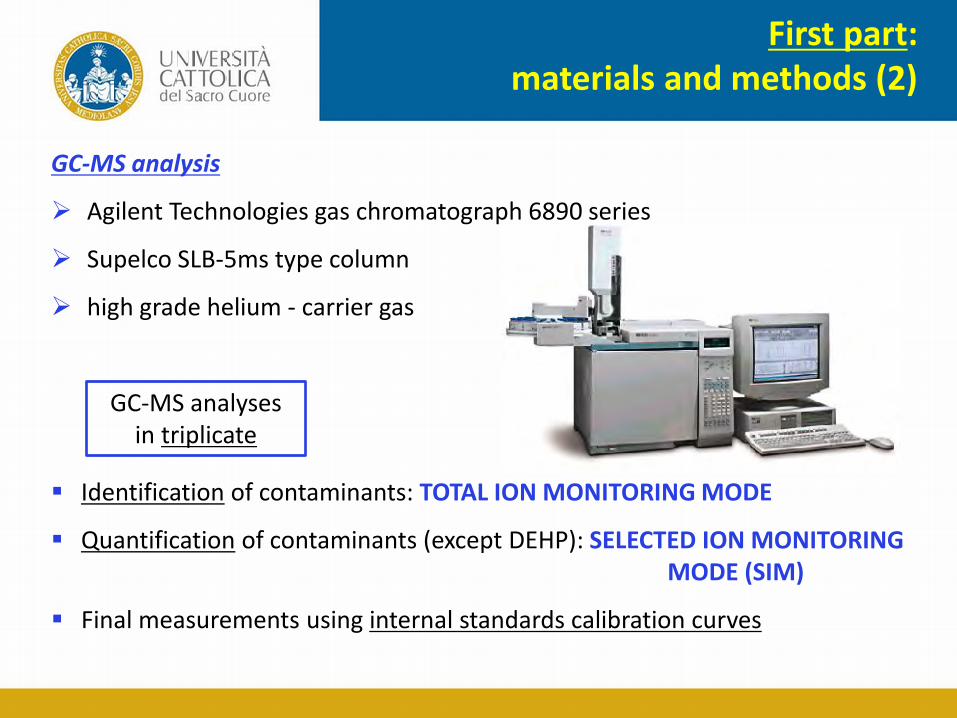
GC-MS analysis
Agilent Technologies gas chromatograph 6890 series
Supelco SLB-5ms type column
high grade helium - carrier gas
Identification of contaminants: TOTAL ION MONITORING MODE
Quantification of contaminants (except DEHP): SELECTED ION MONITORING MODE (SIM)
Final measurements using internal standards calibration curves
GC-MS analyses in triplicate

First part: paper and paperboard samples
n.s. Not specified.
Sample no.
Product Contact Type of paper Percentage of recycled material
9 Barley box Direct n.s. n.s.
10 Pasta box Direct Recycled ca. 40%
11 Rice-pasta box
Direct n.s. n.s.
12 Rice box Indirect Recycled 100%
13 Napkins - Recycled 100%
14 Polenta Indirect Recycled 80-90%
15 Take- away pizza box 2
Direct n.s. n.s.
16 Frozen pizza box 2
Indirect Recycled ca. 90%
17 Salt box 2 Direct n.s. n.s.
1 Cereals box Indirect Recycled 100%
2 Eggs box Direct Recycled 100%
3 Salt box Direct n.s. n.s.
4 Sugar box Direct n.s. n.s.
5 Take-away pizza box 1
Direct n.s. n.s.
6 Frozen pizza box 1
Indirect Recycled ca. 90%
7 Soy box Direct n.s. n.s.
8 Lentils box Direct n.s. n.s.
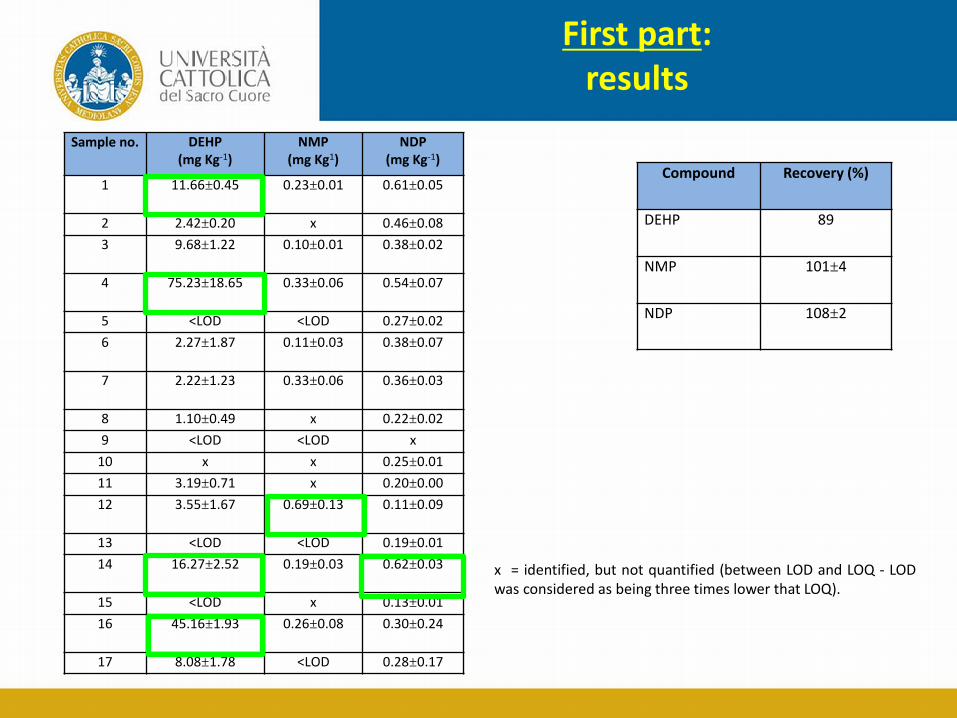
First part: results
x = identified, but not quantified (between LOD and LOQ - LOD was considered as being three times lower that LOQ).
Sample no. DEHP (mg Kg-1)
NMP (mg Kg1)
NDP (mg Kg-1)
1 11.66±0.45 0.23±0.01 0.61±0.05
2 2.42±0.20 x 0.46±0.08 3 9.68±1.22 0.10±0.01 0.38±0.02
4 75.23±18.65 0.33±0.06 0.54±0.07
5 <LOD <LOD 0.27±0.02 6 2.27±1.87 0.11±0.03 0.38±0.07
7 2.22±1.23 0.33±0.06 0.36±0.03
8 1.10±0.49 x 0.22±0.02 9 <LOD <LOD x
10 x x 0.25±0.01 11 3.19±0.71 x 0.20±0.00 12 3.55±1.67 0.69±0.13 0.11±0.09
13 <LOD <LOD 0.19±0.01 14 16.27±2.52 0.19±0.03 0.62±0.03
15 <LOD x 0.13±0.01 16 45.16±1.93 0.26±0.08 0.30±0.24
17 8.08±1.78 <LOD 0.28±0.17
Compound Recovery (%)
DEHP 89
NMP 101±4
NDP 108±2
First part: discussion
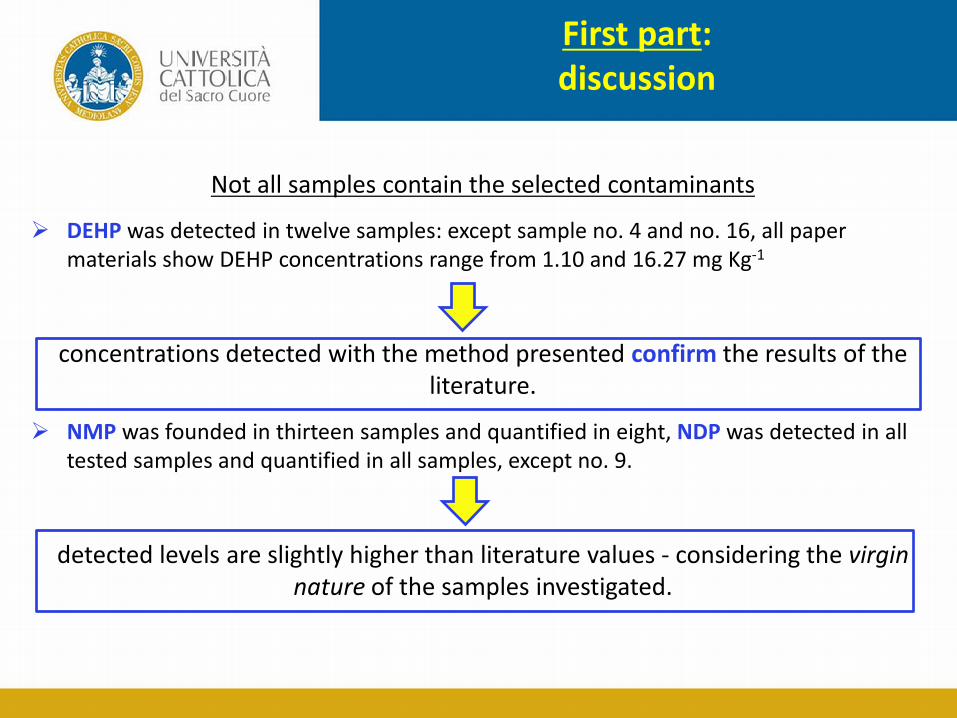
Not all samples contain the selected contaminants
DEHP was detected in twelve samples: except sample no. 4 and no. 16, all paper materials show DEHP concentrations range from 1.10 and 16.27 mg Kg-1
concentrations detected with the method presented confirm the results of the literature.
NMP was founded in thirteen samples and quantified in eight, NDP was detected in all tested samples and quantified in all samples, except no. 9.
detected levels are slightly higher than literature values - considering the virgin nature of the samples investigated.
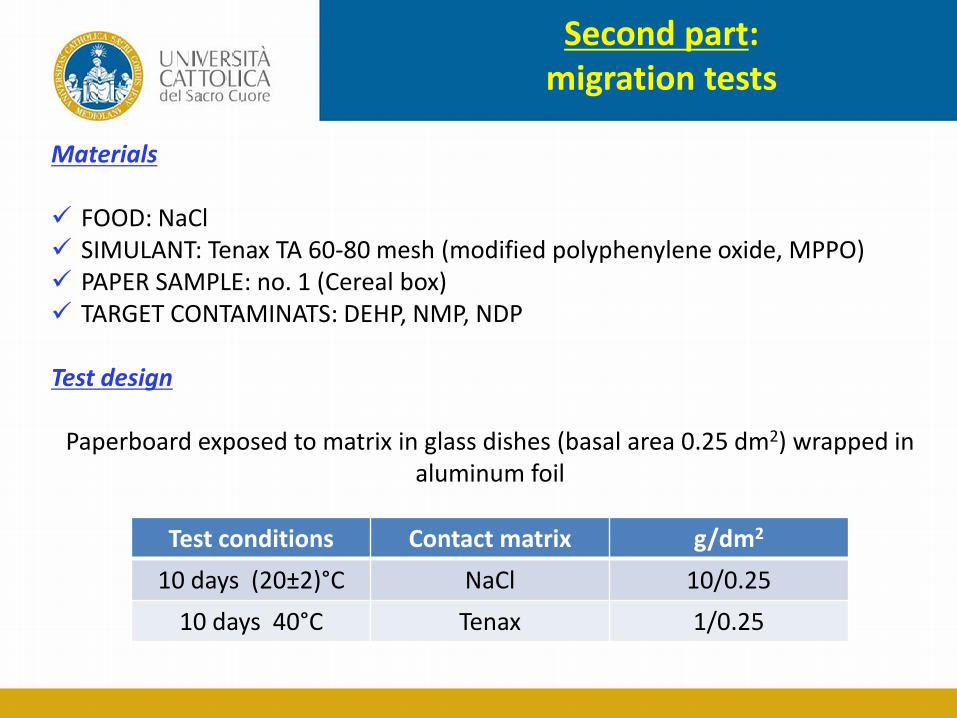
Second part: migration tests
Test conditions Contact matrix g/dm2
10 days (20±2)°C NaCl 10/0.25 10 days 40°C Tenax 1/0.25
Materials
FOOD: NaCl SIMULANT: Tenax TA 60-80 mesh (modified polyphenylene oxide, MPPO) PAPER SAMPLE: no. 1 (Cereal box) TARGET CONTAMINATS: DEHP, NMP, NDP Test design
Paperboard exposed to matrix in glass dishes (basal area 0.25 dm2) wrapped in aluminum foil
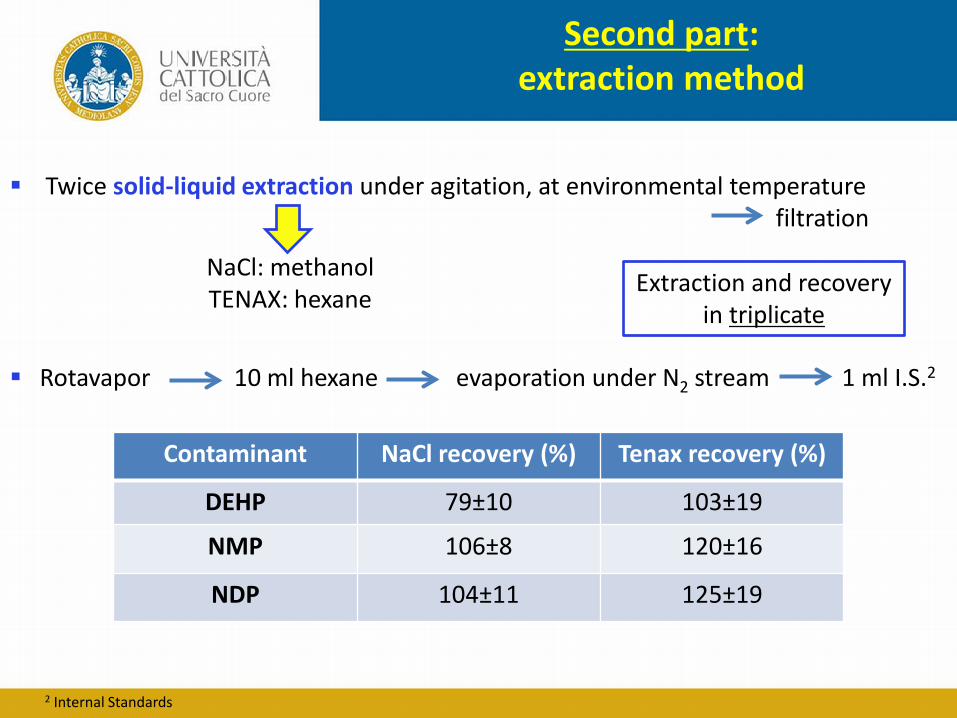
Second part: extraction method
Contaminant NaCl recovery (%) Tenax recovery (%)
DEHP 79±10 103±19
NMP 106±8 120±16
NDP 104±11 125±19
Twice solid-liquid extraction under agitation, at environmental temperature filtration Rotavapor 10 ml hexane evaporation under N2 stream 1 ml I.S.2
NaCl: methanol TENAX: hexane
2 Internal Standards
Extraction and recovery in triplicate
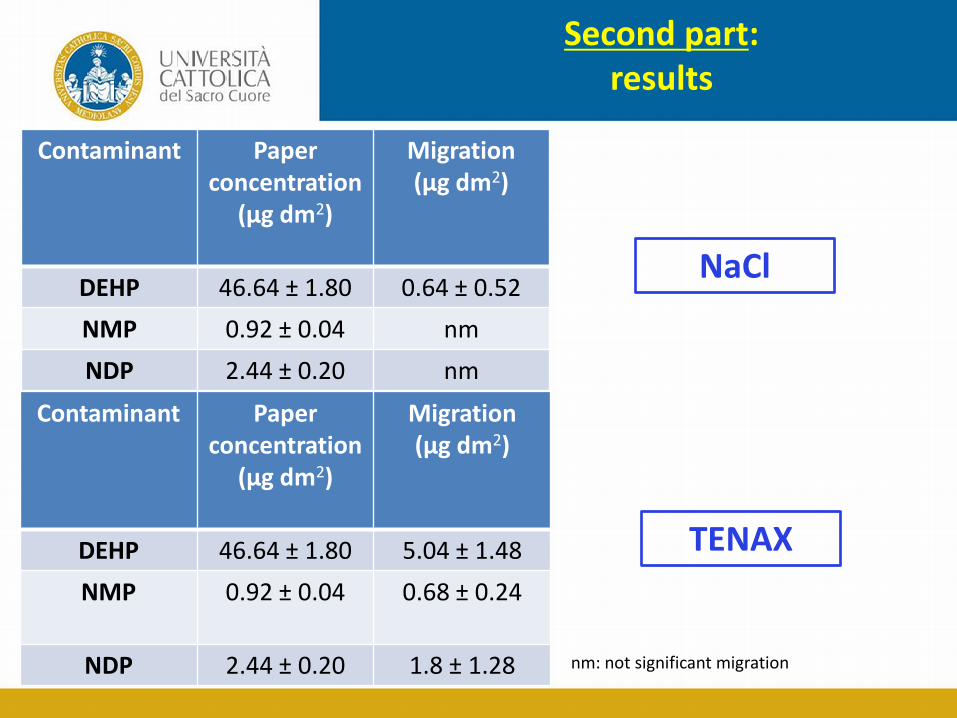
Second part: results
Contaminant Paper concentration
(μg dm2)
Migration (μg dm2)
DEHP 46.64 ± 1.80 0.64 ± 0.52 NMP 0.92 ± 0.04 nm NDP 2.44 ± 0.20 nm
Contaminant Paper concentration
(μg dm2)
Migration (μg dm2)
DEHP 46.64 ± 1.80 5.04 ± 1.48 NMP 0.92 ± 0.04 0.68 ± 0.24
NDP 2.44 ± 0.20 1.8 ± 1.28
NaCl
TENAX
nm: not significant migration
Second part: discussion
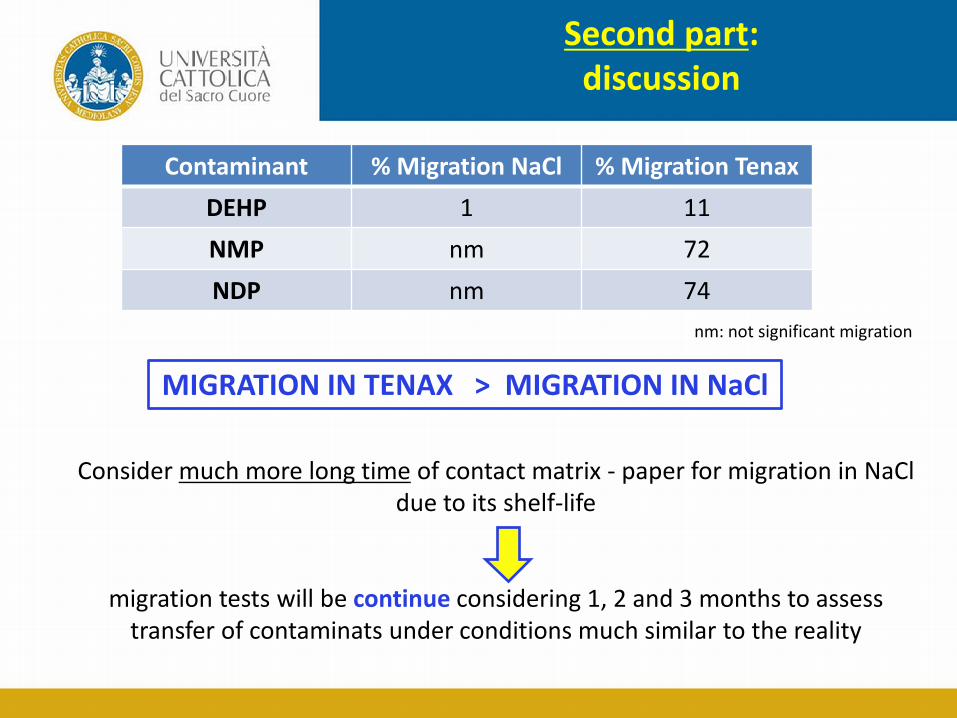
Contaminant % Migration NaCl % Migration Tenax DEHP 1 11 NMP nm 72 NDP nm 74
nm: not significant migration
MIGRATION IN TENAX > MIGRATION IN NaCl
Consider much more long time of contact matrix - paper for migration in NaCl due to its shelf-life
migration tests will be continue considering 1, 2 and 3 months to assess transfer of contaminats under conditions much similar to the reality

Conclusions (1)
A procedure for analysing four chemical contaminants in recycled paper-paperboard materials has been developed
applicability of the method was illustrated using commercial products selected contaminants are generally present in the tested samples at levels in agreement
with the literature
recycled fibers have a great influence on the amount of chemicals present in the end-products.
a migration’s study was introduced: comparison of migration behaviors of contaminants
after 10 days of contact with NaCl and Tenax
much more migration in Tenax due to its high absorbent power results obtained confirm literature levels
THE WORK IS COMING ALONG WITH THE COMPLETION OF MIGRATION STUDIES Paperboard detection and migration tests for BPA
Migration tests for long time
Conclusions (2)
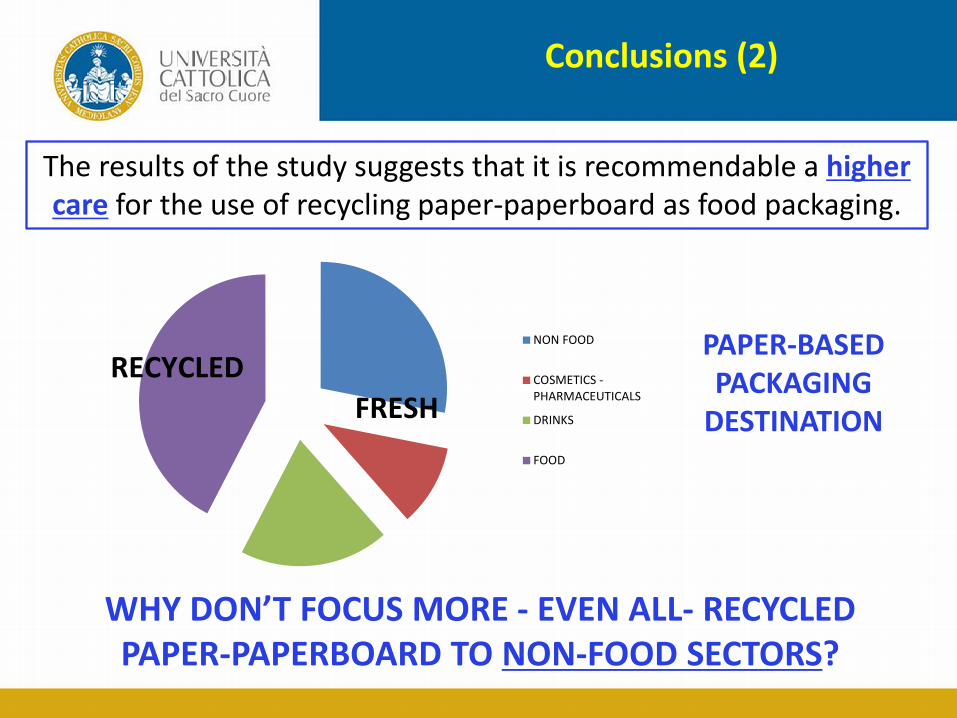
The results of the study suggests that it is recommendable a higher care for the use of recycling paper-paperboard as food packaging.
PAPER-BASED PACKAGING
DESTINATION
WHY DON’T FOCUS MORE - EVEN ALL- RECYCLED PAPER-PAPERBOARD TO NON-FOOD SECTORS?
NON FOOD
COSMETICS -PHARMACEUTICALS
DRINKS
FOOD
RECYCLED FRESH

Thank you for your attention!
Thank you for your attention!
Emerging risks in recycling and waste: Perfluorinated compounds in plastic pellets and nanomaterials in contaminated soil
Damià Barceló, Naif Abdullah Al-Harbi, Hrissi K. Karapanagioti, Antoni Ginebreda,Marta Llorca, Josep Sanchís
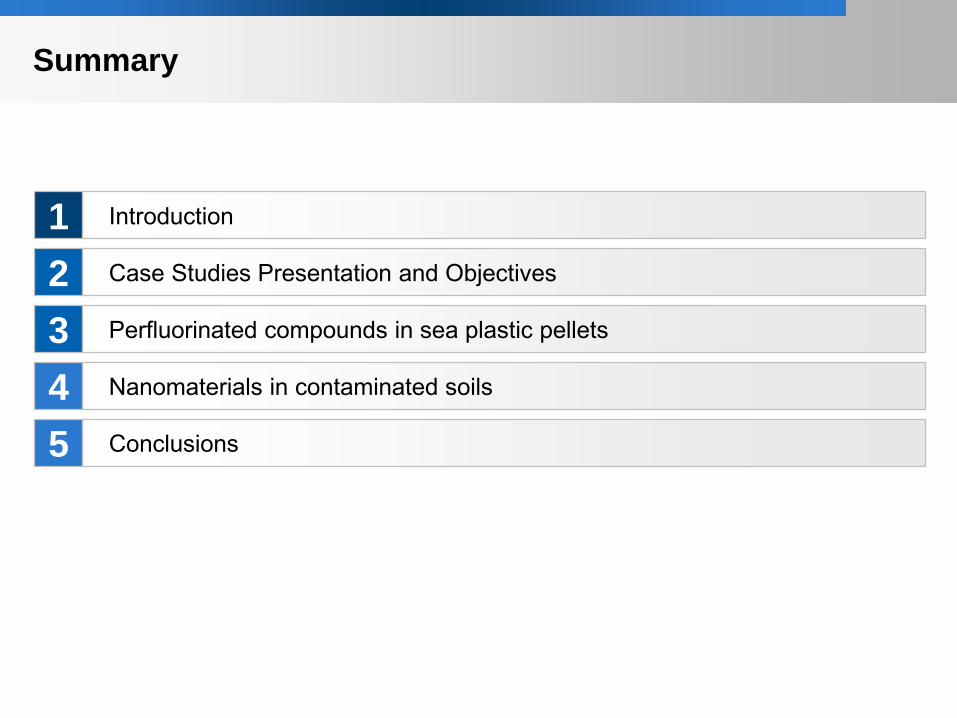
Summary
Introduction
Case Studies Presentation and Objectives
Perfluorinated compounds in sea plastic pellets
Nanomaterials in contaminated soils
Conclusions
1 2 3 4 5
Introduction
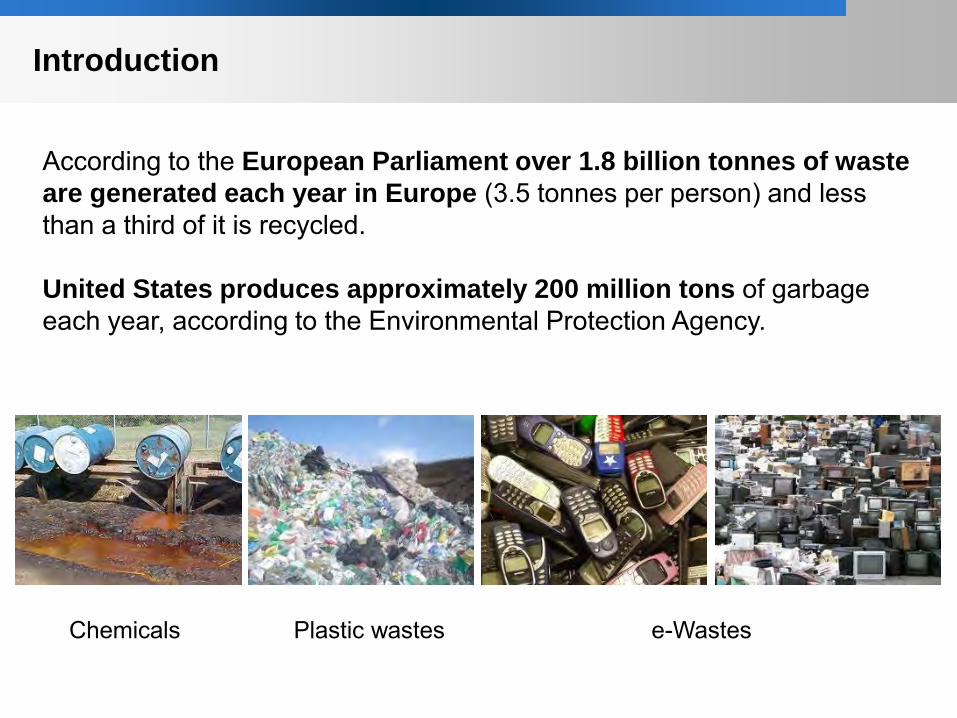
According to the European Parliament over 1.8 billion tonnes of waste are generated each year in Europe (3.5 tonnes per person) and less than a third of it is recycled. United States produces approximately 200 million tons of garbage each year, according to the Environmental Protection Agency.
Chemicals Plastic wastes e-Wastes
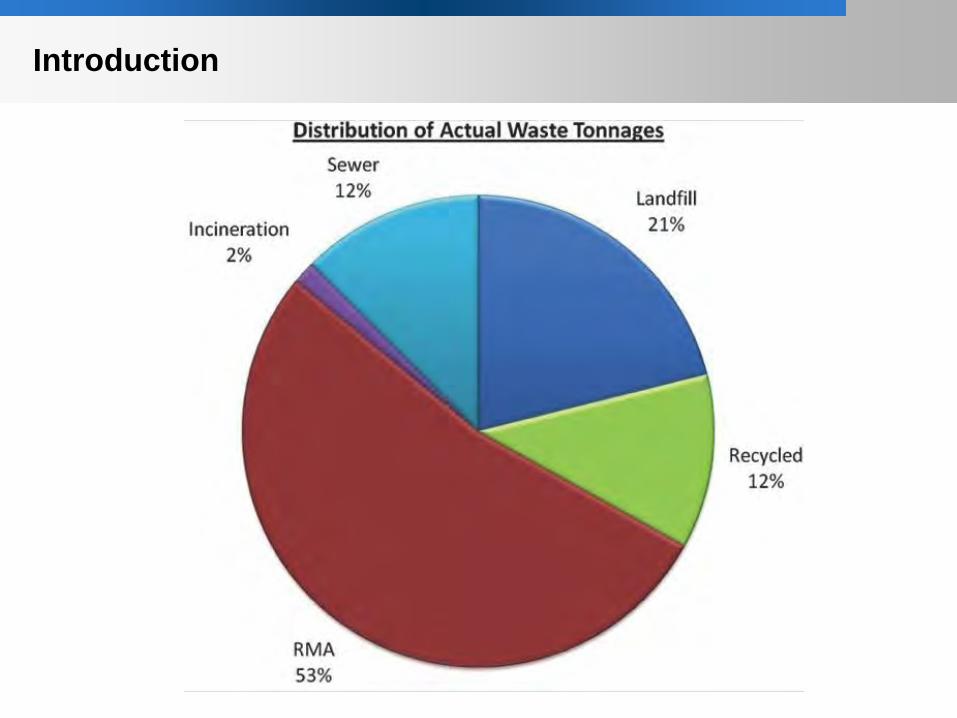
Introduction
Introduction
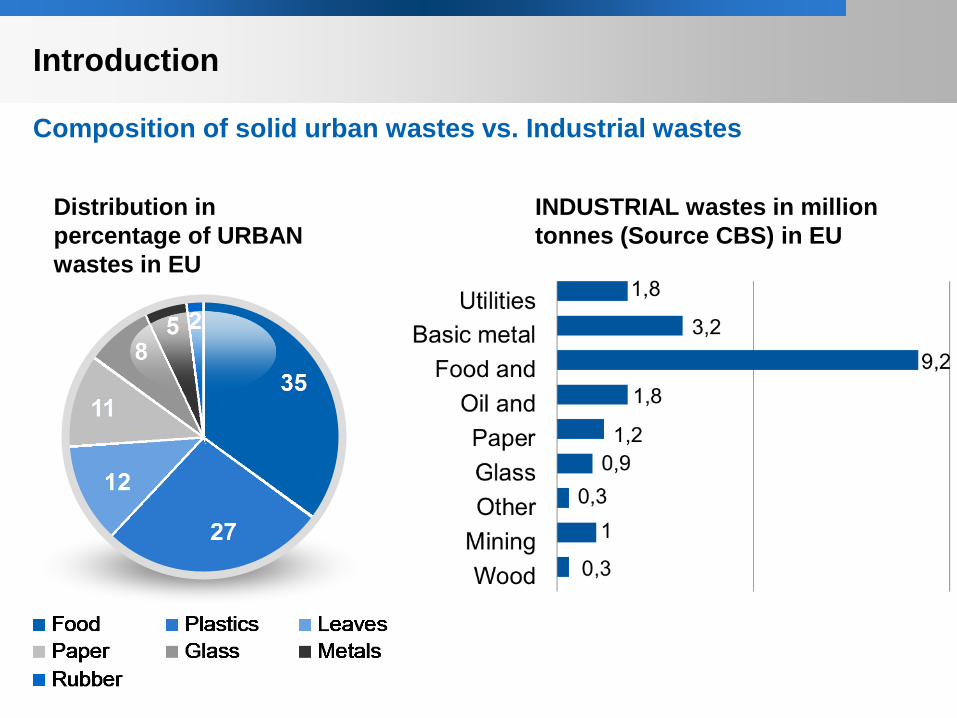
Composition of solid urban wastes vs. Industrial wastes
Distribution in percentage of URBAN wastes in EU
INDUSTRIAL wastes in million tonnes (Source CBS) in EU

Objectives
To develop analytical methods for their determination in environmental samples based on liquid chromatography and tandem mass spectrometry
To assess their occurrence in the environment in order to create enough data to create the basis of a future risk assessment
The lack of recycling constitutes a new source of emerging contaminants to the environment and some materials could act as adsorbents able to stabilize and transport persistent organic pollutants.
Two case studies will be presented
Perfluorinated compounds in sea plastic pellets
Occurrence of nanomaterials in contaminated soil
Case study presentation
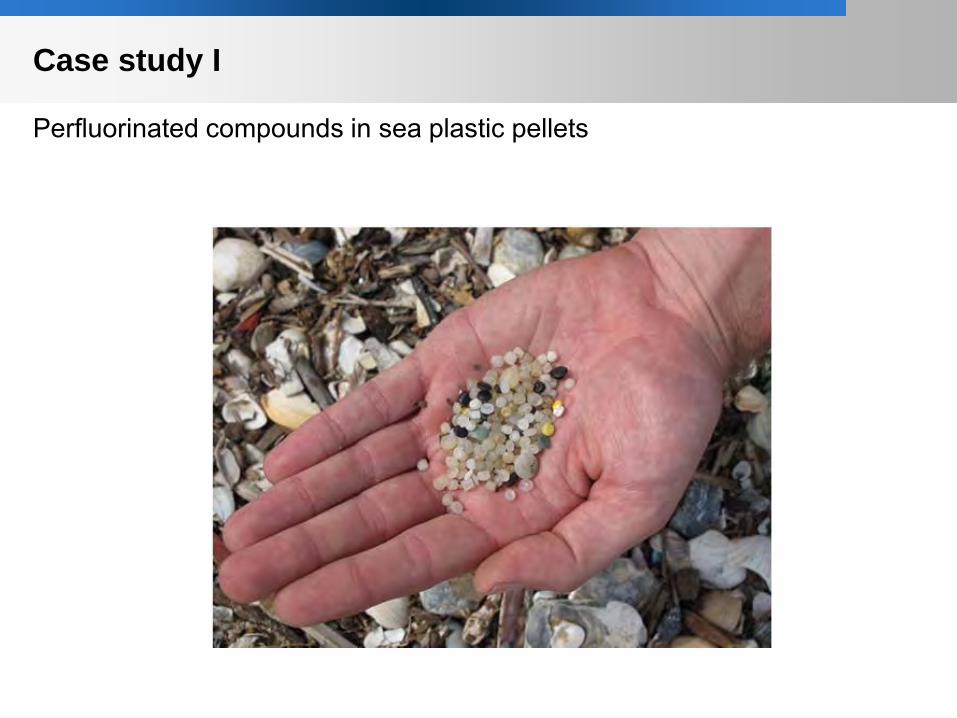
Case study I
Perfluorinated compounds in sea plastic pellets
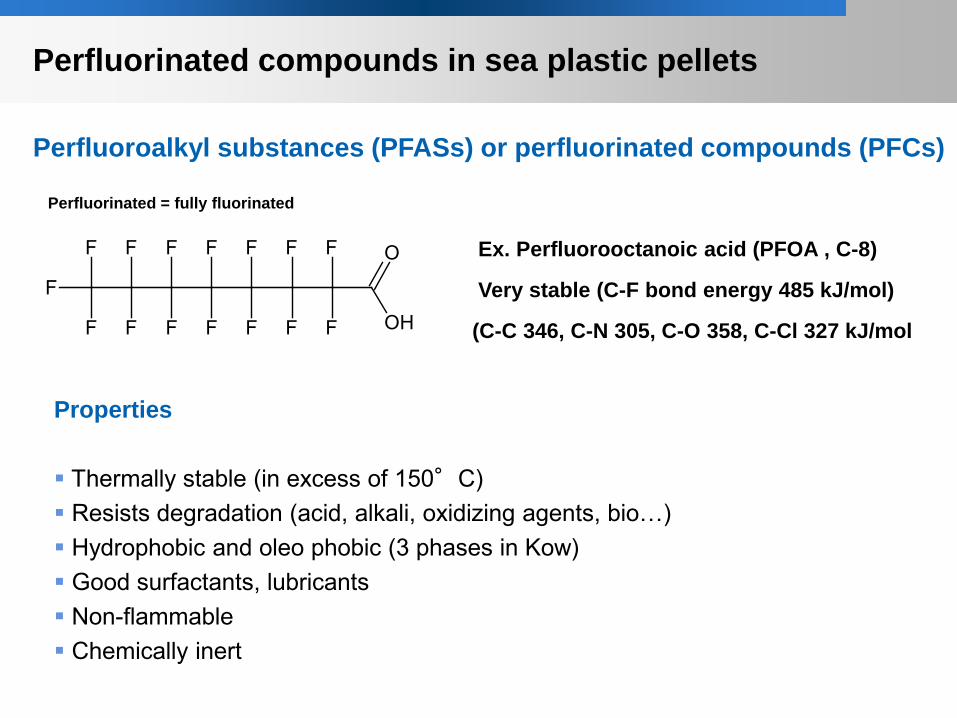
Perfluorinated = fully fluorinated
F
F
F F
F
F
F
F
F
F
F
F
F
F
F OH
O
Perfluoroalkyl substances (PFASs) or perfluorinated compounds (PFCs)
Properties Thermally stable (in excess of 150°C) Resists degradation (acid, alkali, oxidizing agents, bio…) Hydrophobic and oleo phobic (3 phases in Kow) Good surfactants, lubricants Non-flammable Chemically inert
Ex. Perfluorooctanoic acid (PFOA , C-8)
Very stable (C-F bond energy 485 kJ/mol)
(C-C 346, C-N 305, C-O 358, C-Cl 327 kJ/mol
Perfluorinated compounds in sea plastic pellets
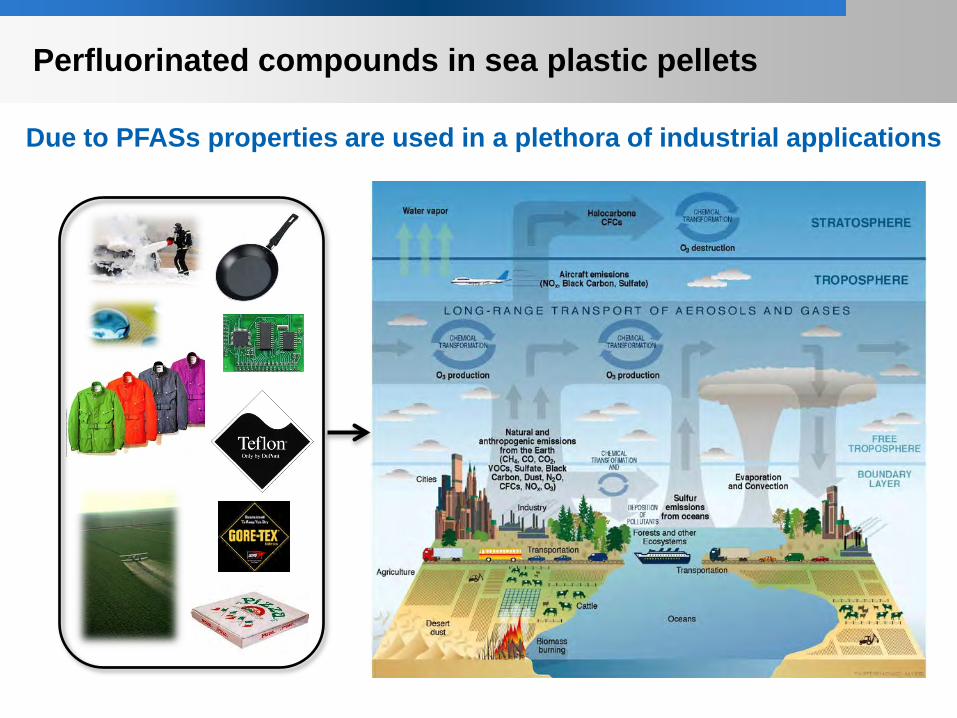
Due to PFASs properties are used in a plethora of industrial applications
Perfluorinated compounds in sea plastic pellets
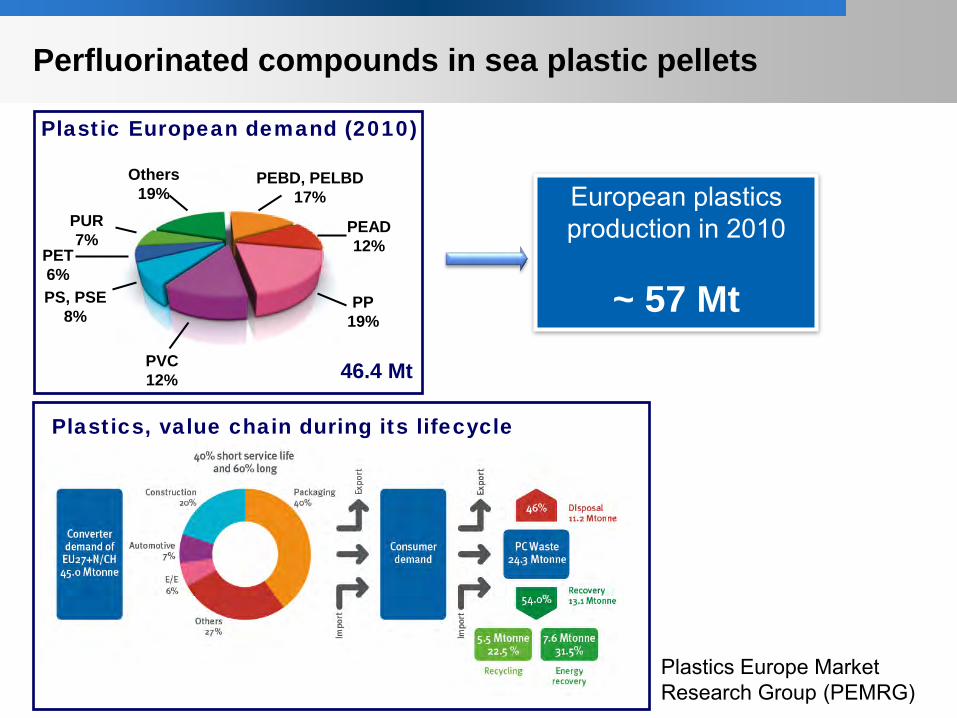
Others 19%
PEBD, PELBD 17%
PEAD 12%
PP 19%
PVC 12%
PS, PSE 8%
PET 6%
PUR 7%
46.4 Mt
Plastic European demand (2010)
European plastics production in 2010
~ 57 Mt
Plastics Europe Market Research Group (PEMRG)
Plastics, value chain during its lifecycle
Perfluorinated compounds in sea plastic pellets
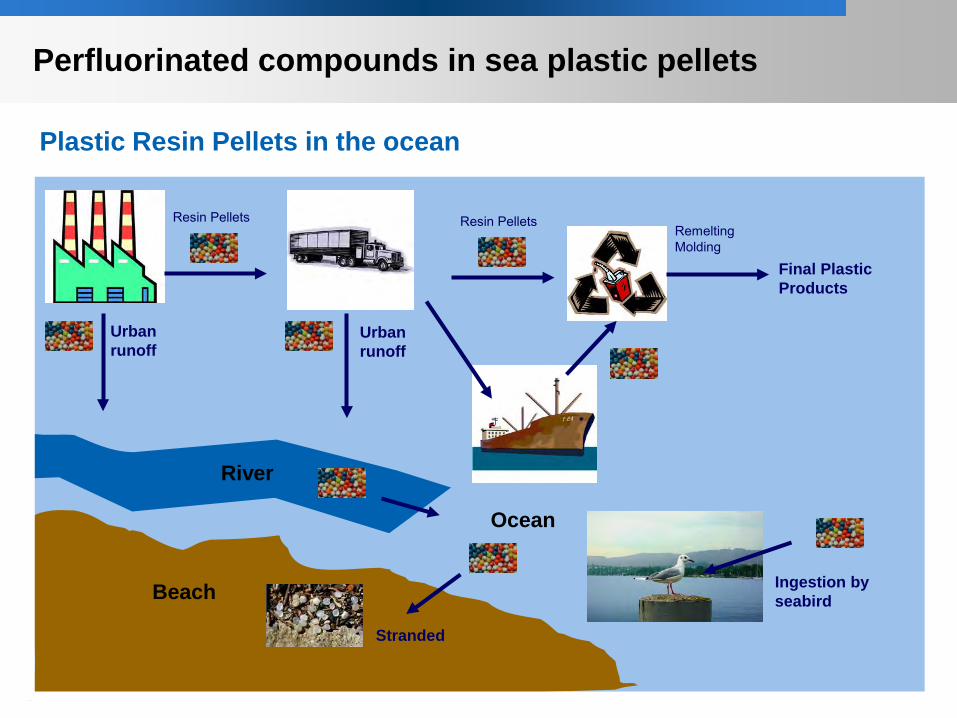
Resin Pellets Resin Pellets Remelting Molding
Final Plastic Products
Urban runoff
Urban runoff
River
Ocean
Beach
Stranded
Ingestion by seabird
Plastic Resin Pellets in the ocean
Perfluorinated compounds in sea plastic pellets
Perfluorinated compounds in sea plastic pellets
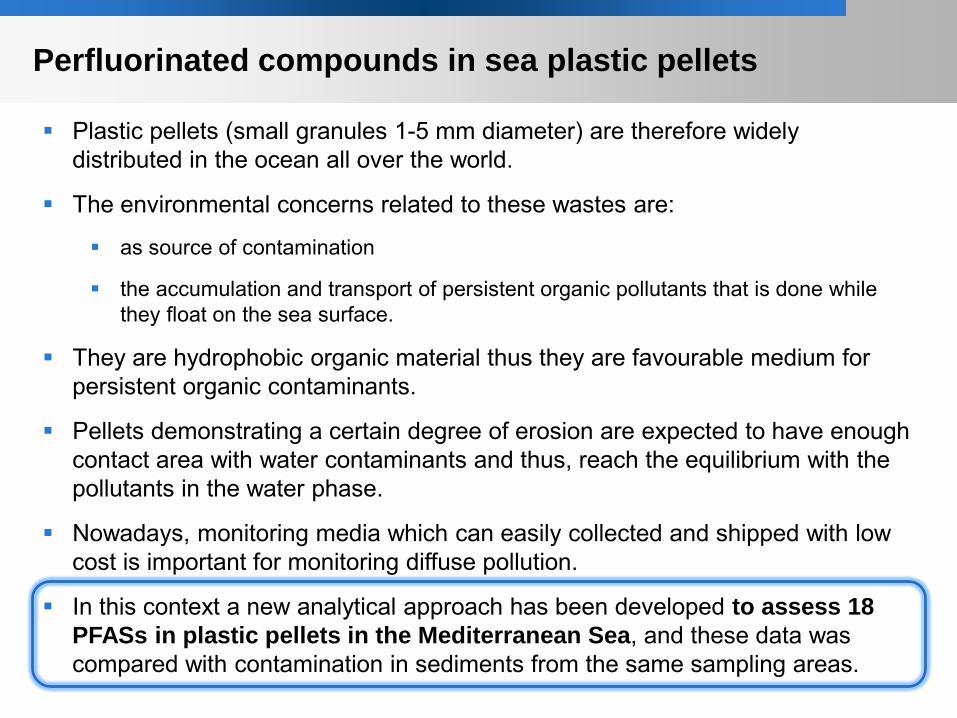
Plastic pellets (small granules 1-5 mm diameter) are therefore widely distributed in the ocean all over the world.
The environmental concerns related to these wastes are:
as source of contamination
the accumulation and transport of persistent organic pollutants that is done while they float on the sea surface.
They are hydrophobic organic material thus they are favourable medium for persistent organic contaminants.
Pellets demonstrating a certain degree of erosion are expected to have enough contact area with water contaminants and thus, reach the equilibrium with the pollutants in the water phase.
Nowadays, monitoring media which can easily collected and shipped with low cost is important for monitoring diffuse pollution.
In this context a new analytical approach has been developed to assess 18 PFASs in plastic pellets in the Mediterranean Sea, and these data was compared with contamination in sediments from the same sampling areas.

Sampling Poing Sample type Sampling site Possible contamination source
Corfu Island Plastic Pellet Beach surface
International Airport and harbour Sediment Beach face
Lavrio beach Plastic Pellet Beach surface Mazut and natural gas power plant;
DOW chemicals plant; near to Athens city Sediment Beach face
Kato Achaia beach Plastic Pellet Beach surface
Harbour Sediment Beach face
Leros Island Plastic Pellet Beach surface
Airport and harbour Sediment Beach face
Loutropyrgos Plastic Pellet Beach surface Oil refineries (Aspropyrgos and Elefsina);
Near to Athens city Sediment Near shore zone
Pagasitikos Gulf Sediment Beach face Central Greece International Airport
Cement Industry (Aget Heracles Industry)
Amvrakikos Gulf Sediment Bottom of the sea National Airport of Preveza-Lefkada
Air force base (Mazona Iagoon)
Aliveri Sediment Bottom of the sea Cement plant (Heracles);
Near to Athens city
Perfluorinated compounds in sea plastic pellets
Sampling - Mediterranean Sea (Greece)
XIC of -MRM (69 pairs): 413.0/369.0 Da from Sample 15 (PEP Loutrop_2) of 20110625_Plastics.wiff (Turbo Spray) Max. 860.0 cps.
1.0 2.0 3.0 4.0 5.0 6.0 7.0 8.0 9.0 10.0 11.0 12.0 13.0 14.0 15.0Time, min
0.0
1000.0
2000.0
3000.0
4000.0
5000.0
6000.0
7000.0
8000.0
9000.0
1.0e4
1.1e4
1.2e4
1.3e4
1.4e4
1.5e4
1.6e4
1.7e4
1.8e4
1.9e4
Inte
nsity
, cps
XIC of -MRM (69 pairs): 413.0/169.0 Da from Sample 15 (PEP Loutrop_2) of 20110625_Plastics.wiff (Turbo Spray) Max. 474.9 cps.
1.0 2.0 3.0 4.0 5.0 6.0 7.0 8.0 9.0 10.0 11.0 12.0 13.0 14.0 15.0Time, min
0
20
40
60
80
100
120
140
160
180
200
220
240
260
280
300
320
340
360
380
400
420
440
460475
Inte
nsity
, cps
6.09
7.8411.77
Perfluorinated compounds in sea plastic pellets
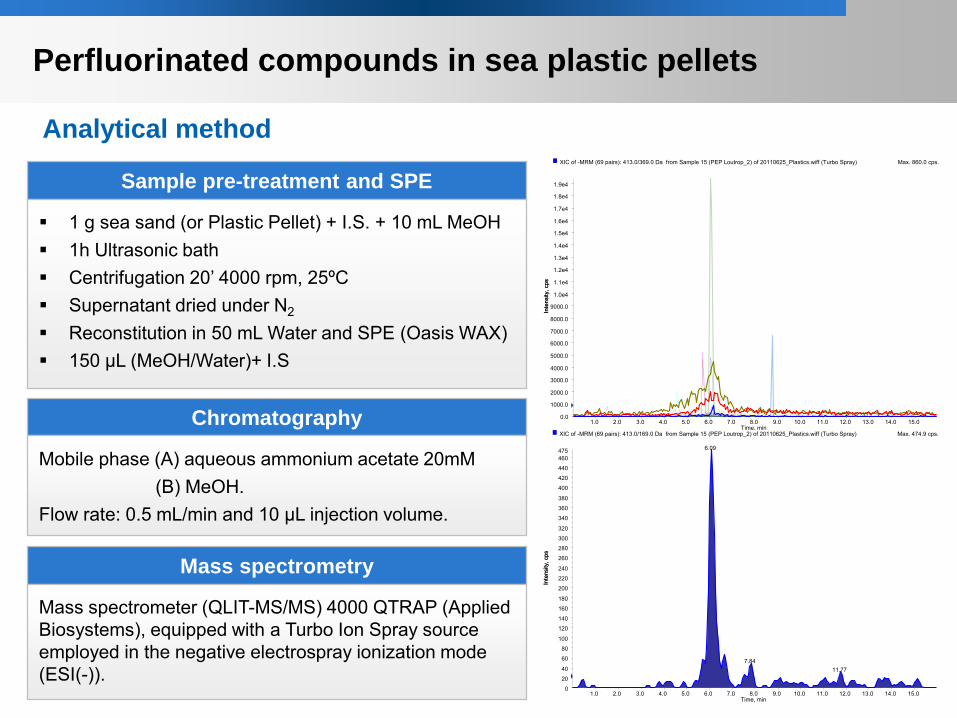
Analytical method
Sample pre-treatment and SPE
1 g sea sand (or Plastic Pellet) + I.S. + 10 mL MeOH 1h Ultrasonic bath Centrifugation 20’ 4000 rpm, 25ºC Supernatant dried under N2 Reconstitution in 50 mL Water and SPE (Oasis WAX) 150 µL (MeOH/Water)+ I.S
Chromatography
Mobile phase (A) aqueous ammonium acetate 20mM (B) MeOH. Flow rate: 0.5 mL/min and 10 μL injection volume.
Mass spectrometry
Mass spectrometer (QLIT-MS/MS) 4000 QTRAP (Applied Biosystems), equipped with a Turbo Ion Spray source employed in the negative electrospray ionization mode (ESI(-)).
Perfluorinated compounds in sea plastic pellets
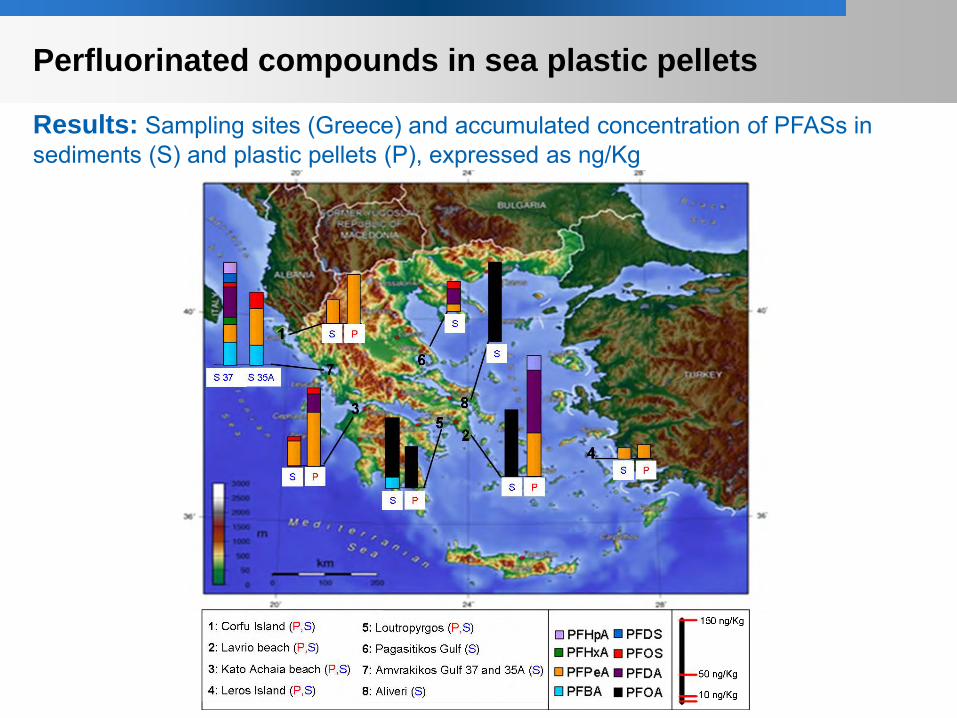
Results: Sampling sites (Greece) and accumulated concentration of PFASs in sediments (S) and plastic pellets (P), expressed as ng/Kg
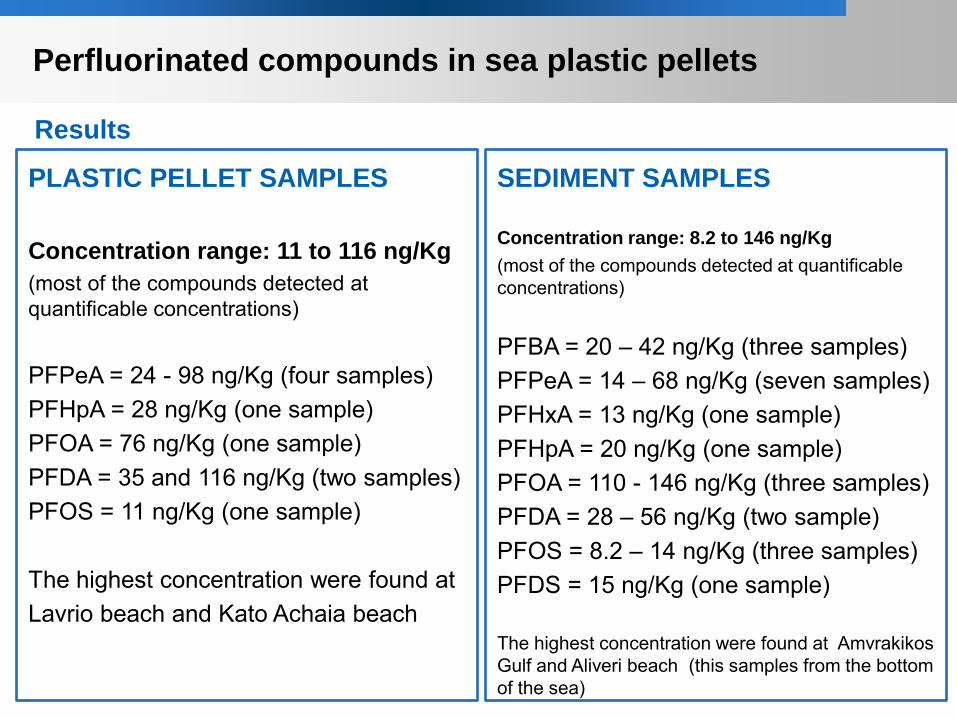
PLASTIC PELLET SAMPLES Concentration range: 11 to 116 ng/Kg (most of the compounds detected at quantificable concentrations) PFPeA = 24 - 98 ng/Kg (four samples) PFHpA = 28 ng/Kg (one sample) PFOA = 76 ng/Kg (one sample) PFDA = 35 and 116 ng/Kg (two samples) PFOS = 11 ng/Kg (one sample) The highest concentration were found at Lavrio beach and Kato Achaia beach
SEDIMENT SAMPLES Concentration range: 8.2 to 146 ng/Kg (most of the compounds detected at quantificable concentrations)
PFBA = 20 – 42 ng/Kg (three samples) PFPeA = 14 – 68 ng/Kg (seven samples) PFHxA = 13 ng/Kg (one sample) PFHpA = 20 ng/Kg (one sample) PFOA = 110 - 146 ng/Kg (three samples) PFDA = 28 – 56 ng/Kg (two sample) PFOS = 8.2 – 14 ng/Kg (three samples) PFDS = 15 ng/Kg (one sample) The highest concentration were found at Amvrakikos Gulf and Aliveri beach (this samples from the bottom of the sea)
Perfluorinated compounds in sea plastic pellets
Results

Sediment
Plastic Pellets
Corfu Island
0
20
40
60
80
100
PFB
A
PFP
eA
PFO
A
PFD
A
PFO
S
ng/Kg Kato Achaia beach
0
20
40
60
80
100
120
PFB
A
PFP
eA
PFO
A
PFD
A
PFO
S
ng/Kg
Leros Island
0
5
10
15
20
25
30
PFBA
PFPe
A
PFO
A
PFD
A
PFO
S
ng/KgLeutropyrgos
0
20
40
60
80
100
120
PFBA
PFPe
A
PFO
A
PFD
A
PFO
S
ng/Kg
Perfluorinated compounds in sea plastic pellets
Results: Relationship between plastic pellets and sediment samples
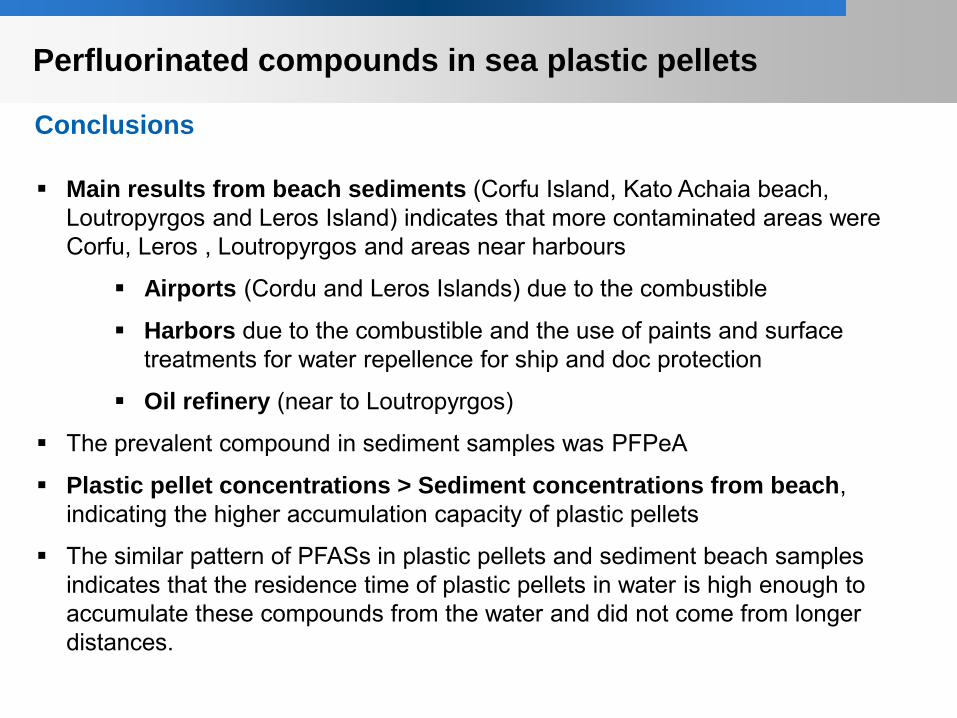
Main results from beach sediments (Corfu Island, Kato Achaia beach, Loutropyrgos and Leros Island) indicates that more contaminated areas were Corfu, Leros , Loutropyrgos and areas near harbours
Airports (Cordu and Leros Islands) due to the combustible
Harbors due to the combustible and the use of paints and surface treatments for water repellence for ship and doc protection
Oil refinery (near to Loutropyrgos)
The prevalent compound in sediment samples was PFPeA
Plastic pellet concentrations > Sediment concentrations from beach, indicating the higher accumulation capacity of plastic pellets
The similar pattern of PFASs in plastic pellets and sediment beach samples indicates that the residence time of plastic pellets in water is high enough to accumulate these compounds from the water and did not come from longer distances.
Perfluorinated compounds in sea plastic pellets
Conclusions
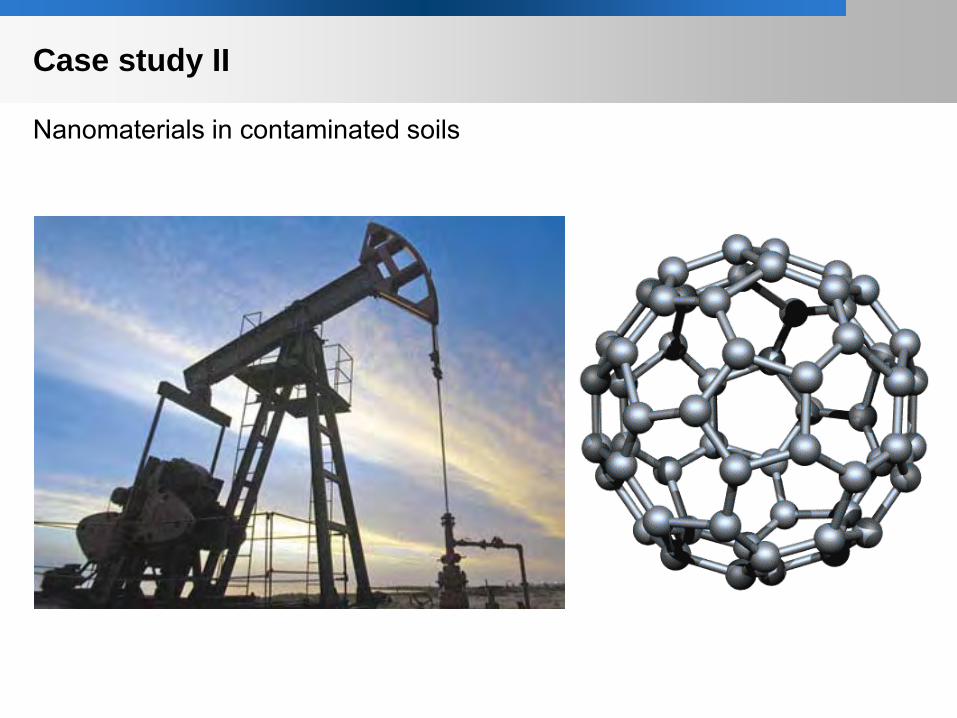
Case study II
Nanomaterials in contaminated soils
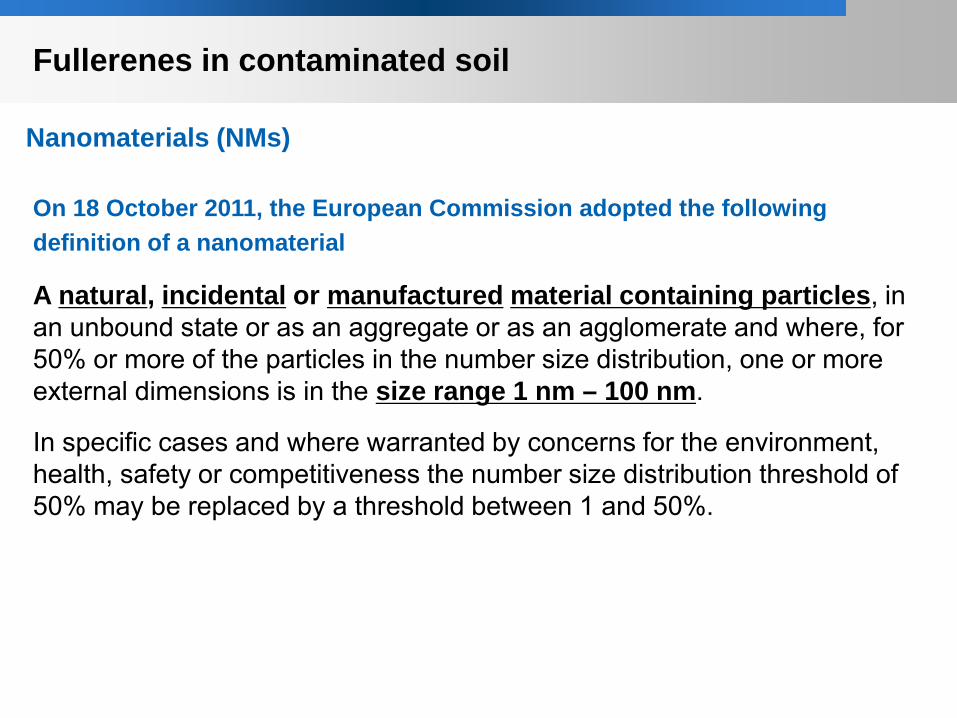
Nanomaterials (NMs)
Fullerenes in contaminated soil
On 18 October 2011, the European Commission adopted the following definition of a nanomaterial
A natural, incidental or manufactured material containing particles, in an unbound state or as an aggregate or as an agglomerate and where, for 50% or more of the particles in the number size distribution, one or more external dimensions is in the size range 1 nm – 100 nm.
In specific cases and where warranted by concerns for the environment, health, safety or competitiveness the number size distribution threshold of 50% may be replaced by a threshold between 1 and 50%.
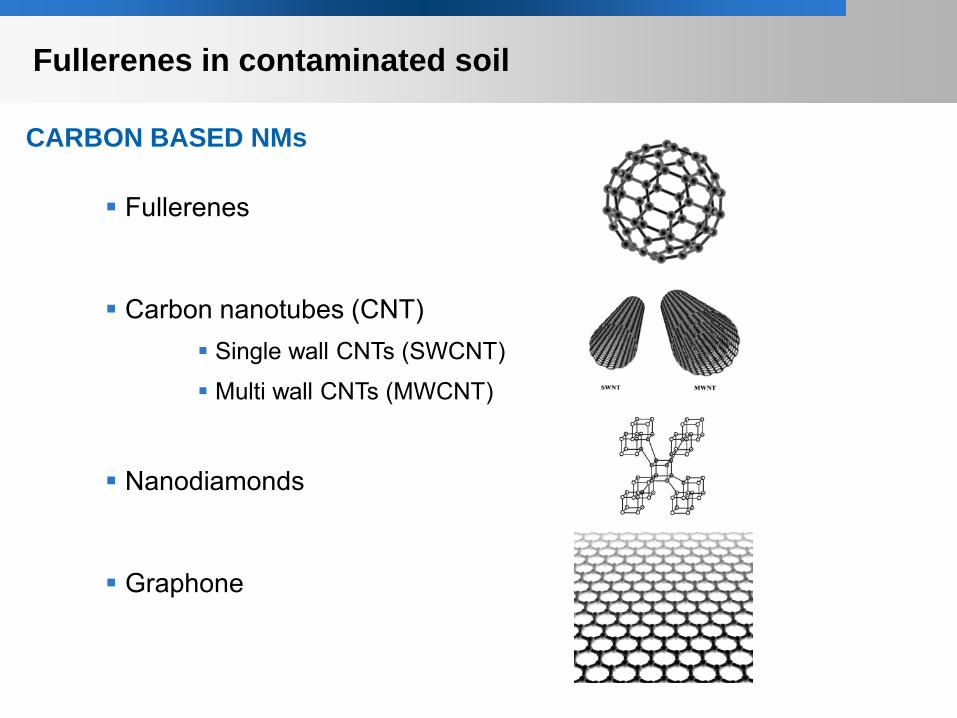
CARBON BASED NMs
Fullerenes
Carbon nanotubes (CNT) Single wall CNTs (SWCNT)
Multi wall CNTs (MWCNT)
Nanodiamonds
Graphone
Fullerenes in contaminated soil

Sources of FULLERENES
Natural fullerenes Volcanic eruptions Forest fires Minerals
Incidental Emission Car and plane brakes Car emmisions Industrial processes
Nanotechnology Microelectronics Consumers products Nanomedicine
Shungite Chondrite
Cretaceous–Tertiary boundary sediments
CURRENTLY MAIN SOURCE
FUTURE MAIN SOURCE????
Fullerenes in contaminated soil
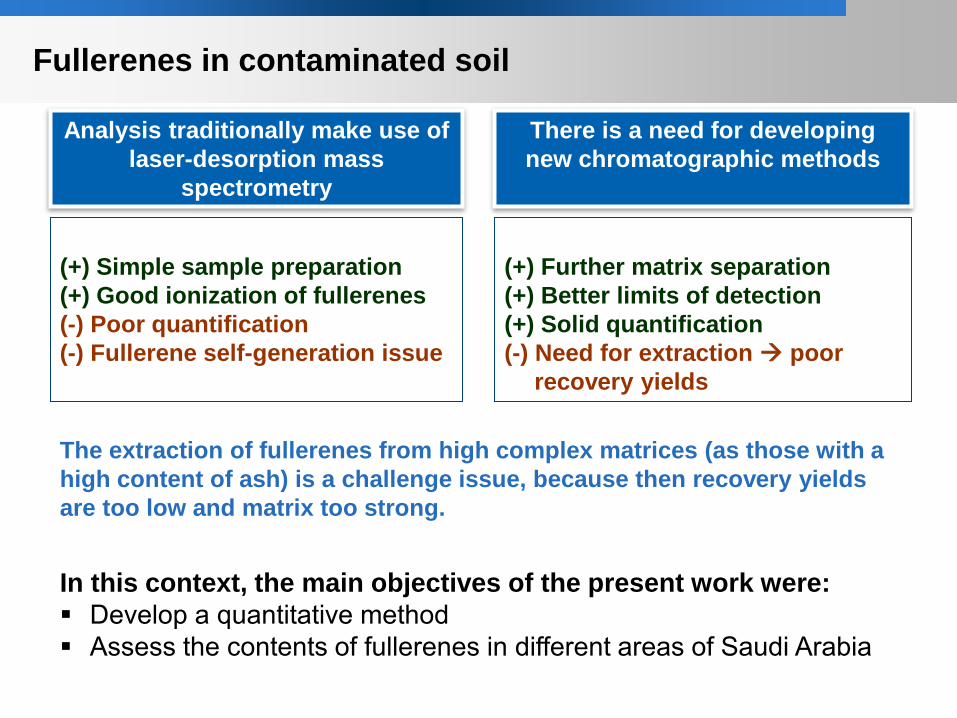
Analysis traditionally make use of laser-desorption mass
spectrometry
(+) Simple sample preparation (+) Good ionization of fullerenes (-) Poor quantification (-) Fullerene self-generation issue
(+) Further matrix separation (+) Better limits of detection (+) Solid quantification (-) Need for extraction poor
recovery yields
There is a need for developing new chromatographic methods
Fullerenes in contaminated soil
The extraction of fullerenes from high complex matrices (as those with a high content of ash) is a challenge issue, because then recovery yields are too low and matrix too strong.
In this context, the main objectives of the present work were: Develop a quantitative method Assess the contents of fullerenes in different areas of Saudi Arabia
Fullerenes in contaminated soil
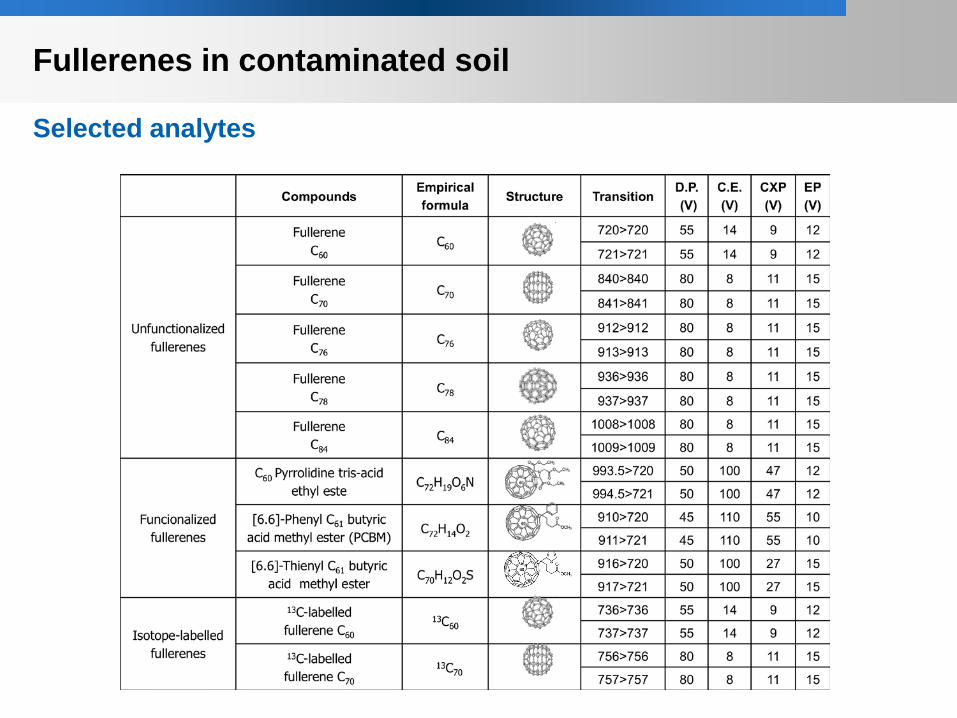
Selected analytes

Soils from Saudi Arabia: Sampling locations
Riyadh
Al-Diriyah
Al-Jubail
Yanbu' Al Bahr
SAUDI ARABIA
Samples were taken from 4 sample locations.
Fullerenes in contaminated soil
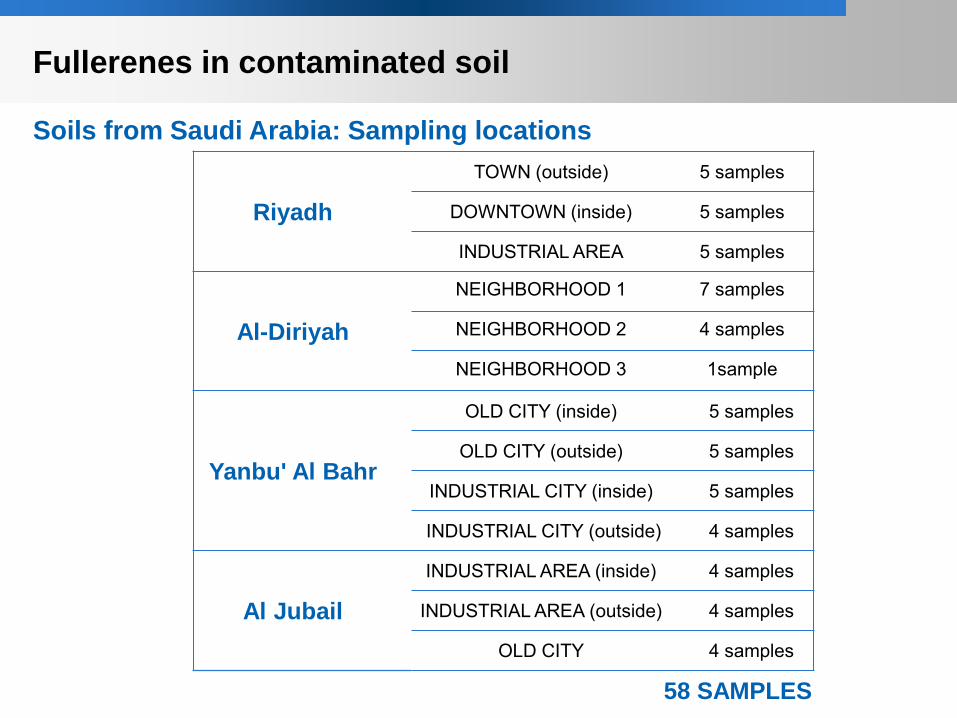
Riyadh
TOWN (outside) 5 samples
DOWNTOWN (inside) 5 samples
INDUSTRIAL AREA 5 samples
Al-Diriyah
NEIGHBORHOOD 1 7 samples
NEIGHBORHOOD 2 4 samples
NEIGHBORHOOD 3 1sample
Yanbu' Al Bahr
OLD CITY (inside) 5 samples
OLD CITY (outside) 5 samples
INDUSTRIAL CITY (inside) 5 samples
INDUSTRIAL CITY (outside) 4 samples
Al Jubail
INDUSTRIAL AREA (inside) 4 samples
INDUSTRIAL AREA (outside) 4 samples
OLD CITY 4 samples
58 SAMPLES
Soils from Saudi Arabia: Sampling locations
Fullerenes in contaminated soil

Ultrasound assisted extraction with toluene during 8 hours show good performance in most of the samples, however for some of them with high contents of ash C60 was detected but the quantification was not possible
REAL SAMPLE C60 fullerene – 1.54 µg/kg
Four samples present quantifiable concentrations of C60 fullerene:
Riyadh (outside) Riyadh (outside) Al-Jubail (industrial area) Yanbu' Al Bahr (old city)
Fullerenes in contaminated soil
Fullerenes in contaminated soil
Some of the samples presented C60 but other fullerenes were not detected, indicating that the origin is combustion processes from cars or from industrial areas. Positive samples from cities can be directly related to traffic engines. The range of concentrations was 0.15 and 2.15 ng/g Industrial areas were suspected to be contaminated with both C60 and C70, but quantification was not achieved because a strong ion suppression and low recovery rates Positive samples from industrial areas presented also C60 and the concentrations found were higher that in city areas presenting values between 4.35-6.83 ng/g

Conclusion
Two analytical method have been developed and applied to the analysis of emerging contaminants in the environment.
In case of plastic pellets, perfluoroalkyl substances were analysed in comparison to sediments from same sampling areas. Good correlation was found between both matrices, but plastic pellets presented higher concentrations.
Plastic are relevant sources of contamination because during the first periods these materials acts as a source of contaminants. In addition are highly persisten materials that can act stabilizing other contaminants, such as POPs.
On the other hand, sea plastic pellets are possible passive samplers of the diffuse pollution in an area, as in the examples presented here for PFASs
Carbon based materials are an emerging class of contamination because the increasing amount of combustion processes and is expected by the nanotechnology.
In this case the presence of fullerenes was studied in different areas of Saudi Arabia and the results showed that this type of contamination can be associated to some industrial processes and traffic engines but not to the nanotechnology. However the method presented here should be refined to overcome some limitations associated to highly contaminated samples with ash.