rd uarterly report 217 1 contents - fatima...
TRANSCRIPT


1
1
3rd Quarterly Report 2017
Contents
02 Company Information 04 Directors’ Report to the Members Separate Financial Statements
08 Condensed Interim Balance Sheet 10 Condensed Interim Profit and Loss Account 11 Condensed Interim Statement of Comprehensive Income 12 Condensed Interim Statement of Changes in Equity 13 Condensed Interim Cash Flow Statement 14 Notes to and Forming Part of the Condensed Interim Financial Statements
Consolidated Financial Statements
26 Condensed Interim Consolidated Balance Sheet 28 Condensed Interim Consolidated Profit and Loss Account 29 Condensed Interim Consolidated Statement of Comprehensive Income30 Condensed Interim Consolidated Statement of Changes in Equity 31 Condensed Interim Consolidated Cash Flow Statement 32 Notes to and Forming Part of the Condensed Interim Consolidated Financial Statements
2
2
Fatima Fertilizer Company Limited
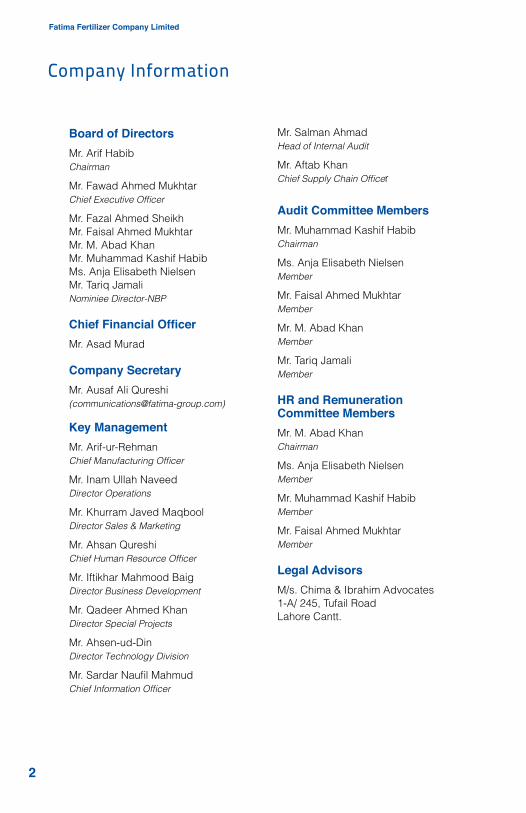
Company Information
Board of DirectorsMr. Arif Habib Chairman
Mr. Fawad Ahmed MukhtarChief Executive Officer
Mr. Fazal Ahmed SheikhMr. Faisal Ahmed Mukhtar Mr. M. Abad Khan Mr. Muhammad Kashif HabibMs. Anja Elisabeth NielsenMr. Tariq JamaliNominiee Director-NBP
Chief Financial Officer Mr. Asad Murad
Company Secretary Mr. Ausaf Ali Qureshi([email protected])
Key ManagementMr. Arif-ur-RehmanChief Manufacturing Officer
Mr. Inam Ullah NaveedDirector Operations
Mr. Khurram Javed MaqboolDirector Sales & Marketing
Mr. Ahsan QureshiChief Human Resource Officer
Mr. Iftikhar Mahmood BaigDirector Business Development
Mr. Qadeer Ahmed KhanDirector Special Projects
Mr. Ahsen-ud-DinDirector Technology Division
Mr. Sardar Naufil MahmudChief Information Officer
Mr. Salman AhmadHead of Internal Audit
Mr. Aftab KhanChief Supply Chain Officer
Audit Committee MembersMr. Muhammad Kashif HabibChairman
Ms. Anja Elisabeth NielsenMember
Mr. Faisal Ahmed MukhtarMember
Mr. M. Abad KhanMember
Mr. Tariq JamaliMember
HR and Remuneration Committee MembersMr. M. Abad KhanChairman
Ms. Anja Elisabeth NielsenMember
Mr. Muhammad Kashif HabibMember
Mr. Faisal Ahmed MukhtarMember
Legal AdvisorsM/s. Chima & Ibrahim Advocates1-A/ 245, Tufail RoadLahore Cantt.

3
3
3rd Quarterly Report 2017
AuditorsDeloitte Yousuf AdilChartered Accountants(A member firm of Deloitte Touche Tohmatsu Limited)
134-A, Abubakar Block,New Garden Town, LahorePh: +92 42 35913595 - 7, +92 42 35440520Fax: +92 42 35440521Web: www.deloitte.com.pk
Cost AuditorsKPMG Taseer Hadi & Co.Chartered Accountants
Service House2nd Floor2-Main Gulberg Jail Road,Lahore, PakistanTel: +92 42 3579 0901-6Fax: +92 42 3579 0907Web: www.kpmg.com.pk
Registrar and ShareTransfer AgentCentral Depository Company of Pakistan Limited Share Registrar Department CDC House, 99 – B, Block ‘B’, S.M.C.H.S., Main Shahra-e-FaisalKarachi-74400.Tel: Customer Support Services (Toll Free) 0800-CDCPL (23275)Fax: (92-21) 34326053Email: [email protected] Website: www.cdcpakistan.com
BankersAllied Bank LimitedAskari Bank LimitedBank Alfalah LimitedBank Al-Habib LimitedBankIslami Pakistan LimitedCitibank N.A.Faysal Bank LimitedHabib Bank LimitedHabib Metropolitan Bank LimitedMCB Bank LimitedMeezan Bank LimitedNational Bank of PakistanNIB Bank LimitedPak China Investment Company Limited (“NBFI”)Sindh Bank LimitedSoneri Bank LimitedStandard Chartered Bank (Pakistan) LimitedStandard Chartered Bank , United KingdomSummit Bank LimitedThe Bank of KhyberThe Bank of PunjabUnited Bank Limited
Registered Office / Head OfficeE-110, Khayaban-e-Jinnah, Lahore Cantt., Pakistan.UAN: 111-FATIMA (111-328-462)Fax: 042-36621389
Plant SiteMukhtar Garh, Sadiqabad, Distt. Rahim Yar Khan, Pakistan.Tel: 068-5951000Fax: 068-5951166

4
4
Fatima Fertilizer Company Limited
Dear Shareholders,
On behalf of the Board of Directors of Fatima Fertilizer Company Limited, I am pleased to present the un-audited financial statements of the for the nine months ended September 30, 2017 along with brief overview of operational and financial performance of the Company.
Market Overview - Global
International Urea prices picked up during the 3rd quarter mainly due to controlled supply conditions and increase in demand especially from India. The outlook for the Urea market in October-December quarter is stable to firm. The international market for Phosphate remained firm throughout the quarter with the DAP price range of $340-$370/Ton CFR being offered by Chinese and Saudi’s respectively. The quarter was dominated mainly by demand arising from East of Suez countries such as Pakistan, Bangladesh and India procuring their requirements for Rabi season.
Market Overview - Pakistan
The overall Industry sales were considerably higher in the 3rd quarter of 2017 as compared to same period of 2016. Buoyed by improved farm economics and continued subsidy support on Urea and Sales Tax reduction on other fertilizers by the Government, the domestic sales of both Urea and DAP increased by 17% and 31% respectively.
Company Performance
Building on the momentum from second half of year 2016 the Company achieved its highest ever sales volumes in a nine month period. The sales volumes achieved are higher by 34% for the same period last year. Bolstered by exports, Urea sales improved by a hefty 74%. CAN sales also register a healthy increase of 59%. The sales of NP however declined by 14% however Company expects improved sales in Rabi, and is confident to recover the shortfall.
Sales Volume
Jan to Sep - 2017 Jan to Sep - 2016Products (“000” Tons)
Urea 389 224Can 405 255NP 266 309
Total 1,060 788
Plant performance remained satisfactory. Advanced process control implemented at Ammonia plant resulted in energy optimization and reduced process variability. The production volumes achieved for the nine months were lower by 12% over the same period last year due to execution of first ever 18-month cycle plant turnaround in April, which had historically been a 12-month activity. With increasing plant reliability and management resolve to achieve operational excellence, the next turnaround is planned after 24 months.
Jan to Sep - 2017 Jan to Sep - 2016Products (“000” Tons)
Ammonia 394 446Nitric Acid 356 387Urea 338 389CAN 323 354NP 264 310
Directors’ Report to the Members

5
5
3rd Quarterly Report 2017
Total revenue generated amounted to PKR 26.08 Billion against PKR 22.91 Billion posted in same period last year. Urea was the lead contributor to revenue with 36%, while NP and CAN contributed 33% and 30% respectively. Sales of Nitric Acid and CER sales made up rest 1%.
Gross Profit for the period stands at PKR 13.55 Billion up by 13% against PKR 11.96 Billion for the same period last year. Distribution Expenses increased by 63% due to increase in sales volumes, fuel prices, amplified sales promotions and advertisements. Administrative Expenses increased by 16% over the same period last year, mainly due to 59% increase in CSR expense. Finance Cost was lower by 16% owing mainly to 46% decline in debt servicing cost on working capital financing on the back of markup rates optimization and better cash flow generation from operations as a result of improved fertilizer off-take.
As a result, the Company posted Profit before Tax of PKR 8.23 Billion and After Tax Profit of PKR 6.67 Billion higher by 9% and 5% respectively compared to PKR 7.55 Billion and 6.37 Billion respectively posted for comparative period last year.
Overall HSE performance remained excellent ad Fatima Site achieved combined 40.80 Million safe man-hours and TRIR 0.082 by September 30, 2017.
Sales Mix Q3, 2017 (PKR in Million)
9,445
8,604
7,773
257
CAN NP Urea Nitric Acidand CER
Sales Mix Q3, 2016 (PKR in Million)
6,339
11,019
5,385
164
CAN NP Urea Nitric Acidand CER
Financial Performance
Turnover Gross Profit EBITDA Profit after tax
Sep - 17
Rup
ees
in (M
illio
n)
Sep - 16 Sep - 150
5000
10000
15000
20000
25000
30000

6
6
Fatima Fertilizer Company Limited
Directors’ Report to the Members
Consolidated Financial Results
During the nine months ended September 30, 2017, Fatimafert Limited (FF) produced 108,493 MT Urea against 271,147 MT produced in the same period last year due to intermittent plant operations resulting from non availability of natural gas. Sales volumes of Urea were however higher by 57% as FF sold 197,716 MT of Urea compared to 126,241 MT sold till September 30, 2016. In addition to Urea, FF has also sold 41,565 MT of imported DAP.
PKR in Million
Sale 33,240Gross Profit 12,206Profit Before Tax 6,108Profit After Tax 5,620
Merger of Fatima Fertilizer Company Limited and Fatimfert Limited
The Board has considered and approved merger of Fatima Fertilizer Company Limited and its wholly owned subsidiary, Fatimafert Limited from January 01, 2018 in principle. The merger is expected to add value to the consolidated results of the Company from the benefits of synergies, cost efficiencies and better use brands.
The proposed merger would be subject to receipt of all requisite corporate and regulatory authorizations, consents and approvals.
Future Outlook
Keeping its momentum, hefty off-take is expected in the upcoming Rabi season. Due to availability of stocks of all the products and plant operations at optimal efficiency and sustainability levels, the Company is well positioned to play its role in meeting fertilizer demand in the country. Based on strong volumetric and pricing fundamentals, the Company is expected to continue posting strong financial performance with improved values for the stakeholders. Acknowledgements
The Board places on record its gratitude for the hard work and dedication of every employee of the Company. The Board also appreciates and acknowledges the assistance, guidance and cooperation of all stakeholders including the Government of Pakistan, financial institutions, commercial banks, business associates, customers and all others whose efforts and contributions strengthened the Company.
For and on behalf of the Board
Lahore Arif HabibOctober 23, 2017 Chairman

7
7
3rd Quarterly Report 2017
Fatima Fertilizer Company LimitedCondensed Interim
Financial Statementsfor the nine months ended September 30, 2017

Fatima Fertilizer Company Limited I Separate Financial Statements
8
Un audited Audited Note September 30, 2017 December 31, 2016
(Rupees in thousand)
EQUITY AND LIABILITIES CAPITAL AND RESERVES Authorized share capital 2,500,000,000 (December 31, 2016: 2,500,000,000) shares of Rs 10 each 25,000,000 25,000,000
Issued, subscribed and paid up share capital 2,100,000,000 (December 31, 2016: 2,100,000,000) ordinary shares of Rs 10 each 21,000,000 21,000,000
Reserves 4 28,848,493 26,374,016
49,848,493 47,374,016 NON CURRENT LIABILITIES
Long term finances 5 13,426,353 16,342,734 Deferred liabilities 6 15,895,782 15,641,812 Long term deposits 54,682 50,767
29,376,817 32,035,313 CURRENT LIABILITIES
Trade and other payables 9,268,985 17,399,012 Accrued finance cost 525,426 259,420 Short term finances - secured 7 7,665,532 8,011,332 Current maturity of long term finance 5 5,575,817 5,518,025
23,035,760 31,187,789
CONTINGENCIES & COMMITMENTS 8 102,261,070 110,597,118 The annexed explanatory notes from 1 to 21 form an integral part of these condensed interim financial statements.
Condensed Interim Balance SheetAs at September 30, 2017
3rd Quarterly Report 2017
9
Un audited Audited Note September 30, 2017 December 31, 2016
(Rupees in thousand)
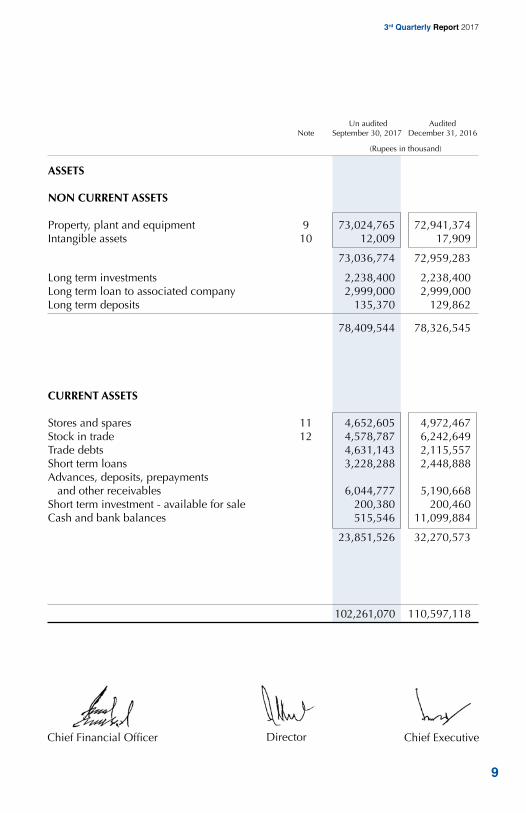
ASSETS NON CURRENT ASSETS Property, plant and equipment 9 73,024,765 72,941,374 Intangible assets 10 12,009 17,909
73,036,774 72,959,283
Long term investments 2,238,400 2,238,400 Long term loan to associated company 2,999,000 2,999,000 Long term deposits 135,370 129,862
78,409,544 78,326,545
CURRENT ASSETS
Stores and spares 11 4,652,605 4,972,467 Stock in trade 12 4,578,787 6,242,649 Trade debts 4,631,143 2,115,557 Short term loans 3,228,288 2,448,888 Advances, deposits, prepayments and other receivables 6,044,777 5,190,668Short term investment - available for sale 200,380 200,460 Cash and bank balances 515,546 11,099,884
23,851,526 32,270,573
102,261,070 110,597,118
Chief ExecutiveDirectorChief Financial Officer

Fatima Fertilizer Company Limited I Separate Financial Statements
10
Three months ended Nine months ended
Note September 30 September 30 September 30 September 30 2017 2016 2017 2016
(Rupees in thousand)
Sales 13 8,386,617 10,132,532 26,078,355 22,908,140 Cost of sales 14 (3,693,851) (4,497,576) (12,528,970) (10,942,405)
Gross profit 4,692,766 5,634,956 13,549,385 11,965,735 Distribution cost (880,561) (596,721) (2,398,132) (1,468,932)Administrative expenses (323,649) (341,911) (1,153,720) (995,325)
3,488,556 4,696,324 9,997,533 9,501,478 Finance cost 15 (558,550) (624,628) (1,607,588) (1,924,319)Other operating expenses (185,480) (289,688) (533,219) (554,320)
2,744,526 3,782,008 7,856,726 7,022,839 Other income 112,486 182,922 371,474 532,128
Profit before tax 2,857,012 3,964,930 8,228,200 7,554,967 Taxation (473,525) (569,680) (1,553,723) (1,184,363)
Profit for the period 2,383,487 3,395,250 6,674,477 6,370,604 Earnings per share - basic and diluted (Rupees) 17 1.13 1.62 3.18 3.03 The annexed explanatory notes from 1 to 21 form an integral part of these condensed interim financial statements.
Condensed Interim Profit and Loss Account (Un audited)For the nine months ended September 30, 2017
Chief ExecutiveDirectorChief Financial Officer
3rd Quarterly Report 2017
11
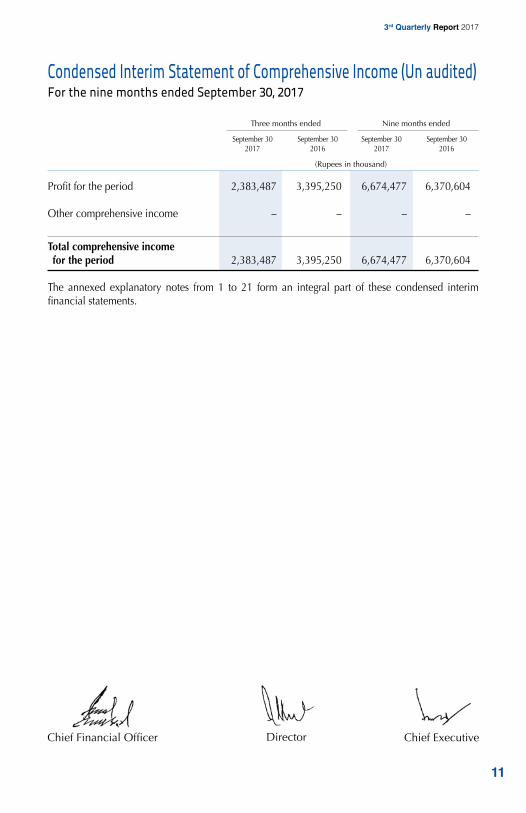
Three months ended Nine months ended
September 30 September 30 September 30 September 30 2017 2016 2017 2016
(Rupees in thousand)
Profit for the period 2,383,487 3,395,250 6,674,477 6,370,604 Other comprehensive income – – – –
Total comprehensive income for the period 2,383,487 3,395,250 6,674,477 6,370,604 The annexed explanatory notes from 1 to 21 form an integral part of these condensed interim financial statements.
Condensed Interim Statement of Comprehensive Income (Un audited)For the nine months ended September 30, 2017
Chief ExecutiveDirectorChief Financial Officer
Fatima Fertilizer Company Limited I Separate Financial Statements
12
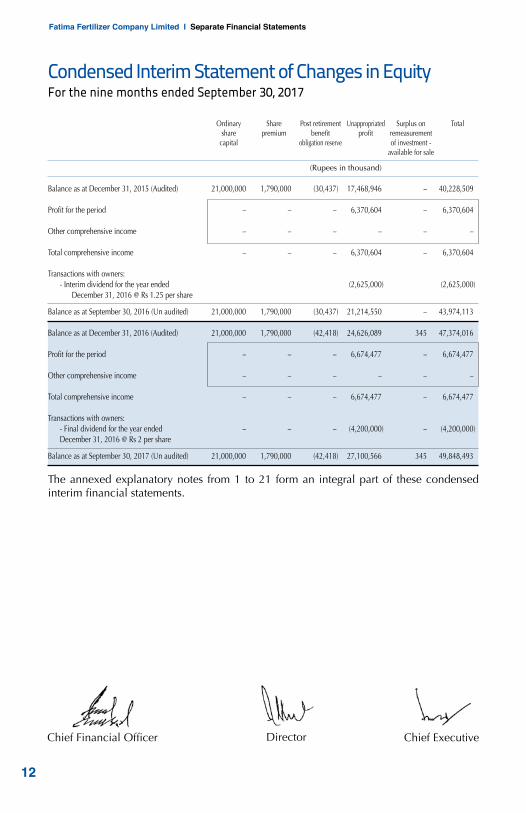
Ordinary Share Post retirement Unappropriated Surplus on Total share premium benefit profit remeasurement capital obligation reserve of investment - available for sale
(Rupees in thousand)
Balance as at December 31, 2015 (Audited) 21,000,000 1,790,000 (30,437) 17,468,946 – 40,228,509 Profit for the period – – – 6,370,604 – 6,370,604 Other comprehensive income – – – – – – Total comprehensive income – – – 6,370,604 – 6,370,604 Transactions with owners: - Interim dividend for the year ended (2,625,000) (2,625,000) December 31, 2016 @ Rs 1.25 per share
Balance as at September 30, 2016 (Un audited) 21,000,000 1,790,000 (30,437) 21,214,550 – 43,974,113 Balance as at December 31, 2016 (Audited) 21,000,000 1,790,000 (42,418) 24,626,089 345 47,374,016 Profit for the period – – – 6,674,477 – 6,674,477 Other comprehensive income – – – – – – Total comprehensive income – – – 6,674,477 – 6,674,477 Transactions with owners: - Final dividend for the year ended – – – (4,200,000) – (4,200,000) December 31, 2016 @ Rs 2 per share
Balance as at September 30, 2017 (Un audited) 21,000,000 1,790,000 (42,418) 27,100,566 345 49,848,493
The annexed explanatory notes from 1 to 21 form an integral part of these condensed interim financial statements.
Condensed Interim Statement of Changes in EquityFor the nine months ended September 30, 2017
Chief ExecutiveDirectorChief Financial Officer
3rd Quarterly Report 2017
13
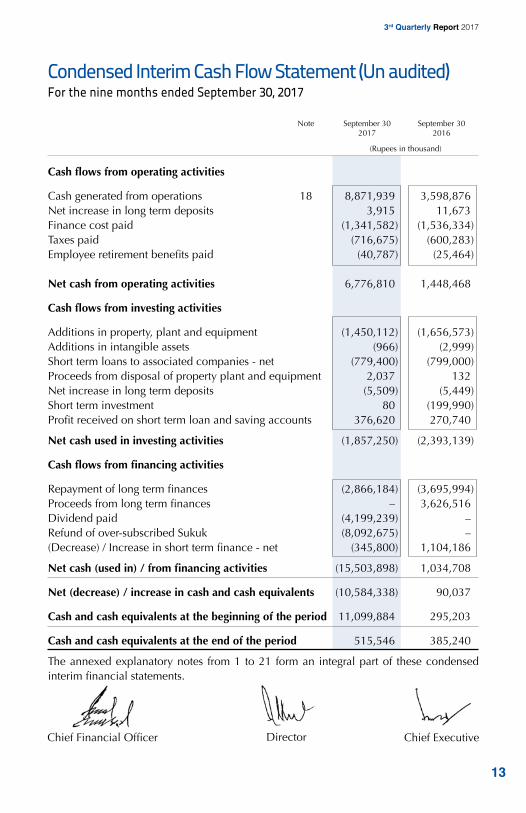
Note September 30 September 30 2017 2016
(Rupees in thousand)
Cash flows from operating activities
Cash generated from operations 18 8,871,939 3,598,876Net increase in long term deposits 3,915 11,673 Finance cost paid (1,341,582) (1,536,334)Taxes paid (716,675) (600,283)Employee retirement benefits paid (40,787) (25,464) Net cash from operating activities 6,776,810 1,448,468
Cash flows from investing activities
Additions in property, plant and equipment (1,450,112) (1,656,573)Additions in intangible assets (966) (2,999)Short term loans to associated companies - net (779,400) (799,000)Proceeds from disposal of property plant and equipment 2,037 132 Net increase in long term deposits (5,509) (5,449)Short term investment 80 (199,990)Profit received on short term loan and saving accounts 376,620 270,740
Net cash used in investing activities (1,857,250) (2,393,139)
Cash flows from financing activities
Repayment of long term finances (2,866,184) (3,695,994)Proceeds from long term finances – 3,626,516 Dividend paid (4,199,239) – Refund of over-subscribed Sukuk (8,092,675) – (Decrease) / Increase in short term finance - net (345,800) 1,104,186
Net cash (used in) / from financing activities (15,503,898) 1,034,708
Net (decrease) / increase in cash and cash equivalents (10,584,338) 90,037
Cash and cash equivalents at the beginning of the period 11,099,884 295,203
Cash and cash equivalents at the end of the period 515,546 385,240
The annexed explanatory notes from 1 to 21 form an integral part of these condensed interim financial statements.
Condensed Interim Cash Flow Statement (Un audited)For the nine months ended September 30, 2017
Chief ExecutiveDirectorChief Financial Officer
Fatima Fertilizer Company Limited I Separate Financial Statements
14
1. Legal Status and nature of business
Fatima Fertilizer Company Limited (‘the Company’), was incorporated in Pakistan on December 24, 2003 as a public company under the Companies Ordinance, 1984. The Company is listed on Pakistan Stock Exchange.
The principal activity of the Company is manufacturing, producing, buying, selling, importing and exporting fertilizers and chemicals. Registered office of the Company is situated at E-110, Khayaban-e-Jinnah, Lahore Cantt. The manufacturing facility of the Company is located at Mukhtargarh, Sadiqabad, Pakistan.
These condensed interim financial statements are the separate financial statements
of the Company in which investments in subsidiary company and associates are accounted for on the basis of direct equity interest rather than on the basis of reported result. Consolidated financial statements are prepared separately.
2. Basis of preparation
2.1 These condensed interim financial statements of the Company for the nine months ended September 30, 2017 have been prepared in accordance with the requirements of the International Accounting Standard - 34: “Interim Financial Reporting” and provisions of and directives issued under the Companies Ordinance, 1984. In case where requirements differ, the provisions or directives issued under the Companies Ordinance, 1984 have been followed.
2.2 These condensed interim financial statements do not include all the information required
for full annual financial statements and should be read in conjunction with the annual financial statements of the Company for the year ended December 31, 2016. Comparative condensed interim balance sheet is extracted from annual audited financial statements for the year ended December 31, 2016 and comparative condensed interim profit and loss account, condensed interim statement of comprehensive income, condensed interim statement of changes in equity and condensed interim cash flow statement are extracted from un audited condensed interim financial statements for the nine months ended September 30, 2016.
2.3 These condensed interim financial statements are presented in Pak Rupees, which is the Company’s functional and presentation currency.
Notes to and Forming Part of the Condensed Interim Financial Statements (Un audited)For the nine months ended September 30, 2017

3rd Quarterly Report 2017
15
3. Accounting polices and estimates
The accounting policies, related judgments, estimates and related assumptions adopted for the preparation of these condensed interim financial statements are the same as those applied in the preparation of annual financial statements of the company for the year ended December 31, 2016.
Un audited Audited September 30, 2017 December 31, 2016
(Rupees in thousand)
4. Reserves
Capital reserve: Share premium 1,790,000 1,790,000
Revenue reserve: Unappropriated profit 27,100,566 24,626,089 Post retirement benefit obligation reserve (42,418) (42,418) Surplus on remeasurement of investments - available for sale 345 345
28,848,493 26,374,016
5. Long term finances
Rated, listed and secured Ijarah Sukuk Certificates 9,450,000 10,500,000 Secured loans from banking companies/ financial institutions 9,552,170 11,360,759
19,002,170 21,860,759 Less: Current maturity of long term finances 5,575,817 5,518,025
13,426,353 16,342,734 5.1 During the period, the Company has paid the installments due on Ijarah Sukuk
Certificates amounting to Rs 1,050 million (December 31, 2016: Rs Nil) and Rs 1,816.185 million (December 31, 2016 Rs 15,747.059 million) due on Secured loans from banking companies / financial institutions.
Fatima Fertilizer Company Limited I Separate Financial Statements
16
Un audited Audited Note September 30, 2017 December 31, 2016
(Rupees in thousand)
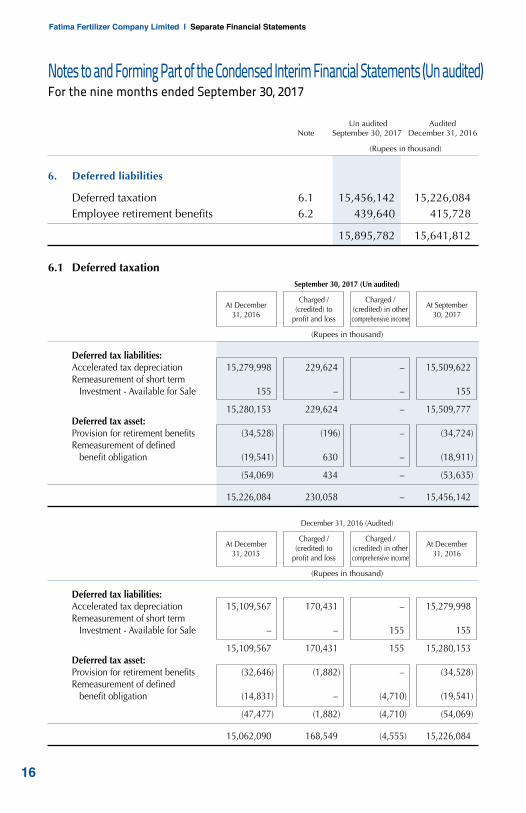
6. Deferred liabilities
Deferred taxation 6.1 15,456,142 15,226,084 Employee retirement benefits 6.2 439,640 415,728
15,895,782 15,641,812 6.1 Deferred taxation September 30, 2017 (Un audited)
At December
Charged / Charged / At September
31, 2016 (credited) to (credited) in other
30, 2017 profit and loss comprehensive income
(Rupees in thousand)
Deferred tax liabilities: Accelerated tax depreciation 15,279,998 229,624 – 15,509,622 Remeasurement of short term Investment - Available for Sale 155 – – 155
15,280,153 229,624 – 15,509,777 Deferred tax asset: Provision for retirement benefits (34,528) (196) – (34,724) Remeasurement of defined benefit obligation (19,541) 630 – (18,911)
(54,069) 434 – (53,635)
15,226,084 230,058 – 15,456,142 December 31, 2016 (Audited)
At December
Charged / Charged / At December
31, 2015 (credited) to (credited) in other
31, 2016 profit and loss comprehensive income
(Rupees in thousand)
Deferred tax liabilities: Accelerated tax depreciation 15,109,567 170,431 – 15,279,998 Remeasurement of short term Investment - Available for Sale – – 155 155
15,109,567 170,431 155 15,280,153 Deferred tax asset: Provision for retirement benefits (32,646) (1,882) – (34,528) Remeasurement of defined benefit obligation (14,831) – (4,710) (19,541)
(47,477) (1,882) (4,710) (54,069)
15,062,090 168,549 (4,555) 15,226,084
Notes to and Forming Part of the Condensed Interim Financial Statements (Un audited)For the nine months ended September 30, 2017

3rd Quarterly Report 2017
17
Un audited Audited September 30, 2017 December 31, 2016
(Rupees in thousand)
6.2 Employee retirement benefits
Gratuity 323,894 304,348 Accumulating compensated absences 115,746 111,380
439,640 415,728 7. Short term finances
The Company has obtained short term financing facilities from various banks for working capital requirements in the nature of Running Finance, Cash Finance and Financing against Imported Merchandise.
These facilities are secured by Pari Passu charge on present and future current assets of the Company with 25% margin over financed amount, pledge of raw material and finished goods and personal guarantees of sponsoring directors.
These facilities carry mark up ranging from 5.78% to 7.29% (December 31, 2016: 6.36% to 8.36%) per annum for Running Finance and Cash Finance and 6.54% to 7.26% (December 31, 2016: 6.54% to 7.59%) per annum for Finance against Imported Merchandise.
8. Contingencies and commitments
8.1 Contingencies
As at September 30, 2017, there is no material change in the status of contingencies as reported in the notes to the financial statements of the Company for the year ended December 31, 2016, except for the following:
i Appeals filed in the following cases have been decided in Company’s favor:
- Appeal filed with the Lahore High Court against the rejection of the application, under section 65 of the Sales Tax Act, 1990 (STA), made to the Commissioner Inland Revenue, Multan regarding exemption of sales tax estimating Rs 690 million inadvertently short levied/paid on sale of Calcium Ammonium Nitrate (CAN) for the period from April 18, 2011 to December 31, 2011.
- Appeal filed with the Appellate Tribunal Inland Revenue against the order passed by the Deputy Commissioner Inland Revenues (DCIR), RTO, Multan alleging that the Company claimed input tax amounting to Rs 154.87 million pertaining to an exempt period.
- Appeal filed with the Commissioner Inland Revenue (Appeals), against the order passed by Additional Commissioner Inland Revenue, Multan, alleging that the Company has not paid Sales tax on retail price on supplies of CAN and NP. Total demand raised was Rs 88.5 million

Fatima Fertilizer Company Limited I Separate Financial Statements
18
- Appeal filed with the Commissioner Inland Revenue (Appeals), against the order passed by the DCIR, Multan, in respect of Sales Tax audit proceedings conducted for the period from July 2011 to June 2012. Total demand raised was Rs 301.67 million.
ii Deciding on the appeal filed by the Company, CIR(A) has annulled the order passed by the DCIR RTO Multan, through which, demand of Rs 109.38 million had been adjudged against the Company in respect of impugned levy of further tax under SRO 648(I)/2013 dated July 9, 2013 on the Company’s sales for the period from July 2015 to June 2016. The department has challenged the order of CIR(A) before the ATIR.
8.2 Commitments in respect of :
(i) Contracts for capital expenditure Rs 122.582 million (December 31, 2016: Rs 572.861 million).
(ii) Contracts for other than capital expenditure Rs 145.494 million (December 31, 2016: Rs 107.455 million).
(iii) The amount of future payments under non cancellable operating leases and the period in which these payments will become due are as follows:
Un audited Audited Note September 30, 2017 December 31, 2016
(Rupees in thousand)
Not later than one year 340,196 288,876 Later than one year but not later than five years 174,282 189,670
514,478 478,546
9. Property, plant and equipment
Operating fixed assets- tangible 9.1 69,532,859 70,493,773 Capital work in progress 9.2 3,491,906 2,447,601
73,024,765 72,941,374
9.1 Movement of operating fixed assets- tangible
Opening book value 70,493,773 69,390,580 Add: additions during the period 9.1.1 405,807 2,897,853 Less: book value of disposals during the period 844 136
70,898,736 72,288,297 Less: depreciation charged during the period 1,365,877 1,794,524
Closing book value 69,532,859 70,493,773
Notes to and Forming Part of the Condensed Interim Financial Statements (Un audited)For the nine months ended September 30, 2017

3rd Quarterly Report 2017
19
Un audited Audited September 30, 2017 December 31, 2016
(Rupees in thousand)
9.1.1 Additions during the period
Freehold land 1,112 – Building 12,073 79,487 Plant and machinery 265,055 2,684,870 Furniture and fixtures 1,110 10,532 Office equipment 3,097 4,889 Electric installations and appliances 73,416 60,549 Computers 30,518 38,056 Vehicles 19,426 19,470
405,807 2,897,853 9.2 Capital work in progress
Civil works 713,976 648,360 Plant and machinery 1,867,956 828,219 Capital stores 345,541 326,078 Advances : - Freehold land 158,966 159,758 - Civil works 3,792 4,328 - Plant and machinery 101,675 180,858 - Other advances 300,000 300,000
564,433 644,944
3,491,906 2,447,601 9.2.1 Movement of capital work in progress
Opening balance 2,447,601 4,018,510 Addition during the period 1,214,363 1,958,985
3,661,964 5,977,495 Less: Capitalization during the period 170,058 2,613,512 Plant and machinery written off – 916,382
Closing balance 3,491,906 2,447,601

Fatima Fertilizer Company Limited I Separate Financial Statements
20
Un audited Audited September 30, 2017 December 31, 2016
(Rupees in thousand)
10. Intangible assets Opening book value 17,909 26,370 Add: additions during the period 966 7,885
18,875 34,255 Less: amortization charged during the period 6,866 16,346
Closing book value 12,009 17,909
11. Stores and spares
Stores 214,451 244,080 Spares 3,589,486 3,845,187 Catalyst and chemicals 848,668 883,200
4,652,605 4,972,467
12. Stock in trade
Raw material {including in-transit Rs 676.669 million (December 31, 2016: Rs 886.215 million)} 1,302,669 1,692,184 Packing material 23,164 7,181
Mid Products
Ammonia 14,928 10,986 Nitric Acid 16,915 4,507 Others 389 369
32,232 15,862 Finished goods
Urea 1,228,787 1,859,200 NP 1,212,989 1,405,781 CAN 714,723 1,193,754 Certified emission reductions 64,223 68,687
3,220,722 4,527,422
4,578,787 6,242,649
Notes to and Forming Part of the Condensed Interim Financial Statements (Un audited)For the nine months ended September 30, 2017

3rd Quarterly Report 2017
21
Three months ended Nine months ended
September 30 September 30 September 30 September 30 2017 2016 2017 2016
(Rupees in thousand)
13. Sales
Fertilizer Products - Local Sales 6,910,752 9,447,583 23,501,101 21,662,881 - Export 1,686,810 - 2,009,430 – Subsidy from Government of Pakistan 140,265 955,173 1,845,868 1,832,694 Mid products 45,206 46,167 174,197 164,032 Certified emission reductions – – 82,924 –
8,783,033 10,448,923 27,613,520 23,659,607 Less : Discounts 396,416 316,391 1,535,165 751,467
8,386,617 10,132,532 26,078,355 22,908,140
13.1 Sales are exclusive of sales tax of Rs 2,992.742 million (September 30, 2016: Rs 3,575.525 million). Three months ended Nine months ended
September 30 September 30 September 30 September 30 2017 2016 2017 2016
(Rupees in thousand)
14. Cost of sales
Raw material consumed 1,336,423 1,479,706 3,574,169 5,001,256 Packing material consumed 215,636 204,213 567,460 610,574 Salaries, wages and other benefits 477,001 449,728 1,752,234 1,440,724 Fuel and power 729,903 799,828 2,054,207 2,744,104 Chemicals and catalyst consumed 120,310 91,823 343,033 292,383 Stores and spares consumed 171,474 156,852 927,819 481,414 Technical assistance 16,041 38,152 52,346 67,980 Repair and maintenance 51,253 52,862 316,681 186,621 Insurance 35,569 43,029 102,580 121,893 Travelling and conveyance 19,820 17,131 62,323 68,965 Rent, rates and taxes 2,069 761 36,225 4,950 Vehicle running and maintenance 11,695 10,591 32,935 29,135 Depreciation 439,327 435,115 1,315,919 1,293,605 Others 32,988 26,449 100,709 78,388
Manufacturing cost 3,659,509 3,806,240 11,238,640 12,421,992
Opening stock of mid products 30,960 25,131 15,862 29,457 Closing stock of mid products (32,232) (28,169) (32,232) (28,169)
Cost of goods manufactured 3,658,237 3,803,202 11,222,270 12,423,280
Opening stock of finished goods 3,256,336 6,381,124 4,527,422 4,205,875 Closing stock of finished goods (3,220,722) (5,686,750) (3,220,722) (5,686,750)
3,693,851 4,497,576 12,528,970 10,942,405
Fatima Fertilizer Company Limited I Separate Financial Statements
22
Notes to and Forming Part of the Condensed Interim Financial Statements (Un audited)For the nine months ended September 30, 2017
Three months ended Nine months ended
September 30 September 30 September 30 September 30 2017 2016 2017 2016
(Rupees in thousand)
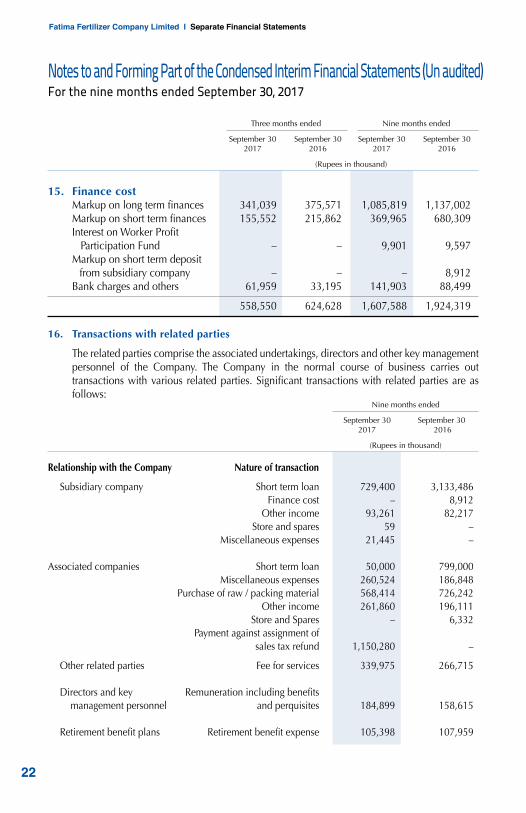
15. Finance cost Markup on long term finances 341,039 375,571 1,085,819 1,137,002 Markup on short term finances 155,552 215,862 369,965 680,309 Interest on Worker Profit Participation Fund – – 9,901 9,597 Markup on short term deposit from subsidiary company – – – 8,912 Bank charges and others 61,959 33,195 141,903 88,499
558,550 624,628 1,607,588 1,924,319
16. Transactions with related parties
The related parties comprise the associated undertakings, directors and other key management personnel of the Company. The Company in the normal course of business carries out transactions with various related parties. Significant transactions with related parties are as follows:
Nine months ended
September 30 September 30 2017 2016
(Rupees in thousand)
Relationship with the Company Nature of transaction
Subsidiary company Short term loan 729,400 3,133,486 Finance cost – 8,912 Other income 93,261 82,217 Store and spares 59 – Miscellaneous expenses 21,445 – Associated companies Short term loan 50,000 799,000 Miscellaneous expenses 260,524 186,848 Purchase of raw / packing material 568,414 726,242 Other income 261,860 196,111 Store and Spares – 6,332 Payment against assignment of sales tax refund 1,150,280 –
Other related parties Fee for services 339,975 266,715 Directors and key Remuneration including benefits management personnel and perquisites 184,899 158,615
Retirement benefit plans Retirement benefit expense 105,398 107,959

3rd Quarterly Report 2017
23
Three months ended Nine months ended
September 30 September 30 September 30 September 30 2017 2016 2017 2016
(Rupees in thousand)
17. Earnings per share - basic and diluted
Profit attributable to ordinary shareholders 2,383,487 3,395,250 6,674,477 6,370,604
(Number of shares)
Weighted average number of shares 2,100,000,000 2,100,000,000 2,100,000,000 2,100,000,000
Basic and diluted earnings per share (Rupees) 1.13 1.62 3.18 3.03
Nine months ended
September 30 September 30 2017 2016
(Rupees in thousand)
18. Cash generated from operations
Profit before tax 8,228,200 7,554,967 Adjustments for : Depreciation on property, plant and equipment 1,365,877 1,342,665 Amortization of intangible assets 6,866 13,573 Finance cost 1,607,588 1,924,319 Exchange loss on revaluation of foreign currency liabilities 7,595 – Provision for staff retirement benefits 64,699 72,117 Profit on short term loan to subsidiary and associated companies (355,121) (278,328) Profit on saving accounts (16,190) (15,973) Gain on disposal of property plant and equipment (1,193) (132)
2,680,121 3,058,241
Operating cash flows before working capital changes 10,908,321 10,613,208
Effect on cash flow due to working capital changes: (Increase)/decrease in current assets: Stores and spares 319,862 (483,851) Stock in trade 1,663,862 (82,796) Trade debts (2,515,586) (167,246) Loans, advances, deposits, prepayments and other receivables (1,466,407) (6,274,846) Decrease in creditors, accrued and other liabilities (38,113) (5,593)
(2,036,382) (7,014,332)
8,871,939 3,598,876
Fatima Fertilizer Company Limited I Separate Financial Statements
24
Notes to and Forming Part of the Condensed Interim Financial Statements (Un audited)For the nine months ended September 30, 2017
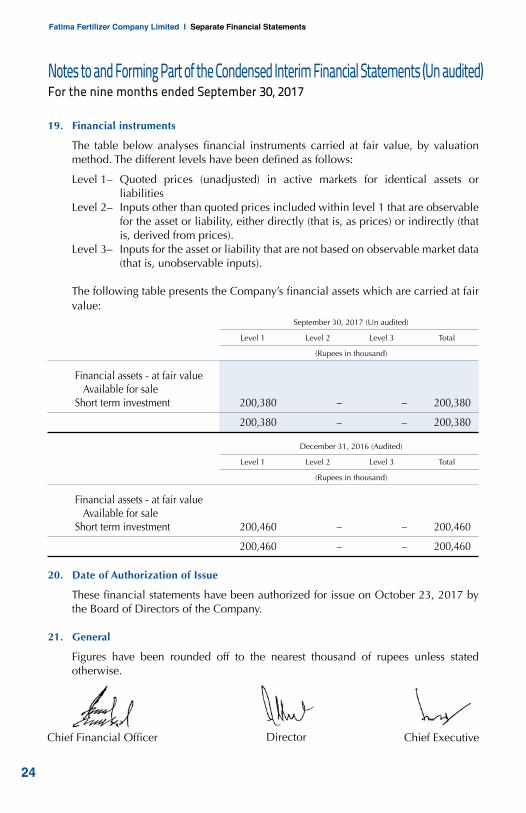
19. Financial instruments
The table below analyses financial instruments carried at fair value, by valuation method. The different levels have been defined as follows:
Level 1– Quoted prices (unadjusted) in active markets for identical assets or liabilities
Level 2– Inputs other than quoted prices included within level 1 that are observable for the asset or liability, either directly (that is, as prices) or indirectly (that is, derived from prices).
Level 3– Inputs for the asset or liability that are not based on observable market data (that is, unobservable inputs).
The following table presents the Company’s financial assets which are carried at fair
value: September 30, 2017 (Un audited)
Level 1 Level 2 Level 3 Total
(Rupees in thousand)
Financial assets - at fair value Available for sale Short term investment 200,380 – – 200,380
200,380 – – 200,380 December 31, 2016 (Audited)
Level 1 Level 2 Level 3 Total
(Rupees in thousand)
Financial assets - at fair value Available for sale Short term investment 200,460 – – 200,460
200,460 – – 200,460 20. Date of Authorization of Issue
These financial statements have been authorized for issue on October 23, 2017 by the Board of Directors of the Company.
21. General
Figures have been rounded off to the nearest thousand of rupees unless stated otherwise.
Chief ExecutiveDirectorChief Financial Officer
3rd Quarterly Report 2017
25
Fatima Fertilizer Company LimitedCondensed Interim Consolidated
Financial Statementsfor the nine months ended September 30, 2017

Fatima Fertilizer Company Limited I Consolidate Financial Statements
26
Condensed Interim Consolidated Balance SheetAs at September 30, 2017
Un audited Audited Note September 30, 2017 December 31, 2016
(Rupees in thousand)
EQUITY AND LIABILITIES CAPITAL AND RESERVES Authorized share capital 2,500,000,000 (December 31, 2016: 2,500,000,000) Ordinary shares of Rs 10 each 25,000,000 25,000,000
Issued, subscribed and paid up capital 2,100,000,000 (December 31, 2016: 2,100,000,000) ordinary shares of Rs 10 each 21,000,000 21,000,000
Reserve 4 41,041,414 39,621,865
62,041,414 60,621,865 NON CURRENT LIABILITIES
Long term finances 5 16,403,686 20,808,734 Deferred liabilities 6 14,746,246 15,648,494 Long term deposits 63,382 60,076
31,213,314 36,517,304 CURRENT LIABILITIES
Trade and other payables 12,156,836 20,323,080 Accrued finance cost 542,639 397,818 Short term finances - secured 7 9,794,478 11,076,980 Current maturity of long term finance 5 7,064,484 5,518,025
29,558,437 37,315,903 CONTINGENCIES & COMMITMENTS 8 122,813,165 134,455,072 The annexed explanatory notes from 1 to 21 form an integral part of these condensed interim consolidated financial statements.

3rd Quarterly Report 2017
27
Un audited Audited Note September 30, 2017 December 31, 2016
(Rupees in thousand)
ASSETS NON CURRENT ASSETS Property, plant and equipment 9 86,814,545 86,938,905 Intangible assets 10 5,912,222 5,918,675
92,726,767 92,857,580
Long term investments 85,946 85,946 Long term loan to associated company 2,999,000 2,999,000 Long term deposits 135,896 130,388
95,947,609 96,072,914
CURRENT ASSETS Stores and spares 11 5,537,600 5,648,254 Stock in trade 12 4,952,778 9,310,614 Trade debts 5,133,438 2,716,095 Short term loan to associated company 1,241,723 1,191,723 Loans, advances, deposits, prepayments and other receivables 9,233,911 7,731,342Short term investment 200,380 200,460 Cash and bank balances 565,726 11,583,670
26,865,556 38,382,158
122,813,165 134,455,072
Chief ExecutiveDirectorChief Financial Officer
Fatima Fertilizer Company Limited I Consolidate Financial Statements
28
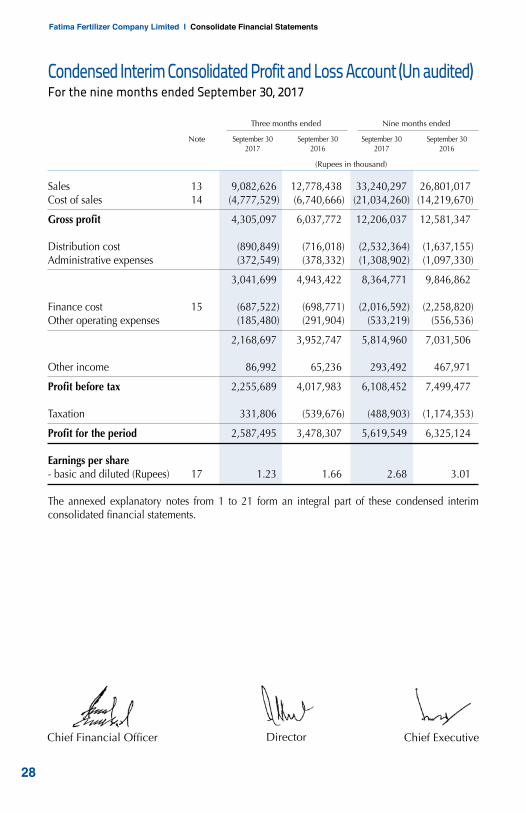
Condensed Interim Consolidated Profit and Loss Account (Un audited)For the nine months ended September 30, 2017
Three months ended Nine months ended
Note September 30 September 30 September 30 September 30 2017 2016 2017 2016
(Rupees in thousand)
Sales 13 9,082,626 12,778,438 33,240,297 26,801,017 Cost of sales 14 (4,777,529) (6,740,666) (21,034,260) (14,219,670)
Gross profit 4,305,097 6,037,772 12,206,037 12,581,347 Distribution cost (890,849) (716,018) (2,532,364) (1,637,155)Administrative expenses (372,549) (378,332) (1,308,902) (1,097,330)
3,041,699 4,943,422 8,364,771 9,846,862 Finance cost 15 (687,522) (698,771) (2,016,592) (2,258,820)Other operating expenses (185,480) (291,904) (533,219) (556,536)
2,168,697 3,952,747 5,814,960 7,031,506 Other income 86,992 65,236 293,492 467,971
Profit before tax 2,255,689 4,017,983 6,108,452 7,499,477 Taxation 331,806 (539,676) (488,903) (1,174,353)
Profit for the period 2,587,495 3,478,307 5,619,549 6,325,124 Earnings per share - basic and diluted (Rupees) 17 1.23 1.66 2.68 3.01 The annexed explanatory notes from 1 to 21 form an integral part of these condensed interim consolidated financial statements.
Chief ExecutiveDirectorChief Financial Officer

3rd Quarterly Report 2017
29
Condensed Interim Consolidated Statement of Comprehensive Income (Un audited)For the nine months ended September 30, 2017
Three months ended Nine months ended
September 30 September 30 September 30 September 30 2017 2016 2017 2016
(Rupees in thousand)
Profit for the period 2,587,495 3,478,307 5,619,549 6,325,124 Other comprehensive income – – – –
Total comprehensive income for the period 2,587,495 3,478,307 5,619,549 6,325,124 The annexed explanatory notes from 1 to 21 form an integral part of these condensed interim consolidated financial statements.
Chief ExecutiveDirectorChief Financial Officer
Fatima Fertilizer Company Limited I Consolidate Financial Statements
30
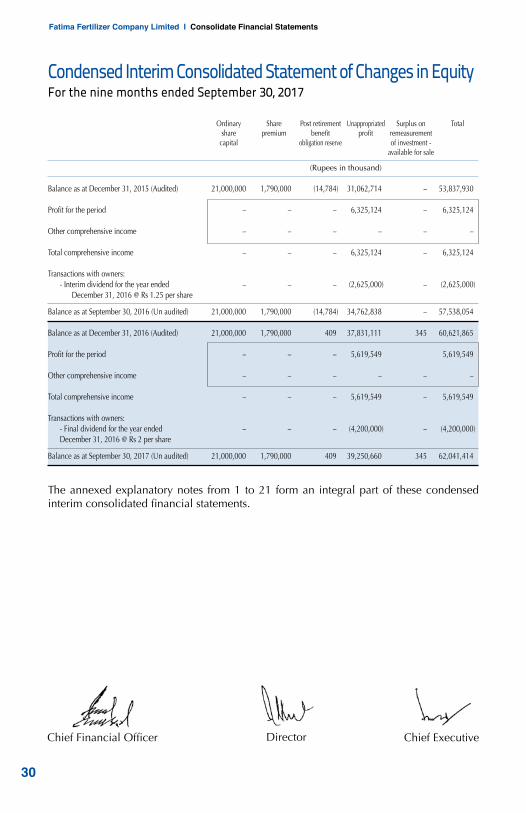
Condensed Interim Consolidated Statement of Changes in EquityFor the nine months ended September 30, 2017
Ordinary Share Post retirement Unappropriated Surplus on Total share premium benefit profit remeasurement capital obligation reserve of investment - available for sale
(Rupees in thousand)
Balance as at December 31, 2015 (Audited) 21,000,000 1,790,000 (14,784) 31,062,714 – 53,837,930 Profit for the period – – – 6,325,124 – 6,325,124 Other comprehensive income – – – – – – Total comprehensive income – – – 6,325,124 – 6,325,124 Transactions with owners: - Interim dividend for the year ended – – – (2,625,000) – (2,625,000) December 31, 2016 @ Rs 1.25 per share
Balance as at September 30, 2016 (Un audited) 21,000,000 1,790,000 (14,784) 34,762,838 – 57,538,054
Balance as at December 31, 2016 (Audited) 21,000,000 1,790,000 409 37,831,111 345 60,621,865 Profit for the period – – – 5,619,549 5,619,549 Other comprehensive income – – – – – – Total comprehensive income – – – 5,619,549 – 5,619,549 Transactions with owners: - Final dividend for the year ended – – – (4,200,000) – (4,200,000) December 31, 2016 @ Rs 2 per share
Balance as at September 30, 2017 (Un audited) 21,000,000 1,790,000 409 39,250,660 345 62,041,414
The annexed explanatory notes from 1 to 21 form an integral part of these condensed interim consolidated financial statements.
Chief ExecutiveDirectorChief Financial Officer

3rd Quarterly Report 2017
31
Chief ExecutiveDirectorChief Financial Officer
Condensed Interim Consolidated Cash Flow Statement (Un audited)For the nine months ended September 30, 2017
Note September 30 September 30 2017 2016
(Rupees in thousand)
Cash flows from operating activities
Cash generated from operations 18 9,585,106 498,714Net increase in long term deposits 3,915 11,673Finance cost paid (1,838,319) (1,991,117)Taxes paid (1,040,278) (626,199)Employee retirement benefits paid (55,214) (38,188) Net cash from / (used in) operating activities 6,655,210 (2,145,117)
Cash flows from investing activities
Additions in property, plant and equipment (1,462,661) (1,670,384)Additions in intangible assets (966) (2,999)Net cash flow from merger 10 –Short term loan to associated company - net (50,000) (799,000)Proceeds from disposal of property plant and equipment 3,532 515Net increase in long term loans and deposits (6,119) (5,359)Short term investment 80 (199,990)Profit received on short term loan and saving accounts 283,576 270,809
Net cash used in investing activities (1,232,548) (2,406,408)
Cash flows from financing activities
Repayment of long term finance (2,866,184) (3,695,994)Proceeds from long term finance – 3,626,516 Dividend paid (4,199,239) – Refund of over-subscribed Sukuk (8,092,675) – (Decrease) / Increase in short term finance - net (1,282,498) 4,355,080
Net cash (used in) / from financing activities (16,440,596) 4,285,602
Net decrease in cash and cash equivalents (11,017,934) (265,923)
Cash and cash equivalents at the beginning of the period 11,583,660 762,620
Cash and cash equivalents at the end of the period 565,726 496,697
The annexed explanatory notes from 1 to 21 form an integral part of these condensed interim consolidated financial statements.
Fatima Fertilizer Company Limited I Consolidate Financial Statements
32
Notes to and Forming Part of the Condensed Interim Consolidated Financial Statements (Un audited)For the nine months ended September 30, 2017
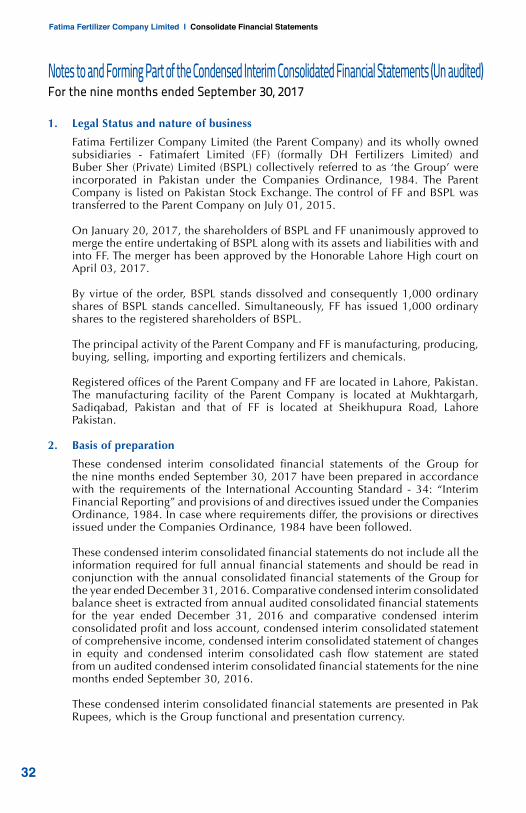
1. Legal Status and nature of business
Fatima Fertilizer Company Limited (the Parent Company) and its wholly owned subsidiaries - Fatimafert Limited (FF) (formally DH Fertilizers Limited) and Buber Sher (Private) Limited (BSPL) collectively referred to as ‘the Group’ were incorporated in Pakistan under the Companies Ordinance, 1984. The Parent Company is listed on Pakistan Stock Exchange. The control of FF and BSPL was transferred to the Parent Company on July 01, 2015.
On January 20, 2017, the shareholders of BSPL and FF unanimously approved to
merge the entire undertaking of BSPL along with its assets and liabilities with and into FF. The merger has been approved by the Honorable Lahore High court on April 03, 2017.
By virtue of the order, BSPL stands dissolved and consequently 1,000 ordinary
shares of BSPL stands cancelled. Simultaneously, FF has issued 1,000 ordinary shares to the registered shareholders of BSPL.
The principal activity of the Parent Company and FF is manufacturing, producing,
buying, selling, importing and exporting fertilizers and chemicals. Registered offices of the Parent Company and FF are located in Lahore, Pakistan.
The manufacturing facility of the Parent Company is located at Mukhtargarh, Sadiqabad, Pakistan and that of FF is located at Sheikhupura Road, Lahore Pakistan.
2. Basis of preparation
These condensed interim consolidated financial statements of the Group for the nine months ended September 30, 2017 have been prepared in accordance with the requirements of the International Accounting Standard - 34: “Interim Financial Reporting” and provisions of and directives issued under the Companies Ordinance, 1984. In case where requirements differ, the provisions or directives issued under the Companies Ordinance, 1984 have been followed.
These condensed interim consolidated financial statements do not include all the
information required for full annual financial statements and should be read in conjunction with the annual consolidated financial statements of the Group for the year ended December 31, 2016. Comparative condensed interim consolidated balance sheet is extracted from annual audited consolidated financial statements for the year ended December 31, 2016 and comparative condensed interim consolidated profit and loss account, condensed interim consolidated statement of comprehensive income, condensed interim consolidated statement of changes in equity and condensed interim consolidated cash flow statement are stated from un audited condensed interim consolidated financial statements for the nine months ended September 30, 2016.
These condensed interim consolidated financial statements are presented in Pak
Rupees, which is the Group functional and presentation currency.

3rd Quarterly Report 2017
33
3. Accounting polices and estimates
The accounting policies, related judgments, estimates and related assumptions adopted for the preparation of these condensed interim consolidated financial statements are the same as those applied in the preparation of annual consolidated financial statements of the Group for the year ended December 31, 2016.
Un audited Audited September 30, 2017 December 31, 2016
(Rupees in thousand)
4. Reserves
Capital reserve:
Share premium 1,790,000 1,790,000 Revenue reserve:
Unappropriated profit 39,250,660 37,831,111 Post retirement benefit obligation reserve 409 409 Surplus on remeasurement of investments classified as available for sale 345 345
41,041,414 39,621,865
5. Long term finances
Parent Company 19,002,170 21,860,759 Fatimafert Limited 4,466,000 4,466,000
23,468,170 26,326,759
Less: Current maturity of long term finances 7,064,484 5,518,025
16,403,686 20,808,734 5.1 During the period, the Parent Company has paid the installments due on Ijarah
Sukuk Certificates amounting to Rs 1,050 million (December 31, 2016: Rs Nil) and Rs 1,816.185 million (December 31, 2016 Rs 15,747.059 million) due on Secured loans from banking companies / financial institutions.
Un audited Audited Note September 30, 2017 December 31, 2016
(Rupees in thousand)
6. Deferred liabilities
Deferred taxation 6.1 14,288,634 15,210,092 Employee retirement benefits 6.2 457,612 438,402
14,746,246 15,648,494

Fatima Fertilizer Company Limited I Consolidate Financial Statements
34
6.1 Deferred taxation September 30, 2017 (Un audited)
At December
Charged / Charged / At September
31, 2016 (credited) to (credited) in other
30, 2017 profit and loss comprehensive income
(Rupees in thousand)
Deferred tax liabilities:
Accelerated tax depreciation 15,507,134 233,506 – 15,740,640 Remeasurement of short term Investment - available for sale 155 – – 155
15,507,289 233,506 – 15,740,795 Deferred tax asset:
Carry forward losses (236,000) (1,156,808) – (1,392,808) Provision for retirement benefits (41,656) 1,214 – (40,442) Remeasurement of defined benefit obligation (19,541) 630 – (18,911)
(297,197) (1,154,964) – (1,452,161)
15,210,092 (921,458) – 14,288,634 December 31, 2016 (Audited)
At December
Charged / Charged / At December
31, 2015 (credited) to (credited) in other
31, 2016 profit and loss comprehensive income
(Rupees in thousand)
Deferred tax liabilities:
Accelerated tax depreciation 15,328,178 178,956 – 15,507,134 Remeasurement of short term Investment - available for sale – – 155 155
15,328,178 178,956 155 15,507,289 Deferred tax asset:
Carry forward losses – (236,000) – (236,000) Provision for retirement benefits (51,283) 9,627 – (41,656) Remeasurement of defined benefit obligation (14,831) – (4,710) (19,541)
(66,114) (226,373) (4,710) (297,197)
15,262,064 (47,417) (4,555) 15,210,092
Notes to and Forming Part of the Condensed Interim Consolidated Financial Statements (Un audited)For the nine months ended September 30, 2017

3rd Quarterly Report 2017
35
Un audited Audited September 30, 2017 December 31, 2016
(Rupees in thousand)
6.2 Employee retirement benefits
Gratuity 290,942 271,396 Accumulating compensated absences 166,670 167,006
457,612 438,402
7. Short term finances
7.1 Parent Company
The Company has obtained short term financing facilities from various banks for
working capital requirements in the nature of Running Finance, Cash Finance and Financing against Imported Merchandise.
These facilities are secured by Pari Passu charge on present and future current assets
of the Company with 25% margin over financed amount, pledge of raw material and finished goods and personal guarantees of sponsoring directors.
These facilities carry mark up ranging from 5.78% to 7.29% (December 31, 2016:
6.36% to 8.36%) per annum for Running Finance and Cash Finance and 6.54% to 7.26% (December 31, 2016: 6.54% to 7.59%) per annum for Finance against Imported Merchandise.
7.2 Fatimafert Limited
The Company has obtained short term financing facilities from various banks for working capital requirements in the nature of Running Finance and Cash Finance.
These facilities are secured by way of pledge of stocks and hypothecation charge on all current and future current assets of the Company.
These facilities carry mark up ranging from 7.12 % to 7.53% (December 31, 2016 ;
6.76% to 7.60 %) per annum.

Fatima Fertilizer Company Limited I Consolidate Financial Statements
36
8. Contingencies and commitments
8.1 Contingencies:
As at September 30, 2017, there is no material change in the status of contingencies as reported in the notes to the financial statements of the Company for the year ended December 31, 2016, except for the following:
Parent Company
i. Appeals filed in the following cases have been decided in Company’s favor:
- Appeal filed with the Lahore High Court against the rejection of the application, under section 65 of the Sales Tax Act, 1990 (STA), made to the Commissioner Inland Revenue, Multan regarding exemption of sales tax estimating Rs 690 million inadvertently short levied/paid on sale of Calcium Ammonium Nitrate (CAN) for the period from April 18, 2011 to December 31, 2011.
- Appeal filed with the Appellate Tribunal Inland Revenue against the order passed
by the Deputy Commissioner Inland Revenues (DCIR), RTO, Multan alleging that the Company claimed input tax amounting to Rs 154.87 million pertaining to an exempt period.
- Appeal filed with the Commissioner Inland Revenue (Appeals), against the order
passed by Additional Commissioner Inland Revenue, Multan, alleging that the Company has not paid Sales tax on retail price on supplies of CAN and NP. Total demand raised was Rs 88.5 million
- Appeal filed with the Commissioner Inland Revenue (Appeals), against the order
passed by the DCIR, Multan, in respect of Sales Tax audit proceedings conducted for the period from July 2011 to June 2012. Total demand raised was Rs 301.67 million.
ii. Deciding on the appeal filed by the Company, CIR(A) has annulled the order passed
by the DCIR RTO Multan, through which, demand of Rs 109.38 million had been adjudged against the Company in respect of impugned levy of further tax under SRO 648(I)/2013 dated July 9, 2013 on the Company’s sales for the period from July 2015 to June 2016. The department has challenged the order of CIR(A) before the ATIR.
Notes to and Forming Part of the Condensed Interim Consolidated Financial Statements (Un audited)For the nine months ended September 30, 2017

3rd Quarterly Report 2017
37
8.2 Commitments in respect of:
Parent Company
(i) Contracts for capital expenditure Rs 122.582 million (December 31, 2016: Rs 572.861 million).
(ii) Contracts for other than capital expenditure Rs 145.494 million (December 31, 2016: Rs 107.455 million).
(iii) The amount of future payments under non-cancellable operating leases and the period in which these payments will become due are as follows:
Un audited Audited September 30, 2017 December 31, 2016
(Rupees in thousand)
Not later than one year 340,196 288,876 Later than one year but not later than five years 174,282 189,670
514,478 478,546 Fatimafert Limited
Contracts for other than capital expenditure Rs 399.852 million (December 31, 2016: Rs 80.201 million).
Un audited Audited Note September 30, 2017 December 31, 2016
(Rupees in thousand)
9. Property, plant and equipment Operating fixed assets- tangible 9.1 83,087,906 84,258,748 Capital work in progress 9.2 3,726,639 2,680,157
86,814,545 86,938,905 9.1 Movement of operating fixed assets- tangible
Opening book value 84,258,748 83,429,526 Add: additions during the period 9.1.1 413,782 2,914,423 Less: book value of disposals during the period 1,276 768
84,671,254 86,343,181 Less: depreciation charged during the period 1,583,348 2,084,433
Closing book value 83,087,906 84,258,748

Fatima Fertilizer Company Limited I Consolidate Financial Statements
38
Un audited Audited September 30, 2017 December 31, 2016
(Rupees in thousand)
9.1.1 Additions during the period
Freehold land 1,112 – Building 12,073 79,487 Plant and machinery 265,055 2,697,859 Furniture and fixtures 1,193 10,532 Office equipment 10,646 5,892 Electric installations and appliances 73,759 60,549 Computers 30,518 40,497 Vehicles 19,426 19,607
413,782 2,914,423 9.2 Capital work in progress
Civil works 720,083 654,843 Plant and machinery 1,893,445 852,021 Capital stores 548,678 528,349 Advances : - Freehold land 158,966 159,758 - Civil works 3,792 4,328 - Plant and machinery 101,675 180,858 - Other advances 300,000 300,000
564,433 644,944
3,726,639 2,680,157 9.2.1 Movement of capital work in progress
Opening balance 2,680,157 4,384,747 Addition during the period 1,218,941 1,959,725
3,899,098 6,344,472 Less: Capitalization during the period 170,058 2,613,512 Plant and machinery written off – 916,382 Steam/gas turbines disposed off – 131,813 Provision for obsolescence for Capital Stores 2,401 2,608
Closing balance 3,726,639 2,680,157
Notes to and Forming Part of the Condensed Interim Consolidated Financial Statements (Un audited)For the nine months ended September 30, 2017
3rd Quarterly Report 2017
39
Un audited Audited September 30, 2017 December 31, 2016
(Rupees in thousand)
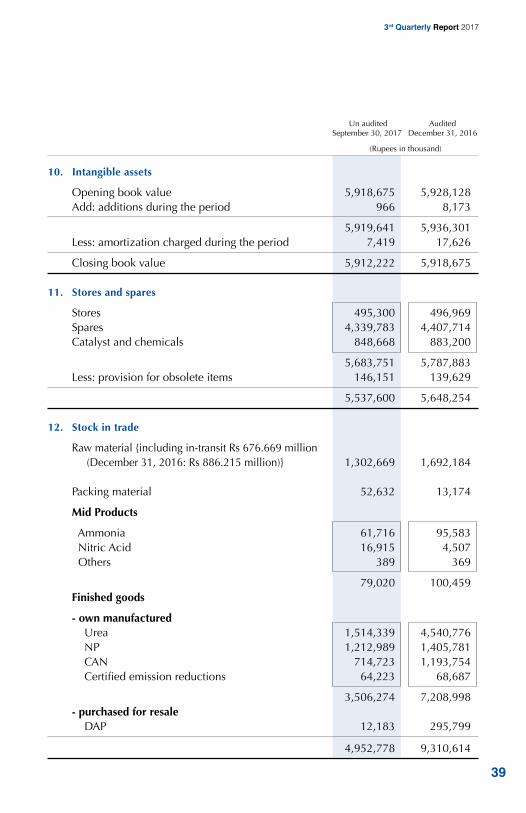
10. Intangible assets
Opening book value 5,918,675 5,928,128 Add: additions during the period 966 8,173
5,919,641 5,936,301 Less: amortization charged during the period 7,419 17,626
Closing book value 5,912,222 5,918,675 11. Stores and spares
Stores 495,300 496,969 Spares 4,339,783 4,407,714 Catalyst and chemicals 848,668 883,200
5,683,751 5,787,883 Less: provision for obsolete items 146,151 139,629
5,537,600 5,648,254 12. Stock in trade
Raw material {including in-transit Rs 676.669 million (December 31, 2016: Rs 886.215 million)} 1,302,669 1,692,184 Packing material 52,632 13,174
Mid Products
Ammonia 61,716 95,583 Nitric Acid 16,915 4,507 Others 389 369
79,020 100,459 Finished goods
- own manufactured Urea 1,514,339 4,540,776 NP 1,212,989 1,405,781 CAN 714,723 1,193,754 Certified emission reductions 64,223 68,687
3,506,274 7,208,998 - purchased for resale DAP 12,183 295,799
4,952,778 9,310,614
Fatima Fertilizer Company Limited I Consolidate Financial Statements
40
Three months ended Nine months ended
September 30 September 30 September 30 September 30 2017 2016 2017 2016
(Rupees in thousand)
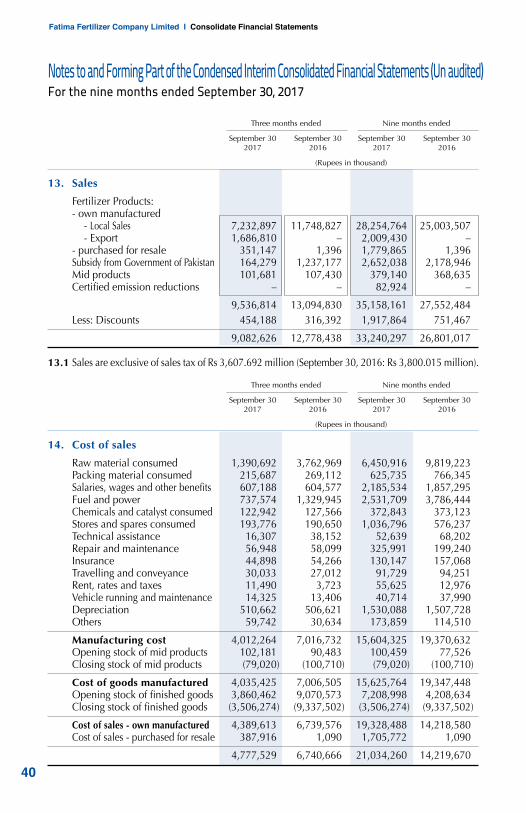
13. Sales
Fertilizer Products: - own manufactured - Local Sales 7,232,897 11,748,827 28,254,764 25,003,507 - Export 1,686,810 – 2,009,430 – - purchased for resale 351,147 1,396 1,779,865 1,396 Subsidy from Government of Pakistan 164,279 1,237,177 2,652,038 2,178,946 Mid products 101,681 107,430 379,140 368,635 Certified emission reductions – – 82,924 –
9,536,814 13,094,830 35,158,161 27,552,484 Less: Discounts 454,188 316,392 1,917,864 751,467
9,082,626 12,778,438 33,240,297 26,801,017
13.1 Sales are exclusive of sales tax of Rs 3,607.692 million (September 30, 2016: Rs 3,800.015 million).
Three months ended Nine months ended
September 30 September 30 September 30 September 30 2017 2016 2017 2016
(Rupees in thousand)
14. Cost of sales
Raw material consumed 1,390,692 3,762,969 6,450,916 9,819,223 Packing material consumed 215,687 269,112 625,735 766,345 Salaries, wages and other benefits 607,188 604,577 2,185,534 1,857,295 Fuel and power 737,574 1,329,945 2,531,709 3,786,444 Chemicals and catalyst consumed 122,942 127,566 372,843 373,123 Stores and spares consumed 193,776 190,650 1,036,796 576,237 Technical assistance 16,307 38,152 52,639 68,202 Repair and maintenance 56,948 58,099 325,991 199,240 Insurance 44,898 54,266 130,147 157,068 Travelling and conveyance 30,033 27,012 91,729 94,251 Rent, rates and taxes 11,490 3,723 55,625 12,976 Vehicle running and maintenance 14,325 13,406 40,714 37,990 Depreciation 510,662 506,621 1,530,088 1,507,728 Others 59,742 30,634 173,859 114,510
Manufacturing cost 4,012,264 7,016,732 15,604,325 19,370,632 Opening stock of mid products 102,181 90,483 100,459 77,526 Closing stock of mid products (79,020) (100,710) (79,020) (100,710)
Cost of goods manufactured 4,035,425 7,006,505 15,625,764 19,347,448 Opening stock of finished goods 3,860,462 9,070,573 7,208,998 4,208,634 Closing stock of finished goods (3,506,274) (9,337,502) (3,506,274) (9,337,502)
Cost of sales - own manufactured 4,389,613 6,739,576 19,328,488 14,218,580 Cost of sales - purchased for resale 387,916 1,090 1,705,772 1,090
4,777,529 6,740,666 21,034,260 14,219,670
Notes to and Forming Part of the Condensed Interim Consolidated Financial Statements (Un audited)For the nine months ended September 30, 2017

3rd Quarterly Report 2017
41
Three months ended Nine months ended
September 30 September 30 September 30 September 30 2017 2016 2017 2016
(Rupees in thousand)
15. Finance cost Markup on long term finances 426,938 463,978 1,340,057 1,403,134 Markup on short term finances 186,898 191,217 497,887 746,789 Interest on Worker Profit Participation Fund – – 9,901 9,597 Bank charges and others 73,686 43,576 168,747 99,300
687,522 698,771 2,016,592 2,258,820
16. Transactions with related parties
The related parties comprise the associated undertakings, directors and other key management personnel of the Group. The Group in the normal course of business carries out transactions with various related parties. Significant transactions with related parties are as follows:
Nine months ended
September 30 September 30 2017 2016
(Rupees in thousand)
Relationship with the Company Nature of transaction
Associated companies Short term loan 50,000 799,000 Toll manufacturing – Miscellaneous expenses 267,892 229,558 Store and Spares – 6,332 Purchase of raw / packing material 578,845 824,079 Other income 279,593 196,111 Payment against assignment of sales tax refund 1,150,280 – Other related parties Fee for services 425,747 309,425 Directors and key Remuneration including benefits management personnel and perquisites 190,740 166,841 Retirement benefit plans Retirement benefit expense 133,581 135,731

Fatima Fertilizer Company Limited I Consolidate Financial Statements
42
Three months ended Nine months ended
September 30 September 30 September 30 September 30 2017 2016 2017 2016
(Rupees in thousand)
17. Earnings per share - basic and diluted
Profit attributable to ordinary shareholders 2,587,495 3,478,307 5,619,549 6,325,124
(Number of shares)
Weighted average number of shares 2,100,000,000 2,100,000,000 2,100,000,000 2,100,000,000 Basic and diluted earnings per share (Rupees) 1.23 1.66 2.68 3.01 Nine months ended
September 30 September 30 2017 2016
(Rupees in thousand)
18. Cash generated from operations
Profit before tax 6,108,452 7,499,477 Adjustments for : Depreciation on property, plant and equipment 1,583,346 1,560,057 Amortization of intangible assets 7,418 14,520 Finance cost 2,016,592 2,258,820 Exchange loss on revaluation of foreign currency liabilities 7,595 – Provision for staff retirement benefits 74,424 81,987 Provision for slow moving stores, spares and loose tools 8,677 10,053 Profit on short term loan to associated company (261,860) (187,206) Profit on saving accounts (16,407) (16,042) Gain on disposal of property plant and equipment (2,633) (339)
3,417,152 3,721,850
Operating cash flows before working capital changes 9,525,604 11,221,327
Effect on cash flow due to working capital changes: (Increase) / decrease in current assets: Stores and spares 104,131 (525,757) Stock in trade 4,357,835 (4,339,470) Trade debts (2,417,344) (247,800) Loans, advances, deposits, prepayments and other receivables (1,910,796) (9,649,756) (Decrease) / Increase in creditors, accrued and other liabilities (74,324) 4,040,170
59,502 (10,722,613)
9,585,106 498,714
Notes to and Forming Part of the Condensed Interim Consolidated Financial Statements (Un audited)For the nine months ended September 30, 2017

3rd Quarterly Report 2017
43
19. Financial instruments
The table below analyses financial instruments carried at fair value, by valuation method. The different levels have been defined as follows:
Level 1– Quoted prices (unadjusted) in active markets for identical assets or liabilities
Level 2– Inputs other than quoted prices included within level 1 that are observable for the asset or liability, either directly (that is, as prices) or indirectly (that is, derived from prices).
Level 3– Inputs for the asset or liability that are not based on observable market data (that is, unobservable inputs).
The following table presents the Group’s financial assets which are carried at fair
value: September 30, 2017 (Un audited)
Level 1 Level 2 Level 3 Total
(Rupees in thousand)
Financial assets - at fair value Available for sale Short term investment 200,380 – – 200,380
200,380 – – 200,380 December 31, 2016 (Audited)
Level 1 Level 2 Level 3 Total
(Rupees in thousand)
Financial assets - at fair value Available for sale Short term investment 200,460 – – 200,460
200,460 – – 200,460 20. Date of Authorization of Issue
These financial statements have been authorized for issue on October 23, 2017 by the Board of Directors of the Parent Company.
21. General
Figures have been rounded off to the nearest thousand of rupees unless stated otherwise.
Chief ExecutiveDirectorChief Financial Officer

44
44