r&d, product innovation, and exporting: evidence from uk new...
TRANSCRIPT

(Final version)
R&D, product innovation, and exporting: evidence from UK new technology based firms By Panagiotis Ganotakis and James H. Love Aston Business School, Aston University, Birmingham B4 7ET; e-mail: [email protected]; [email protected]
We examine the relationship between R&D, product innovation, and exporting for a sample of new technology based firms (NTBFs) in the UK. Allowance is made for selection bias and for endogeneity between innovation and exporting. Product innovators are more likely to export, but conditional on entering export markets successful innovation does not increases subsequent export intensity. Lagged productivity is strongly associated with exporting, supporting the view that efficient firms are better able to overcome the barriers to entering export markets. We also find strong evidence of the importance of internal R&D and of supply-chain collaborations in fostering innovation, and that formal commercial collaborations can be important in overcoming the (information) sunk costs of entering export markets. The use of e-commerce does nothing to boost entry into export markets, but the intensity of its use is associated with increased export intensity. JEL classification: F14, L25, O32

1. Introduction There are sound reasons for expecting a positive association between innovation and export performance. From early product-cycle models in which (exogenous) innovation as a key driver of exports (Vernon, 1966) to more recent models which consider the possibility of the reverse effect in an endogenous growth framework (Grossman and Helpman, 1991a; 1991b) or which deal with industry dynamics involving heterogeneous firms (Melitz, 2003), theorists have predicted a positive association between innovation and exporting at the macro level. Recent empirical work has considered the microeconomics of the interaction between innovation activity and exporting. While this has become increasingly sophisticated, partly as a result of the availability of better firm-level datasets, the empirical literature generally regards R&D and innovation as interchangeable, and typically considers the relationship between R&D and exporting rather than between innovation and exporting (Aw et al, 2007; Girma et al, 2008; Harris and Li, 2009).1 By contrast we consider the relationship between innovation output and exporting, while allowing for the role of R&D in determining innovation. We consider this to be more appropriate conceptually; what really matters for exporting is product innovation rather than R&D, because the ability to compete in international markets is ultimately influenced by the firm’s capacity to successfully market new and improved products, rather than its investment in research activity. This may be especially true for SMEs, where formal R&D measures markedly under-report their research activity and degree of innovativeness (Kleinknecht, 1987). We use data derived from a survey of UK new technology based firms (NTBFs). These are relatively young, independently-owned SMEs operating in high technology sectors (Tether and Storey, 1998). This is a particularly interesting group to consider in terms of the innovation-exporting relationship. NTBFs are firms that operate mainly in highly innovative (high-tech) sectors, and tend to be high-growth firms for which overseas markets play an important role (Acs and Audretsch, 1987; Lynskey, 2004). They are crucial in explaining the gap in performance between, for example, the United States and Europe (Schneider and Veugelers, 2010), and they also tend to be at the forefront of the use of new technology such as e-commerce, a potentially major issue for small firms seeking to overcome the sunk costs of exporting. Therefore both empirically and in terms of policy there are potential lessons to be learned from studying such firms. Although the dataset is relatively small, it has the advantage of having indicators for several dimensions of interest in the exporting-innovation nexus, such as the technical and commercial linkages with outside agencies (a proxy for information sunk costs), and the firms’ use of the internet in sales activity. Specifically, we are able to differentiate between two forms of external knowledge linkages: technical ones linked specifically to innovation, and more general commercial linkages related to sales activity generally, and so by implication to export activity. In the empirical analysis we first estimate the determinants of innovation allowing for internal and external R&D and external collaborations. This is followed by 1 Exceptions are Lachenmaier and Wößmann (2006) who do look at innovation outputs but do not consider role of R&D in innovation, and Salomon and Shaver (2005) who consider the impact of R&D and exports on innovation.

estimating product innovation’s effect on exporting allowing both for endogeneity of innovation and sample selection in exporting, as well as the effects of e-commerce and collaborative agreements on both exporting and its extent. We find that innovators are substantially more likely to export. Lagged productivity is strongly associated with exporting, supporting the view that efficient firms are better able to overcome the barriers to entering export markets. We also find strong evidence of the importance of internal R&D and of supply chain collaborations in fostering innovation, and that formal commercial collaborations can be important in overcoming the (information) sunk costs of entering export markets. The use of e-commerce does nothing the boost entry into export markets, but the intensity of its use is strongly associated with increased export intensity. 2. Background to the R&D/innovation-exporting relationship 2.1 Theory Traditionally, two main conceptual approaches have been used to model the determinants of export performance, (Wakelin, 1998). These are ‘neo-endowment’ models in which firms’ competitive advantage is based on factor endowments, and ‘technology-based’ models in which competitive advantage derives from the quality of firms' products or services. Both of these imply a positive link between R&D or innovation and exporting. Studies in the neo-endowment tradition argue that factor-based advantages may be important if the firm has either a natural monopoly of a particular factor or is, for example, located in a particular region where a factor is plentiful. Technology-based models of export performance focus primarily on firms’ investments or achievements in implementing new technologies, or the development of new products or processes. This capability will depend on the internal strengths of the plant, where applicable its links to other group companies, and on the support available from the regional or national innovation system within which the firm is operating (Nelson, 1993; Metcalfe, 1997). In both of these approaches the implied causation runs from R&D/innovation to exporting. By contrast, endogenous growth models in the tradition of Grossman and Helpman (1991a; 1991b) recognise the possibility of causality running from exporting to R&D and innovation. The channels for this are threefold. First, the stronger competition in foreign markets forces firms to invest in R&D in order to improve both products and processes and thus remain competitive. This may also include the need for a firm to undertake R&D (especially development work) in order to adapt to a different set of requirements in a foreign country, such as different technical standards. Second, there is the possibility of ‘learning by exporting’, principally involving being exposed to superior foreign knowledge and technology which also helps to boost the productivity of exporting firms (Kobrin, 1991; Grossman and Helpman 1991a). Finally, scale effect may be important. Exporting extends the market over which margins may be earned, and since R&D costs are largely fixed, such investments may be recouped over a larger sales volume. This aids productivity, and provides greater incentives to invest in R&D and innovation.

More recently, theoretical attention has switched to the consideration of firm heterogeneity as explanations of participation in export markets, based on the established link between productivity and the fixed costs of entering export markets. Again, this leads to an expectation of a positive link between innovation and exporting. For example, Melitz (2003) develops a model of industry dynamics involving heterogeneous firms (i.e. firms with different endowments of resources and hence productivity levels). In this model, only the most productive firms can overcome the sunk costs of entry to export markets, and so an increase in trade levels within the industry leads to inter-firm reallocations towards productive firms. Bustos (2010) extends this model to allow not only for productivity differences arising from random exogenous draws, but also for the possibility that firms invest in innovation inputs both to upgrade their technology and to reduce the marginal cost of production. Firms that innovate are therefore also more likely to export, both because of the benefits of product upgrading and because of the lower costs of production and hence lower selling prices that innovative firms are able to charge. Using such a model in an empirical setting, Caldera (2009) finds that product upgrading has a greater impact than cost reduction (i.e. process innovation) on the propensity to export among Spanish manufacturing firms.
2.2 Empirical literature: effect of R&D/innovation on exports Empirical studies of the link between R&D, innovation and export performance are dominated by manufacturing, and the majority implicitly assume causality running from innovation to exports. Firm-level studies have generally found that there are indeed significant differences between manufacturing exporters and non-exporters, and generally find a positive link between innovation and exporting in a variety of countries including the UK, Canada, Italy, Ireland and Germany (Wakelin, 1998; Lefebvre and Lefebvre, 2001; Sterlacchini, 1999; Bleaney and Wakelin, 2002; Roper and Love, 2002; Lachenmaier and Wößmann, 2006; Roper et al, 2006). Direct evidence on the link between R&D/innovation and exports in services is much more restricted. Gourlay et al (2005) study the determinants of export behaviour for a panel of over 1000 UK service firms for the period 1988 to 2001. They use R&D intensity (R&D expenditure as a percentage of sales) as an indicator of innovation i.e. an input rather than an output measure of innovation, and find that R&D intensity has strong positive effect on both the probability and intensity of exporting. By contrast, Love and Mansury (2009) employ a direct measure of innovation (whether the firm has produced at least one new service) in their study of exporting in US business services. They also find that innovation has a strong positive effect on the probability of exporting, but unlike Gourlay et al, they find a negative effect on export intensity, conditional on being an exporter. In contrast to most of the studies reviewed above, two recent papers attempt to deal explicitly with endogeneity between R&D, innovation, and exports in determining the nature and scale of any links. Lachenmaier and Wößmann (2006) employ a sample of 981 manufacturing firms in Germany, and use a set of ‘impulses’ (i.e. push factors) and impediments to innovation as instruments to perform IV estimation of exporting with innovation as an endogenous determinant. They find that innovators have an export share on average 12.6 percentage points higher than those of non-innovators,

and that slightly more than half of this can be attributed to the effect of innovation on exports. Harris and Li (2009) take a different approach to the endogeneity issue, employing a two-stage Heckman approach coupled with IV estimation to allow for joint endogeneity of exports and R&D. They combine data from the UK element of the CIS3 and the ARD, and perform estimations for both manufacturing and services. The key findings are that (endogenous) R&D plays a substantial role in helping establishments become exporters, but conditional on entering export markets, R&D expenditure does not increase export intensity. Harris and Li also find that absorptive capacity (i.e. the ability to absorb externally generated knowledge) plays an important role in overcoming entry barriers to internationalization, mainly through complementarity with R&D. However, not all firm-level studies find a positive association running from R&D/innovation to exporting. Specifically, a number of studies have found an insignificant relationship between R&D investment and export intensity (e.g. Lefebvre et al, 1998; Sterlacchini, 2001). This leads to the suggestion that what really matters for exporting is innovation (both product and process) rather than R&D, because the ability to compete in international markets is ultimately influenced by the firm’s capacity to compete internationally, rather than its investment in research activity. This may be especially true for SMEs, where formal R&D measures markedly under-report their research activity and degree of innovativeness (Kleinknecht, 1987). 2.3 Empirical literature: effect of exporting on innovation/R&D Some early studies of the determinants of innovation simply used exporting as a conditioning variable without consideration of any degree of endogeneity between them (e,g, Veugelers and Cassiman, 1999). While this can be taken as an indication of positive association, more recent studies have tended to be couched in terms of endogenous innovation and growth theories, and have either explicitly or implicitly allowed for some degree of two-way interaction. For example, in a study of the Taiwanese electronics industry, Aw et al (2007) find that exporting significantly boosts productivity, especially if accompanied by investment in R&D and/or labour training. They find that exporters not investing in R&D or training have lower productivity rates than firm investing in R&D. They conclude that exporters need to produce effective R&D or training in order to generate efficiency gains: exporting alone is not enough. Zhao and Li (1997) also find a two-way relationship between export intensity and R&D expenditure in a sample of Chinese firms. Empirical studies from Western economies are relatively few. An exception is Girma et al (2008), who examine the two-way relationship between R&D and exports using British (BERD, ONS) and Irish firm-level data (Forfás). They find that exporting stimulates R&D for Irish firms but not for British firms, and that exporting status matters, not exporting intensity. In a UK study using data from the CIS and ARD, Criscuolo et al (2010) find that ‘globally engaged firms’, which include domestic exporters as well as multinational parents and affiliates, generate more innovation outputs than firms with no international activities. However, most of this innovation

advantage is accounted for by the greater use of innovation inputs by globally engaged firms, rather than internationalization per se. As with the innovation-exporting research reviewed above, service sector studies are very few. Blind and Jungmittag (2004) examine the effect of exporting on innovation in German services . Their cross-sectional analysis of 2,019 service firms finds evidence that being an exporter is strongly correlated with the probability both of being a product innovator and of being a process innovator. Love et al (2010) examine how Northern Ireland service firms’ innovation activity relates to productivity and export behaviour. Their analysis is based on matched data from the 2005 UK Innovation Survey – the UK component of the Fourth Community Innovation Survey – and the Annual Business Inquiry for Northern Ireland. Echoing some of the findings of Aw et al (2007) and Girma et al (2008) they find that R&D, firm size, newness and innovation-related training and investment increase innovation outputs. Relationships between innovation, exporting and productivity prove complex but suggest that innovation itself is not sufficient to generate productivity improvements: only when innovation is combined with increased export activity are productivity gains evident. 3. The importance of new technology based firms (NTBFs) NTBFs are defined as firms that are independently owned (i.e. the founder(s) owns at least 50% of the company), are less than 25 years old and belong to a high technology sector (Tether and Storey, 1998). They are an important group of companies to study for a number of reasons. First, they are uniquely important for economic growth. Second, and partly related to the first point, their high-growth, high-innovation nature makes NTBFs different from companies in general, and they face different challenges in getting their highly innovative products to market, both domestic and overseas. As a result, they represent a particularly interesting set of companies with which to examine the relationship between R&D, innovation and exporting. Finally, NTBFs have received substantial policy interest, both in the UK and elsewhere. NTBFs are a leading source of economic competitive advantage and industrial renewal (Licht and Nerlinger, 1998) and therefore increase the knowledge-intensity and science base of a country’s economy (Rickne and Jacobsson, 1999). They do so in two ways: first, through their ability to successfully commercialise radically innovative products and services (Vaona and Pianta, 2008); and second through their role as agents of technological diffusion (Storey and Tether, 1998; Autio and Yli-Renko, 1998). NTBFs achieve higher levels of innovation performance in relation to other firms, especially for new-to-market innovations (Schneider and Veugelers, 2010). This ability is of considerable importance as NTBFs and small high-tech firms in general are a key source of radical innovations, while large firms are more inclined to introduce incremental rather than radical innovations (Maine and Garnsey, 2006). This ability to successfully introduce innovative products, services and technologies can provide the basis for future industrial regeneration and transformation and increase a nation’s economic productivity and competitiveness (Porter and Ketels, 2005; Rickne and Jacobsson, 1999; Licht and Nerlinger, 1998).

This innovative performance leads in turn to other desirable attributes of NTBFs, in both economic and policy terms. They have lower failure rates and contribute significantly more to direct and indirect employment creation and to sales, asset and export growth than firms operating in more traditional industry sectors (Jones-Evans and Westhead, 1996; Tether, 1997; Storey and Tether, 1998). Due to the innovative focus that these firms have they frequently tend to collaborate and exchange knowledge with other companies and research institutions. Being part of an innovation network is one of the most important economic impact of NTBFs as they contribute directly to, or act as catalysts in, the creation and transfer of technologies (Storey and Tether, 1998; Autio and Yli-Renko, 1998). However, the founders of NTBFs have to face a number of technological and marketing related obstacles (Saemundsson and Dahlstrand, 2005; Maine and Garnsey, 2006). Radical innovations often take a considerable amount of time to be introduced to the market, with a concomitantly high initial investment at start-up (Oakey, 2003; Saemudsson and Dahlstrand, 2005). Once the product is developed NTBFs then face the problem of identifying a suitable market. This is more difficult for new-to market products since they address new needs and as marketing data for such products typically do not exist, especially if they are highly customized and involve a great deal of customer-specific development activity (Autio and Yli-Renko, 1998; Lofsten and Lindelof, 2002; Maine and Garnsey, 2006). Moreover, as NTBFs need to enter markets large enough to allow them to cover the high cost of R&D, and given the short product life-cycle of many technology-based products, there is a need for many of those firms to reach international markets quickly, in order to take advantage of their products’ profit potential (Storey and Tether, 1998; Saemundsson and Dahlstrand, 2005). Thus both because of their economic importance and because of their unique characteristics, NTBFs are a particularly interesting set of companies with which to examine the relationship between R&D, innovation and exporting. Like SMEs generally, standard measure of innovation input such as R&D expenditure may understate their level of research activity and innovativeness (Kleinknecht, 1987). Methodologically, this suggest that the effects of innovation outputs on exporting is central, and that allowance should be made for other sources of knowledge inputs in estimating the determinants of innovation (Roper et al, 2008). In addition, NTBFs can also be expected to be at forefront of using new technology in business operations, especially the use of the internet. This is a major issue for relatively small firms entering export markets, because geographical distance seems to matter even in the digital age: Blum and Goldfarb (2006) find that distance matters even for digitally-traded goods such as music and games. The adoption and wider usage of e-commerce should assist SMEs in gaining instant access to international markets at a cost effective way, while at the same time increasing their share at the domestic but also local markets (Fillis et al, 2004). This allows SMEs to overcome some of the cost advantages that larger companies enjoy (Santarelli and Altri, 2003). Finally, NTBFs have been the recipients of specialised governmental support in a number of countries including the US, the UK and several EU countries, indicating that the important contribution these firms make to economic development is recognised by policy makers (Storey and Tether, 1998; Licht and Nerlinger, 1998;

Ferguson and Olofsson, 2004). In the case of the UK, a variety of local and national policy measures initiated over the years have been aimed specifically at supporting the creation, development and growth of NTBFs. These include programs that provide direct financial assistance to such firms for the R&D of innovative products (e.g. SPUR, SMART), as well as changing the intellectual property regime for innovations deriving from government-funded research and giving universities the IP rights to exploit their own innovations and providing incentives for investment in new technology-based firms (e.g. venture capital trusts; creation of regional venture capital funds, sponsorship of Early Growth Funds, income and capital gains tax relief etc). 4. Data and method 4.1 Dataset The empirical analysis is based on data from a representative survey of UK new technology based firms (NTBFs). The survey gathered information on the knowledge gathering and innovative activities of the firms, as well as performance data including exporting behaviour and finally information on the backgrounds of the founders. Export data were obtained for 2004, with innovation data for the period 2001-04. The accurate identification of the population of NTBFs is not easy. As indicated earlier, they are not merely high-tech SMEs, but are also independently-owned and less than 25 years old (Tether and Storey, 1998). The greatest difficulty with the identification of their population is that they are not covered by official UK statistics, or the statistics of other countries. The main problem that hinders the identification of the population of NTBFs by official data sources is that they typically offer no discrimination between independent firms and subsidiaries. We therefore used a combination of official (ONS) data and data from a commercial database in order to arrive at a suitable population from which a sample could be drawn. In order to identify the UK high technology sectors an approach similar to that used by Butchard (1987) was followed, based on the twin criteria of firms with high R&D intensity (measured as R&D expenditure over the amount of sales or value added) and firms with a high proportion of scientists and engineers who spend the majority of their time in R&D activities. By using the OECD STAN indicators and ‘Research & Development in the UK’ (2002) published by the Office of National Statistics, the expenditure over sales as well as the R&D expenditure over value added criterion was used, for each sector according to the UK SIC classification. The ratio of scientists and engineers who spend the majority of their time in R&D activities over total employment was also calculated by using the ONS MA_14 reports and the STAN indicators. The categorization of companies according to the independence criterion was done by using FAME (Financial Analysis Made Easy), a database that contains contact details of all the limited UK companies and their directors, which can also be used to isolate the companies where individual owners own more than 50% equity. The population count in our study therefore consisted only of all the independent firms in the UK that were less than 25 years old and belonged to high-tech sectors, and therefore it offers a clear improvement in relation to studies that did not include the independence
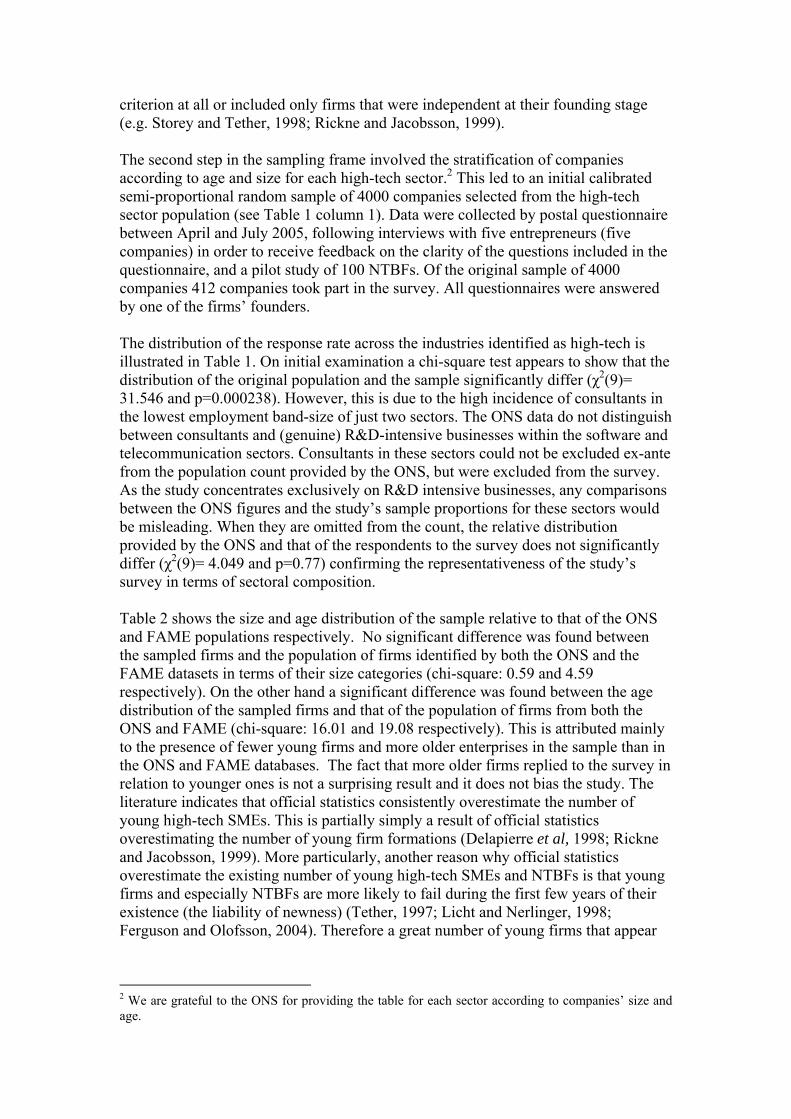
criterion at all or included only firms that were independent at their founding stage (e.g. Storey and Tether, 1998; Rickne and Jacobsson, 1999). The second step in the sampling frame involved the stratification of companies according to age and size for each high-tech sector.2 This led to an initial calibrated semi-proportional random sample of 4000 companies selected from the high-tech sector population (see Table 1 column 1). Data were collected by postal questionnaire between April and July 2005, following interviews with five entrepreneurs (five companies) in order to receive feedback on the clarity of the questions included in the questionnaire, and a pilot study of 100 NTBFs. Of the original sample of 4000 companies 412 companies took part in the survey. All questionnaires were answered by one of the firms’ founders. The distribution of the response rate across the industries identified as high-tech is illustrated in Table 1. On initial examination a chi-square test appears to show that the distribution of the original population and the sample significantly differ (χ2(9)= 31.546 and p=0.000238). However, this is due to the high incidence of consultants in the lowest employment band-size of just two sectors. The ONS data do not distinguish between consultants and (genuine) R&D-intensive businesses within the software and telecommunication sectors. Consultants in these sectors could not be excluded ex-ante from the population count provided by the ONS, but were excluded from the survey. As the study concentrates exclusively on R&D intensive businesses, any comparisons between the ONS figures and the study’s sample proportions for these sectors would be misleading. When they are omitted from the count, the relative distribution provided by the ONS and that of the respondents to the survey does not significantly differ (χ2(9)= 4.049 and p=0.77) confirming the representativeness of the study’s survey in terms of sectoral composition. Table 2 shows the size and age distribution of the sample relative to that of the ONS and FAME populations respectively. No significant difference was found between the sampled firms and the population of firms identified by both the ONS and the FAME datasets in terms of their size categories (chi-square: 0.59 and 4.59 respectively). On the other hand a significant difference was found between the age distribution of the sampled firms and that of the population of firms from both the ONS and FAME (chi-square: 16.01 and 19.08 respectively). This is attributed mainly to the presence of fewer young firms and more older enterprises in the sample than in the ONS and FAME databases. The fact that more older firms replied to the survey in relation to younger ones is not a surprising result and it does not bias the study. The literature indicates that official statistics consistently overestimate the number of young high-tech SMEs. This is partially simply a result of official statistics overestimating the number of young firm formations (Delapierre et al, 1998; Rickne and Jacobsson, 1999). More particularly, another reason why official statistics overestimate the existing number of young high-tech SMEs and NTBFs is that young firms and especially NTBFs are more likely to fail during the first few years of their existence (the liability of newness) (Tether, 1997; Licht and Nerlinger, 1998; Ferguson and Olofsson, 2004). Therefore a great number of young firms that appear
2 We are grateful to the ONS for providing the table for each sector according to companies’ size and age.

as active in official statistics will no longer exist or will be closing down when the population is estimated and when the survey is taking place. Table 3 provides the summary statistics and describes the variables used in this study. Innovation is defined as the introduction of at least one new-to-market product or service in the previous three years. Using this definition, 56% of the firms in the sample innovated over the period 2001-04, and on average 20.3% of firms’ sales were derived from the introduction of new to the market products, a figure that captures the ability of firms not only to introduce but also to successfully commercialise new products (innovation success). In terms of export behaviour and performance, 53.1% of the sampled firms exported in 2004, with an average of 19.6% of the sales in the same year derived from exports. Collaboration of a technical and commercial nature and the use of e-commerce are also shown in Table 3. Collaborative agreements were undertaken by a relatively small minority of firms, with commercial collaborations more common than technical collaborations geared towards innovation. On average, firms reported that almost 11% of sales were derived from e-commerce, suggesting that the internet is a key tool for this sample of firms.3 Table 4 compares the innovative activity, internal R&D expenditure, size and productivity for those firms that exported in 2004 and those that did not. Consistent with previous research, there are highly statistically significant differences between exporters and non exporters for most variables. These differences are also consistent with the view that high levels of product sophistication assist a firm in entering foreign markets, while higher levels of resources (larger firms) and previous productivity can assist in overcoming the sunk costs of exporting. However, there is a marginal difference in the R&D intensity of the two groups, suggesting that while innovation is closely linked to exporting, this is not the case for R&D activity. While suggestive of a self-selection effect, these data by themselves tell us nothing of the nature of the causal links between innovation and exporting. 4.2 Method In estimating the R&D-innovation-exporting relationship we have to allow for the likelihood of endogeneity between innovation and exporting suggested by the theoretical and empirical literature reviewed above, as well as for selection effects. The conceptual discussion above suggests a recursive model of the general form:
INNi = φ0 + φ1R&Di + φ2S0
i + ε1i (1a)
X i = δ0 + δ1S1
i + δ2 INNi + ε2i (1b)
EX*i = γD + μ (1c)
otherwise
EXifEX i
i,0
0,1 *
3 The survey obtained data on the proportion of total sales derived from e-commerce, not the proportion of exports.

Where INNi is a measure of new-to-market product innovation, R&Di is a measure of R&D input, X i is an indicator of exporting, S0
i, S1
i are measures of firm resources relevant to innovation and exporting respectively, EX*i is a dummy exporting variable and D is a vector of the determinants of exporting. There are two key econometric issues to address within the context of a cross-sectional dataset. The first is endogeneity between innovation and exporting: there may be unobserved effects that influence both innovation and exporting, and therefore in estimation the respective error terms may be correlated. The second is the possibility of self-selection among exporters. In common with recent studies of innovation and exporting using cross-sectional data (Lachenmaier and Wößmann, 2006; Harris and Li, 2009), we employ a form of IV estimation to model the relationship between innovation and exporting. We first estimate equation 1a using probit or tobit, depending on how the dependent innovation variable is defined. We then use a Heckman (1979) estimator for equations 1b and 1c to allow for the possibility of selection effects arising from the fact that exporters are not a random subset of all NTBFs, as indicated by Table 4. We also allow for endogeneity between exporting and innovation by incorporating an instrumental variables approach into the sample selection estimation. This allows us to go beyond the analysis of both Lachenmaier and Wößmann (2006) and Harris and Li (2009) in important respects. Unlike Harris and Li, we are able to estimate a model of the determinants of innovation outputs which allows both for R&D inputs and other sources of knowledge inputs. This is important, because we are ultimately concerned with the impact of innovation outputs on exporting behaviour. And unlike Lachenmaier and Wößmann we allow for sample selection as well as endogeneity between innovation and exporting. We also compare the results of the Heckman estimation with a version in which selection is allowed for but endogeneity is not considered. To allow for the potential for endogeneity between innovation and exporting, we adopt a similar approach to Harris and Li (2009) involving the use of instrumental variables in conjunction with the Heckman estimator. This involves the estimation of reduced form equations for the probability to innovate and innovation success using exogenous variables in the system as instruments, and constructing predicted values of innovation to yield unbiased estimates of the effect of innovation on exporting. In order to increase the efficiency of the reduced form equations, apart from the variables assumed to be exogenous to exporting only those variables that had a significant effect on innovation activities in estimating equation 1a (see Table 5) were included in the reduced-form estimation, and these were considered to be the instruments for the innovation variables. These three variables are: internal R&D expenditure as a percentage of total expenditure; whether the firm had received governmental support solely for the development of an innovative product/service; and whether the firm had formal collaboration agreements of a technical nature with suppliers/customers. The results of the reduced form-estimation is shown in the Appendix (Table A1). These clearly show that the three variables used as instruments have a significant effect on both measures of innovation even after controlling for all the exogenous to exporting variables. However, it also has to be demonstrated that the instruments are

unrelated to exporting activity or that they are unlikely to be affected by omitted variables that influence both innovation and exports. As Lachenmaier and Wößmann (2006) point out, one can never be certain ex ante about the strict exogeneity of all the instruments used. In the results section below we carry out over-identification tests to check for the joint exogeneity of the instruments. Here we provide arguments and evidence based on existing studies justifying the appropriateness of the instruments. The first instrument is R&D that has been carried out internally. This can be considered as exogenous to a firm’s export activity as a firm’s R&D effort is not directly affected by variables that also affect a firm’s exporting activity. Typically, a firm’s R&D department is not directly related to its sales/marketing department (which may or may not have contacts with customers based abroad) and therefore it is unlikely that it will receive impulses for the R&D of products specifically from overseas customers (Lachenmaier and Wößmann, 2006). In the context of NTBFs evidence for this was found in Smallbone et al (2000) where NTBFs reported that they only start considering the commercial viability of a new product and deal with marketing issues after the R&D stage has been completed.4 The second instrument captures whether a NTBF received governmental support specifically for the development of an innovative product/process. Since the provision of such financial assistance has as its sole requirement the development of a technologically advanced product regardless of whether it is intended to be commercialised in the national or a foreign market, it can be expected that this variable will affect both exporters and non-exporters alike. Moreover, evidence has shown that the provision of such assistance does not affect or assist the commercialisation of a technologically advanced product/service. For example, Smallbone et al (2000) found that the most common complain of NTBFs that received such awards was a lack of funds at the end of the R&D stage to assist commercialisation. The third instrument is whether a firm had formed formal collaborative agreements of a technical nature with customers or suppliers. As the description suggests, the variable captures only technical collaboration at the innovation stage and not collaboration for commercialisation of the product. Although it can be expected that the technological acumen of an NTBF will increase through the technical collaboration with customers/suppliers, the skills developed can be expected to be equally applied for the development of products and services targeted for domestic and foreign markets. A key element of the Heckman procedure is the identification of the model, involving the exclusion restriction of variables which appear in the initial probit selection equation but not in the export intensity equation. We have chosen suitable variables on the basis of theory, and tested for their exclusion empirically. The selected variables are proxies for the sunk costs involved in entering export markets. The first variable is productivity. Recent theoretical work on exporting in the economics literature starts from the recognition that there are fixed costs involved in
4 In the current sample note also that there is a large difference in the innovation performance of exporters and non-exporters, but a very slight difference in their R&D intensities (Table 4).

entering export markets, and therefore only the more productive firms are able to do so. Roberts and Tybout (1997), Clerides et al (1998) and Helpman et al (2004) all develop formal theoretical models of exporting with sunk costs of entry, and in all cases the models suggest that the sunk costs of market entry favour larger, more productive firms. Similar results are found in the Ricardian model of heterogeneous plants and trade of Bernard et al (2003). The rationale behind these models is that firms contemplating entry to foreign markets have to engage in market research, set up new distribution networks, negotiate with potential new partners, and may have to modify their product range, all of which incur costs. Only those with sufficiently low marginal costs have the profits large enough to cover these fixed costs of entry. Thus exporters are more productive than non-exporters not specifically because of benefits derived from exporting, but because they are more productive firms to begin with, and can therefore overcome the fixed costs of entering foreign markets. Note that this fixed cost argument suggests that the productivity effect is not likely to persist among exporters i.e. productive firms are not necessarily likely to export more than less productive firms once they are over the fixed cost hurdle of becoming exporters. This suggests that highly productive firms are systematically more likely to become exporters than their less productive counterparts. One would therefore expect to see strong evidence of self selection into export markets, and this is indeed borne out by the empirical evidence. Wagner (2007) reviews fifty-four micro-based empirical studies on exporting published between 1995 and 2006, and finds overwhelming support for the existence of this self-selection mechanism. We therefore include a measure of lagged (labour) productivity in the selection equation but not in the exporting equation.5 The second set of variables to be treated this way are the dummy variables for commercial linkages with outside agencies, a proxy for information sunk costs. Information costs can be a major element of exporting sunk costs, especially for small firms (Love and Mansury, 2009). This is especially true for service sectors: many of these sectors are unlikely to face the same sunk cost entry barriers as capital intensive manufacturing sectors, and so they may enter international markets at lower levels of output. However, if sunk costs are primarily informational in nature, one might expect them to apply with equal force to both manufacturing and services. One way in which firms can overcome the information barriers is to form commercial links with other enterprises which have more overseas experience, and so we include dummy variables for the existence of commercial agreements both with supply-chain and non-supply-chain partners in the selection equation. 5. Estimation and results The estimation of innovation determinants (equation 1a) draws on recent literature on the ‘innovation value chain’ (Roper et al, 2008; Ganotakis and Love, 2009), and its emphasis on both internal (i.e. R&D) and external knowledge sources, as well as the internal resources of the firm arising from size, employee skills etc. This is modelled using an innovation or knowledge production function (e.g. Geroski, 1990; Harris and Trainor, 1995) in which the effectiveness of a firm’s knowledge transformation
5 We also tested empirically for the effect of productivity on export intensity: the coefficient on the relevant variable was consistently statistically insignificant.
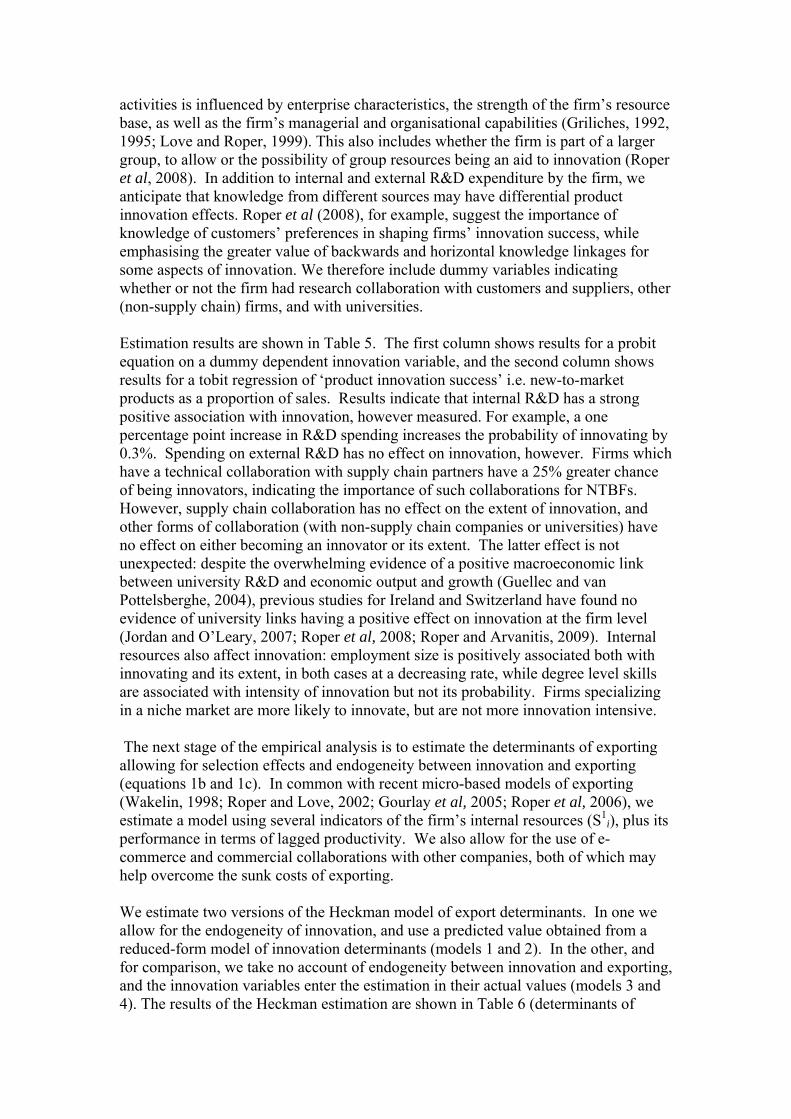
activities is influenced by enterprise characteristics, the strength of the firm’s resource base, as well as the firm’s managerial and organisational capabilities (Griliches, 1992, 1995; Love and Roper, 1999). This also includes whether the firm is part of a larger group, to allow or the possibility of group resources being an aid to innovation (Roper et al, 2008). In addition to internal and external R&D expenditure by the firm, we anticipate that knowledge from different sources may have differential product innovation effects. Roper et al (2008), for example, suggest the importance of knowledge of customers’ preferences in shaping firms’ innovation success, while emphasising the greater value of backwards and horizontal knowledge linkages for some aspects of innovation. We therefore include dummy variables indicating whether or not the firm had research collaboration with customers and suppliers, other (non-supply chain) firms, and with universities. Estimation results are shown in Table 5. The first column shows results for a probit equation on a dummy dependent innovation variable, and the second column shows results for a tobit regression of ‘product innovation success’ i.e. new-to-market products as a proportion of sales. Results indicate that internal R&D has a strong positive association with innovation, however measured. For example, a one percentage point increase in R&D spending increases the probability of innovating by 0.3%. Spending on external R&D has no effect on innovation, however. Firms which have a technical collaboration with supply chain partners have a 25% greater chance of being innovators, indicating the importance of such collaborations for NTBFs. However, supply chain collaboration has no effect on the extent of innovation, and other forms of collaboration (with non-supply chain companies or universities) have no effect on either becoming an innovator or its extent. The latter effect is not unexpected: despite the overwhelming evidence of a positive macroeconomic link between university R&D and economic output and growth (Guellec and van Pottelsberghe, 2004), previous studies for Ireland and Switzerland have found no evidence of university links having a positive effect on innovation at the firm level (Jordan and O’Leary, 2007; Roper et al, 2008; Roper and Arvanitis, 2009). Internal resources also affect innovation: employment size is positively associated both with innovating and its extent, in both cases at a decreasing rate, while degree level skills are associated with intensity of innovation but not its probability. Firms specializing in a niche market are more likely to innovate, but are not more innovation intensive. The next stage of the empirical analysis is to estimate the determinants of exporting allowing for selection effects and endogeneity between innovation and exporting (equations 1b and 1c). In common with recent micro-based models of exporting (Wakelin, 1998; Roper and Love, 2002; Gourlay et al, 2005; Roper et al, 2006), we estimate a model using several indicators of the firm’s internal resources (S1
i), plus its performance in terms of lagged productivity. We also allow for the use of e-commerce and commercial collaborations with other companies, both of which may help overcome the sunk costs of exporting. We estimate two versions of the Heckman model of export determinants. In one we allow for the endogeneity of innovation, and use a predicted value obtained from a reduced-form model of innovation determinants (models 1 and 2). In the other, and for comparison, we take no account of endogeneity between innovation and exporting, and the innovation variables enter the estimation in their actual values (models 3 and 4). The results of the Heckman estimation are shown in Table 6 (determinants of

exporting) and Table 7 (determinants of export intensity) respectively. The use of the Heckman procedure is clearly justified as shown by the diagnostics in Table 7, with a high correlation between the error terms of the respective equations, and the rejection of the null hypothesis of independent equations. In both the exporting and exporting intensity estimations the Smith-Blundell tests rejects the null hypothesis that innovation is exogenous to exporting, and the Sargan test fails to reject the null hypothesis of no over-identification, indicating the validity of the instruments. In terms of the determinants of exporting (Table 6), an NTBF undertaking new-to-market product innovation is around 40% more likely to export in 2004 as a non-innovator once the endogeneity of innovation is allowed for (model 1). The strong positive effect of innovating persists when innovation is expressed in terms of innovation success, that is the proportion of sales accounted for by products new to the market (model 2). In both cases the marginal effect of innovating is substantially higher in the endogenous estimation than when innovation enters exogenously (models 3 and 4), an effect also noted by Lachenmaier and Wößmann (2006). Other determinants of exporting are broadly as expected. NTBFs with commercial collaborative agreements are more likely to export once endogeneity of innovation is allowed for, but only where these collaborations occur outside the supply-chain. Firms with higher skill levels are also more likely to export. As anticipated, lagged productivity has a substantial positive effect on the probability of exporting, in common with the bulk of the literature (Wagner, 2007). The positive effect of (employment) size disappears once endogeneity is accounted for. The use of internet e-commerce is anticipated both to help firms overcome the hurdle of entering export markets, and to allow them to penetrate such markets at lower costs, and so a measure of its use is included in both parts of the Heckman estimation. However, the coefficient on this variable is insignificant on the exporting equation, indicating that for this group of firms the use of e-commerce has no effect on becoming an exporter. Table 7 shows the results for the determinants of exporting intensity (proportion of sales exported), with and without the treatment of endogeneity. Being a product innovator has no effect on exporting intensity. The extent of sales achieved through e-commerce is positively associated with export intensity; calculated at the respective means, a one percent increase in internet sales intensity raises export intensity by around 0.1%. In common with the exporting equation (Table 6), internal resources such as size and age have no impact on the extent of exporting. However, firms with higher graduate skill levels are more export intensive as well as being more likely to export. NTBFs which target a niche market are no less export intensive than those pursuing a wider market strategy. Since these firms are also no less likely to export (Table 6), this suggests that pursuing a niche market does not limit the scope for export sales among this sample of firms. 6. Conclusions The purpose of this paper is to examine the relationship between R&D, product innovation, and exporting for a set of high-growth, high-technology and relatively small firms. We use a narrowly defined definition of product innovation, and allow both for endogeneity between innovation and exporting, and for selection effects in exporting. Both theory and (to some extent) the empirical literature suggests a

mutually-reinforcing relationship between innovation and exporting, but few studies have considered this relationship among relatively small firms, and fewer still have allowed for the effect of R&D to be moderated through innovation outputs. Estimating a recursive system of the R&D-innovation-exporting relationship, we find that innovators are indeed more likely to export, even after allowing for endogenetity and sample selection. However, conditional on entering export markets, there is no evidence that the extent of successful innovation increases subsequent export intensity. Lagged productivity is strongly associated with exporting, supporting the view that efficient firms are better able to overcome the barriers to entering export markets, and skills are positively linked to exporting and its intensity. However, once innovation’s endogeneity is allowed for, there is no evidence that size (measured by employment) aids exporting or export intensity. Perhaps surprisingly, the use of e-commerce does nothing the boost entry into export markets, but the extent of its use is positively associated with increased export intensity. We also find strong evidence of the importance of internal R&D and of supply chain collaborations in fostering innovation, and that formal commercial collaborations can be important in overcoming the (information) sunk costs of entering export markets. Our results show some strong similarities with, for example, Harris and Li (2009), but also some differences. They also find that innovation (or rather R&D) positively affects exporting but not export intensity once endogeneity is allowed for, and that productivity has a similar pattern of effects. However, one key difference between our results and those of this earlier study is in the effects of firm size. Harris and Li find a strong positive effect of size in overcoming export barriers, but a significant negative relationship between size and export intensity, conditional on entering export markets. By contrast, we find that size is strongly positively associated with innovation, but there is no size effect on exporting once endogeneity is taken into account. This difference is doubtless largely because of the relatively small size of the firms in our sample (mean employment of 16 – see Table 3). However, the fact that employment has a significant and positive sign on exporting when endogeneity is not allowed for (Table 6 models 3 and 4) suggests that in part the difference with Harris and Li arises because we are able to allow for the influence of size through its effect of innovation outputs. Overall, the results of the analysis suggest that product innovation and efficiency are just as important for overcoming barriers to exporting for high-tech SMEs as they are for firms in general. In addition, formal commercial collaborations can also be an important method of overcoming the (information) sunk cost of exporting for this group of firms. Once exporting, however, what matters for increased penetration of export markets is not scale or innovation, but appropriate skill levels and the use of e-commerce. Results also show that governmental support for the R&D of innovative products and services has a significant effect not only on their initial introduction to the market but also on their subsequent success, both of which can in turn have an effect on the probability of a firm to export. However, some care is necessary in interpreting the policy implications of this result, as the coefficient on the policy

support variable – which is essentially a treatment term – reflects the combination of ‘assistance’ and ‘selection’ effects.6 Some more general policy observations can be made. The positive links between e-commerce and export intensity and between commercial agreements and export propensity suggest that policy should be geared towards allowing high-tech SMEs easier access to appropriate commercial skills and assistance in an effort to decrease the information sunk costs of entering foreign markets and to increase the commercial success of innovative products overseas. Assistance for the development of dynamic websites capable of accepting orders and payments online might be one way forward, as it allows foreign customers to identify innovative products, view their description and pricing, get information about the commercial background of the firm and finally either enquire about a product or place an order online. The finding that employee skills affect not only innovation success but also export propensity and intensity indicates that programs which assist high-tech SMEs to recruit and keep suitably qualified graduates and professionals with the technical skills for the development of innovative products and the commercial skills for the foreign market success of such products might be a suitable area for public policy support. Finally, commercial information sharing and collaborations between NTBFs and successful exporters can be encouraged. Acknowledgements We are grateful for the constructive comments of Nigel Driffield, Jun Du and two anonymous referees. Funding Economic and Social Research Council (PTA-030-2004-01049 to P.G.). References
Acs, Z.J. and Audretsch, D.B. (1987) Innovation, market structure and firm size, Review of Economics and Statistics, 69, 567-74. Autio, E. and Yli-Renko, H. (1998) New, technology-based firms in small open economies – An analysis based on the Finnish experience, Research Policy, 26, 973-87.
Aw, B.Y., Roberts, M.J., and Winston, T. (2007) Export market participation, investments in R&D and worker training, and the evolution of firm productivity, The World Economy, 30, 83-104.
Bernard, A.B, Eaton, J., Jensen, J.B., and Kortum, S. (2003) Plants and productivity in international trade, American Economic Review, 93, 1268-90.
Bleaney, M. and Wakelin, K. (2002) Efficiency, innovation and exports, Oxford Bulletin of Economics and Statistics, 64, 3-15.
Blind, K. and Jungmittag, A. (2004) Foreign direct investment, imports and innovations in the service industry, Review of Industrial Organization, 25, 205-27.
6 See Maddala (1973) pp 257-290 for a general discussion of this issue and Roper and Hewitt-Dundas (2001) for an application.

Blum, B. and Goldfarb, A. (2006) Does the internet defy the law of gravity? Journal of International Economics, 70, 384–405.
Bustos, P. (2010) Trade liberalization, exports and technology upgrading: evidence on the impact of MERCUSOR on Argentinean firms, American Economic Review, forthcoming.
Butchard, R. (1987) A new definition of high technology industries, Economic Review 400, 82-88.
Caldera, A. (2009) Innovation and exporting: evidence from Spanish manufacturing firms, ECARES working paper 2009-14, Brussels, available at http://www.ecore.be/DPs/dp_1240906078.pdf.
Clerides, S.K., Lach, S., and Tybout. J.R. (1998) Is learning-by-exporting important? Micro-dynamic evidence from Colombia, Mexico and Morocco, Quarterly Journal of Economics, 113, 903-47.
Criscuolo, C., Haskel, J.E., and Slaughter. M.J. (2010) Global engagement and the innovation activities of firms, International Journal of Industrial Organization, 28, 191-202.
Delapierre, M., Madeuf, B. and Savoy, A. (1998) NTBFs – the French case, Research Policy, 26, 989-1003.
Ferguson, R. and Olofsson, C. (2004) Science parks and the development of NTBFs – Location, survival and growth, Journal of Technology Transfer, 29, 5-17
Fillis, I., Johansson, U., and Wagner, B. (2004) A qualitative investigation of smaller firm e-business development, Journal of Small Business and Enterprise Development, 11, 349-61.
Ganotakis, P. and Love, J.H. (2009) The innovation value chain in new technology based firms: evidence from the UK, Research Paper 0916, Aston Business School, Birmingham, available at http://eprints.aston.ac.uk/6978/
Geroski, P.A. (1990) Innovation, technological opportunities, and market structure, Oxford Econonomic Papers, 42, 586-602.
Girma, S., Gorg, H., and Hanley, A. (2008) R&D and exporting: A comparison of British and Irish firms, Review of World Economics, 144, 750-73.
Gourlay, A., Seaton, J., and Suppakitjarak, J. (2005) The determinants of export behaviour in UK service firms, Service Industries Journal, 25, 879-89.
Griliches, Z. (1992) The search for research-and-development spillovers, Scandinavian Journal of Economics, 94, S29-S47.
Griliches, Z. (1995) R&D and productivity: econometric results and measurement issues, in P. Stoneman (ed.) Handbook of the Economics of Innovation and Technological Change, Blackwell, Oxford.
Grossman, G.M. and Helpman, E. (1991a) Trade, knowledge spillovers, and growth, European Economic Review, 35, 517-26.
Grossman, G. and Helpman, E. (1991b) Innovation and Growth in the World Economy, MIT Press, Cambridge, MA.

Guellec, D. and van Pottelsberghe, B. (2004) From R&D to productivity growth: do the institutional settings and the source of funds matter? Oxford Bulletin of Economics and Statistics, 66, 353-78.
Harris, R.I.D. and Li, Q.C. (2009) Exporting, R&D, and absorptive capacity in UK establishments, Oxford Economic Papers, 61, 74-103.
Harris, R.I.D. and Trainor, M. (1995) Innovations and R&D in Northern Ireland manufacturing: a Schumpeterian approach, Regional Studies, 29, 593-604.
Heckman, J.J. (1979) Sample selection bias as a specification error, Econometrica, 47, 153-61.
Helpman, E., Melitz, M., and Yeaple, S. (2004) Export versus FDI with heterogeneous firms, American Economic Review, 94, 300–16.
Jones-Evans, D. and Westhead, P. (1996) The high technology small firm sector in the UK, International Journal of Entrepreneurial Behaviour & Research, 2, 15-35.
Jordan, D. and O’Leary, E. (2007) Sources of innovation in Irish SMEs: evidence from two Irish regions, Paper presented at British-Irish Regional Science Association Annual Conference, at Bangor.
Kleinknecht, A. (1987) Measuring R&D in small firms: how much are we missing?, Journal of Industrial Economics, 36, 253-56.
Kobrin, S.J. (1991) An empirical analysis of the determinants of global integration, Strategic Management Journal, 12, 17-37.
Lachenmaier, S. and Wößmann, L. (2006) Does innovation cause exports? Evidence from exogenous innovation impulses and obstacles using German micro data, Oxford Economic Papers, 58, 317-50.
Lefebvre, E. and Lefebvre, L. (2001) Innovative capabilities as determinants of export behaviour and performance: a longitudinal study of manufacturing SMEs, in A. Kleinknecht and P. Mohnen (eds.) Innovation and Firm Performance, Econometric Exploration of Survey data, Palgrave, London.
Lefebvre, E., Lefebvre, L.A., and Bourgault, M. (1998) R&D-related capabilities as determinants of export performance, Small Business Economics, 10, 365-77.
Licht, G. and Nerlinger, E. (1998) New technology-based firms in Germany: a survey of the recent evidence, Research Policy, 26, 1005 - 22.
Lofsten, H. and Lindelof, P. (2002) Science parks and the growth of new technology-based firms-academic-industry links, innovation and markets, Research Policy, 31, 859-76.
Love, J.H. and Mansury, M.A. (2009) Exporting and productivity in business services: evidence from the United States, International Business Review, 18, 630-42.
Love, J.H. and Roper, S. (1999) The determinants of innovation: R & D, technology transfer and networking effects, Review of Industrial Organization, 15, 43-64.
Love, J.H., Roper, S., and Hewitt-Dundas, N. (2010) Service innovation, embeddedness and business performance: evidence from Northern Ireland, Regional Studies, forthcoming.
Lynskey, M.J. (2004) Determinants of innovative activity in Japanese technology-based start-up firms, International Small Business Journal, 22, 159-96.

Maddala, G. (1973) Limited Dependent and Qualitative Variables in Econometrics, Cambridge University Press, New York.
Maine, E. and Garnsey, E. (2006) Commercializing generic technology: The case of advanced materials ventures, Research Policy, 35, 375-93.
Melitz, M.J. (2003) The impact of trade on intra-industry reallocations and aggregate industry productivity, Econometrica, 71, 1695-1725.
Metcalfe, S. (1997) Technology systems and technology policy in an evolutionary framework, in D. Archibugi and J. Michie (eds.) Technology, Globalisation and Economic Performance, Cambridge University Press, Cambridge.
Nelson, R.R. (1993) National Innovation Systems: A Comparative Analysis, Oxford University Press, Oxford.
Oakey, R.P. (2003) Technical entrepreneurship in high technology small firms: some observations on the implications for management, Technovation, 23, 679-88.
Porter, M.E. and Ketels, C.H.M. (2003) UK Competitiveness: moving to the next stage, DTI economics paper No.3.
Rickne, A. and Jacobsson, S. (1999) New technology-based firms in Sweden – a study of their direct impact on industrial renewal, Economics of Innovation and New Technology, 8, 197-223.
Roberts, M. and Tybout, J.R. (1997) The decision to export in Colombia: an empirical model of entry with sunk costs, American Economic Review, 87, 545-64.
Roper, S. and Arvanitis, S. (2009) From knowledge to added value: a comparative, panel-data analysis of the innovation value chain in Irish and Swiss manufacturing firms, Paper presented at DRUID Summer Conference, Copenhagen.
Roper, S., Du, J., and Love, J.H. (2008) Modelling the innovation value chain, Research Policy, 37, 961-77.
Roper, S. and Hewitt-Dundas, N. (2001) Grant assistance and small firm development in Northern Ireland and the Republic of Ireland, Scottish Journal of Political Economy, 48, 99-117.
Roper, S. and Love, J.H. (2002) Innovation and export performance: evidence from UK and German manufacturing plants, Research Policy, 31, 1087-102.
Roper, S., Love, J.H., and Añon Hígon, D. (2006) The determinants of export performance: evidence for manufacturing plants in Ireland and Northern Ireland, Scottish Journal of Political Economy, 53, 586-615.
Saemundsson, R. and Dahlstrand, A.L. (2005) How business opportunities constrain young technology-based firms from growing into medium-sixed firms, Small Business Economics, 24, 113-29.
Salomon, R.M. and Shaver, J.M. (2005) Learning by exporting: new insights from examining firm innovation, Journal of Economics and Management Strategy, 14, 431-60.
Santarelli, E. and D’Altri, S. (2003) The diffusion of E-commerce among SMEs: theoretical implications and empirical evidence, Small Business Economics, 21, 273-83.

Schneider, C. and Veugelers, R. (2010) On young highly innovative companies: why they matter and how (not) to policy support them, Industrial and Corporate Change, 19, 969-1007.
Smallbone, D., North, D., Vickers, I., and McCarthy, I. (2000) Policy support for R&D in SMEs: The UK government’s smart award scheme, in W. During, R. Oakey and M. Kipling (eds.) New Technology-Based Firms at the Turn of the Century, Pergamon, Oxford.
Sterlacchini, A. (1999) Do innovative activities matter to small firms in non-R&D-intensive industries? An application to export performance, Research Policy, 28, 819-32.
Sterlacchini, A. (2001) The determinants of export performance: a firm-level study of Italian manufacturing, Review of World Economics, 137, 450-72.
Storey, D.J. and Tether, B. (1998) Public policy measures to support new technology-based firms in the European Union, Research Policy, 26, 1037-57.
Tether, B.S. (1997) Growth diversity amongst innovative and technology-based new and small firms: an interpretation, New Technology, Work and Employment, 12, 91-107.
Tether, B. and Storey, D. (1998) Smaller firms and Europe’s high technology sectors: a framework for analysis and some statistical evidence, Research Policy, 26, 947-71.
Vaona, A. and Pianta, M. (2008) Firm size and innovation in European manufacturing, Small Business Economics, 30, 283-99.
Veugelers, R. and Cassiman, B. (1999) Make and buy in innovation strategies: evidence from Belgian manufacturing firms, Research Policy, 28, 63-80.
Vernon, R. (1966) International investment and international trade in the product cycle, Quarterly Journal of Economics, 80, 190-207.
Wagner, J. (2007) Exports and productivity: a survey of the evidence from firm-level data, The World Economy, 30, 60-82.
Wakelin, K. (1998) Innovation and export behaviour at the firm level, Research Policy, 26, 829-41.
Zhao, H. and Li, H. (1997) R&D and export: an empirical analysis of Chinese manufacturing firms, Journal of High Technology Management Research, 8, 89- 105.

Appendix
Table A1 Reduced form equations for probability to innovate and innovation success
Variables Product Innovator (Probit)
Product Innovation Success (Tobit)
Constant -1.823 (1.196) -63.61 (46.72) Instruments
Internal R&D 0.00968*** (0.0029) 0.433*** (0.12) Collaboration of a technical nature with customers/suppliers
0.693** (0.326) 19.74* (11.28)
Governmental assistance on R&D for products/services
0.718** (0.31) 29.59*** (10.83)
Formal commercial collaborative agreements Agreements with customers/suppliers 0.327 (0.296) 10.23 (8.844) Agreements with other companies -0.527** (-0.526) -32.74*** (9.553)
IS adoption Internet E-Commerce (% sales) 0.00631 (0.004) 0.525*** (0.182)
Resources Employment 0.474** (0.0192) 1.59** (0.683) Employment squared -0.0007193**
(0.00035) -0.024* (0.0128)
Part of group of firms 0.099 (0.346) 6.08 (12.94) Firm age 0.00297 (0.014) -0.212 (0.557) Percentage of workforce with degrees -0.00029 (0.0028) 0.114 (0.109) Productivity 2001 0.0452 (0.106) 1.154 (4.191)
Marketing Strategy Niche market 0.328 (0.218) 9.647 (9.533)
Industry Sectors Pharmaceutical 0.423 (0.538) 22.29 (21.19) Computer 0.7* (0.414) 33.4** (16.877) TV and Radio 0.737** (0.356) 20.47 (12.71) Medical, instrumentation, optical 0.363 (0.31) 12.28 (13.23) Aerospace -0.372 (0.711) -17.86 (24.12) Telecommunications 0.382 (0.484) 28.08 (24.82) Software 0.688** (0.313) 20.4 (12.66) R&D in natural sciences and engineering 0.936** (0.427) 31.83* (17.03) Technical testing -0.101 (0.435) -11.47 (17.25)
Notes: Standard errors in parentheses; ***p<0.001, **p<0.05, *p<0.1. Reported coefficients are not marginal effects.
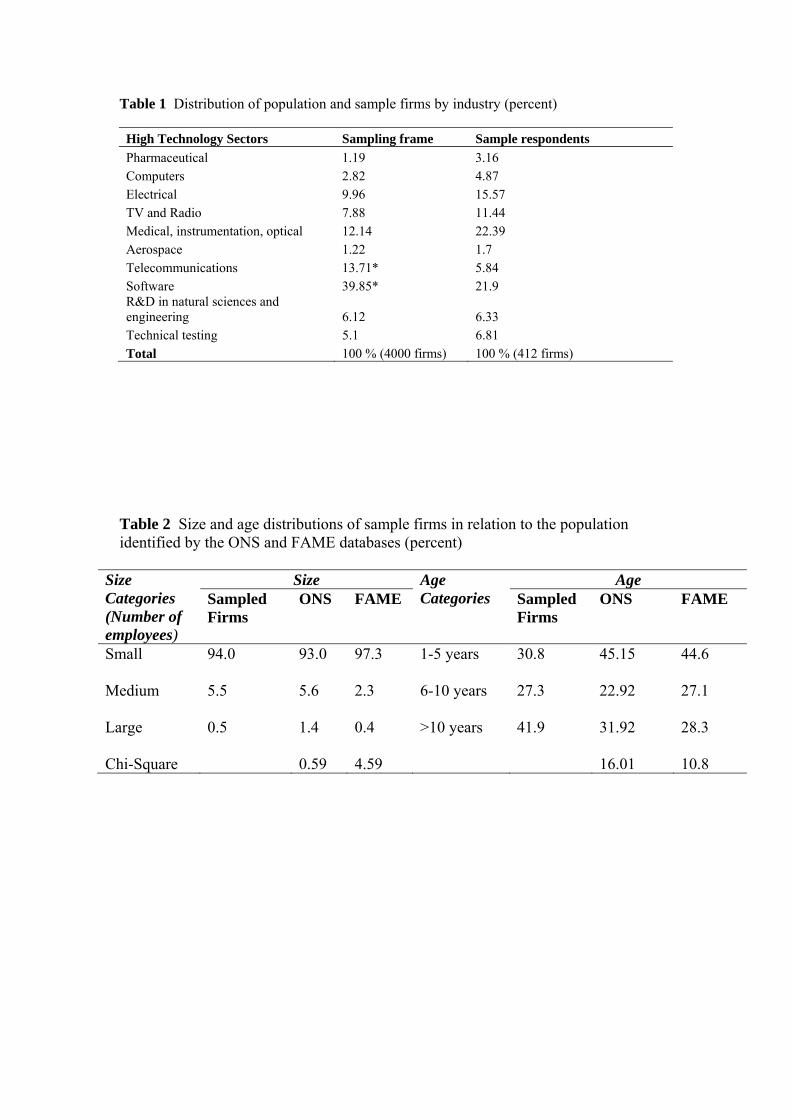
Table 1 Distribution of population and sample firms by industry (percent)
High Technology Sectors Sampling frame Sample respondents
Pharmaceutical 1.19 3.16 Computers 2.82 4.87 Electrical 9.96 15.57 TV and Radio 7.88 11.44 Medical, instrumentation, optical 12.14 22.39 Aerospace 1.22 1.7 Telecommunications 13.71* 5.84 Software 39.85* 21.9 R&D in natural sciences and engineering 6.12 6.33 Technical testing 5.1 6.81
Total 100 % (4000 firms) 100 % (412 firms) Table 2 Size and age distributions of sample firms in relation to the population identified by the ONS and FAME databases (percent)
Size Categories (Number of employees)
Size Age Categories
Age Sampled Firms
ONS FAME Sampled Firms
ONS FAME
Small
94.0 93.0 97.3 1-5 years 30.8 45.15 44.6
Medium
5.5 5.6 2.3 6-10 years 27.3 22.92 27.1
Large 0.5 1.4 0.4 >10 years 41.9 31.92 28.3
Chi-Square 0.59 4.59 16.01 10.8

Table 3 Summary statistics and variable descriptions
Variable description Mean S.D. Exporting Performance
Exports in 2004 – Whether a firm was an exporter in 2004 (0/1) 0.531 0.499 Percentage of exports in 2004 – Amount of export sales in relation to total sales in 2004 (%) 19.56 29.51
Innovation variables Product Innovation – New to the market product in the last 3 years (0/1) 0.56 0.49 Innovation success – Percentage of new to the market products sales (%) 20.3 29.8
Knowledge sourcing activities of a technical nature Percentage Internal R&D – R&D undertaken within the firm (R&D expenditure in relation to total expenditure – (%))
22.53 31.99
Percentage External R&D – R&D undertaken outside the firm in the form of totally outsourced contracts (% of R&D expenditure in relation to total expenditure – (%))
3.43 11.72
Formal collaborative agreements of a technical nature with customers/suppliers (0/1) 0.12 0.314 Formal collaborative agreements of a technical nature with other companies (0/1) 0.11 0.317 Formal collaborative agreements of a technical nature with universities/public research institutions (0/1)
0.08 0.26
Commercial collaborations Formal collaborative agreements of a commercial nature with customers/suppliers (0/1) 0.157 0.365 Formal collaborative agreements of a commercial nature with other companies (0/1) 0.182 0.387
Resources Employment (number) 16.07 26.37 Part of a group (other company owns less than 50 % equity or firm is head of group, 0/1)) 0.08 0.273 Firm age (years) 10.57 6.76 Percentage of workforce with degree (%) 41.62 36.3 Lagged productivity – sales per employee in 2001 (£) 73350 75478
IS adoption Percentage of sales derived from Internet E-Commerce (%) 10.83 23.61
Government and EU assistance Government assistance on R&D for product/process (0/1) 0.12 0.329
Market strategy Specific – Products are made to a serve a specialist niche market (0/1) 0.83 0.377
Table 4 Comparison of exporters and non-exporters: means (standard deviations)
Variables Exporters Non-exporters p-values (two-tailed t-test)
Product Innovation (% firms) 0.648 (0.478) 0.463 (0.5) 0.0003 Internal R&D (% expenditure) 24.75 (31.69) 19.126 (31.31) 0.0906 Size (employment) 19.6 (31.26) 12.36 (19.56) 0.0067 Productivity (£) 87858 (88303) 56987 (56005) 0.0003

24
Table 5 Determinants of innovation
Variables Product Innovator (Probit)
Product Innovation Success (Tobit)
Knowledge Sources Internal R&D 0.00299*** (0.00104) 0.472*** (0.119) External R&D -0.000343 (0.00248) 0.211 (0.336) Collaboration with customers/suppliers 0.256*** (0.09104) 7.771 (11.91) Collaboration with other companies -0.0189 (0.107) -5.821 (10.45) Collaboration with universities/research institutions 0.097 (0.133) 11.632 (14.704)
Resources Employment 0.0143** (0.00466) 1.42*** (0.47) Employment squared -0.000191*** (0.00006) -0.0193*** (0.00602) Part of group of firms 0.0165 (0.123) 2.635 (11.684)Firm age -0.00118 (0.00504) -0.523 (0.537) Percentage of workforce with degrees 0.0000476 (0.00096) 0.165** (0.103)
Government and EU assistance Assistance on R&D for products/services 0.158* (0.0961) 20.582** (10.169)
Marketing Strategy Niche market 0.162** (0.079) 10.09 (9.685)
Industry Sectors Pharmaceutical 0.137 (0.169) 12.333 (18.956) Computer 0.121 (0.145) 14.398 (18.001) TV and Radio 0.221** (0.996) 15.61 (11.991) Medical, instrumentation, optical 0.136 (0.1) 8.158 (11.776)Aerospace -0.175 (0.259) -29.602 (25.425) Telecommunications 0.191 (0.121) 17.699 (16.513) Software 0.202** (0.098) 11.855 (12.84) R&D in natural sciences and engineering 0.232** (0.115) 22.09 (17.073) Technical testing -0.082 (0.154) -13.331 (17.739) Observations 314 314 Log-Likelihood -187.176 -917.385
Notes: Standard errors in parentheses; ***p<0.001, **p<0.05, *p<0.1. Coefficients are marginal effects.

25
Table 6 Determinants of exporting
Variables Endogeneity treated Endogeneity not treated (1) (2) (3) (4) Innovation activity
Product innovator 0.412* (0.219) - 0.154** (0.0663) - Innovation Success - 0.00414** (0.00183) - 0.00204* (0.0012)
Formal commercial collaborative agreements Agreements with customers/suppliers -0.0051 (0.122) -0.000243 (0.119) 0.0885 (0.1118) 0.103 (0.11) Agreements with other companies 0.208** (0.0967) 0.254*** (0.0952) 0.107 (0.10337) 0.119 (0.101)
IS adoption Internet E-Commerce (% sales) 0.00262 (0.00166) 0.00129 (0.00183) 0.002 (0.00151) 0.00178 (0.00153)
Resources Employment 0.00482 (0.0054) 0.0031 (0.00563) 0.0062** (0.00312) 0.006336** (0.00311)Employment squared 0.000031 (0.00005) 0.0000725 (0.00006) -0.0000246** (0.00001) -0.0000241** (0.00001) Part of group of firms 0.154 (0.135) 0.147 (0.135) 0.0997 (0.139) 0.0882 (0.1378) Firm age 0.008 (0.00559) 0.00975* (0.0056) 0.01** (0.0055) 0.0118** (0.00551) Percentage of workforce with degrees 0.00279** (0.00109) 0.00224** (0.00113) 0.00237** (0.00105) 0.00222** (0.00105) Productivity 2001 0.0979** (0.0429) 0.103** (0.0431) 0.119*** (0.0427) 0.115*** (0.0427)
Marketing Strategy Niche market -0.082 (0.0997) 0.0772 (0.09885) -0.035 (0.09229) -0.025 (0.0921)
Industry Sectors Pharmaceutical 0.00577 (0.252) -0.028 (0.256) 0.112 (0.249) 0.089 (0.251) Computer -0.234 (0.166) -0.263 (0.161) -0.208 (0.165) -0.196 (0.163) TV and Radio -0.196 (0.136) -0.181 (0.132) -0.165 (0.125) -0.137 (0.125)Medical, instrumentation, optical -0.05 (0.125) -0.0511 (0.123) -0.000885 (0.116) 0.007 (0.115) Aerospace 0.0213 (0.262) 0.0432 (0.261) -0.028 (0.235) -0.0183 (0.243) Telecommunications -0.483*** (0.0733) -0.505*** (0.0634) -0.475*** (0.0779) -0.471*** (0.08) Software -0.439*** (0.0998) -0.424*** (0.0965) -0.412*** (0.0918) -0.386*** (0.0927) R&D in natural sciences and engineering -0.381*** (0.11) -0.39*** (0.105) -0.327*** (0.114) -0.309*** (0.115) Technical testing -0.203 (0.154) -0.162 (0.161) -0.27** (0.129) -0.26** (0.131) Observations 260 260 272 272
Notes: Standard errors in parentheses; ***p<0.001, **p<0.05, *p<0.1. Coefficients are marginal effects.

26
Table 7 Determinants of export intensity Variables Endogeneity treated Endogeneity not treated (1) (2) (3) (4) Innovation activity
Product innovator 16.753 (15.295) - 3.968 (4.849) - Innovation Success - 0.06 (0.13) - -0.0807 (0.0851)
IS adoption Internet E-Commerce (% sales) 0.222* (0.116) 0.2117* (0.122) 0.218** (0.111) 0.265** (0.11)
Resources Employment 0.185 (0.325) 0.255 (0.354) 0.186 (0.183) 0.206 (0.184) Employment squared -0.00123 (0.00276) -0.00188 (0.00363) -0.0006 (0.0061) -0.00066 (0.00061) Part of group of firms -4.337 (8.084) -3.959 (8.187) -1.026 (8.0377) -2.695 (8.05) Firm age -0.439 (0.373) -0.45 (0.383) -0.524 (0.364) -0.568 (0.356) Percentage of workforce with degrees 0.164* (0.0846) 0.155* (0.0911) 0.196** (0.811) 0.22*** (0.0789)
Marketing Strategy Niche market -9.69 (6.648) -7.88 (6.688) -8.15 (6.49) -6.512 (6.538)
Industry Sectors Pharmaceutical -6.455 (10.745) -4.933 (11.096) -2.674 (10.507) -2.313 (10.351) Computer -14.218 (10.326) -12.124 (10.613) -8.608 (9.751) -6.997 (9.22) TV and Radio 2.555 (10.275) 5.939 (9.851) 9.099 (8.636) 10.252 (8.35) Medical, instrumentation, optical 7.952 (8.573) 10.06 (8.625) 11.982 (8.008) 12.837 (7.865) Aerospace -13.01 (11.38) -13.581 (11.273) -11.931 (9.652) -9.764 (9.465) Telecommunications -6.7 (12.195) -5.761 (12.757) 2.501 (12.296) 5.28 (12.699) Software 0.441 (9.9) 3.957 (9.547) 5.305 (9.216) 5.374 (8.987) R&D in natural sciences and engineering 38.411** (16.115) 42.67*** (15.714) 47.627*** (14.056) 49.126*** (13.436) Technical testing -3.924 (12.523) -2.599 (12.06) -4.745 (9.72) -6.234 (10.215)
ρ / σ / λ (standard errors) -0.603 / 28.95 / -17.46 (0.129) / (2.25) / (4.87)
-0.63 / 29.45 / -18.56 (0.126) / (2.332) / (4.936)
-0.59 / 28.75 / -16.98 (0.112) / (2.189) / (4.254)
-0.526 / 28.345 / -14.937 (0.106) / 2.037) / (3.79)
Log pseudo-likelihood -773.846 -773.796 -818.72 -821.21 Wald test of independent equations χ²(1) 11.71 / p-value = 0.0006 12.56 / p-value = 0.0004 15.45 / p-value = 0.0001 15.85 / p-value = 0.0001 Smith-Blundell test of exogeneity χ2(1) Smith-Blundell test of exogeneity F(1,235)
2.917 / p-value = 0.0876 5.991 / p-value = 0.015
Sargan test for overidentification χ²(2) p-value = 0.5548 p-value = 0.5585 Observations 134 134 142 142
Notes: Standard errors in parentheses; ***p<0.001, **p<0.05, *p<0.1. Coefficients are marginal effects

27