rcmar/export methodological seminar series and liu_rcmar_panels... · rcmar/export methodological...
TRANSCRIPT

Online Panels for Data Collection
Ron D. Hays and Honghu Liu (UCLA)
Arie Kapteyn (USC)
RCMAR/EXPORT Methodological Seminar Series https://uclahs.webex.com (meeting # 806 592 178)
December 15, 2014 (3-4pm)

CTSI Competencies
1) Assess the strengths and weaknesses of possible study designs for a given clinical or translational research question.
2) Design a research data analysis plan.
3) Assess threats to internal validity in any planned or completed clinical or translational study, including selection bias, misclassification, and confounding.
2

3
http://www.surveypolice.com/opinion-miles-club

https://www.opinionmilesclub.com/
4
Bait and switch repeatedly. Plus, they collect information for 20 or more minutes, then say "not a match" or conveniently develop a technical glitch so that you can't complete the survey. The help desk is beyond frustrating, work off of a script and seem incapable of addressing any problem. The only thing they "help" with is to issue the same stock response and refuse to put one in touch with a supervisor. This is, by far, one of the absolute worst survey sites ever!

Non-Probability (Convenience) Internet Panels
• NIH Toolbox – Multidimensional set of brief
measures assessing cognitive, emotional, motor and sensory function from ages 3 to 85.
• Delve, Inc databases assembled using online self-enrollment, enrollment through events hosted by the company, and telephone calls from market research representatives

Convenience Internet Panels • PROs
– Relatively inexpensive and faster
– Able to get to low incidence subgroups
• CONs – Data integrity
• False answers
• Answering too fast
• Same answer repeatedly
• Duplicate surveys from same person
– Respondents may differ from intended target on measured (more educated) and on unmeasured characteristics

Convenience Internet Panels differ from Underlying Population
• 2002 Health and Retirement Study (HRS) sample of 11,279 of 55 and older population
• 30% reported internet access
• Predicted internet access from – Race/ethnicity, gender, education, age, marital
status, income, owns house, and self-rated health
Schonlau, M. A. et al. (2009). Selection bias in web surveys and the use of propensity scores. Sociological Methods and Research, 37, 291-318.
7

Internet Sample vs. Full Sample
Variable Internet sample Weighted internet sample
Full sample
High blood pressure 44% 52% 55%
Depressed 11% 15% 19%
Difficulty dressing 4% 7% 9%
Difficulty walking several blocks
15% 27% 31%
8

Probability Panels
• Selection probabilities known. – Need sampling frame (denominator)
• Get internet access for those without it.
9

Telepanel (1980’s)
• Started by Willem Saris, Professor of sociology at the University of Amsterdam – Recruited a sample of 1000 Dutch and gave them
computers and modems.
– Panel asked to download a survey every weekend, answer and upload it to the central modem pool.
• Sold panel to a market research agency.
http://en.wikipedia.org/wiki/Willem_Saris
10

CentERpanel (1990s)
• Saris started another (larger) panel – Panel size = 3k
• Sold to Tilburg Univ. Center for Economic Research
• CentERpanel still exists and is the oldest internet probability panel in the world.
11

Subsequent probability panels
• 1999: Knowledge Networks (now GFK), U.S. – Address-based sampling
– Approximate recruiting response rate = 15%
– Panel size = 55k
• 2006: Longitudinal Internet Studies for the Social Sciences, Netherlands – Population registry-based sampling
– Recruited face-to-face and telephone
– Approximate recruiting response rate = 45%
– Panel size = 7.5k
12

Subsequent probability panels (2)
• 2006: American Life Panel, U.S. – Recruited by RDD, face-to-face, and address-based
– Approximate recruiting response rate = 15%
– Panel size = 6k
• 2014: Understanding America Study, U.S.
– Address-based sampling – Approximate recruiting response rate = 20% – Panel size = 2k
13
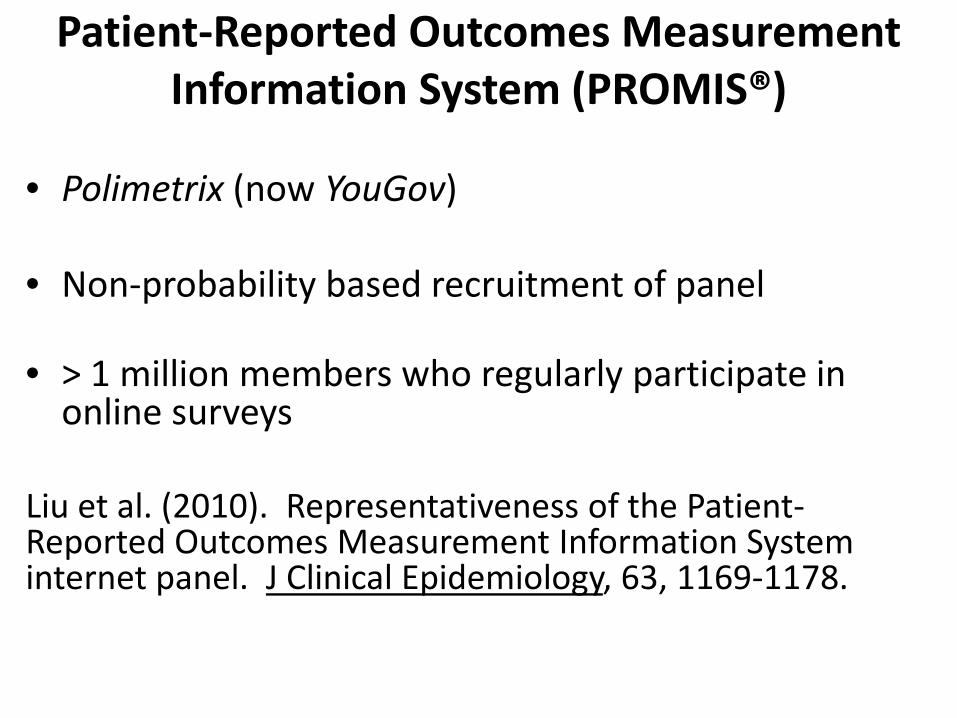
Patient-Reported Outcomes Measurement Information System (PROMIS®)
• Polimetrix (now YouGov)
• Non-probability based recruitment of panel
• > 1 million members who regularly participate in online surveys
Liu et al. (2010). Representativeness of the Patient-Reported Outcomes Measurement Information System internet panel. J Clinical Epidemiology, 63, 1169-1178.

Sample-Matching Methodology
• Target subset with selected characteristics – n = 11,796 overall
– Subgroups with lower response rates oversampled
• PROMIS targets (“Quota sampling”) – 50% female
– 20% 18-29, 30-44, 45-59, 60-74 and 75+
– 12.5% black, 12.5% Hispanic
– 10% < high school graduate

PROMIS Internet Sample versus Census
PROMIS Sample 2000 Census
% Female 55% 52%
% Hispanic 13% 11%
% Black 10% 11%
% < High school 3% 20%
% High school/GED 19% 29%
% > High school 78% 51%
Mean age 50 45

Analytic Weights (Post-Stratification Adjustment)
• Compensate for nonresponse and non-coverage
• Weight sample to have same distribution on demographic variables
• Gender, age, race/ethnicity, education, marital status, and income
• Iterative proportional fitting or raking

Raking
• Matches cell counts to the marginal distributions of the variables
• Performs cell-by-cell adjustments • Repeated iteratively until convergence
between the weighted sample and U.S. Census distributions
18
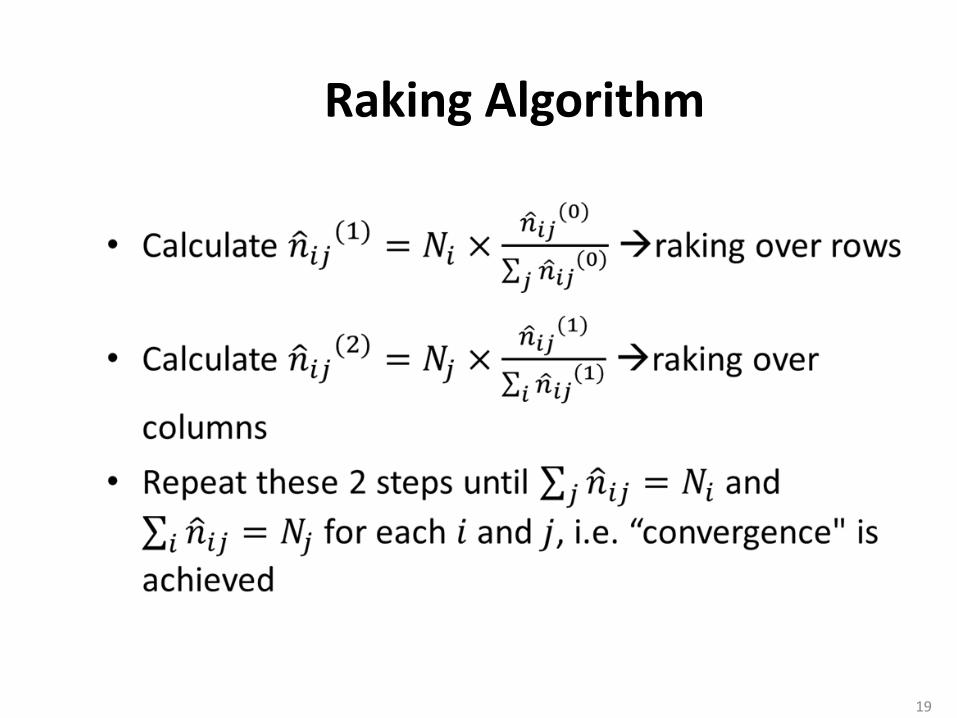
Raking Algorithm
19

Raking Example
• Grouping by Gender & Race
20
Sample Black White Asian Native
American Other Sum of Weights
Pop. Sum
Female 300 1200 60 25 30 1615 6500
Male 150 1080 93 30 32 1385 5725 Sum of Weights 450 2280 150 60 60 3000
Pop. Sum 2000 9000 700 250 275 12225

Raking Example (-con’t)
21
Black White Asian Native
American Other Sample
Sum Pop. Sum
Female 1207 4830 241 101 121 6500 6500
Male 620 4464 384 124 132 5725 5725
Sample Sum 1827 9294 626 225 253 12225 Pop. Sum 2000 9000 700 250 275 12225

Raking--Summary
• Response probabilities depend only on the row and column and not on the specific cell
• Allow to include more variables
• Converge to Cell weighting if the auxiliary variables are independent
• Convergence can be slow, and occasionally impossible
22

PROMIS Weighted Sample
• A raking benchmarking to variables (gender, age, race/ethnicity, education, marital status and income) common to both the PROMIS and the 2000 Census.
• The weights assigned to individual respondents
• Marginal distributions on auxiliary variables were equivalent between the PROMIS and 2000 Census.
23

PROMIS Internet Sample (Weighted) versus Census
PROMIS Sample 2000 Census
% Female 52% 52%
% Hispanic 11% 11%
% Black 11% 11%
% < High school 20% 20%
% High school/GED 29% 29%
% > High school 51% 51%
Mean age 45 45

PROMIS General Population Sub-sample
• A subset of the PROMIS internet sample • Sub-sample approximated the joint
distributions of key demographic variables in the 2000 U.S. Census: – Age
– Gender
– Race/ethnicity
25

Algorithm to Obtain PROMIS General Sub-sample
1. Obtain the marginal distribution of gender, age, and race/ethnicity of the PROMIS Internet general population
2. Create grids of cells: 2 (gender: Male, Female) × 5 (age: 18 to 29, 30 to 44, 45 to 59, 60 to 74, 75+) × 4 (race/ethnicity: African American, White, Hispanic, Other race) = 40 cells
3. Calculate the frequency of responses for each cell for the PROMIS sample: with i = 1,2; j = 1,2,3,4,5; k = 1,2,3,4.
4. Calculate the corresponding percentage for each cell based on census data (SF4): with i = 1,2; j = 1,2,3,4,5; k = 1,2,3,4 with general U.S. population.
5. Compute the sample size for each cell for the sub-sample:
6. Within each cell, draw random sample from general population.
)}_
{min(_ijk
ijkijkijk rc
nrcnn =
ijkrc _
ijkn

GENERAL HEALTH In general, how would you rate your health? (5 = excellent; 4 = very good; 3 = good; 2 = fair; 1 = poor)
Sample Mean (1-5 possible score)
PROMIS general population sub-sample 3.53
PROMIS (Weighted) 3.42
2004 Medical Expenditure Panel Survey (MEPS)
3.56
2001-2002 National Health and Nutrition Examination Survey (NHANES)
3.50
2005 Behavioral Risk Factor Surveillance System (BRFSS)
3.52
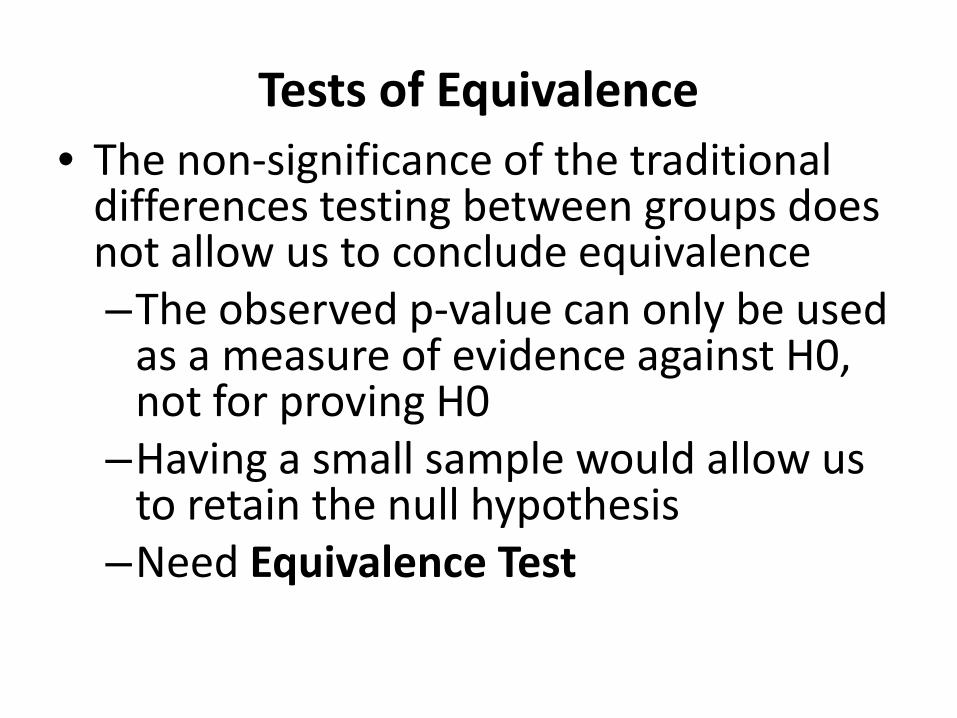
Tests of Equivalence • The non-significance of the traditional
differences testing between groups does not allow us to conclude equivalence –The observed p-value can only be used
as a measure of evidence against H0, not for proving H0
–Having a small sample would allow us to retain the null hypothesis
–Need Equivalence Test

Two One-Sided Tests (TOST) • To test the joint null hypothesis
– H0a: μ1 - μ2 > δ OR
– H0b1: μ1 - μ2 < -δ
• By rejecting both of these hypotheses, we can conclude that | μ1 - μ2| < δ, or that our difference falls within the range specified
• The null hypothesis is usually tested by performing two tests at the α level:
α
σ
δ−>
+
+−1
21
21
11z
nn
yyα
σ
δ−−≤
+
−−1
21
21
11z
nn
yy

Confidence Interval Approach (CI)
• Specify a range of values that would constitute equivalence among groups – - δ to δ
• Determine the appropriate confidence interval for the mean difference between the groups
• See if the CI for the difference between means falls entirely within the range of equivalence – If lower/upper end falls out of [- δ to δ] range, do not claim
equivalent • This is equivalent to the TOST

General Health Comparisons
• PROMIS vs NHANES

Indeterminancy
• Judgment must be suspended as there is no evidence for or against the hypothesis
• One may not be able to come to a solid conclusion
• May help to avoid the trend of interpretation of ‘marginally significant’ findings

Figure from Jones et al (BMJ 1996) showing relationship between equivalence and confidence intervals.

Thank you and
34

Appendix: Are probability internet panels with low response rates superior to convenience panels?
• Coverage of non-internet population
• Selectivity of respondents who sign up for convenience panels. – 30% of online surveys completed by 0.25% of the
U.S. population (Miller, 2006)
– 15-25% of vendor samples from a common pool of respondents (Craig et al., 2013)
– Panel participants belong to 7 online panels (Tourangeau, Conrad, and Couper, 2013)
35

Appendix: Comparing probability and convenience panels
• Same questionnaire (on politics) administered to a probability-based telephone (OSU center for survey research), probability-based internet sample (Knowledge Networks) and to a convenience internet sample (Harris Interactive).
• “The probability samples were more representative of the nation than the nonprobability sample in terms of demographics … even after weighting.”
Chang, L. and J.A. Krosnick (2009), National surveys via RDD telephone interviewing versus the Internet: Comparing sample representativeness and response quality, Public Opinion Quarterly, 73, 641-678.
36

Appendix: Average errors for Harris
Interactive and Knowledge Networks Versus 2000 Current Population Survey
Harris Interactive Knowledge Networks
Education 5% 4%
Income 2% 6%
Age 2% 2%
Race 2% 2%
Gender 2% 3%
37 Comparison is for weighted panel estimates.