rceptio ns of - heqcofaculty expe w th riences ork-int e ontar prepare for the hig with a egrated...
TRANSCRIPT

Facultty ExpeWth
eriencesWork-Int
e OntarPrepare
for the Hig
s with aegratedrio Posed by Julie gher Educa
and Ped Learnstsecon
Peters, Acaation Quality
rceptioning (Wndary Sademica Gry Council of
ons of WIL) in Sector
roup Inc.f Ontario

Disclaimer: The opinions expressed in this research document are those of the authors and do not necessarily represent the views or official polices of the Higher Education Quality Council of Ontario or other agencies or organizations that may have provided support, financial or otherwise, for this project.
Cite this publication in the following format: Peters, Julie, Academica Group Inc. (2012). Faculty Experiences with and Perceptions of Work-Integrated Learning (WIL) in the Ontario Postsecondary Sector. Toronto: Higher Education Quality Council of Ontario.
Published by:
The Higher Education Quality Council of Ontario
1 Yonge Street, Suite 2402 Toronto, ON Canada M5E 1E5 Phone: (416) 212-3893 Fax: (416) 212-3899 Web: www.heqco.ca E-mail: [email protected] © Queens Printer for Ontario, 2012

3 – Faculty Experiences with and Perceptions of Work-Integrated Learning (WIL) in the Ontario Postsecondary Sector
Acknowledgements Table of Contents
Executive Summary ......................................................................................................................... 4
1. Introduction .................................................................................................................................. 8
2. Literature Review ....................................................................................................................... 12
3. Methodology ............................................................................................................................... 15
4. Respondent Profile ..................................................................................................................... 18
Institution, Program Area, and Employment Status ....................................................................... 18
Demographic Characteristics ......................................................................................................... 19
Experience ..................................................................................................................................... 20
WIL Involvement ............................................................................................................................ 21
5. Findings ...................................................................................................................................... 25
Purpose of PSE .............................................................................................................................. 25
Appropriate Level of WIL ................................................................................................................ 27
Value of WIL ................................................................................................................................... 29
Value of WIL for Students .............................................................................................................. 30 Value of WIL for Faculty and Institutions ....................................................................................... 32 Value of WIL by Faculty Characteristics ........................................................................................ 34
Challenges ..................................................................................................................................... 36
Workload Issues ............................................................................................................................. 43
Labour Market Connectivity ........................................................................................................... 44
6. Discussion .................................................................................................................................. 50
Works Cited .................................................................................................................................... 52
Appendix 1: Working Group ........................................................................................................... 54
Appendix 2: Survey Instrument ...................................................................................................... 55
Appendix 3: WIL Index Items ......................................................................................................... 64

4
4 – Faculty Experiences with and Perceptions of Work-Integrated Learning (WIL) in the Ontario Postsecondary Sector
Executive Summary In the emerging knowledge-based economy, employers are requiring new levels of skill from labour market entrants. As employers’ expectations of postsecondary graduates increase, Ontario’s publicly funded colleges and universities are working to provide students with much of the knowledge, skills, and training needed for success in the community and in the changing workplace. As a result, there has been a movement within the postsecondary education (PSE) sector to provide a closer integration of learning and work as a strategy for workforce skills development (Fisher, Rubenson, Jones, & Shanahan, 2009). In particular, work-integrated learning (WIL) programs such as co-operative education, internship, and apprenticeship are frequently endorsed as educational modes of delivery to support such integration.
Offering work-integrated learning experiences for students requires a significant investment of human and financial resources to be effective. Faculty in particular play an important role in designing, supporting, and implementing WIL opportunities for students. Despite a growing recognition of the essential role played by faculty, very little is known about their perceptions of and experiences with WIL. To shed light on this issue, this report provides the results of the WIL Faculty Survey conducted by the Higher Education Quality Council of Ontario (HEQCO) in partnership with 13 Ontario postsecondary institutions. The report is part of a broader multi-phase project being undertaken by HEQCO on WIL in Ontario’s PSE sector.
The WIL Faculty Survey was designed to better understand faculty experiences with and perceptions of WIL as an element of postsecondary curriculum. Guided by a Working Group comprised of representatives from the 13 participating postsecondary institutions, the study sought to address four primary research questions:
1) How do faculty perceive the value and benefits of WIL to students, faculty members, and postsecondary institutions?
2) Do faculty views about WIL differ by employment status, program, gender, years of teaching, previous employment experience, or their own past WIL experience?
3) How do faculty integrate students’ work experiences into the classroom?
4) What concerns do faculty have about introducing or expanding WIL opportunities in postsecondary institutions?
The survey instrument was developed in consultation with the Working Group and was pre-tested with 25 faculty members. The survey was administered online from March to May, 2011, with e-mail invitations to participate sent to 18,232 faculty from the 13 partner institutions (6,257 college faculty and 11,975 university faculty). In total, 1,707 college faculty and 1,917 university faculty completed the survey to an acceptable cut-off point, for an overall response rate of 19.9%.
Close to two-thirds of college faculty and roughly half of university faculty respondents reported having experience teaching in a program in which students participate in a co-op or apprenticeship. Fewer faculty had experience personally teaching a course with a WIL component, with 47.5% of college faculty and 28.9% of university faculty currently or previously having taught a course involving WIL. Among those who had taught a course with a WIL component, field placements were the most common type of WIL among college faculty, followed by mandatory professional practice (student placements required for licensure or professional designation). For university respondents, mandatory professional practice was the most common type of WIL taught, followed by applied research projects.

5
5 – Faculty Experiences with and Perceptions of Work-Integrated Learning (WIL) in the Ontario Postsecondary Sector
Appropriate Level of WIL
Faculty were generally supportive of the current level of WIL used in postsecondary institutions, with very few respondents reporting that the use of WIL should be decreased (0.8% of college faculty and 4.3% of university faculty). Among college faculty, over half felt that the use of WIL should be increased (55.1%), and one-quarter felt that it should be kept the same (24.7%). There was slightly less support for increasing the use of WIL among university faculty, with less than half of respondents indicating that the level of WIL should be increased (43.8%), and exactly one-quarter feeling it should stay at the same level. A sizeable proportion of both college (19.4%) and university (26.9%) faculty responded that they were not sure.
Faculty views about the appropriate level of WIL varied significantly based on a number of respondent characteristics. In particular, faculty who personally taught a course that had a WIL component, who had participated in WIL themselves as a student, who had more years of other employment experience outside of postsecondary, and who taught in Business faculties tended to be more likely to report that the level of WIL in postsecondary education should be increased. These differences were most pronounced among university faculty.
Value of WIL
In line with the support found for the current level of WIL in PSE, an overwhelming majority of college and university faculty respondents agreed or strongly agreed that WIL is valuable (95.0% college and 83.5% university). When asked to indicate their level of agreement with various statements about specific potential advantages and disadvantages of WIL for students, faculty and institutions, it was clear that faculty perceive the advantages of WIL to accrue primarily to students. In particular, both college and university faculty tended to have high levels of agreement with statements about the labour market advantages of WIL for students, such as helping students to better understand work realities and developing employment contacts. Among survey respondents, the primary advantages of WIL for faculty and institutions were that it strengthens links between the institution and the business community and connects postsecondary institutions to the broader community. A large proportion of college faculty also agreed or strongly agreed that feedback from students and employers who participate in WIL can improve academic programming.
Using an index measuring perceived value of WIL created from responses to statements about the advantages and disadvantages of WIL for students, faculty, and institutions, a regression model was run to examine the extent to which faculty views about the value of WIL differ by various characteristics and experiences. For college faculty, gender, participation in WIL as a student, level of WIL involvement, and program area were found to be significant predictors of the perceived value of WIL. Female faculty, faculty who participated in WIL when they were a student, faculty who taught in a WIL program or taught a course with a WIL component, and faculty who taught in Social Sciences, Health, or Business programs perceived WIL to be more valuable. Age, years of other employment experience outside of postsecondary, and employment status (full-time/part-time) were not statistically significant predictors.
For university faculty, employment status, gender, participation in WIL as a student, level of WIL involvement, years of other employment experience outside of postsecondary and program area were statistically significant predictors of the perceived value of WIL. Holding part-time status, being female, having participated in WIL as a student, teaching in a WIL program or teaching a course with a WIL component, having more years of other employment experience, and teaching in any program area outside of the Arts and Humanities were all associated with higher scores on the value of WIL index. Age was not found to be a significant predictor.

6
6 – Faculty Experiences with and Perceptions of Work-Integrated Learning (WIL) in the Ontario Postsecondary Sector
Challenges
Ensuring quality placements for students was the most frequently selected challenge among both college (79.6%) and university (74.7%) respondents, followed by finding enough placements for students (76.2% and 67.4%, respectively). Concerns about faculty workload also emerged as prominent challenges, with over half of both college and university faculty selecting “managing WIL with large class sizes” and “balancing WIL with academic workloads.” Only about one-fifth of college and university faculty respondents selected lack of institutional service recognition for WIL activities or lack of recognition for WIL activities in promotion decisions as key challenges.
Workload Issues
Offering a WIL experience as part of a postsecondary course can add to the workload of faculty. Provided with a list of 17 workload tasks, about half of faculty respondents who taught a course with a WIL component reported performing 11 or more of these tasks in a typical term. For most faculty, the majority of these tasks were completed as part of their regular duties. Classroom-focused workload tasks tended to be the most commonly performed activities, such as preparing WIL-related lectures, tutorials, and workshops; evaluating WIL-related student assignments; and establishing WIL student learning objectives. Tasks completed most often in addition to regular duties tended to be employer and career-related, such as providing career/employment counselling or mentoring for students, recruiting WIL partners/host sites, and managing relationships with host employers and community partners.
Labour Market Connectivity
Formal WIL opportunities are only one way in which postsecondary institutions and faculty connect learning with the world of work and employment. Asked to indicate the extent to which they participated in a range of activities that integrate student learning with real-world work experiences, both college and university faculty reported engaging most often in activities that require minimal direct contact with outside business, government or community members. This included using business examples to illustrate concepts in class, and providing individual career assistance for students. Activities that require higher levels of planning and preparation, such as organizing class visits to local businesses, arranging job shadowing opportunities, and inviting business guest speakers into classes were undertaken relatively infrequently. However, close to 70% of college faculty and roughly half of university faculty stated that they typically invite business, government, or community guest speakers into the classroom at least once during an academic term. Overall, college faculty reported integrating student learning with real-world work experiences to a greater extent than university faculty. When responses were examined by program area, university faculty teaching in Business programs were found to engage in the connectivity activities to a significantly greater extent than faculty in other program areas. University faculty who taught a course with a WIL component were also more likely to engage in the activities than university faculty who taught in a WIL program or had no WIL involvement. While differences by program area and level of WIL involvement were also statistically significant for college faculty, the effect sizes were very small suggesting that the differences were not practically significant.
Discussion
This study offers valuable insight into the perceptions of faculty at Ontario colleges and universities, providing a greater sense of the barriers and challenges to faculty involvement in WIL, as well as the perceived benefits. Based on the survey findings, a number of policy recommendations are suggested. First, postsecondary institutions will need to improve faculty awareness of the purpose and benefits of WIL if they wish to increase their provision of WIL opportunities for students. Institutions will also need to address concerns that WIL privileges the production of “workers,” over providing students with a broad-

7
7 – Faculty Experiences with and Perceptions of Work-Integrated Learning (WIL) in the Ontario Postsecondary Sector
based and more theoretical education. Further, dedicated financial and administrative resources and institutional recognition for WIL-related work are important to aid faculty in providing WIL opportunities.
Given that one of the primary concerns for faculty is ensuring adequate numbers of quality placements for students, institutions could also play a greater role in working to strengthen and support communication links with employers and community partners. Providing assistance in recruiting and building relationships with host sites, similar to institutional structures that often already support more established co-op programs, could help to alleviate faculty concerns about the significant demands on time involved in WIL.
Future research should explore faculty attitudes in relation to specific types of WIL, examining how the barriers and workload issues may differ. Studies could also move beyond focusing on faculty perceptions of benefits and challenges, to generating a better understanding of whether and how participating in WIL impacts faculty in other ways, such as the influence of WIL on instructional approaches. Effective strategies to enhance faculty involvement in WIL should also be explored, along with institutional best practices in the administration and support of faculty-led WIL initiatives.

8
8 – Faculty Experiences with and Perceptions of Work-Integrated Learning (WIL) in the Ontario Postsecondary Sector
1. Introduction Increasingly, employers in the emerging knowledge-based economy are requiring new levels of skill from labour market entrants. As employers’ expectations of postsecondary graduates rise, Ontario’s publicly funded colleges and universities are working to provide students with much of the knowledge, skills, and training needed for success in the community and in the changing workplace. As a result, there has been a movement within the postsecondary education (PSE) sector to provide a closer integration of learning and work as a strategy for workforce skills development (Fisher, Rubenson, Jones, & Shanahan, 2009). In particular, work-integrated learning (WIL) programs such as co-operative education, internship, and apprenticeship are frequently endorsed as educational modes of delivery to support such integration.
While the benefit and value of postsecondary WIL experiences to students, institutions, and employers are generally assumed, relatively little empirical evidence exists. In addition, concerns have been raised that closer integration between education and the workplace will privilege workplace learning over theoretical learning, or that existing social inequalities based on race, gender, or socio-economic status will be reproduced and reinforced through workplace experiences (Billett, 2009a; Chisholm, Harris, Northwood, & Johrendt, 2009). Given the significant investment of private and public resources involved in postsecondary WIL programs, a clear understanding of whether and how WIL programs contribute to the quality of the PSE experience of students and to their post-graduation outcomes is vital. In addition, there are equity and access dimensions to the provision of work experiences through postsecondary WIL – rather than student employment programs or other labour market policy tools – that must be carefully considered in any analysis of WIL policy.
This report provides the results of the WIL Faculty Survey, which was undertaken as part of a broader project of the Higher Education Quality Council of Ontario (HEQCO), called Work-Integrated Learning in Ontario’s PSE Sector. The project is a multi-phase study exploring the benefits, challenges, and outcomes of WIL programs, and is designed to provide empirical evidence of how WIL programs contribute to the quality of students’ PSE experiences and their post-graduation outcomes. Phase 1 of this project was commissioned in 2009, and was an exploratory study of the range of WIL opportunities available at Ontario postsecondary institutions.1 A literature review of relevant research was conducted, as well as qualitative interviews with 25 employers and 39 staff and faculty involved in the delivery of WIL programs at nine Ontario colleges and universities. Based on the research findings, a typology was developed to provide a conceptual framework for understanding the complex array of WIL programs available in higher education (Table 1).
1 See www.heqco.ca for a copy of the Phase 1 report, entitled Work-Integrated Learning in Ontario’s Postsecondary
Sector.

9 – Faculty Experiences with and Perceptions of Work-Integrated Learning (WIL) in the Ontario Postsecondary Sector
Table 1 Abbreviated WIL Typology
Systematic Training
(workplace as the central place of
learning)
Structured Work Experience (familiarization with the world of work within a PSE program)
Institutional Partnerships (PSE activities/programs to achieve
industry or community goals)
Apprenticeships Field Experience
Mandatory Professional
Practice Co-op Internships Applied Research
Projects Service-learning
Main educational purposes
• Workforce training • Skill acquisition • Skill mastery • Workplace literacy
• Application of theory to practice
• Attainment of professional or work-related competencies
• Workplace literacy
• Integration of theory and practice
• Attainment of professional competencies
• Professional socialization
• Mandatory for professional certification/ licensure
• Mandatory for institutional program accreditation
• Integration of theory and practice
• Career exploration and development
• Progressive skill acquisition
• Professional socialization
• Workplace literacy • Workforce
readiness
• Integration of theory to practice
• Personal development
• Career exploration and development
• Skill development• Professional
socialization
• Application of theory to practice
• Address specific industry needs
• Skill development (problem-solving, critical thinking)
• Integration of theory and practice
• Address specific community needs
• Community building
• Civic engagement • Global citizenship • Career exploration
and development • Skill development • Personal
development
Modes of delivery Work-site • FT employment In-school • Block release
(alternating with employment)
• Day release (concurrent)
• Block placement (alternating with academic program)
• Defined number of hours per term (concurrent)
• Simulated work activities (concurrent)
• Virtual work activities (concurrent)
• Block placement (alternating with academic program)
• Defined number of hours per term (concurrent)
• Single block placement, often at end of program (capstone)
• Simulated work activities (concurrent)
• Block placement (alternating with academic program)
• Structured work-study sequence must end with academic semester
• Single block placement at end of program (capstone)
• Single block placement (alternating with academic program)
• Defined number of hours per term (concurrent)
• Course-based projects (concurrent)
• Institutional research projects (concurrent)
• Can be delivered as field experience, co-ops, internships or applied research projects
Source: Sattler, 2009

10 – Faculty Experiences with and Perceptions of Work-Integrated Learning (WIL) in the Ontario Postsecondary Sector
During Phase 1, it was also found that there is little consensus around a shared definition of “work-integrated learning,” with a wide variety of meanings assigned to the term in the literature. These various definitions were reviewed in detail, and a conceptual understanding best suited to the Ontario context was proposed.2 This definition, adopted here, describes WIL as:
…the process whereby students come to learn from experiences in educational and practice settings and integrate the contributions of those experiences in developing the understandings, procedures and dispositions required for effective professional practice, including criticality. Work-integrated learning arrangements include the kinds of curriculum and pedagogic practices that can assist, provide and effectively integrate learning experiences in both educational and practice settings (Billett, 2009a: p. v).
Building on the findings of the first phase, Phase 2 of this project was designed to explore faculty and student perceptions of the value and benefits of work and voluntary activities undertaken during postsecondary study, and examines the impact of these experiences on learning and labour market outcomes. A Graduating Student Survey will explore postsecondary students’ voluntary and employment experiences, including participation in WIL. Sixteen months after the initial survey, in a proposed Phase 3 of this project, a follow-up survey will be conducted to explore students’ labour market and further educational outcomes.
The WIL Faculty Survey, which is the focus of this report, was designed to better understand faculty experiences with and perceptions of WIL as an element of postsecondary curriculum and was guided by a Working Group comprised of representatives from the 13 participating postsecondary institutions (see Appendix 1). This research builds on the Phase 1 findings, in which key informants interviewed suggested that staff and faculty believe WIL offers a wide range of benefits, but also perceive challenges associated with the development and delivery of WIL programs. Informed by these findings, this study sought to address four primary research questions:
1) How do faculty perceive the value and benefits of WIL to students, faculty members, and postsecondary institutions?
2) Do faculty views about WIL differ by employment status, program, gender, years of teaching, previous employment experience, or their own past WIL experience?
3) How do faculty integrate students’ work experiences into the classroom?
4) What concerns do faculty have about introducing or expanding WIL opportunities in postsecondary institutions?
To address these questions, an online survey of faculty at 13 Ontario postsecondary institutions that partnered with HEQCO in the completion of this study was conducted. The survey results are presented in this report, which is organized into six chapters:
• Chapter 2 situates the study in the scholarly literature, focusing on research studies that examine faculty involvement in and perceptions of WIL.
2 See the Phase 1 report, entitled Work-Integrated Learning in Ontario’s Postsecondary Sector, for a detailed
discussion (available at www.heqco.ca).

11
11 – Faculty Experiences with and Perceptions of Work-Integrated Learning (WIL) in the Ontario Postsecondary Sector
• Chapter 3 describes the study methodology, including an overview of the development of the survey instrument, the survey administration, and data analysis procedures.
• Chapter 4 details the profile of survey respondents, summarizing respondent demographic characteristics, postsecondary teaching experience and other employment experience, and involvement with WIL.
• Chapter 5 presents the survey findings, including faculty views about the purpose of PSE, the appropriate level of WIL in postsecondary programs of study; the value of WIL for students, faculty, and postsecondary institutions; and challenges and workload issues associated with administering WIL programs. This chapter also presents findings on the extent to which faculty engage in various activities that connect learning and work that may not be part of formal WIL programs.
• Chapter 6 summarizes the study findings, offering policy recommendations and suggestions for future research.

12
12 – Faculty Experiences with and Perceptions of Work-Integrated Learning (WIL) in the Ontario Postsecondary Sector
2. Literature Review Work-integrated learning is not simply about providing students with work experience; it is an educational process with its own foundational theory and pedagogy (Moreland, 2005). Thus, WIL programs require significant investment of human and financial resources and need to be effectively integrated into the curriculum or risk being unfocused and unproductive (Patrick, Peach, Pocknee, Webb, Fletcher, & Pretto, 2009). Despite a growing recognition that faculty are essential to the successful development and implementation of WIL programs, the literature has focused primarily on student and employer experiences and views (McCurdy & Zeqwaard, 2009; Pribbenow, 2005). Studies that have considered faculty views have tended to be narrow in scope, including only one particular program or type of WIL, and have typically only examined the perceptions of faculty who are directly involved in WIL. Nonetheless, some important insights can be gleaned from the literature.
Studies of faculty perceptions of WIL generally suggest that faculty view these programs favourably, and recognize many benefits and advantages of the use of WIL in PSE (Abes et al., 2002; Hodges, 2008; McCurdy & Zegwaard, 2009). Key benefits acknowledged by faculty that are cited in the literature include helping students focus on their career paths and understand workplace realities, increased understanding of course material, and personal development (Abes et al., 2002; Hodges, 2008; McCurdy & Zegwaard, 2009). In addition to the benefits of WIL programs for students, a number of studies have also reported that faculty are motivated to become involved with WIL because they believe it provides a service to the community, acts as an effective marketing tool for their postsecondary institution or program, and helps to create community partnerships (Abes et al., 2002; Bulot & Johnson, 2006; McCurdy & Zegwaard, 2009). Notably, these perceived benefits relate primarily to students, postsecondary institutions, and the wider community.
While much of the literature suggests that faculty perceive WIL to be of little benefit for faculty themselves (McCurdy & Zegwaard, 2009), findings from a few studies have countered this view. Researching field experience opportunities at Canadian universities, Wimmer (2007) found that some faculty supervisors valued their role because they felt they could gain relevant knowledge and perspectives from the ‘real world’ through their relationships with field site supervisors. Examining service-learning, Pribbenow (2005) reported that faculty felt service-learning was engaging and rewarding and contributed to a heightened commitment to teaching. Faculty engaged in service-learning also felt that the latter led to deeper relationships with students and a greater understanding of their needs through the heightened interaction that was required to link students’ community experiences with their learning. Further, this heightened interaction was said to enhance the ability of faculty to effectively assess and understand student learning.
While these studies have highlighted a number of benefits that faculty associate with WIL, there has been an even greater emphasis on the challenges. One of the primary challenges reported in the literature is that delivering WIL programs requires considerable faculty time and energy (Abes et al., 2002; Bulot & Johnson, 2006; Hodges, 2008; Patrick et al., 2009; Pribbenow, 2005; Sattler, 2011). Integrating WIL into a course is qualitatively different than teaching a conventional course, and necessitates the development of unique knowledge and skills. In particular, building and managing relationships with community partners is beyond the scope of traditional postsecondary teaching and can require a significant investment of faculty time. Supervising and assessing students’ work experiences also adds significantly to the workload of faculty. For service-learning faculty, these additional workload commitments have been estimated to require up to 10 extra hours a week, and 4.5 hours/week on average (Bulot & Johnson, 2006).
Due to the additional demands involved with WIL, faculty often find themselves sacrificing research and publication productivity (Abes et al., 2002; Emslie, 2011). This problem is amplified by the fact that descriptions of academic duties have not kept pace with the expansion of WIL in PSE (Emslie, 2011).

13
13 – Faculty Experiences with and Perceptions of Work-Integrated Learning (WIL) in the Ontario Postsecondary Sector
That is, while faculty are increasingly expected to deliver WIL programs, accounts of academic work roles often do not include workload allowances for the delivery of WIL. When it comes to promotion and tenure in universities and the workload formula of colleges, faculty find that time spent on WIL is often undervalued compared to other academic pursuits. While these arguments stem from the Australian context, a recent HEQCO study suggested that research continues to be more highly valued and have a bigger payoff in status and reputation than the quality of teaching in Ontario universities in particular, indicating that these claims likely have relevance in Ontario as well (Britnel, Brockerhoff-Macdonald, Carter, Dawson, Doucet, Evers, Hall, Kerr, Liboiron-Grenier, McIntyre, Mighty, Siddall, & Wilson, 2010).
In light of these arguments, it is not surprising that a prominent barrier highlighted in the literature is a lack of institutional support and recognition for faculty involved with WIL. Abes, Jackson and Jones (2002) found that lack of acknowledgement in the institutional reward structure is a key deterrent to faculty participation in service-learning, and a number of studies have reported that despite the time-intensive nature of providing quality WIL experiences, postsecondary institutions typically offer little encouragement or reward for faculty (Brewer & Gray, 1999; Emslie, 2011; McKay & Rozee, 2004). In the Canadian context, Wimmer (2007) found that university faculty in professional programs feel there is a lack of political will among institutional policymakers to modify existing faculty reward structures to recognize efforts to deliver field experiences for students.
The difficulty of finding suitable work placements for students is also noted to be a significant challenge to effective implementation of WIL (Patrick et al., 2009; Sattler, 2011). As the desire to provide WIL opportunities grows, the ability of industry to absorb students through individual placements becomes strained. In Phase 1 of this project, many faculty and university staff reported that placements are hard to obtain. Finding employers or community agencies that are willing to take on students can be difficult, particularly when there are multiple postsecondary institutions in a region competing for a small number of placement opportunities (Sattler, 2011).
Ensuring adequate numbers of placements is only part of the challenge, however, with faculty also concerned about the quality of those placement experiences that already exist. Workplace supervisors often do not receive training, yet for WIL to have the greatest value for students work opportunities need to be relevant and engaging. Establishing the right fit between a student and the placement opportunity is of paramount importance, but can be a difficult undertaking (Patrick et al., 2009; Wimmer, 2007; Sattler, 2010).
A number of additional challenges and barriers to faculty involvement in the development and delivery of WIL programs are also highlighted in the literature. These include maintaining employer relationships (Abes et al., 2002; Hodges, 2008; Pribbenow, 2005), lack of resources and funding (Abes et al., 2002; Hodges, 2008; Patrick et al., 2009), and lack of support from non-WIL faculty (Wimmer, 2007). In one of the few studies that included the perspectives of faculty not involved in WIL, Abes, Jackson and Jones (2002) found that the four top deterrents for faculty not using service-learning in their courses were:
1) anticipating logistical problems coordinating the community service aspects;
2) not knowing how to use service-learning effectively;
3) feeling service learning was not relevant to the course in which they taught; and
4) not being given or not anticipating being given release time to develop the service-learning component of the course.
It should be emphasized that these findings are only related to service-learning, and cannot be taken as representative of the challenges associated with other types of WIL.

14
14 – Faculty Experiences with and Perceptions of Work-Integrated Learning (WIL) in the Ontario Postsecondary Sector
There has also been limited discussion about the ways in which WIL and non-WIL faculty differ. Rothamer (2003) conducted a study that compared business faculty who were and were not involved in co-operative education, and found that those who were involved showed a higher preference for incorporating students in determining the nature and evaluation of course content and material. Likewise, co-operative education faculty more frequently took their students’ prior experiences into account when planning learning activities.
While the literature highlights a number of barriers to faculty involvement in WIL, there has been little discussion of strategies that can be used in response. In relation to fieldwork experiences in social work, Savaya, Peleg-Oren, Stange and Geron (2003) suggest that creating a formal framework detailing the purpose of fieldwork, outlining ongoing training and updating for supervisors, and establishing regular meetings between field supervisors and classroom instructors could help to bridge the gap between academic and practical instruction. McCurdy and Zegwaard (2009) suggest that professional development (PD) for faculty focused on delineating the educational aspects of WIL, providing teaching ideas to incorporate WIL within the classroom, and adjusting workload models to recognize faculty participation in WIL, could go a long way towards increasing faculty engagement. Formalizing WIL in academic job descriptions, thus making WIL a visible part of faculty members’ role, has also been proposed (Emslie, 2011).
In summary, the literature suggests that faculty are generally supportive of WIL, and see it as beneficial for students, employers, and postsecondary institutions. While there has been limited evidence that faculty reap direct benefits from being involved in WIL, a much greater emphasis has been placed on the challenges to faculty, including time demands, difficulties finding quality placements, and a lack of institutional resources and support. Currently, however, the body of literature on faculty involvement in WIL is quite small, with most studies narrowly focusing on specific program areas and types of WIL and often including only those faculty who have direct involvement. Further, much of the literature is based in the Australian and American contexts. The current research project aims to begin to fill this gap by providing a comprehensive overview of faculty views from a spectrum of academic disciplines at Ontario postsecondary institutions, and includes both faculty who have current or past experience with WIL, as well as faculty with no WIL involvement.

15
15 – Faculty Experiences with and Perceptions of Work-Integrated Learning (WIL) in the Ontario Postsecondary Sector
3. Methodology To examine faculty views of WIL, an online survey was conducted of faculty at six colleges and seven universities in Ontario that have partnered with HEQCO in undertaking this research. The 13 partnering institutions included:
• Algonquin College
• George Brown College
• Georgian College
• La Cité collégiale
• Laurentian University
• Niagara College
• Sheridan College
• University of Ottawa
• University of Waterloo
• University of Western Ontario
• University of Windsor
• Wilfrid Laurier University
• York University
Research ethics approval was received from all 13 participating institutions. A census method was used, with all full-time and part-time faculty involved in teaching academic credit courses leading to a certificate, diploma, or undergraduate degree during the 2010-2011 academic year invited to participate. Faculty who only taught at the post-graduate level were excluded, given the focus of the study on certificate, diploma, and undergraduate degree programs. One college chose to invite full-time faculty only.
Invitations were sent to 6,257 college faculty and 11,975 university faculty, for a total of 18,232 faculty invited to participate. Of these, 1,707 college faculty and 1,917 university faculty completed the survey to an acceptable cut-off point, which translates to an overall response rate of 19.9%. Survey response rates for college and university faculty are provided in Table 2.
To assess the representativeness of the respondent sample, population data regarding gender, age and employment status was obtained from the 13 partner colleges and universities for comparison. The gender and age distribution of survey respondents was found to be roughly similar to the gender and age distribution of the faculty population, while full-time faculty were over-represented among survey respondents compared to the overall population.
Table 2 - Population Size, Sample Size and Response Rates
Faculty Population Respondents Response Rate
College 6,257 1,707 27.3%
University 11,975 1,917 16.0%
Total 18,232 3,624 19.9%

16
16 – Faculty Experiences with and Perceptions of Work-Integrated Learning (WIL) in the Ontario Postsecondary Sector
Survey Instrument
The development of the WIL Faculty Survey instrument was informed by the Phase 1 study findings, an extensive review of the academic literature, and input from the Working Group. The instrument was pre-tested online with 25 faculty members known to either Academica Group or HEQCO. This included a mix of both college and university faculty, and pre-testers were from a range of institutions and program areas. For pre-testing, the survey was programmed into Academica Group’s Survey Management System, with open-ended comment boxes added to each screen. Extensive written comments were received during this pre-test phase, which helped to identify wording that needed to be clarified or revised, and enabled improvements to the survey response options to better capture the full range of faculty views and experiences. The feedback was incorporated into the instruments for presentation to the Working Group in December, 2010. A final round of input was received from Working Group members in early January, 2011, and the instrument was finalized by Academica Group in mid-January, 2011.
The final survey instrument included structured and open-ended questions intended to collect attitudinal and perceptual data related to WIL, as well as limited demographic information, and was designed to require roughly 15-20 minutes to complete (see Appendix 2 for the survey instrument).
Procedure
Academica Group’s proprietary Survey Management System™ (SMS™) software was used to program the survey instrument in both English and French and to collect the data. Invitations to participate in the research were sent by the participating institutions in late March and early April, and the survey remained open until May 31, 2011. Each invitation contained a unique log-in ID and password and an embedded link to the survey page to ensure that only individuals invited to participate could complete the survey, and to enable the tracking of survey completion rates. The e-mail invitation outlined the purpose of the research, and the survey landing page provided a printable letter of information. While the survey was in the field, two targeted reminders were sent to faculty who had not participated in the survey, and four of the partner institutions sent a third reminder.
Analysis
A total of 105 surveys were removed from the analysis because respondents did not complete to an acceptable cut-off point. Of the 3,624 surveys retained in the analysis, 3,531 were fully completed. The data was imported into SPSS for analysis, and open-ended responses were manually coded for emerging themes. Responses to the open-ended questions are included in the report only where significant themes were found.
Throughout this report, differences are tested for statistical significance using the Chi-Square for distributions, and Analysis of Variance (ANOVA) or T-test for mean score differences. Effect sizes are provided in the text of the report where relevant.
Limitations
Given that a convenience sample of 13 postsecondary institutions was used, the survey results are not generalizable to faculty views in Ontario. However, an effort was made to involve institutions from a variety of regions in Ontario and to have Francophone perspectives included to ensure that a wide range of faculty views were represented.
Another limitation of the research is that it cannot shed light on faculty views about specific types of WIL. The survey was designed to capture faculty perceptions of the use of work-integrated learning as a general approach to postsecondary education. Thus, throughout the survey, respondents were asked to

17
17 – Faculty Experiences with and Perceptions of Work-Integrated Learning (WIL) in the Ontario Postsecondary Sector
think about WIL generally, rather than to comment on specific types. This necessarily neglected the nuance between the various forms of WIL, and the different ways in which it may be implemented and used by both students and faculty.
Further, all faculty were invited to participate in the survey and offer their perceptions, regardless of whether they had any knowledge or awareness of WIL. The survey responses, therefore, represent a range of views and may include the opinions of faculty with no WIL experience or knowledge. However, the value in capturing these opinions is that it allows for a better understanding of the general climate toward WIL among faculty in postsecondary institutions.

18
18 – Faculty Experiences with and Perceptions of Work-Integrated Learning (WIL) in the Ontario Postsecondary Sector
4. Respondent Profile This chapter summarizes selected characteristics of survey respondents, including breakdowns by institution and employment status, demographic characteristics, postsecondary teaching and other employment experience, and involvement with WIL. Results are reported separately for college and university respondents, with key differences between the two highlighted where applicable.
Institution, Program Area, and Employment Status
Faculty from six colleges and seven universities were invited to participate in the study. As seen in Table 3, over half of the college respondents were from either Sheridan College (29.9%) or Algonquin College (23.1%). University respondents were more evenly distributed among the institutions, though University of Waterloo faculty comprise roughly one-quarter of university respondents.
Table 3 – Institutional Breakdown Count PercentageCollege Algonquin College 395 23.1
Georgian College 246 14.4 Niagara College 268 15.7 George Brown College 192 11.3 Sheridan College 511 29.9 La Cité collégiale 95 5.6
College Total 1707 100.0 University University of Ottawa 191 10.0
The University of Western Ontario 368 19.2 University of Windsor 274 14.3 University of Waterloo 472 24.6 Wilfrid Laurier University 155 8.1 Laurentian University 156 8.1 York University 301 15.7
University Total 1,917 100.0
There was a good distribution of faculty respondents across program areas (Figure 1). About one-quarter of college respondents taught courses in the Social Sciences; 16% taught in each of Business, Arts and Humanities, and Engineering and Technology; and roughly 12% taught in each of Science and Math, and Health. Among university faculty respondents, close to one-third taught in the Social Sciences; just over 20% taught in each of the Arts and Humanities, and Science and Math; and roughly 10% taught courses in Engineering and Technology, Health, and Business.
The University of Waterloo Effect Given that the University of Waterloo (UW) operates the largest postsecondary co-op program in the country, an obvious question is the extent to which the overrepresentation of UW faculty impacts the university findings. Analysis showed that, not surprisingly, UW faculty were significantly more likely to report having taught in a program in which students participate in co-op than other university faculty. Excluding UW respondents, 25.1% of university faculty reported having experience teaching in a co-op program compared to a total of 36.0% when UW respondents are included. Faculty perceptions and experiences were also analyzed both including and excluding UW faculty. While there were some differences between UW faculty and other university faculty respondents, the impact on the combined results were minimal. Therefore, all university results presented in the report include UW respondents.

19 – Faculty E
Figure 1 -
The facultfaculty respartial loathe remai
Figure 2 -
Demogra
As shownuniversity
.0
5.0
10.0
15.0
20.0
25.0
30.0
35.0Pe
r cen
t
0.0
10.0
20.0
30.0
40.0
50.0
60.0
70.0
Per cen
t
Experiences with
- Program Are
ty appointmenspondents head appointmenning 35.7% h
- Employment
aphic Chara
n in Figure 4.3respondents
26.829.7
0
0
0
0
0
0
0
0
Social Scien
5
0
0
0
0
0
0
0
0
and Perceptions
ea
nt status of reeld a full-time nts). Among uaving part-tim
t Status
acteristics
3, the gender s, however, th
16.3
7
7.
nces Busine
2.0
64.3
Full‐time
College
s of Work-Integra
espondents isappointment,university facme status (con
split among cere were sign
12.0
2
2
ss ScienceMat
College
e University
ated Learning (W
s summarized, with the remulty respondentract, sessio
college facultynificantly more
16.0
0.7
e andth
Enginean
Techn
University
48.0
3
Part‐tim
y
WIL) in the Ontari
d in Figure 2. Amainder havingents, 64.3% hnal, or limited
y respondente males (59.6
12.10.5
eeringndnology
He
35.7
e
io Postsecondary
Approximatelg part-time st
held full-time ad term appoin
ts was roughly6%) than fem
616
9.7
ealth ArHum
y Sector
ly half of colletatus (sessionappointmentsntments).
y even. Amonales (40.4%)
6.2
22.2
rts andmanities
19
ege nal or s, with
ng .

20 – Faculty E
0.0
10.0
20.0
30.0
40.0
50.0
Per cen
t
U
0.0
5.0
10.0
15.0
20.0
25.0
30.0
35.0
40.0
45.0
50.0
Per cen
tCollege faAmong coyears or oyears and
Figure 3 –
Experien
Figures 5 general, aat their cuteaching amore yeahad been more than Figure 5 -
Experiences with
19.2
40.1 40
College
Under 40 40‐
47.2
34
0
0
0
0
0
0
0
0
0
0
0
Coll
0‐5 years
aculty respondollege faculty,older. For univd 39.2% were
– Gender
nce
and 6 show fand specificalurrent institutioat their currenrs’ experienceteaching at t
n 15 years.
- Years Teach
and Perceptions
26.0
34
.8
Univ
‐49 50 and O
4.1
18.7
ege
6‐15 years
dents had a s, 19.2% were versity faculty50 or older.
faculty responly at their curon for five yeant institution foe teaching at heir current in
hing at the Cu
s of Work-Integra
4.739.2
versity
Older
38.735.3
26.0
University
16+ years
slightly older aunder 40 yea
y respondents
ndents’ yearsrent institutioars or less, onor more than their current
nstitution for f
urrent Instituti
ated Learning (W
Per cen
t
0
age structure ars of age, 40s, 26.0% were
Figu
s of teaching en. Among colne-third for 6-15 years. Uninstitution, wi
five years or l
ion FigLe
Percen
t
WIL) in the Ontari
49
0.0
10.0
20.0
30.0
40.0
50.0
60.0
70.0
C
than univers0.1% were 40e under 40 ye
ure 4 – Age
experience atllege faculty, -15 years, an
niversity facultith 38.7% of ress, 35.3% fo
gure 6 – Yearevel
3
0.0
10.0
20.0
30.0
40.0
50.0
Per cen
t
0‐5 y
io Postsecondary
9.8 50.2
College
Male Fema
ity responden0-49 years andears of age, 3
t the postsecoalmost half had about one-fty respondentrespondents ror 6-15 years
rs Teaching a
35.439.1
25.4
College
ears 6‐15 y
y Sector
59.6
40.4
University
le
nts (Figure 4)d 40.8% were
34.7% were 40
ondary level iad been teacfifth reported ts had slightlyreporting that and 26.0% fo
at the Postsec
24.4
3
Univ
years 16+ y
20
. e 50 0-49
n ching
y they
or
condary
39.0 36.6
versity
years

21 – Faculty E
In additionother empuniversity their progexperienc
Figure 7 –
WIL Invo
Faculty inas participhad neverstudents pexposure a course, apprenticeparticipateexperiencslightly lowtaught in aexperienc
0.0
5.0
10.0
15.0
20.0
25.0
30.0
35.0
40.0
Per cen
t
Experiences with
n to teaching ployment expefaculty resporam area (Fig
ce outside of t
– Years of Oth
olvement
volvement wipation in WIL r personally taparticipate in to WIL. Thereas well as exeship. Amonge in co-op, 7.8ce teaching inwer levels of an apprenticece.
9
0
0
0
0
0
0
0
0
0
N
and Perceptions
experience, terience relateondents had mgure 7). Over their faculty re
her Related E
ith WIL was cas a student.
aught a coursa co-op or apefore, faculty xperience teacg college facu8% in a progr both co-op aWIL involvem
eship program
.6
28.9
Colle
No experience
s of Work-Integra
the majority oed to the progmore than 10 one-third of u
esponsibilities
Employment E
captured in re. It was theorise with a WIL pprenticeship were asked bching in a pro
ulty, 43.4% haram in which sand apprenticement, with 36.0m, and 6.1% r
30.3 31.
ege
0‐10 years
ated Learning (W
of college facugram in which
ten years of ouniversity facus.
Experience
lation to curreized that the ecomponent bmay be quali
both about thogram of studad experiencestudents parteship program0% having coeporting both
2
s 11‐20 ye
WIL) in the Ontari
ulty respondeh they taught, other employulty responde
ent or past Wexperiences abut taught in aitatively differeir personal e
dy in which stue teaching in aticipate in an ams (Figure 8)o-op teachingh co-op and a
34.6
ears More
io Postsecondary
ents had morewhile only ab
yment experieents had no re
WIL teaching eand perceptioa program of rent than facuexperience teudents particia program in apprenticesh). University fa experience, pprenticeship
38.0
15.1
University
e than 20 years
y Sector
e than 10 yeabout one-quarence related toelated employ
experience, asons of faculty study in whic
ulty who had neaching WIL wipate in a co-owhich studenip, and 11.4%aculty reporte8.2% having
p teaching
12.3
s
rs of rter of o yment
s well who
ch no within op or nts % had ed

22 – Faculty E
Figure 8 -
With regafaculty resinvolved Wparticipate10). Of theplacemen(such as presearch
The structreporting applied re(21.2%).
Figure 9 -
0.05.010.015.020.025.030.035.040.045.050.0
Per cen
t
0.0
10.0
20.0
30.0
40.0
50.0
60.0
70.0
80.0
Per cen
t
Experiences with
- Experience
ard to personaspondents anWIL (Figure 9ed in WIL were 48.5% of co
nts were the mpracticums, cprojects (20.1
ture of univerteaching a co
esearch projec
- Personally T
43.4
3
00000000000
Co‐o
32
0
0
0
0
0
0
0
0
0
C
and Perceptions
Teaching in a
al experience nd almost thre). Faculty whre asked aboollege faculty most commonlinical placem1%), and inter
rsity faculty reourse with a mcts (43.8%), s
Teach a Cours
36.0
op App
.6
18.0
Currently
s of Work-Integra
a Co-op or Ap
teaching a coee-quarters ofo reported cuut the type of who reported
nly reported tyments, or interrnships (15.3
espondents’ emandatory proservice learni
se with a WIL
7.8 8.2
prenticeship
Colle
College
ated Learning (W
pprenticeship
ourse with a Wf university reurrently or pref WIL involvedd currently or ype (63.6%), frnships) (43.1%).
experience waofessional prang (37.1%), f
L Component
11.46.1
Co‐op anApprentices
ege Univers
14.910.9
Previously
University
WIL) in the Ontari
Program
WIL componeespondents haeviously teachd, with multiplpreviously tefollowed by m
1%), service le
as slightly diffactice componfield placemen
31.
1
ndship
sity
io Postsecondary
ent, just over ad never taughing a course le responses
eaching a WILmandatory proearning (23.8
ferent, with ronent (50.4%)nts (36.7%), a
.5
41.4
No
52.5
71.
No
y Sector
half of collegeght a course twhere studeallowed (Figu
L course, fieldofessional pra8%), applied
oughly half , followed by and internship
5.88.2
Not sure
1
22
e that nts ure d actice
ps

23 – Faculty E
Figure 10
To allow fvariable wthey taughwith only oparticularlthis variab
Table 4- R
Multiple ReUnique R
In Figure categoriesexperiencapprenticerelatively course wico-op or awith 40.6%and 29.5%
0.0
10.0
20.0
30.0
40.0
50.0
60.0
70.0
80.0Pe
r cen
t
Experiences with
0 – Type of W
for analysis ofwas created toht or currentlyone type of Wly for internshble (Table 4).
Recoding of T
esponse (n) Responses O
11, faculty ars are meant tce teaching a eship, to havihigh levels ofth a WIL com
apprenticeshi% having no W% teaching a
42.950
0
0
0
0
0
0
0
0
0
MandatProfessioPractic
and Perceptions
WIL
f differences o reflect only y taught more
WIL were retahips and servi
Type of WIL VM
P
Only (n)
e divided intoo reflect varycourse with ang no associaf involvement
mponent and ap program. InWIL involvemcourse with a
63
0.1
toryonalce
Field P
s of Work-Integra
in faculty viewunique respo
e than one typined. This resce learning, w
Variable Mandatory
Professional Practice
606 230
o three mutuaing levels of ia WIL componation with WIwith WIL, wit
an additional on contrast, un
ment, followed a WIL compon
.4
36.7
Placement
College
ated Learning (W
ws by the typeonses to this qpe of WIL wersults in much which limited
Field placements
695 247
ally exclusive gnvolvement wnent, to teachL. Among colth almost halfone-quarter oiversity facultby 29.9% wh
nent.
15.321.0
Internship
University
WIL) in the Ontari
e of WIL in whquestion. Thare excluded asmaller n sizthe analysis t
Internships
233 49
groups basedwith WIL, andhing in a progllege faculty rf of faculty staof faculty repoty were less liho reported te
20.3
43.
Applied ReseProject
io Postsecondary
hich faculty aat is, faculty wand faculty whes for the varthat could be
Applied research projects
395 135
d on their WILd range from hgram that invorespondents tating that theyorting that thekely to report
eaching in a p
23.7
.9
earcht
Service
y Sector
are engaged, who respondedho had experirious types ofconducted u
Service Learning
384 56
L involvementhaving personolves co-op orthere were y had taught aey had taught t WIL involvemprogram with
7
36.9
Learning
23
a d that ence
f WIL, sing
t. The nal r
a in a
ment, WIL

24 – Faculty E
Figure 11
Finally, rewhen theyand 49.1%postsecon
Figure 12
0
10
20
30
40
50
60Pe
r cen
t
0.0
20.0
40.0
60.0
80.0
Per cen
t
Experiences with
– Level of W
espondents wy were a post% of universityndary studies
– Participate
48.6
Teach cours
0
0
0
0
0
and Perceptions
WIL Involveme
ere also asketsecondary sty faculty resp.
ed in WIL as a
29.5
se with WIL Te
Coll
61.049.
Yes
Co
s of Work-Integra
ent
ed whether thudent (Figure
pondents indic
a Postsecond
26.429
each in a prograWIL
ege Univer
1
llege Unive
ated Learning (W
ey had ever pe 12). Sixty-oncated having
dary Student
.9
am with No
rsity
39.0
ersity
WIL) in the Ontari
personally pane per cent ofparticipated i
25.1
40.6
WIL involveme
50.9
No
io Postsecondary
articipated in af college facun WIL during
ent
y Sector
any WIL progulty responden
their own
24
rams nts

25
25 – Faculty Experiences with and Perceptions of Work-Integrated Learning (WIL) in the Ontario Postsecondary Sector
5. Findings Purpose of PSE
Survey respondents were presented with a list of possible purposes for PSE and were asked to rank the extent to which they believed that their teaching was intended to contribute to their students’ knowledge, skills, and personal development in each area. A four point scale was provided, in which 1=Not at all; 2=Very little; 3=Somewhat; and 4=Very much. An open-ended response option was also included to allow respondents to identify additional areas. Table 5 presents the mean score (from 1 to 4) of faculty rankings, as well as the percentage of faculty that considered their teaching to be intended to contribute “very much” to students’ development in that area.
Both college and university faculty viewed contributing to students’ ability to think critically and analytically as a primary purpose of their teaching. This was especially pronounced among university faculty, for whom 90.9% reported that their teaching was “very much” intended to contribute to this aim, compared to 79.6% of college faculty respondents. Among college respondents, acquiring job or work-related knowledge and skills was rated just as highly as thinking critically and analytically, while significantly fewer university faculty reported that their teaching was intended to contribute “very much” to this area (46.3% vs. 80.1% for college faculty). College faculty generally reported higher levels of agreement than university faculty for the importance of job or work-related areas, including securing relevant work after graduation (58.9% vs. 30.1%) and working effectively with others (71.6% vs. 45.5%).
Of the options provided, the lowest level of agreement was in relation to contributing to students’ ability to participate as informed voters in elections, with only 13% of both college and university respondents reporting that their teaching was “very much” intended to contribute to this aim.
Respondents were also provided with a text box to allow for the identification of additional areas in which their teaching was intended to contribute to students’ knowledge, skills, and personal development. Roughly 20% of both college (n=312) and university faculty (n=365) wrote an open-ended response. About one-third of university faculty responses involved references to teaching subject-specific knowledge, such as an understanding of social theory or knowledge of client-centred care (n=111). Another third of responses centred on encouraging engaged citizenship and an understanding of social justice and world issues, with a particular focus on promoting cultural and environmental awareness (n=100). Additional themes that emerged in the open ended responses included teaching students how to conduct and critically analyze research (n=42); engage in creative thinking, such as imaginative problem-solving and developing innovative ideas (n=27); improving communication and literacy skills (n=19); and developing good work habits and learning skills (n=18).
Similar to university faculty, the strongest theme that emerged in the open-ended responses of college faculty was the teaching of subject-specific knowledge (n=91), followed by encouraging engaged citizenship and an understanding of social justice and world issues (n=69); helping students with personal development and self-awareness (n=58); improving communication and literacy skills (n=43); and developing good work habits and study skills, in particular being able to work in teams (n=18).

26
26 – Faculty Experiences with and Perceptions of Work-Integrated Learning (WIL) in the Ontario Postsecondary Sector
Table 5- Purpose of PSE College University Total
Mean % Very Much
Mean % Very Much
Mean % Very Much
Thinking critically and analytically
3.77 79.6 3.89 90.9 3.83 85.6
Applying skills and knowledge in different situations
3.75 77.4 3.61 67.5 3.68 72.1
Working independently 3.66 68.9 3.61 66.3 3.64 67.5 Writing clearly and effectively 3.50 60.2 3.60 68.8 3.55 64.7 Becoming lifelong learners 3.57 64.2 3.51 61.7 3.54 62.9 Acquiring job-related or work-related knowledge and skills
3.76 80.1 3.27 46.3 3.50 62.2
Working effectively with others 3.65 71.6 3.27 45.5 3.45 57.8 Speaking clearly and effectively
3.46 59.4 3.38 54.7 3.42 56.9
Solving complex, real-world problems
3.39 53.7 3.40 54.1 3.40 53.9
Using data to analyze problems
3.21 46.4 3.27 51.3 3.25 49.0
Developing a personal code of ethics and values
3.37 53.5 3.14 41.8 3.25 47.3
Securing relevant work after graduation
3.42 58.9 2.94 30.1 3.17 43.7
Acquiring a broad general education
3.04 30.6 3.21 41.5 3.13 36.3
Understanding themselves 3.26 48.3 3.01 40.0 3.13 43.9 Developing leadership skills 3.12 38.5 2.87 27.9 2.99 32.9 Contributing to the welfare of their community
3.00 35.7 2.94 33.9 2.97 34.7
Using computing and information technology
3.20 44.6 2.74 24.3 2.95 33.9
Understanding people of other racial and ethnic backgrounds
3.05 41.1 2.82 35.6 2.93 38.2
Participating as informed voters in local, provincial and federal elections
2.09 13.7 2.12 13.2 2.11 13.4

27
27 – Faculty Experiences with and Perceptions of Work-Integrated Learning (WIL) in the Ontario Postsecondary Sector
Appropriate Level of WIL
Among survey respondents, there appears to be relatively strong faculty support for the current level of WIL used in postsecondary institutions, with very few respondents indicating that the level of WIL should be decreased (0.8% of college faculty and 4.3% of university faculty) (Table 6). Among college faculty, over half felt that the use of WIL should be increased (55.1%), and one-quarter felt that it should be kept the same (24.7%). There was slightly less support for increasing the use of WIL among university faculty, with less than half of respondents indicating that the level of WIL should be increased (43.8%), and exactly one-quarter feeling it should stay at the same level. A sizeable proportion of both college (19.4%) and university (26.9%) faculty, however, responded that they were not sure.
When faculty views are examined by various faculty characteristics, some interesting differences emerge (Table 6). Level of WIL involvement was significantly related to perceptions of the appropriate level of WIL for both college faculty (χ2=80.027, d.f.=6, p=.000, Cramer's V=.156) and university faculty (χ2= 143.176, d.f.=6, p=.000, Cramer's V=.198), with higher levels of involvement in WIL being associated with stronger support for increasing or maintaining the amount of WIL in postsecondary.
In addition, significant differences among faculty emerged depending on the program area in which they taught (College: χ2= 73.209, d.f.=15, p=.000, Cramer's V=.122; University: χ2=91.848 , d.f.=15, p=.000, Cramer's V=.129). College faculty who teach in Business or Engineering and Technology, and university faculty who teach in Business or Health, were more likely to feel that the level of WIL should be increased. Finally, employment status was also found to be significantly associated with views of the appropriate level of WIL (College: χ2= 21.515, d.f.=3, p=.000, Cramer's V=.114; University: χ2=23.769 , d.f.=3, p=.000, Cramer's V=.114), with full-time college and university faculty being less likely than part-time faculty to report that WIL should be increased and more likely to report that it should be decreased or kept the same.
While age (college only), gender, participating in WIL as a student, and years of other employment experience were also found to be significantly associated with perceptions of the appropriate level of WIL, the effect sizes were negligible indicating that the relationships are very weak. The one exception that should be noted is that there was a higher effect size found for the relationship with having participated in WIL as a student for university faculty (χ2=53.594, d.f.=6, p=.032, Cramer’s V=.171). University faculty who had participated in WIL themselves were more likely to report that the level of WIL in postsecondary should be increased.

28
28 – Faculty Experiences with and Perceptions of Work-Integrated Learning (WIL) in the Ontario Postsecondary Sector
Table 6 - Appropriate Level of WIL by Faculty Characteristics College University
Appropriate level of WIL Appropriate level of WIL
Increased Decreased Kept same
Not sure
Increased Decreased Kept same
Not sure
Total 55.1% 0.8% 24.7% 19.4% 43.8% 4.3% 25.0% 26.9% Employment Status * ^
Full-time 52.0% 1.3% 28.6% 18.1% 40.2% 5.2% 27.6% 27.0% Part-time 58.5% .3% 20.4% 20.9% 50.2% 2.9% 20.2% 26.6%
Gender * ^ Male 58.9% .4% 22.1% 18.6% 43.7% 4.9% 27.0% 24.5% Female 52.0% 1.1% 27.2% 19.7% 45.2% 2.9% 22.1% 29.9%
Age ^ Under 40 53.7% 1.3% 27.0% 18.1% 39.4% 4.3% 23.9% 32.4% 40 to 49 54.9% .6% 24.4% 20.1% 43.6% 4.0% 25.0% 27.3% 50 and Older 56.1% .7% 23.8% 19.4% 46.7% 4.6% 25.8% 22.9%
Participated in WIL as a student * ^
Yes 56.7% .6% 26.0% 16.7% 49.9% 2.1% 26.3% 21.7% No 52.7% 1.1% 22.1% 24.0% 38.0% 6.5% 23.7% 31.7%
Level of WIL Involvement * ^
Teach Course with WIL
56.7% .6% 30.4% 12.2% 58.5% 1.1% 25.9% 14.5%
Teach in Program with WIL
56.9% .9% 21.8% 20.4% 38.4% 5.6% 31.9% 24.1%
No WIL Involvement
51.0% .7% 16.7% 31.6% 37.0% 5.6% 19.2% 38.2%
Years teaching at the postsecondary level
0-5 55.9% .3% 23.3% 20.4% 46.0% 3.4% 22.8% 27.8% 6-15 54.4% 1.1% 25.0% 19.5% 43.6% 4.3% 23.5% 28.6% 16+ 55.0% 1.0% 26.0% 18.0% 42.5% 5.0% 28.1% 24.5%
Other Employment Experience * ^
No experience
48.4% 1.3% 22.6% 27.7% 35.6% 4.9% 24.4% 35.1%
0-10 years 56.4% 1.1% 23.4% 19.1% 44.9% 4.3% 26.0% 24.9% 11-20 years 50.5% .4% 29.0% 20.1% 45.6% 4.3% 27.8% 22.4% More than 20 years
60.6% .8% 22.1% 16.5% 60.9% 3.0% 20.4% 15.7%
Program Area * ^
Social Sciences
51.1% .9% 29.9% 18.1% 44.2% 3.7% 24.4% 27.7%
Business 67.9% 1.5% 14.6% 16.0% 57.0% 5.2% 18.5% 19.3% Science and Math
59.8% .0% 19.1% 21.1% 43.6% 3.9% 28.7% 23.8%
Engineering and Technology
61.2% .0% 24.3% 14.5% 46.9% 1.0% 31.1% 20.9%
Health 48.6% 1.4% 33.8% 16.2% 57.5% 1.7% 23.8% 17.1% Arts and Humanities
45.4% .7% 23.6% 30.3% 31.2% 7.9% 22.4% 38.6%
An * beside the variable label in the column indicates a statistically significant association between the variables (p<.05) for college faculty respondents, an ^ for university faculty respondents.

29
29 – Faculty Experiences with and Perceptions of Work-Integrated Learning (WIL) in the Ontario Postsecondary Sector
Among university respondents there is also a clear relationship between faculty’s view of whether their teaching is intended to contribute to students’ job-related knowledge and skills, and their perception of the appropriate level of WIL in postsecondary education (χ2=109.546, d.f.=9, p=.000, Cramer’s V = .141). Generally, the higher the level of agreement that their teaching was intended to contribute to students’ acquiring job-related skills, the more likely respondents were to feel that WIL should be increased, and the less likely they were to feel that WIL should be decreased (Table 7).
Table 7 - University Faculty, Appropriate Levels of WIL by Teaching Intended to Contribute to Students’ Job-Related Knowledge and Skills
Appropriate levels of WIL
Increased Decreased Kept about the
same Not sure Acquiring job-related or work-related knowledge and skills
Not at all 26.6% 18.8% 25.0% 29.7% Very little 27.9% 7.8% 29.7% 34.7% Somewhat 38.8% 4.8% 25.4% 31.1% Very much 53.4% 2.0% 23.6% 21.1%
Value of WIL
To assess faculty perceptions of the value of WIL, respondents were asked to indicate their level of agreement with a series of statements regarding potential advantages and disadvantages of WIL specific to students, faculty, and institutions, as well as an overarching statement about the general value of WIL.3
Responses to the overarching statement, “I personally think that work-integrated learning is valuable,” indicate that there is a relatively high level of support for WIL, with 95.0% of college faculty and 83.5% of university faculty reporting agreement or strong agreement (Table 8). College faculty were significantly more likely to strongly agree with this statement, with 53.2% of college faculty indicating strong agreement compared to 35.1% of university faculty (χ2=116.206, d.f.=1, p=.000, φ=.182).
Level of involvement with WIL was significantly associated with responses to this statement for both college (χ2=175.840, d.f.=8, p=.000, Cramer’s V = .231) and university faculty (χ2=265.868, d.f.=8, p=.000, Cramer’s V = .269). College faculty who taught a course with WIL agreed or strongly agreed that WIL is valuable (98.1%), compared to 93.3% of those who taught in a WIL program, and 90.8% of those with no WIL involvement. Among university respondents, 95.8% of those who taught a course with a WIL component agreed or strongly agreed, compared to 84.0% of faculty who teach in a program with WIL, and only 74.1% of those with no WIL involvement. For both college and university, faculty with no involvement with WIL were significantly more likely to adopt a neutral position on this statement.
3 Respondents were asked to indicate their level of agreement with each statement using a five-point Likert scale,
coded such that higher scores indicated higher levels of agreement (1=Strongly disagree; 2=Disagree; 3=Neither
agree nor disagree; 4=Agree; 5=Strongly agree).

30
30 – Faculty Experiences with and Perceptions of Work-Integrated Learning (WIL) in the Ontario Postsecondary Sector
Table 8 - Value of WIL by Level of WIL Involvement I personally think that WIL is valuable
Strongly disagree Disagree
Neither agree nor
disagree Agree Strongly
agree
College
Teach Course with WIL
Percentage .4% .0% 1.5% 28.9% 69.2%
Adjusted Residual 1.1 -1.7 -5.7 -10.2 12.5 Teach in program with WIL
Percentage .2% .2% 6.2% 51.2% 42.1%
Adjusted Residual -.1 .2 1.9 4.7 -5.5
No WIL Percentage .0% .5% 8.7% 56.2% 34.6%
Adjusted Residual -1.2 1.7 4.6 6.8 -8.7
Total Percentage .2% .2% 4.6% 41.8% 53.2%
University
Teach Course with WIL
Percentage .2% .6% 3.5% 36.2% 59.6%
Adjusted Residual -2.6 -2.9 -7.9 -6.8 14.2 Teach in program with WIL
Percentage 1.8% 1.8% 12.4% 51.2% 32.9%
Adjusted Residual 1.5 -.6 -.7 1.6 -1.3
No WIL Percentage 1.5% 3.4% 21.0% 55.4% 18.8%
Adjusted Residual 1.0 3.3 8.0 4.9 -12.0
Total Percentage 1.2% 2.1% 13.2% 48.4% 35.1%
Value of WIL for Students
The survey instrument included 16 statements regarding potential advantages and disadvantages of WIL specifically for students, and respondents were asked to indicate their level of agreement with each. A five-point scale (from strongly disagree to strongly agree) was used to capture the level of agreement, and responses were coded such that higher mean scores indicate a higher level of agreement. Overall, college and university faculty indicated higher levels of agreement with statements related to advantages of WIL than statements about disadvantages (Table 9). The highest levels of agreement, as indicated by mean scores, are in relation to labour market advantages such as better understanding of work realities (4.47 college and 4.17 university) and developing employment contacts (4.41 college and 4.14 university). The vast majority of both college and university faculty agreed or strongly agreed that WIL helps students better understand work realities and expectations (95.6% college and 87.4% university), and helps them develop contacts and networks for future employment (94.6% college and 81.6% university). In terms of the other potential advantages of WIL, there were lower levels of agreement that WIL makes students more employable, with 77.1% of college faculty and 67.4% of university faculty agreeing or strongly agreeing with this statement.
Generally, college faculty reported higher levels of agreement with this series of positive statements about the value of WIL than did university faculty, with the largest differences being seen in responses to the following statements: “Work-integrated learning engages students in thinking critically about the workplace and the nature of work” (91.0% college vs. 75.6% university; χ2=147.450, d.f.=1, p=.000, φ = .204); “Participation in work-integrated learning increases students’ engagement in their academic studies” (81.2% college vs. 66.6% university; χ2=95.582, d.f.=1, p=.000, φ = .164); and “Work-integrated learning is particularly valuable for students considered ‘at-risk’” (43.3% college vs. 27.7% university; χ2=93.090, d.f.=1, p=.000, φ = .163).

31
31 – Faculty Experiences with and Perceptions of Work-Integrated Learning (WIL) in the Ontario Postsecondary Sector
There appeared to be some scepticism among faculty about employers’ motivations for supplying WIL opportunities, with almost one-quarter of both college and university respondents agreeing or strongly agreeing that “Too many employers use work-integrated learning simply to reduce their salary costs,” and roughly half of respondents remaining neutral. The majority of college and university faculty were also ambivalent about the existence of evidence on the relationship between student learning and WIL, with 54.8% of college faculty and 59.9% of university faculty neither agreeing nor disagreeing with the statement, “There is a lack of evidence about the impact of WIL on student learning.”
The lowest levels of agreement were found for statements about potential disadvantages of WIL. In particular, college and university faculty tended to disagree with the statement that “WIL does little to improve students’ understanding of academic course content” (college mean = 1.93, university mean = 2.28).
Provided with the opportunity to identify additional advantages or disadvantages of WIL for students, roughly 20% of both college (n=372) and university faculty (n=388) wrote responses. Over half of college faculty’s responses reinforced or expanded on the statements provided. This included reinforcing that WIL helps students better understand work realities (n=52), develop contacts for future employment (n=40), and apply classroom theories and skills (n=29). New themes that emerged in the open-ended responses included the perception that WIL increases students’ self-awareness (n=38); students sometimes find the work unsatisfying or have a negative experience with a work supervisor (n=36); WIL helps students improve their work and study skills (n=29); students sometimes have difficulty finding meaningful placements when they are relied upon to find their own site (n=23); and that students can have a difficult time balancing the time required to participate in WIL with class work, particularly for students who already have a job outside of WIL (n=21). Twenty-five respondents emphasized that the advantages and disadvantages of WIL vary depending on the type, the quality of the placement site, and how the program is run.
Among university faculty, about one-third of the open-ended responses reinforced or expanded on the statements given (n=119), with most reinforcing statements about the advantages of WIL such as the fact that it helps students to engage in their academic studies (n=27), understand work realities (n=23), and apply classroom theories and skills (n=20). Other themes that emerged were that WIL sometimes offers financial advantages to students in the form of paid placements (n=33), enhances personal development (n=33), can be disruptive to students’ academic progress (n=30), and is disadvantageous to students because it focuses on job training rather than engaging in critical thought (n=30). Forty-eight respondents used the open-ended comment box to emphasize that the advantages and disadvantages of WIL vary greatly depending on the type of WIL, the quality of the placement site, and how the program is run.

32
32 – Faculty Experiences with and Perceptions of Work-Integrated Learning (WIL) in the Ontario Postsecondary Sector
Table 9 - Mean Scores and % Agree & Strongly Agree for Value of WIL to Students Statements
College University
Mean Agree or Strongly
Agree Mean
Agree orStrongly
Agree WIL helps students better understand work realities and expectations 4.47 (.62) 95.6% 4.17 (.72) 87.4%
WIL helps students develop contacts and networks for future employment 4.41 (.62) 94.6% 4.14 (.72) 84.9%
WIL lets students apply the theory and skills learned in the classroom 4.45 (.64) 94.1% 4.08 (.79) 81.6%
Participating in WIL increases students’ self-confidence 4.42 (.62) 94.0% 4.09 (.74) 80.5% WIL enhances the postsecondary experience for students 4.36 (.65) 92.8% 4.06 (.78) 81.0% WIL lets students explore their career interests and clarify their career goals 4.27 (.64) 92.4% 4.05 (.73) 82.3%
WIL engages students in thinking critically about the workplace and the nature of work 4.32 (.68) 91.0% 3.93 (.85) 75.6%
Students who participate in WIL are more employable than other students 4.13 (.84) 77.1% 3.85 (.91) 67.4%
Participation in WIL increases students’ engagement in their academic studies 4.11 (.79) 81.2% 3.80 (.86) 66.6%
WIL is particularly valuable for students considered “at-risk" 3.40 (.95) 43.3% 3.19 (.81) 27.7%
Too many employers use WIL simply to reduce their salary costs 2.86 (.96) 22.2% 2.93 (.95) 22.2%
There is a lack of evidence about the impact of WIL on student learning 2.73 (.86) 12.0% 2.88 (.82) 15.6%
The costs to students (both financial and time required) outweigh the benefits of WIL 2.46 (1.21) 20.5% 2.51 (1.11) 17.2%
Employers, not students, are the main beneficiaries of WIL programs 2.25 (.85) 6.2% 2.50 (.90) 9.5%
WIL is only useful for students who go directly to the labour market after their postsecondary education 2.29 (.99) 11.4% 2.37 (.98) 12.2%
WIL does little to improve students’ understanding of academic course content 1.93 (.96) 8.1% 2.28 (1.02) 12.5%
Value of WIL for Faculty and Institutions
Survey respondents were also asked to reflect on the advantages and disadvantages that WIL offers to faculty and postsecondary institutions. Table 10 lists each of the statements with the mean score, standard deviation and the percentage who agreed or strongly agreed.
Generally, faculty respondents had higher levels of agreement with statements related to advantages than disadvantages, though in comparison to the mean scores for statements in Table 9, it is clear that faculty tend to view WIL as being more beneficial for students than for faculty or institutions. University faculty tend to be less enthusiastic about the benefits of WIL, with many of the mean scores for statements about potential advantages in the 3.0 to 3.5 range, with 3 indicating a neutral response (neither disagree or agree with the statement). The highest level of agreement among both college and university faculty was with the statement, “Work-integrated learning strengthens links between the institution and the business community” (4.28 college, 3.95 university).
Close to half of college faculty and over one-third of university faculty agreed or strongly agreed that WIL perpetuates a business model of education, while only 11.5% of college faculty felt that WIL has a negative overall impact on postsecondary education due to the extension of corporate involvement in

33
33 – Faculty Experiences with and Perceptions of Work-Integrated Learning (WIL) in the Ontario Postsecondary Sector
curriculum, compared to nearly one-quarter of university faculty who neither agreed nor disagreed with this statement (22.9%).
The largest differences between college and university faculty were found in relation to statements about the potential advantages of WIL for faculty. College faculty were significantly more likely than university faculty to agree or strongly agree that “involvement with work-integrated learning helps faculty keep their knowledge current” (83.7% college vs. 54.3% university; χ2=348.101, d.f.=1, p=.000, φ= .315), and that “feedback from students and employers who participate in WIL can improve academic programming” (89.5% college vs. 67.6% university; χ2=243.428, d.f.=1, p=.000, φ = .264).
There were very few open-ended responses about additional advantages or disadvantages of WIL for institutions or faculty (college n=107; university n=79). Most of the responses simply reinforced the statements provided, and no new significant themes emerged.
Table 10 - Mean Scores and % Agree & Strongly Agree for Value of WIL to Faculty and Institutions Statements
College University
Mean Agree or Strongly
Agree Mean
Agree orStrongly
Agree WIL strengthens links between the institution and the business community
4.28 (.68) 90.3% 3.95
(.74) 76.9%
WIL connects postsecondary institutions to the broader community
4.19 (.67) 88.1% 3.94
(.77) 77.9%
Feedback from students and employers who participate in WIL can improve academic programming
4.29 (.68) 89.5% 3.77
(.88) 67.6%
WIL is an effective postsecondary education recruitment and marketing tool
4.04 (.74) 79.1% 3.83
(.78) 69.1%
WIL can engage postsecondary institutions in responding to identified community needs
4.04 (.73) 80.2% 3.75
(.83) 65.6%
Involvement with WIL helps faculty keep their knowledge current
4.17 (.78) 83.7% 3.53
(1.00) 54.3%
WIL enhances institutional reputation 3.99 (.77) 75.9% 3.64
(.88) 58.9%
WIL can help businesses find solutions to specific business or industry needs
3.74 (.82) 62.9% 3.50
(.83) 49.9%
WIL can involve postsecondary institutions in addressing global issues
3.64 (.86) 53.8% 3.46
(.92) 49.2%
WIL perpetuates a business model for postsecondary education
3.48 (.86) 46.3% 3.23
(.92) 35.3%
My institution provides resources and supports for faculty to participate in WIL activities
3.24 (.89) 35.7% 3.16
(.88) 30.9%
WIL diverts funding away from program areas that may not lend themselves to WIL
2.75 (.85) 12.8% 3.09
(.96) 28.3%
By extending corporate involvement in curriculum, WIL has a negative overall impact on postsecondary education
2.35 (.99) 11.5% 2.81
(1.07) 22.9%
WIL is inconsistent with the values of a liberal education 2.56 (1.12) 19.0% 2.49
(1.04) 16.0%
Given that a lack of institutional resources and supports is identified in the literature as a significant barrier to WIL, responses to the statement “My institution provides resources and supports for faculty to participate in WIL activities” is of particular interest. Responses to this statement were significantly associated with level of WIL involvement for both college (χ2=201.920, d.f.=8, p=.000, Cramer’s V = .249)

34
34 – Faculty Experiences with and Perceptions of Work-Integrated Learning (WIL) in the Ontario Postsecondary Sector
and university (χ2=177.859, d.f.=8, p=.000,Cramer’s V = .221) faculty. Looking specifically at faculty who taught a course with a WIL component, close to half of both college and university respondents agreed or strongly agreed with this statement (approximately 20.0% disagreed or strongly disagreed) (Table 11). Analysis of the adjusted residuals shows that as the level of WIL involvement decreases, faculty tend to adopt a more ambivalent position, neither agreeing nor disagreeing with the statement, suggesting that faculty who are not directly involved with WIL likely do not have a good sense of the resources and supports available and their adequacy.
Table 11 - Institutional Support by Level of WIL Involvement
My institution provides resources and supports for
faculty to participate in WIL activities
Strongly disagree Disagree
Neither agree nor
disagree Agree Strongly
agree
College
Teach Course with WIL
Percentage 4.6% 15.4% 32.3% 37.2% 10.5%
Adjusted Residual 1.4 4.8 -12.9 7.9 4.1 Teach in
program with WIL
Percentage 3.4% 11.8% 55.3% 22.4% 7.0%
Adjusted Residual -.7 .3 3.1 -3.1 -.6
No WIL Percentage 3.2% 3.4% 73.8% 16.7% 2.9%
Adjusted Residual -.9 -5.9 11.6 -5.9 -4.1
University
Teach Course with WIL
Percentage 6.9% 13.6% 33.1% 35.0% 11.4%
Adjusted Residual 2.8 2.0 -11.1 6.6 6.1 Teach in
program with WIL
Percentage 3.2% 9.9% 53.2% 27.2% 6.5%
Adjusted Residual -2.0 -1.3 .1 1.6 .4
No WIL Percentage 4.3% 10.8% 67.8% 15.2% 1.9%
Adjusted Residual -.7 -.6 10.2 -7.6 -6.1
Value of WIL by Faculty Characteristics
One of the research questions to be addressed by this study was the extent to which faculty views about WIL differ by various characteristics and experiences. To answer this question, multivariate GLM analysis was performed using an index measuring the perceived value of WIL. The index was constructed by combining responses to 24 five-point Likert scale questions (α=.936) that focused on the perceived advantages and disadvantages of WIL for students, faculty, or institutions. Higher scores indicate stronger agreement that WIL is valuable.4 Missing values were imputed with the mean of the variable. Independent variables explored included gender, past WIL experience as a student, level of WIL involvement, program, employment status, age, and previous employment experience. Separate analyses were run for college and university faculty.
4 See Appendix 3 for the items included in the index and their range, mean, and standard deviation.

35
35 – Faculty Experiences with and Perceptions of Work-Integrated Learning (WIL) in the Ontario Postsecondary Sector
Table 12 presents the regression results for college faculty. The model was statistically significant (F=17.654, p=.000), predicting 13.5% of the variance in the value of WIL index. Of the seven independent variables included in the model, four were found to be statistically significant after controlling for the other variables. Female faculty members and faculty who participated in WIL when they were students viewed WIL as providing greater value. Level of WIL involvement and program area were also significant predictors of the perceived value of WIL. Compared to faculty who had no involvement with WIL, faculty who taught in a WIL program or taught a course with a WIL component felt WIL was more valuable. Compared to faculty who taught in Arts and Humanities, faculty who taught in Social Science, Health, or Business programs had higher mean scores on the value of WIL index. Age, years of other employment experience, and employment status were not statistically significant predictors.
Table 12 - Coefficients from Linear Regression of Predictor Variables on Value of WIL Index for College Faculty
B Std. Error t Sig.
Intercept 91.126 .964 94.500 .000Employment Status Full-time .430 .541 .796 .426
Part-time 0a . . . Gender* Male -1.831 .562 -3.255 .001
Female 0a . . . Participated in WIL as a student* Yes 3.722 .556 6.697 .000
No 0a . . . Level of WIL involvement* Teach course with WIL 6.401 .672 9.525 .000
Teach in program with WIL 2.708 .725 3.736 .000No WIL 0a . . .
Years of other employment experience
No experience -1.247 .989 -1.260 .2080-10 years -1.422 .746 -1.906 .05711-20 years -1.252 .684 -1.831 .067More than 20 years 0a . . .
Age Under 40 -.257 .794 -.323 .74740-49 -1.033 .579 -1.784 .07550 and older 0a . . .
Program Area* Social Sciences 2.678 .825 3.247 .001Business 2.257 .913 2.471 .014Science and Math 1.859 .989 1.879 .060Engineering and Technology
1.061 .934 1.135 .256
Health 2.681 1.019 2.631 .009Arts and Humanities 0a . . .
* Indicates a statistically significant finding in the test of between-subjects effects (p<.05).
The second regression model examines the relationship between the same set of predictor variables on the value of WIL index, this time focusing on university faculty (Table 13). The model was statistically significant (f=35.630, p=.000), predicting 22.6% of the variance in the value of WIL index. In this model, of the seven independent variables included, six variables were found to be statistically significant after controlling for the other variables. Females and part-time faculty had more positive attitudes than males and full-time faculty. Faculty who had participated in WIL as a student perceived WIL to be of greater

36
36 – Faculty Experiences with and Perceptions of Work-Integrated Learning (WIL) in the Ontario Postsecondary Sector
value. Level of involvement in WIL was again a significant predictor, with faculty who taught a course with a WIL component, and those who taught in a WIL program holding more positive views than those who had no WIL involvement.
Compared to faculty with more than 20 years of other employment experience, those with no other employment experience, 0-10 years or 11-20 years all held less positive views about WIL. Finally, compared to faculty in the Arts and Humanities, faculty who taught in all other program areas (Social Sciences, Business, Science and Math, Engineering and Technology, and Health) held more positive views about WIL. The most positive views were among faculty who taught in Business, Engineering and Technology, or Health programs. Age was not found to be a significant predictor.
Table 13- Coefficients from Linear Regression of Predictor Variables on Value of WIL Index for University Faculty
B Std. Error t Sig.
Intercept 88.323 1.106 79.841 .000Employment Status* Full-time -2.507 .627 -3.995 .000
Part-time 0a . . . Gender* Male -3.334 .596 -5.593 .000
Female 0a . . . Participated in WIL as a student* Yes 2.853 .602 4.743 .000
No 0a . . . Level of WIL involvement* Teach course with WIL 9.519 .735 12.957 .000
Teach in program with WIL
3.847 .694 5.543 .000
No WIL 0a . . . Years of other employment experience*
No experience -4.278 1.049 -4.078 .0000-10 years -2.701 1.011 -2.671 .00811-20 years -2.818 1.093 -2.579 .010More than 20 years 0a . . .
Age Under 40 -.825 .774 -1.066 .28740-49 -.427 .665 -.642 .52150 and older 0a . . .
Program Area* Social Sciences 2.204 .789 2.793 .005Business 8.040 1.197 6.720 .000Science and Math 3.661 .878 4.169 .000Engineering and Technology
5.541 1.120 4.950 .000
Health 5.146 1.108 4.644 .000Arts and Humanities 0a . . .
* Indicates a statistically significant finding in the test of between-subjects effects (p<.05).
Challenges
In interviews conducted in 2009, during Phase 1 of the broader WIL project, key informants from Ontario colleges and universities highlighted a number of challenges facing faculty in delivering WIL programs.

37
37 – Faculty Experiences with and Perceptions of Work-Integrated Learning (WIL) in the Ontario Postsecondary Sector
The faculty survey provided an opportunity to explore these issues further, examining what faculty perceive to be the primary challenges, and how these might vary by program or type of WIL.
Overall, ensuring quality placements for students was the most frequently selected challenge among both college (76.0%) and university (68.7%) respondents, followed by finding enough placements for students (72.7% college and 61.9% university) (Table 14). Concerns about faculty workload also emerged as prominent challenges, with over half of both college and university faculty selecting “managing WIL with large class sizes” (66.4% college and 55.1% university) and “balancing WIL with academic workloads” (54.6% college and 52.8% university). The largest difference found between college and university faculty was that college faculty were significantly more likely to report a lack of faculty PD on implementing WIL as a key concern (32.8% vs. 19.1%, χ2=87.038, d.f.=1, p=.000, φ= .157 ).
Although lack of faculty recognition and reward was highlighted as a deterrent to faculty involvement in WIL in the background literature (e.g. Brewer & Gray, 1999; Emslie, 2011; McKay & Rozee, 2004), challenges related to this theme did not emerge prominently in the survey findings. Lack of institutional culture supporting WIL (21.3% college and 23.3% university), lack of recognition for WIL activities in faculty promotion decisions (14.6% college and 20.1% university), and lack of institutional recognition for WIL activities (14.4% college and 20.4% university) were the three least selected challenges for both college and university faculty in this survey. On the other hand, a greater proportion of university faculty than college faculty selected each of these, which may be connected to the “publish or perish” culture of universities that Emslie (2011) describes as a barrier to faculty involvement in WIL. College faculty, however, were more concerned with the lack of salary recognition for faculty who participate in WIL (33.6% of college faculty compared to 25.9% of university faculty).
For faculty who taught a course with a WIL component, differences in faculty views were also examined by the type of WIL (Tables 11 and 12). It is important to note that faculty were not asked to reflect on the specific type of WIL taught when identifying challenges, so these results cannot be interpreted as reflecting differences in the challenges associated with each type of WIL, only differences in views by faculty who teach various forms of WIL. Among college faculty, the only challenges found to be significantly associated with type of WIL were “lack of financial and administrative resources for faculty” (χ2=21.230, d.f.=4, p=.000, Cramer’s V= .220), “lack of institutional service recognition for WIL activities” (χ2=13.577, d.f.=4, p=.009, Cramer’s V= .176), and “lack of institutional culture supporting WIL” (χ2=11.772, d.f.=4, p=.019, Cramer’s V= .164). Analysis of the adjusted residuals showed that in all three cases faculty who taught a course with an applied research project were significantly more likely to select these as key challenges than faculty involved with other types of WIL.

38
38 – Faculty Experiences with and Perceptions of Work-Integrated Learning (WIL) in the Ontario Postsecondary Sector
Among university faculty, the only significant association with type of WIL was with “finding enough placements for students” (χ2=10.006, d.f.=4, p=.040, Cramer’s V= .195). Analysis of the adjusted residuals showed that university faculty who taught a course with a mandatory professional practice component were significantly more likely, and faculty who taught a course with an applied research project were significantly less likely, to view finding enough placements for students as a challenge (78.8% and 57.9% vs 60.0% and 70.6%).5
Table 14 – Challenges Associated with WIL
College or University College University Total
Ensuring quality placements for students 76.0% 68.7% 72.1% Finding enough placements for students 72.7% 61.9% 67.0%
Managing WIL with large class sizes 66.4% 55.1% 60.4% Balancing WIL with academic workloads 54.6% 52.8% 53.7% Lack of financial and administrative resources for faculty 44.7% 44.3% 44.5%
Developing appropriate WIL curriculum 44.2% 42.9% 43.5% Managing employer expectations/communication 48.5% 37.7% 42.8%
Managing student expectations/communication 42.5% 34.5% 38.3%
Integrating the work experience with classroom learning 33.2% 37.6% 35.5%
Providing adequate institutional supports for students 34.4% 35.9% 35.2%
Developing valid student assessment and evaluation tools 33.9% 34.1% 34.0%
Making WIL programs accessible to all students 32.0% 27.9% 29.8%
Lack of salary recognition for faculty who participate in WIL 33.6% 25.9% 29.5%
Lack of faculty PD on implementing WIL 32.8% 19.1% 25.6% Lack of institutional culture supporting WIL 21.3% 23.3% 22.4% Lack of institutional service recognition for WIL activities 14.4% 20.4% 17.6%
Lack of recognition for WIL activities in promotion decisions 14.6% 20.1% 17.5%
5 The lack of significant findings among both college and university faculty is likely due in part to small n sizes across
the different types of WIL.
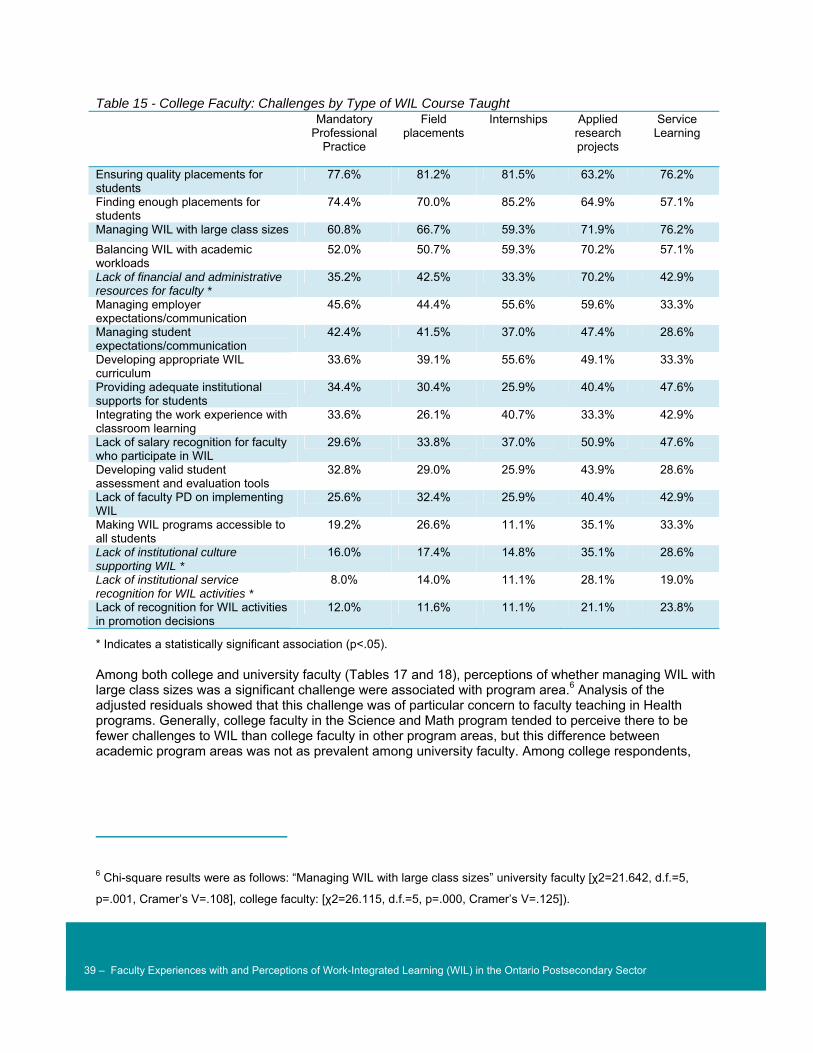
39
39 – Faculty Experiences with and Perceptions of Work-Integrated Learning (WIL) in the Ontario Postsecondary Sector
Table 15 - College Faculty: Challenges by Type of WIL Course Taught Mandatory
Professional Practice
Field placements
Internships Applied research projects
Service Learning
Ensuring quality placements for students
77.6% 81.2% 81.5% 63.2% 76.2%
Finding enough placements for students
74.4% 70.0% 85.2% 64.9% 57.1%
Managing WIL with large class sizes 60.8% 66.7% 59.3% 71.9% 76.2%
Balancing WIL with academic workloads
52.0% 50.7% 59.3% 70.2% 57.1%
Lack of financial and administrative resources for faculty *
35.2% 42.5% 33.3% 70.2% 42.9%
Managing employer expectations/communication
45.6% 44.4% 55.6% 59.6% 33.3%
Managing student expectations/communication
42.4% 41.5% 37.0% 47.4% 28.6%
Developing appropriate WIL curriculum
33.6% 39.1% 55.6% 49.1% 33.3%
Providing adequate institutional supports for students
34.4% 30.4% 25.9% 40.4% 47.6%
Integrating the work experience with classroom learning
33.6% 26.1% 40.7% 33.3% 42.9%
Lack of salary recognition for faculty who participate in WIL
29.6% 33.8% 37.0% 50.9% 47.6%
Developing valid student assessment and evaluation tools
32.8% 29.0% 25.9% 43.9% 28.6%
Lack of faculty PD on implementing WIL
25.6% 32.4% 25.9% 40.4% 42.9%
Making WIL programs accessible to all students
19.2% 26.6% 11.1% 35.1% 33.3%
Lack of institutional culture supporting WIL *
16.0% 17.4% 14.8% 35.1% 28.6%
Lack of institutional service recognition for WIL activities *
8.0% 14.0% 11.1% 28.1% 19.0%
Lack of recognition for WIL activities in promotion decisions
12.0% 11.6% 11.1% 21.1% 23.8%
* Indicates a statistically significant association (p<.05).
Among both college and university faculty (Tables 17 and 18), perceptions of whether managing WIL with large class sizes was a significant challenge were associated with program area.6 Analysis of the adjusted residuals showed that this challenge was of particular concern to faculty teaching in Health programs. Generally, college faculty in the Science and Math program tended to perceive there to be fewer challenges to WIL than college faculty in other program areas, but this difference between academic program areas was not as prevalent among university faculty. Among college respondents,
6 Chi-square results were as follows: “Managing WIL with large class sizes” university faculty [χ2=21.642, d.f.=5,
p=.001, Cramer’s V=.108], college faculty: [χ2=26.115, d.f.=5, p=.000, Cramer’s V=.125]).

40
40 – Faculty Experiences with and Perceptions of Work-Integrated Learning (WIL) in the Ontario Postsecondary Sector
Health faculty were also significantly more likely to select “ensuring quality placements for students” as a challenge (83.9% vs. 69.7% to 78.8%).7
Table 16 - University Faculty; Challenges by Type of WIL Course Taught Mandatory
Professional Practice
Field placements
Internships Applied research projects
Service Learning
Ensuring quality placements for students
75.8% 85.3% 60.0% 69.7% 65.7%
Finding enough placements for students *
78.8% 70.6% 60.0% 57.9% 62.9%
Managing WIL with large class sizes 56.6% 47.1% 55.0% 68.4% 71.4%
Balancing WIL with academic workloads
50.5% 41.2% 30.0% 53.9% 45.7%
Lack of financial and administrative resources for faculty
43.4% 41.2% 45.0% 56.6% 45.7%
Managing employer expectations/communication
41.4% 35.3% 70.0% 34.2% 34.3%
Managing student expectations/communication
39.4% 38.2% 60.0% 26.3% 34.3%
Developing appropriate WIL curriculum
37.4% 23.5% 25.0% 47.4% 45.7%
Providing adequate institutional supports for students
47.5% 47.1% 50.0% 32.9% 40.0%
Integrating the work experience with classroom learning
39.4% 29.4% 30.0% 34.2% 37.1%
Lack of salary recognition for faculty who participate in WIL
26.3% 23.5% 40.0% 25.0% 34.3%
Developing valid student assessment and evaluation tools
32.3% 26.5% 35.0% 28.9% 48.6%
Lack of faculty PD on implementing WIL
18.2% 17.6% 15.0% 19.7% 22.9%
Making WIL programs accessible to all students
28.3% 11.8% 30.0% 22.4% 34.3%
Lack of institutional culture supporting WIL
21.2% 8.8% 15.0% 23.7% 31.4%
Lack of institutional service recognition for WIL activities
26.3% 17.6% 30.0% 26.3% 31.4%
Lack of recognition for WIL activities in promotion decisions
23.2% 8.8% 20.0% 28.9% 20.0%
* Indicates a statistically significant association (p<.05).
For university respondents, faculty from Health and Arts and Humanities were more likely to report that lack of salary recognition for faculty who participate in WIL was a significant challenge (32.4% and 32.2% vs. 19.1% to 27.5% for other program areas). Arts and Humanities faculty were also significantly more likely to view balancing WIL with academic workloads (61.2% vs. 42.8% to 52.1%), and lack of faculty professional development on implementing WIL, as significant challenges. Health faculty were more likely
7 Chi-square results: [χ2=17.638, d.f.=5, p=.003, Cramer’s V=.103].

41
41 – Faculty Experiences with and Perceptions of Work-Integrated Learning (WIL) in the Ontario Postsecondary Sector
to view finding enough placements for students (77.8% vs 55.4% to 64.8%), and lack of institutional service recognition for WIL activities (28.1% vs. 14.0% to 25.4%), as key challenges.8
Table 17 - College Faculty: Challenges by Program Area Social
Sciences Business Science
and Math Engineering
and Technology
Health Arts and Humanities
Ensuring quality placements for students *
78.8% 73.1% 69.7% 71.9% 83.9% 77.7%
Finding enough placements for students *
71.7% 72.3% 68.7% 73.8% 82.9% 69.6%
Managing WIL with large class sizes *
68.5% 64.9% 54.0% 65.0% 77.3% 65.6%
Balancing WIL with academic workloads
52.9% 55.4% 50.0% 53.2% 56.9% 59.7%
Managing employer expectations/communication
48.4% 51.7% 41.9% 47.1% 50.2% 49.8%
Lack of financial and administrative resources for faculty
42.0% 52.0% 38.9% 45.6% 44.1% 46.2%
Developing appropriate WIL curriculum
44.0% 42.4% 47.5% 46.4% 35.5% 48.7%
Managing student expectations/communication *
45.8% 47.2% 29.8% 37.6% 41.7% 47.3%
Providing adequate institutional supports for students *
39.5% 33.2% 26.3% 27.0% 38.9% 37.0%
Developing valid student assessment and evaluation tools
37.1% 28.4% 32.3% 31.2% 38.4% 34.8%
Lack of salary recognition for faculty who participate in WIL
31.0% 38.4% 26.3% 33.5% 34.1% 37.7%
Integrating the work experience with classroom learning
31.5% 36.9% 34.8% 30.8% 34.1% 32.6%
Lack of faculty PD on implementing WIL
33.0% 33.2% 27.3% 34.6% 31.8% 35.2%
Making WIL programs accessible to all students
32.6% 34.3% 29.8% 31.6% 26.1% 35.9%
Lack of institutional culture supporting WIL
21.4% 26.2% 15.2% 24.0% 18.0% 20.9%
Lack of recognition for WIL activities in promotion decisions
15.6% 14.0% 9.1% 15.2% 17.5% 14.7%
Lack of institutional service recognition for WIL activities
15.0% 17.0% 10.6% 13.7% 14.2% 14.7%
* Indicates a statistically significant association (p<.05). Only significant findings with an effect size (Cramer’s V) greater than 0.10 are discussed in the text.
8 Chi-square results were as follows: “Lack of salary recognition for faculty who participate in WIL” (χ2=23.931, d.f.=5,
p=.000, Cramer’s V=.113); “Balancing WIL with academic workloads” (χ2=19.307, d.f.=5, p=.102, Cramer’s V=.102);
“Lack of faculty PD on implementing WIL University” (χ2=23.163, d.f.=5, p=.000, Cramer’s V=.111). “Finding enough
placements for students” [χ2=30.498, d.f.=5, p=.000, Cramer’s V=.128)]; “Lack of institutional service recognition for
WIL (χ2=20.342, d.f.=5, p=.001, Cramer’s V=.104).

42
42 – Faculty Experiences with and Perceptions of Work-Integrated Learning (WIL) in the Ontario Postsecondary Sector
Table 18 - University Faculty: Challenges by Program Area Social
Sciences Business Science
and Math Engineering
and Technology
Health Arts and Humanities
Ensuring quality placements for students *
67.9% 68.8% 66.1% 65.0% 80.0% 69.0%
Finding enough placements for students *
61.6% 59.4% 64.8% 57.9% 77.8% 55.4%
Managing WIL with large class sizes *
54.6% 57.2% 50.5% 54.8% 70.3% 52.9%
Balancing WIL with academic workloads *
52.1% 42.8% 51.8% 48.7% 50.3% 61.2%
Lack of financial and administrative resources for faculty
46.8% 42.8% 40.8% 37.6% 50.3% 45.4%
Developing appropriate WIL curriculum *
43.7% 36.2% 38.5% 42.6% 42.2% 48.8%
Managing employer expectations/communication *
36.6% 44.2% 31.9% 41.1% 37.3% 41.2%
Integrating the work experience with classroom learning *
37.2% 29.7% 32.9% 43.1% 34.6% 43.9%
Providing adequate institutional supports for students *
39.7% 32.6% 27.3% 32.5% 42.2% 39.0%
Managing student expectations/communication
33.9% 40.6% 29.1% 35.5% 35.7% 37.3%
Developing valid student assessment and evaluation tools *
33.0% 33.3% 27.3% 33.0% 39.5% 40.5%
Making WIL programs accessible to all students *
30.6% 26.1% 23.2% 23.4% 28.6% 30.7%
Lack of salary recognition for faculty who participate in WIL *
24.2% 27.5% 19.1% 22.8% 32.4% 32.2%
Lack of institutional culture supporting WIL
24.2% 23.2% 19.4% 19.3% 29.7% 24.9%
Lack of institutional service recognition for WIL activities *
20.8% 25.4% 14.0% 17.8% 28.1% 22.2%
Lack of recognition for WIL activities in promotion decisions
20.8% 24.6% 16.3% 21.8% 24.3% 18.5%
Lack of faculty PD on implementing WIL *
19.5% 25.4% 12.2% 15.7% 21.6% 23.7%
* Indicates a statistically significant association (p<.05). Only significant findings with an effect size (Cramer’s V) greater than 0.10 are discussed in the text.
Just over 100 university faculty and 57 college faculty offered open-ended responses about additional challenges to implementing WIL. The most frequently cited challenge in the open-ended responses was ensuring that placements foster critical learning rather than merely job training (n=22), followed by concern over the potential for unethical corporate interference (n=11). Additional challenges, noted by five or less respondents, included dealing with resistance to WIL among colleagues, that many placements do not offer pay for students, and that community groups and other non-profit organizations are often not recognized as valuable partners in providing WIL opportunities for students.
Among college faculty respondents, the open-ended comments tended to reinforce challenges already identified in the survey, particularly around finding enough placements for students, and making WIL accessible for all students regardless of financial or language barriers. New themes that emerged, though each was noted by less than 10 respondents, included the risk of poor-performing students reflecting

43
43 – Faculty Experiences with and Perceptions of Work-Integrated Learning (WIL) in the Ontario Postsecondary Sector
badly on the institution, difficulties dealing with Workplace Safety and Insurance Board (WSIB) issues, and ensuring that students get the most out of the placement experience.
Workload Issues
The management of administrative tasks related to the development and delivery of WIL programs can be a significant challenge to providing WIL opportunities for students (Sattler, 2011). To explore this issue, respondents who taught a course in which students participate in WIL were asked about the extent to which they performed 17 different activities that may impact their workload. For each activity performed, respondents were asked to indicate whether they performed the activity in addition to or as part of their regular duties.
As seen in Table 19, there are a large number of workload tasks involved in administering WIL. Roughly half of respondents reported performing 11 or more of the workload activities, while only about 5% of respondents reported that they did not perform any. For most faculty, however, the majority of these tasks were completed as part of their regular duties. Roughly one-fifth of respondents reported that they typically perform 6 or more of the workload activities in addition to their regular duties, and over a third reported performing one to five of these on top of their regular duties.
Table 19- Number of Workload Tasks Typically Completed
College or University College University Total
Workload Tasks Completed
None 5.1% 2.6% 4.1% 1-5 16.9% 19.2% 17.8% 6-10 22.7% 31.5% 26.3% 11 or more 55.3% 46.8% 51.8%
Completed as Part of Regular Duties
None 11.7% 13.4% 12.4% 1-5 29.4% 27.3% 28.5% 6 or more 58.9% 59.3% 59.1%
Completed in Addition to Regular Duties
None 37.5% 43.1% 39.8% 1-5 40.1% 35.9% 38.4% 6 or more 22.4% 21.0% 21.8%
While classroom-focused workload tasks tended to be the most commonly performed activities, employer and career-related tasks were the activities performed most often in addition to regular duties (Table 20). This included providing career/employment counselling or mentoring for students (college=42.4%, university=34.4%), recruiting WIL partners/host sites (college=30.4%, university=27.8%), and managing relationships with host employers and community partners (college=26.4%, university=20.9%). Generally, college faculty were more likely than university faculty respondents to report performing WIL related tasks in addition to their regular duties, though there were few statistically significant differences, and the effect size was very small for those that did appear to differ. Only about one-third of college faculty and one-quarter of university faculty reported providing training and support for employers/site supervisors or coordinating risk management and insurance details.

44
44 – Faculty Experiences with and Perceptions of Work-Integrated Learning (WIL) in the Ontario Postsecondary Sector
Table 20 - Responses to Individuals Workload Tasks College University Total
Performed Task (%)
Addition to Regular
Duties (%)
Performed Task (%)
Addition to Regular
Duties (%)
Performed Task (%)
Addition to Regular
Duties (%)
Prepared WIL-related lectures, tutorials, workshops
78.8 22.3 74.1 17.6 76.9 20.4
Provided career/employment counseling or mentoring for students
78.2 42.4 71.8 34.4 75.6 39.2
Evaluated students’ WIL-related classroom assignments (.005)
72.4 10.0 77.7 13.0 74.6 11.2
Established WIL student learning objectives
71.9 17.2 77.1 19.0 74.0 17.9
Gathered feedback from students on the quality of their WIL experience
70.8 17.7 76.0 16.5 72.9 17.2
Developed WIL-related curriculum or course content
71.0 22.9 74.3 20.2 72.3 21.8
Prepared or oriented students into industry/sector
78.2 17.3 57.7 13.2 70.0 15.6
Assessed students for their workplace activities
62.8 11.0 64.3 13.7 63.4 12.1
Gathered feedback from employers/community partners on their experience with WIL students
62.6 18.8 60.3 16.8 61.6 18.0
Supervised/interacted with WIL administrative staff/coordinators
62.3 15.0 57.3 16.5 60.3 15.6
Managed relationships with host employers and community partners
61.4 26.4 55.3 20.9 58.9 24.2
Recruited WIL partners/host sites 55.2 30.4 51.1 27.8 53.6 29.3 Completed paperwork and documentation specific to WIL contracts
54.4 15.5 49.9 18.2 52.5 16.6
Conducted site visits and monitored students in the workplace
52.5 13.9 45.7 12.8 49.7 13.5
Prepared or oriented host employers and community partners
51.1 23.2 44.7 18.4 48.5 21.2
Provided training and support for employers/site supervisors
32.3 12.3 25.5 9.6 29.6 11.2
Coordinated risk management and insurance details
31.5 8.0 23.3 8.6 28.2 8.3
Labour Market Connectivity
Formal WIL opportunities are only one way in which postsecondary institutions and faculty connect learning with the world of work and employment. Survey participants were asked to what extent they participated in a range of activities that integrate student learning with real-world work experiences. The results are presented in Table 21 for college faculty and Table 22 for university faculty, showing the responses and mean for each of the items in response to the question “On average, during a typical academic term, approximately how many times do you perform the following?” (1=never, 2=1-5 times, 3=6-10 times, 4=11-20 times, 5=more than 20 times).

45
45 – Faculty Experiences with and Perceptions of Work-Integrated Learning (WIL) in the Ontario Postsecondary Sector
Table 21 – Responses and Mean Ratings for Connectivity Measures for College Faculty College Never 1-4
times 6-10
times 11-20 times
More than 20 times
Mean
Use business/community/workplace examples to illustrate concepts in class
8.1% 17.1% 17.9% 16.8% 40.2% 3.64
Talk to students individually about their career goals/concerns
4.4% 29.8% 21.0% 16.7% 28.1% 3.34
Talk to students individually about their work experiences
6.7% 28.8% 23.6% 14.7% 26.2% 3.25
Use authentic assessment strategies to assess students’ ability to perform real-world tasks
18.5% 25.2% 21.5% 12.6% 22.2% 2.95
Invite students to share their work experiences with the class
13.8% 32.5% 21.1% 13.5% 19.2% 2.92
Use business/community/workplace case studies for student assignments
21.5% 28.5% 18.7% 12.7% 18.6% 2.78
Invite students to share their career goals with the class
24.3% 37.4% 16.8% 10.0% 11.6% 2.47
Design academic course content (readings, discussions) to integrate with students’ work experiences
27.9% 33.6% 16.7% 9.3% 12.5% 2.45
Provide class time for students to reflect on their work experiences
36.2% 29.5% 13.4% 8.1% 12.8% 2.32
Assign projects that require students to interact with local business, government or community organizations
37.0% 38.1% 12.2% 5.8% 6.9% 2.08
Invite business, government, or community guest speakers into the classroom
30.6% 58.4% 7.9% 2.0% 1.1% 1.85
Arrange job shadowing opportunities for students 71.1% 17.7% 4.9% 1.9% 4.4% 1.51Organize class visits to local business, government, or community workplaces
56.7% 38.2% 3.5% .8% .8% 1.51
Both college and university faculty engaged most often in activities that require minimal direct contact with outside business, government or community members. For example, faculty reported making widespread use of business examples to illustrate concepts in class, and frequently providing individual career assistance for students. This trend is similar to findings reported by Brewer and Gray (1999), in which community college faculty were found to be more likely to build real-world linkages that required relatively low levels of effort. Activities that require higher levels of planning and preparation, such as organizing class visits to local businesses, arranging job shadowing opportunities, and inviting business guest speakers into classes were undertaken relatively infrequently. However, close to 70% of college faculty and roughly half of university faculty reported inviting business, government, or community guest speakers into the classroom at least once during an academic term.

46
46 – Faculty Experiences with and Perceptions of Work-Integrated Learning (WIL) in the Ontario Postsecondary Sector
Table 22 – Responses and Mean Ratings for Connectivity Measures for University Faculty University Never 1-4
times 6-10
times 11-20 times
More than 20 times
Mean
Talk to students individually about their career goals/concerns
8.4% 34.9% 24.6% 14.0% 18.1% 2.98
Use business/community/workplace examples to illustrate concepts in class
23.5% 21.4% 19.4% 13.8% 21.9% 2.89
Talk to students individually about their work experiences
15.7% 40.1% 20.7% 10.5% 13.0% 2.65
Invite students to share their work experiences with the class
40.0% 29.6% 14.6% 6.8% 9.0% 2.15
Use business/community/workplace case studies for student assignments
43.0% 27.9% 13.1% 6.9% 9.2% 2.12
Use authentic assessment strategies to assess students’ ability to perform real-world tasks
51.2% 23.6% 11.9% 6.2% 7.2% 1.95
Design academic course content (readings, discussions) to integrate with students’ work experiences
50.1% 26.8% 10.4% 5.9% 6.8% 1.92
Provide class time for students to reflect on their work experiences
60.8% 19.5% 8.0% 4.4% 7.4% 1.78
Invite students to share their career goals with the class
54.1% 28.1% 9.6% 3.9% 4.4% 1.76
Assign projects that require students to interact with local business, government or community organizations
58.9% 27.2% 6.0% 3.8% 4.1% 1.67
Invite business, government, or community guest speakers into the classroom
47.7% 46.9% 4.2% .7% .5% 1.59
Arrange job shadowing opportunities for students 80.9% 13.1% 3.2% .9% 2.0% 1.30Organize class visits to local business, government, or community workplaces
77.1% 20.8% 1.3% .3% .4% 1.26
While the types of connections engaged in by faculty did not differ significantly by college or university, the extent did vary considerably, with college faculty reporting engaging in the connectivity activities more frequently than university faculty. When broken down by program area, there were statistically significant variations in the means of each of the connectivity measures for college faculty (Table 23), but the partial-eta squared values were miniscule, meaning the size of the effect was very small. Among university faculty, there were some meaningful differences (Table 24). Program area was found to have a significant effect on the use of business/community/workplace examples to illustrate concepts in class (F(5,1826)=71.036, p=.000, eta-square=.163), on the use of business/community/workplace case studies for student assignments (F(5,1799)=87.960, p=.000, eta-squared=.196), and on inviting students to share their work experiences with the class (F(5,1821)=62.805, p=.000, eta-squared=.147). For all three of these measures of connectivity, Business faculty were found to engage in the activity to a greater extent than faculty in other program areas.

47
47 – Faculty Experiences with and Perceptions of Work-Integrated Learning (WIL) in the Ontario Postsecondary Sector
Table 23 - Mean Ratings for Connectivity Measures for College Faculty by Program Area
Social
Sciences Business Science and Math
Engineering and
Technology Health Arts and
Humanities
Use business/community/workplace examples to illustrate concepts in class * 3.77 (1.36) 3.93 (1.24) 3.46 (1.42) 3.42 (1.31) 3.71 (1.37) 3.41 (1.42) Talk to students individually about their career goals/concerns * 3.60 (1.27) 3.29 (1.28) 3.09 (1.33) 3.17 (1.24) 3.35 (1.28) 3.31 (1.25) Talk to students individually about their work experiences * 3.40 (1.33) 3.35 (1.22) 2.98 (1.27) 3.10 (1.26) 3.59 (1.29) 2.95 (1.29) Invite students to share their work experiences with the class * 3.17 (1.36) 3.04 (1.27) 2.43 (1.29) 2.55 (1.19) 3.45 (1.33) 2.64 (1.24) Use business/community/workplace case studies for student assignments * 2.91 (1.46) 3.07 (1.35) 2.58 (1.42) 2.47 (1.23) 3.05 (1.40) 2.52 (1.39) Use authentic assessment strategies to assess students’ ability to perform real-world tasks * 3.06 (1.42) 2.93 (1.35) 2.67 (1.40) 2.70 (1.33) 3.36 (1.43) 2.86 (1.46) Design academic course content (readings, discussions) to integrate with students’ work experiences * 2.67 (1.38) 2.45 (1.22) 2.09 (1.23) 2.09 (1.15) 2.85 (1.38) 2.35 (1.32) Invite students to share their career goals with the class * 2.86 (1.31) 2.40 (1.23) 2.08 (1.23) 2.02 (1.09) 2.63 (1.35) 2.50 (1.21) Provide class time for students to reflect on their work experiences * 2.71 (1.44) 2.00 (1.17) 1.78 (1.17) 1.76 (1.03) 3.12 (1.42) 2.28 (1.33) Assign projects that require students to interact with local business, government or community organizations * 2.38 (1.25) 2.19 (1.10) 1.70 (1.07) 1.79 (1.02) 2.09 (1.11) 1.98 (1.13) Invite business, government, or community guest speakers into the classroom * 1.94 (.75) 1.89 (.75) 1.56 (.64) 1.69 (.59) 1.94 (.67) 1.91 (.83) Arrange job shadowing opportunities for students * 1.57 (1.07) 1.33 (.77) 1.31 (.71) 1.43 (.89) 2.00 (1.39) 1.41 (.81) Organize class visits to local business, government, or community workplaces * 1.51 (.67) 1.46 (.67) 1.33 (.62) 1.56 (.59) 1.60 (.80) 1.55 (.68) * Indicates a statistically significant finding (p<.05).

48
48 – Faculty Experiences with and Perceptions of Work-Integrated Learning (WIL) in the Ontario Postsecondary Sector
Table 24 - Mean Ratings for Connectivity Measures for University Faculty by Program Area Social
Sciences Business Science
and Math Engineering
and Technology
Health Arts and Humanities
Use business/community/ workplace examples to illustrate concepts in class *
3.09 (1.48) 4.47 (.86) 2.39 (1.34) 3.07 (1.28) 3.35 (1.44) 2.29 (1.29)
Talk to students individually about their career goals/concerns *
3.11 (1.29) 3.25 (1.26) 2.86 (1.25) 2.82 (1.12) 3.00 (1.25) 2.91 (1.21)
Talk to students individually about their work experiences *
2.81 (1.27) 3.30 (1.30) 2.34 (1.14) 2.70 (1.17) 2.97 (1.28) 2.35 (1.12)
Invite students to share their work experiences with the class *
2.47 (1.33) 3.15 (1.42) 1.54 (.92) 1.80 (1.03) 2.69 (1.36) 1.90 (1.03)
Use business/community/ workplace case studies for student assignments *
2.21 (1.28) 3.65 (1.32) 1.69 (1.01) 2.13 (1.09) 2.80 (1.43) 1.57 (.90)
Use authentic assessment strategies to assess students’ ability to perform real-world tasks *
1.95 (1.23) 2.57 (1.36) 1.62 (1.00) 2.07 (1.17) 2.73 (1.46) 1.64 (1.06)
Design academic course content (readings, discussions) to integrate with students’ work experiences *
2.14 (1.29) 2.49 (1.40) 1.54 (.97) 1.86 (1.04) 2.52 (1.38) 1.56 (.92)
Invite students to share their career goals with the class *
2.03 (1.18) 2.02 (1.17) 1.33 (.76) 1.46 (.79) 2.10 (1.22) 1.73 (.96)
Provide class time for students to reflect on their work experiences *
2.01 (1.32) 2.19 (1.36) 1.33 (.81) 1.48 (.90) 2.38 (1.52) 1.65 (1.10)
Assign projects that require students to interact with local business, government or community organizations *
1.82 (1.08) 2.18 (1.31) 1.32 (.74) 1.66 (1.00) 2.06 (1.31) 1.46 (.78)
Invite business, government, or community guest speakers into the classroom *
1.67 (.62) 1.89 (.77) 1.41 (.64) 1.61 (.69) 1.77 (.68) 1.48 (.55)
Arrange job shadowing opportunities for students *
1.28 (.70) 1.20 (.67) 1.19 (.58) 1.35 (.73) 1.92 (1.29) 1.16 (.49)
Organize class visits to local business, government, or community workplaces *
1.28 (.55) 1.29 (.57) 1.14 (.41) 1.34 (.61) 1.37 (.70) 1.26 (.49)
* Indicates a statistically significant finding (p<.05).
There are also some significant differences by level of WIL involvement. As seen in Table 25, college faculty who teach in a course with a WIL component generally have higher mean scores on all of the connectivity measures. As with differences by program area, however, we find that while the differences are statistically significant, the effect sizes are very small, suggesting that the differences are not practically meaningful.
Among university faculty, level of WIL involvement was both statistically and practically significant for inviting students to share their work experiences in class (F(2,1813)=128.788, p=.000, eta squared=.124); providing class time for students to reflect on their work experiences (F(2,1816)=144.878, p=.000, eta squared=.138); using authentic assessment strategies to assess students’ ability to perform real-world tasks (F(2,1760)=101.922, p=.000, eta squared=.104); assigning projects that require students to interact with local business, government, or community organizations (F(2,1814)=173.110 , p=.000, eta squared=.160); and designing academic course content to integrate with students’ work experiences (F(2,1812)=171.486 , p=.000, eta squared=.159). For each of these items, faculty who taught a course

49
49 – Faculty Experiences with and Perceptions of Work-Integrated Learning (WIL) in the Ontario Postsecondary Sector
with a WIL component engaged in the activity to a greater extent than faculty who taught in a WIL program or who had no WIL involvement.
Table 25 - Mean Ratings for Connectivity Measures by Level of WIL Involvement
College University Teach
Course with WIL
Teach in program with WIL
No WIL Teach Course
with WIL
Teach in program with WIL
No WIL
Use business/community/ workplace examples to illustrate concepts in class *
3.84 (1.30) 3.67 (1.31) 3.23 (1.46) 3.42 (1.42) 2.93 (1.41) 2.49 (1.42)
Talk to students individually about their career goals/concerns *
3.60 (1.27) 3.23 (1.21) 2.98 (1.26) 3.26 (1.28) 2.93 (1.21) 2.81 (1.21)
Talk to students individually about their work experiences *
3.59 (1.29) 3.11 (1.21) 2.76 (1.23) 3.16 (1.26) 2.58 (1.15) 2.33 (1.16)
Invite students to share their work experiences with the class *
3.31 (1.32) 2.61 (1.25) 2.52 (1.23) 2.84 (1.35) 1.84 (1.08) 1.88 (1.13)
Use business/community/ workplace case studies for student assignments *
3.06 (1.39) 2.68 (1.38) 2.39 (1.35) 2.66 (1.38) 2.05 (1.19) 1.77 (1.15)
Use authentic assessment strategies to assess students’ ability to perform real-world tasks *
3.21 (1.41) 2.86 (1.37) 2.55 (1.37) 2.54 (1.39) 1.86 (1.13) 1.59 (1.01)
Design academic course content (readings, discussions) to integrate with students’ work experiences *
2.82 (1.35) 2.23 (1.24) 2.01 (1.15) 2.67 (1.36) 1.67 (.99) 1.58 (.97)
Invite students to share their career goals with the class *
2.75 (1.34) 2.19 (1.14) 2.25 (1.17) 2.14 (1.20) 1.56 (.94) 1.64 (.98)
Provide class time for students to reflect on their work experiences *
2.74 (1.45) 1.87 (1.15) 2.00 (1.16) 2.47 (1.44) 1.44 (.91) 1.52 (1.01)
Assign projects that require students to interact with local business, government or community organizations *
2.43 (1.26) 1.85 (1.02) 1.66 (.88) 2.31 (1.25) 1.44 (.80) 1.38 (.77)
Invite business, government, or community guest speakers into the classroom *
2.05 (.76) 1.71 (.67) 1.62 (.65) 1.89 (.66) 1.50 (.62) 1.45 (.60)
Arrange job shadowing opportunities for students *
1.76 (1.21) 1.31 (.73) 1.25 (.62) 1.59 (1.03) 1.21 (.58) 1.15 (.53)
Organize class visits to local business, government, or community workplaces *
1.66 (.76) 1.39 (.57) 1.36 (.58) 1.48 (.66) 1.17 (.44) 1.17 (.44)
* Indicates a statistically significant finding for both college and university (p<.05).

50
50 – Faculty Experiences with and Perceptions of Work-Integrated Learning (WIL) in the Ontario Postsecondary Sector
6. Discussion Despite the important role of faculty in the provision of WIL opportunities for students, there has been little research to understand faculty attitudes about WIL in Ontario’s postsecondary sector. This study offers valuable insight into the perceptions of faculty at Ontario colleges and universities, providing a greater sense of the barriers and challenges to faculty involvement in WIL, as well as the perceived benefits.
The survey findings show that the level of support for WIL in Ontario PSE varies considerably across the college and university sectors. College faculty were generally very supportive of WIL, with 95.0% reporting that they personally felt that WIL was valuable, and over half of respondents feeling that the level of WIL activity should be increased. Relatively little variation was seen in college faculty responses, though there were some differences by program and years of non-PSE employment experience. Among university faculty, the vast majority also reported that they personally felt WIL was valuable (83.5%), and close to half felt that the level of WIL activity should be increased. However, there was much greater variation in faculty responses and/or ambivalence, with many faculty reporting neutral positions to both statements.
Given the traditional focus of Ontario colleges on providing vocational education, these higher levels of support for WIL among college faculty are not particularly surprising. WIL fits well with the mandate of colleges to offer students accessible career-oriented education and training, while there is less of a match with the university system’s traditional aim to provide a liberal arts education or to create critical- and independent-thinking citizens.
Regardless of the institution and the sector, it is clear that postsecondary faculty perceive the advantages of WIL to accrue primarily to students. WIL is seen as helping students better understand work realities and expectations, develop contacts for future employment, and explore their career interests and goals. At the institutional level, faculty also generally viewed WIL as helping to connect institutions to businesses and the broader community.
The primary challenges faculty face appear to be similar across the university and college sectors, with the greatest challenges related to finding sufficient quantity and quality of WIL placements, and managing the needs to integrate WIL within increasingly large classes. Balancing WIL with academic workloads was also perceived to be a challenge, and faculty who taught a course with a WIL component reported completing a large number of supplementary workload tasks. Classroom-focused workload tasks tended to be the most commonly performed, but employer and career-related tasks were the activities performed most often in addition to regular duties.
Finally, both college and university faculty are integrating work experiences into their classrooms outside of formal WIL activities, though this is much more widespread among college than university faculty. The primary ways in which all faculty reported integrating learning and work was by using business or community workplace examples and speaking with students, both individually and as a class, about their career goals and job experiences. Activities that require higher levels of planning and preparation, and greater interaction with the broader community, are undertaken much less frequently by faculty.
The survey findings suggest a number of policy recommendations. First, if postsecondary institutions wish to increase their provision of WIL opportunities, some work will need to be done to improve faculty awareness of the purpose and benefits of WIL, particularly among university faculty. While there is little outright opposition to WIL, university faculty respondents tended to have lower levels of support and a sizeable proportion were unsure about the appropriate level of WIL in postsecondary education. Institutions will also need to address concerns that WIL privileges the production of “workers,” over providing students with a broad-based and more theoretical education.

51
51 – Faculty Experiences with and Perceptions of Work-Integrated Learning (WIL) in the Ontario Postsecondary Sector
As the demand for PSE increases and average class sizes grow, the challenges of developing and implementing WIL opportunities for greater numbers of students and in larger classes will be augmented. Institutions wishing to expand WIL programs will need to dedicate financial and administrative resources and supports to aid faculty in meeting these challenges. Implementing WIL within a course adds to faculty workloads, and creates difficulties in balancing WIL with other academic responsibilities. Consideration should be given to providing greater institutional recognition for faculty who engage in WIL activities, as well as offering interested faculty professional development opportunities around developing WIL curriculum and assessment strategies.
Given that one of the primary concerns for faculty is ensuring adequate numbers of quality placements for students, institutions could also play a greater role in working to strengthen and support communication links with employers and community partners. Providing assistance in recruiting and building relationships with host sites, similar to institutional structures that often already support more established co-op programs, could help to alleviate faculty concerns about the significant demands on time involved in WIL.
As a number of survey respondents noted in open-ended comments, WIL takes many forms, and the benefits and challenges will vary depending on the type of WIL and how it is implemented. Future research should examine faculty attitudes in relation to the various types of WIL, and how the barriers and workload issues may differ. Studies could also move beyond focusing on faculty perceptions of benefits and challenges, to generating a better understanding of whether and how participating in WIL impacts faculty in other ways, such as the influence of WIL on instructional approaches. Effective strategies to enhance faculty involvement in WIL should also be explored, along with institutional best practices in the administration and support of faculty-led WIL initiatives.

52
52 – Faculty Experiences with and Perceptions of Work-Integrated Learning (WIL) in the Ontario Postsecondary Sector
Works Cited Abes, E., Jackson, G., & Jones, S. (2002). Factors That Motivate and Deter Faculty Use of Service-Learning. Michigan Journal of Community Servuce Learning, 9(1).
Billet, S. (2009a). Developing agentic professionals through practice-based pedagogies. Australia: Australian Learning and Teaching Council.
Brewer, D., & Gray, M. (1999). Do Faculty Connect School to Work? Evidence From Community Colleges. Educational Evaluation and Policy Analysis, 21(4), 405-416.
Britnell, J., Brockerhoff-Macdonald, B., Carter, L., Dawson, D., Doucet, L., Evers, F., Hall, S.,Kerr, D., Liboiron-Grenier, L., McIntyre, G., Mighty, J. Siddall, G., and Wilson, J. (2010). "University Faculty Engagement in Teaching Development Activities Phase II." Toronto: Higher Education Quality Council of Ontario.
Bulot, J., & Johnson, C. (2006). Costs of Faculty Involvement in Intergenerational Service-Learning. Educational Gerentology, 32(8), 633-645.
Chisholm, C., Harris, M., Northwood, D. and Johrendt, J. (2009). The Characterisation of Work-Based Learning by Consideration of the Theories of Experiential Learning. European Journal of Education, 44 (3), 319-337.
Emslie, M. (2011). Where's WIL? Including work-integrated learning in descriptions of what it is that academics do. Journal of Cooperative Education and Internships, 45(1), 34-44.
Fisher, D., Rubenson, K., Jones, G., and Shanahan, T. (2009). The political economy of post-secondary education: A comparison of British Columbia, Ontario and Quebec. Higher Education, 57 (5), 549–566.
Hodges, D. (2008). Growing work-integrated learning programmes in a New Zealand educational institution: the influence of faculty vews. WACE/ACEN Asia Pacific Conference (pp. 209-216). Auckland: Unitec Institute of Technology.
McCurdy, S., & Zegwaard, K. (2009). Faculty voices: what faculty think about work-integrated learning. Journal of Cooperative Education & Internships, 43(1), 36-53.
McKay, V., & Rozee, P. (2004). Characteristics of faculty who adopt community service learning pedagogy. Michigan Journal of Community Service Learning, 10(2).
Moreland, N. (2005). Work-related learning in higher education. Heslington, York: The Higher Education Academy.
Patrick, C., Peach, D., Pocknee, C., Webb, F., Fletcher, M., & Pretto, G. (2009). The WIL report: A national scoping study [Australian Learning and Teaching Council Final Report]. Brisbane: Queensland University of Technology.
Pribbenow, D. (2005). The impact of service-learning pedagogy on faculty teaching and learning. Michigan Journal of COmmunity Service Learning, 11(2).
Rothamer, F. (2003). Business Faculty Knowledge of Adult Learning Styles: Cooperative Education vs. Non-Cooperative Education Institutions [PhD Thesis]. Gainesville, Florida: University of Florida.

53
53 – Faculty Experiences with and Perceptions of Work-Integrated Learning (WIL) in the Ontario Postsecondary Sector
Sattler, P. (2011). Work-Integrated Learning in Ontario’s Postsecondary Sector. Toronto: Higher Education Quality Council of Ontario.
Savaya, R., Peleg-Oren, N., Stange, D., & Geron, Y. (2003). Congruence ofclassroom and field instruction in social work: An empirical study. Social Work Education, 22(3), 297-208.
Wimmer, R. (2007). Why do we do what we do? Current and Promising Field Experience Practice. WestCAST. Winnipeg.

54
54 – Faculty Experiences with and Perceptions of Work-Integrated Learning (WIL) in the Ontario Postsecondary Sector
Appendix 1: Working Group Wayne Lewrey, Algonquin College Jo-Ann Aubut, Algonquin College Nancy Miyagi, George Brown College Robert Luke, George Brown College Baaba Lewis, George Brown College Lisa Whalen, Georgian College Marie Robertson, La Cité collégiale Charmaine Kissmann, Niagara College Fiona Allan, Niagara College Duncan Macduff, Niagara College Kristine Dawson, Niagara College Natalee Tokar, Niagara College Sheila Shaver, Sheridan College Laura Christopherson, Sheridan College Cheryle Moreau, Sheridan College Melanie Spence, Sheridan College Michael Collins, Sheridan College John Lundy, Laurentian University Serge Demers, Laurentian University Marc-Andre Daoust, University of Ottawa Pierre Mercier, University of Ottawa Judene Pretti, University of Waterloo Rosmary Zanutto, University of Windsor Karen Benzinger, University of Windsor Jennifer Johrendt, University of Windsor Robyn Nease, University of Windsor Alan Wright, University of Windsor Gregory Marcotte, University of Windsor Katka Hrncic-Lipovic, University of Windsor Sherry D, University of Windsor Ken Meadows, The University of Western Ontario
Deb Dawson, The University of Western Ontario Gayle McIntyre, The University of Western Ontario Stephanie Hayne, The University of Western Ontario Megan Conway, Wilfrid Laurier University Lesley Cooper, Wilfrid Laurier University Gillian Wells, Wilfrid Laurier University Janice Vilaca, Wilfrid Laurier University Shannon Pennington, Wilfrid Laurier University Glenn Craney, York University Katherine Morris, York University Aiyni Agasee, York University Nora Loreto, Canadian Federation of Students-Ontario Chris Martin, Ontario Undergraduate Student Alliance Tamara Popovic, College Student Alliance Jim Robeson, College Student Alliance Manzur Malik, Ontario Public Service Employees Union Trish Crema, Ministry of Training, Colleges and Universities Steven Wald, Ministry of Training, Colleges and Universities Victoria Esses, Welcoming Communities Initiative

55 – Faculty Experiences with and Perceptions of Work-Integrated Learning (WIL) in the Ontario Postsecondary Sector
Appendix 2: Survey Instrument Target
Q1.
STAT
ALL What is your status as a faculty member at this institution? If you are not currently teaching in the classroom, please think of your most recent teaching assignment.
[1] College full-time
[2] College partial load or part-time
[3] College sessional
[4] University tenured
[5] University tenure-track
[6] University limited-term appointment
[7] University contract or sessional
[8] Other, please specify
Q2.
PRG
ALL Which of the following best describes the area in which you teach? (Select all that apply)
[1] Agriculture, Natural Resources and Conservation
[2] Education
[3] Humanities
[4] Social Sciences
[5] Psychology
[6] Family and Consumer Sciences/Human Sciences
[7] Communication, Journalism and Related Programs
[8] Legal Professions and Studies
[9] Business, Management, Marketing and Related Support Services
[10] Public Administration and Social Service Professions
[11] Physical Sciences
[12] Biological and Biomedical Sciences
[13] Science Technologies/Technicians
[14] Mathematics and Statistics
[15] Computer and Information Sciences and Support Services
[16] Architecture and Related Services
[17] Engineering
[18] Engineering Technologies/Technicians
[19] Construction Trades
[20] Mechanic and Repair Technologies/Technicians

56 – Faculty Experiences with and Perceptions of Work-Integrated Learning (WIL) in the Ontario Postsecondary Sector
[21] Precision Production
[22] Health Professions and Related Clinical Sciences
[23] Parks, Recreation, Leisure and Fitness Studies
[24] Personal and Culinary Services
[25] Security and Protective Services
[26] Transportation and Materials Moving
[27] Visual and Performing Arts
[28] Communications Technologies/Technicians and Support Services
[29] Other, please specify
Q3.
PSEYRS
ALL In total, how many years have you been teaching at the postsecondary level? [1] Less than one year
[2] 1-5 years
[3] 6-10 years
[4] 11-15 years
[5] 16-20 years
[6] More than 20 years
Q4.
INSTYRS
ALL
How many years have you been teaching at this institution? [1] Less than one year
[2] 1-5 years
[3] 6-10 years
[4] 11-15 years
[5] 16-20 years
[6] More than 20 years
Q5.
SEX
ALL What is your gender? [1] Male
[2] Female
[3] Other
[4] Prefer not to answer
Q6.
AGE
ALL What is your age range? [1] Younger than 30
[2] 30-39 years old
[3] 40-49 years old
[4] 50-59 years old
[5] 60-69 years old

57 – Faculty Experiences with and Perceptions of Work-Integrated Learning (WIL) in the Ontario Postsecondary Sector
[6] 70 or older
[7] Prefer not to answer
Q7.
PSEPUR
ALL We are interested in your opinions about the purposes of postsecondary education. To what extent is your teaching intended to contribute to your students’ knowledge, skills and personal development in the following areas? Not at all, Very little, Somewhat, Very much
[1] Using computing and information technology
[2] Using data to analyze problems
[3] Thinking critically and analytically
[4] Speaking clearly and effectively
[5] Writing clearly and effectively
[6] Working effectively with others
[7] Working independently
[8] Becoming lifelong learners
[9] Applying skills and knowledge in different situations
[10] Acquiring job-related or work-related knowledge and skills
[11] Securing relevant work after graduation
[12] Acquiring a broad general education
[13] Solving complex, real-world problems
[14] Developing leadership skills
[15] Contributing to the welfare of their community
[16] Developing a personal code of ethics and values
[17] Understanding people of other racial and ethnic backgrounds
[18] Understanding themselves
[19] Participating as informed voters in local, provincial and federal elections
Q8.
PUROTH
ALL
Is your teaching intended to contribute to your students’ development in other areas not mentioned above? (Open-ended)
Q9.
EMPEXP
ALL Excluding teaching or research conducted as part of your faculty responsibilities, do you have other employment experience related to the program area in which you teach?
[1] Yes
[2] No
Q10.
EMPYRS
Show if EMPEXP=1
How many years of other employment experience do you have? [1] Less than one year

58 – Faculty Experiences with and Perceptions of Work-Integrated Learning (WIL) in the Ontario Postsecondary Sector
[2] 1-5 years
[3] 6-10 years
[4] 11-15 years
[5] 16-20 years
[6] More than 20 years
Q11.
FACSTD
ALL
Did you participate in any work-integrated learning programs when you were a postsecondary student? Work-integrated learning includes co-op, practicums, clinical placements, field placements, internships, applied research projects, community-based learning, service-learning, etc.
[1] Yes
[2] No
Q12.
CPAPP
ALL
Have you ever taught in a program in which students participate in co-op or apprenticeship? (Select one only)
[1] Yes, co-op
[2] Yes, apprenticeship
[3] Yes, both co-op and apprenticeship
[4] No
[5] Not sure
Q13.
FACPRG
ALL Within your faculty or program, do you personally teach a course in which students participate in work-integrated learning (WIL)?
[1] Yes, I currently teach a course that involves WIL
[2] I previously taught a course that involves WIL, but do not currently
[3] No, I have never taught a course that involves WIL
Q14.
WILPRG
Skip if FACPRG=3
Please describe the type of work-integrated learning involved in the course. (Select all that apply)
[1] Practicums, clinical placements, or internships required for students to obtain a license to practice, register with a regulatory college/professional association, or obtain a professional designation
[2] Field placements
[3] Internships
[4] Applied research projects
[5] Community-based learning
[6] Service-learning
[7] Global service learning
[8] Don’t know
[9] Other, please specify
Q15. Show if FACPRG=1,
We want to understand faculty workload issues that may be associated with

59 – Faculty Experiences with and Perceptions of Work-Integrated Learning (WIL) in the Ontario Postsecondary Sector
WRKLD
2
work-integrated learning (WIL). On average, for the courses in which your students participated in WIL, please indicate which of the following activities you typically completed. For those activities you select, please indicate whether the activity was part of, or in addition to, your regularly assigned duties. Did not do this, Completed as part of regular duties, Completed in addition to regular duties
[1] Developed WIL-related curriculum or course content
[2] Established WIL- student learning objectives
[3] Prepared WIL-related lectures, tutorials, workshops
[4] Provided career/employment counseling or mentoring for students
[5] Recruited WIL partners/host sites
[6] Completed paperwork and documentation specific to WIL contracts
[7] Coordinated risk management and insurance details
[8] Supervised/interacted with WIL administrative staff/coordinators
[9] Prepared or oriented host employers and community partners
[10] Managed relationships with host employers and community partners
[11] Provided training and support for employers/site supervisors
[12] Prepared or oriented students into industry/sector
[13] Conducted site visits and monitored students in the workplace
[14] Assessed students for their workplace activities
[15] Evaluated students’ WIL-related classroom assignments
[16] Gathered feedback from employers/community partners on their experience with WIL students
[17] Gathered feedback from students on the quality of their WIL experience
[18] Other, please specify
Q16.
VALSTD
ALL
Work-integrated learning is perceived to offer advantages and disadvantages to students. We recognize that there are differences between types of WIL, and that you may not have had any actual WIL experience. On average, however, please indicate how much you agree or disagree with the following statements. Strongly disagree, Disagree, Neither agree nor disagree, Agree, Strongly agree
[1] Participating in work-integrated learning increases students’ self-

60 – Faculty Experiences with and Perceptions of Work-Integrated Learning (WIL) in the Ontario Postsecondary Sector
confidence.
[2] Work-integrated learning does little to improve students’ understanding of academic course content.
[3] . Participation in work-integrated learning increases students’ engagement in their academic studies.
[4] Work-integrated learning lets students apply the theory and skills learned in the classroom.
[5] The costs to students (both financial and time required) outweigh the benefits of work-integrated learning.
[6] Too many employers use work-integrated learning simply to reduce their salary costs.
[7] Work-integrated learning enhances the postsecondary experience for students.
[8] Work-integrated learning is particularly valuable for students considered “at-risk”.
[9] There is a lack of evidence about the impact of WIL on student learning.
[10] Work-integrated learning helps students better understand work realities and expectations.
[11] Work-integrated learning engages students in thinking critically about the workplace and the nature of work.
[12] Students who participate in work-integrated learning are more employable than other students.
[13] Employers, not students, are the main beneficiaries of WIL programs.
[14] Work-integrated learning lets students explore their career interests and clarify their career goals.
[15] Work-integrated learning helps students develop contacts and networks for future employment.
[16] Work-integrated learning is only useful for students who go directly to the labour market after their postsecondary education.
Q17.
VALOTH
ALL
Are there other advantages or disadvantages for students? (Open-ended)
Q18.
VALINST
ALL
Work-integrated learning is perceived to offer advantages and disadvantages to faculty and postsecondary institutions. We recognize that there are differences between types of WIL, and that you may not have had any actual WIL experience. On average, however, please indicate how much you agree or disagree with the following statements. Strongly disagree, Disagree, Neither agree nor disagree, Agree, Strongly agree

61 – Faculty Experiences with and Perceptions of Work-Integrated Learning (WIL) in the Ontario Postsecondary Sector
[1] I personally think that work-integrated learning is valuable.
[2] Involvement with work-integrated learning helps faculty keep their knowledge current.
[3] Feedback from students and employers who participate in WIL can improve academic programming.
[4] Work-integrated learning is inconsistent with the values of a liberal education.
[5] Work-integrated learning is an effective postsecondary education recruitment and marketing tool.
[6] Work-integrated learning perpetuates a business model for postsecondary education.
[7] Work-integrated learning enhances institutional reputation.
[8] Work-integrated learning strengthens links between the institution and the business community.
[9] Work-integrated learning diverts funding away from program areas that may not lend themselves to WIL.
[10] Work-integrated learning connects postsecondary institutions to the broader community.
[11] Work-integrated learning can engage postsecondary institutions in responding to identified community needs.
[12] Work-integrated learning can involve postsecondary institutions in addressing global issues.
[13] Work-integrated learning can help businesses find solutions to specific business or industry needs.
[14] By extending corporate involvement in curriculum, work-integrated learning has a negative overall impact on postsecondary education.
[15] My institution provides resources and supports for faculty to participate in WIL activities.
Q19.
VALOTH
Show if FACPRG=1, 2
Are there other advantages or disadvantages for postsecondary institutions? (Open-ended)
Q20.
INTEG
ALL
This section explores faculty involvement in a range of activities that integrate student learning with real-world experiences, but may not be considered work-integrated learning. On average, during a typical academic term, approximately how many times do you perform the following? Never, 1-4 times, 6-10 times, 11-20 times, More than 20 times
[1] Invite business, government, or community guest speakers into the classroom
[2] Organize class visits to local business, government, or community

62 – Faculty Experiences with and Perceptions of Work-Integrated Learning (WIL) in the Ontario Postsecondary Sector
workplaces
[3] Talk to students individually about their work experiences
[4] Invite students to share their work experiences with the class
[5] Talk to students individually about their career goals/concerns
[6] Invite students to share their career goals with the class
[7] Provide class time for students to reflect on their work experiences (through journals, assignments, etc.)
[8] Arrange job shadowing opportunities for students
[9] Use business/community/workplace examples to illustrate concepts in class
[10] Use business/community/workplace case studies for student assignments
[11] Use authentic assessment strategies to assess students’ ability to perform real-world tasks
[12] Assign projects that require students to interact with local business, government or community organizations
[13] Design academic course content (readings, discussions) to integrate with students’ work experiences
Q21.
VALOTH
Show if FACPRG=1, 2
Are there other activities you use to integrate student learning with real-world experiences? (Open-ended)
Q22.
LVLWIL
ALL We are interested in your opinion on the appropriate levels of work-integrated learning within Ontario’s postsecondary sector. In general, do you believe that postsecondary work-integrated learning should be:
[1] Increased
[2] Decreased
[3] Kept about the same
[4] Not sure
Q23.
CHALL
ALL
There are many challenges associated with the successful implementation of postsecondary work-integrated learning. In your view, what are the most significant challenges? (Select all that apply)
[1] Managing WIL with large class sizes
[2] Developing appropriate WIL curriculum
[3] Integrating the work experience with classroom learning
[4] Balancing WIL with academic workloads
[5] Finding enough placements for students

63 – Faculty Experiences with and Perceptions of Work-Integrated Learning (WIL) in the Ontario Postsecondary Sector
[6] Ensuring quality placements for students
[7] Making WIL programs accessible to all students
[8] Providing adequate institutional supports for students
[9] Managing employer expectations/communication
[10] Managing student expectations/communication
[11] Lack of financial and administrative resources for faculty
[12] Developing valid student assessment and evaluation tools
[13] Lack of salary recognition for faculty who participate in WIL
[14] Lack of recognition for WIL activities in promotion decisions
[15] Lack of institutional service recognition for WIL activities
[16] Lack of faculty PD on implementing WIL
[17] Lack of institutional culture supporting WIL
[18] Other, please specify
Q24.
OTH
ALL Do you have any other comments you would like to make to contribute to this study of work-integrated learning in Ontario’s postsecondary sector?

64 – Faculty Experiences with and Perceptions of Work-Integrated Learning (WIL) in the Ontario Postsecondary Sector
Appendix 3: WIL Index Items Value of WIL index items range, mean and standard deviation
Minimum Maximum Mean Std.
Deviation Participating in work-integrated learning increases students’ self-confidence
1.00 5.00 4.2438 .70584
Work-integrated learning does little to improve students’ understanding of academic course content
1.00 5.00 3.8834 1.00946
Participation in work-integrated learning increases students’ engagement in their academic studies
1.00 5.00 3.9475 .84225
Work-integrated learning lets students apply the theory and skills learned in the classroom
1.00 5.00 4.2505 .74612
Too many employers use work-integrated learning simply to reduce their salary costs
1.00 5.00 3.1033 .95041
Work-integrated learning enhances the postsecondary experience for students
1.00 5.00 4.2004 .73553
Work-integrated learning helps students better understand work realities and expectations
1.00 5.00 4.3107 .68402
Work-integrated learning engages students in thinking critically about the workplace and the nature of work
1.00 5.00 4.1092 .79645
Students who participate in work-integrated learning are more employable than other students
1.00 5.00 3.9828 .88730
Employers, not students, are the main beneficiaries of WIL programs 1.00 5.00 3.6211 .88197
Work-integrated learning lets students explore their career interests and clarify their career goals
1.00 5.00 4.1558 .69638
Work-integrated learning helps students develop contacts and networks for future employment
1.00 5.00 4.2656 .68430
Work-integrated learning is only useful for students who go directly to the labour market after their postsecondary education
1.00 5.00 3.6685 .97857
Involvement with work-integrated learning helps faculty keep their knowledge current
1.00 5.00 3.8355 .95351
Feedback from students and employers who participate in WIL can improve academic programming
1.00 5.00 4.0117 .83118
Work-integrated learning is an effective postsecondary education recruitment and marketing tool
1.00 5.00 3.9300 .76672
Work-integrated learning enhances institutional reputation 1.00 5.00 3.8068 .84273 Work-integrated learning strengthens links between the institution and the business community
1.00 5.00 4.1040 .72510
Work-integrated learning diverts funding away from program areas that may not lend themselves to WIL
1.00 5.00 3.0736 .92091
Work-integrated learning connects postsecondary institutions to the broader community
1.00 5.00 4.0574 .73275
Work-integrated learning can engage postsecondary institutions in responding to identified community needs
1.00 5.00 3.8871 .79324
Work-integrated learning can involve postsecondary institutions in addressing global issues
1.00 5.00 3.5449 .88804
Work-integrated learning can help businesses find solutions to specific business or industry needs
1.00 5.00 3.6167 .82778
By extending corporate involvement in curriculum, work-integrated learning has a negative overall impact on postsecondary education
1.00 5.00 3.4073 1.05216

65 – Faculty Experiences with and Perceptions of Work-Integrated Learning (WIL) in the Ontario Postsecondary Sector