rced-86-185br airline inspections: comparison …1986 airline inspections comparison of airlines...
TRANSCRIPT
. United States G&eral’Accounthg OffIce - 3oa37 Briefmg Report to the Honorable Charles E. Bennett, House of Representatives
Jun$1986 AIRLINE INSPECTIONS
Comparison of Airlines With and Without Military Contracts
130237
GAti/RCED-WlBBBR

,
.

RESOURCES. COMMUNITY AND ECONOMIC DEVELOPMENT
DIVISION
UNITED STATES GENERAL ACCOUNTING OFFICE
WASHINGTON, D.C. 20548
June 20, 1986
R-223318
The Honorable Charles E. Rennett House of Representatives
Dear Mr. Rennett:
In your March 21, 1986, letter and in subsequent meetings with your office, you expressed concern about the safety of U.S. troops on charter airlines. Specifically, you requested that we compare the results of the Federal Aviation Administration's (FAA) National Air Transportation Inspection (NATI) for airlines having contracts with the Military Airlift Command (MAC) with those airlines not contracting with MAC. MAC contracts with airlines for long-range and short-range international passenger and cargo airlift as well as domestic operations lasting more than 90 days. On June 3, 1986, we briefed you on the results of our work. This briefing report summarizes our findings.
The Secretary of Transportation, in February 1984, directed FAA to conduct an unprecedented nationwide inspection of the safety of the air transportation industry. This intensive inspection, known as NATI, evaluated airlines operating under Federal Aviation Requlation Part 121 (operators of large aircraft) and commuter airlines oaerating under Part 135. During the NAT1 inspection (March-June 1984), FAA estimated that it performed as many inspections as it did in the course of a full year's routine inspection activity.
FAA conducted NAT1 in two phases. In Phase I, FAA inspected 327 airlines, including 141 Part 121 airlines, 13,467 inspections in all. FAA used Phase I results to assess the compliance level of the airline industry and to select airlines requiring further investigation for the more in-depth Phase II inspections. FAA assembled a task force to review all the inspection reports. The task force classified inspectors' adverse comments as severity levels 1,2, or 3, with severity level 3 representing situations having the highest potential for unsafe flight conditions (see page 7 for definitions and examples).
To identify airlines with MAC contracts, we used information Provided to FAA by MAC. Recause 21 of the 22 airlines with MAC contracts in the NAT1 program ooerated larger aircraft under Part 121, we agreed to focus our review on Part 121 airlines. In our analvsis, we compared the NAT1 inspection results for the 21 airlines with MAC contracts with the results for the 120 airlines
R-223318
not having MAC contracts. The data used Eor our analysis were obtained from a publicly available FAA report entitled Memorandum on Evaluation of National Air Transportation Inspection Program Inspection Reports, dated April 1985.
Our analysis of NAT1 inspection data shows that airlines with MAC contracts, as a qrouo, had a lower level of comnliance with FAA requlations than airlines not contracting with MAC. Specifically, we found that (1) FAA selected a higher percentage of MAC contract airlines for the more in-depth Phase II NATI inspections; (2) MAC contract airlines had a higher rate of severity level 3 comments than airlines without MAC contracts; and (3) MAC contract airlines had a higher percentage of unsatisfactory inspections than other airlines. We did not determine the reasons for differences between MAC and non-MAC contract airlines.
On May 14, 1986, during a hearing before the Subcommittee on Aviation, House Committee on Public Works and Transportation, we testified that FAA needs to improve its criteria for allocatinq inspection resources among the nation's airlines. Examples of criteria needed are those characteristics that FAA identified throuqh NAT1 that are common to airlines with safety deficiencies (see page 5). When allocating inspection resources, FAA can also use information such as the relative safety record of military contract airlines as compared to other airlines. Recently, FAA has targeted selected airlines with military contracts for intensive inspection under its new National Inspection Plan. In forthcoming reports on FAA's airline inspection program and on the manaqement of the Department of Transportation, we will address the issue of FAA's inspection planning more fully.
At the request of your ofEice, we did not ohtain official agency comments on this report. We did, however, discuss its contents with Department of Transportation and FAA officials, who agreed with the data presented. Also, as arranged with your office, unless you publicly cnnounce its contents earlier, we plan no further distribution of this report until 7 days from the date of this letter. At that time, we will provide copies to the Secretaries of the Departments of Transportation and Defense, the Administrator, FAA, and other interested parties. If you have any further questions on these matters, please contact me at 275-7783.
Sincerely yours,
Herbert R. McLure Associate Director

Contents -d-w---
Page --- SECTION
1
FIGURES
FAA SELECTED A MJJCH HIGHER PERCENTAGE OF MAC CONTRACT AIRLINES FOR PHASE II NATI INSPECTION COMPARED WITH OTHER AIRLINES 5
THE RATE OF ADVERSE COMMENTS WAS HIGHER FOR MAC CONTRACT AIRLINES THAN FOR OTHER AIRLINES
MOST AIRLINES WITH MAC CONTRACTS HAD A HIGHER RATE OF SEVERITY LEVEL 3 ADVERSE COMMENTS THAN THE MEDIAN FOR AJ,L AIRLINES
AIRJrINES WITH MAC CONTRACTS HAD A HIGHER PERCENTAGE OF UNSATISFACTORY INSPECTIONS THAN OTHER AIRLINES
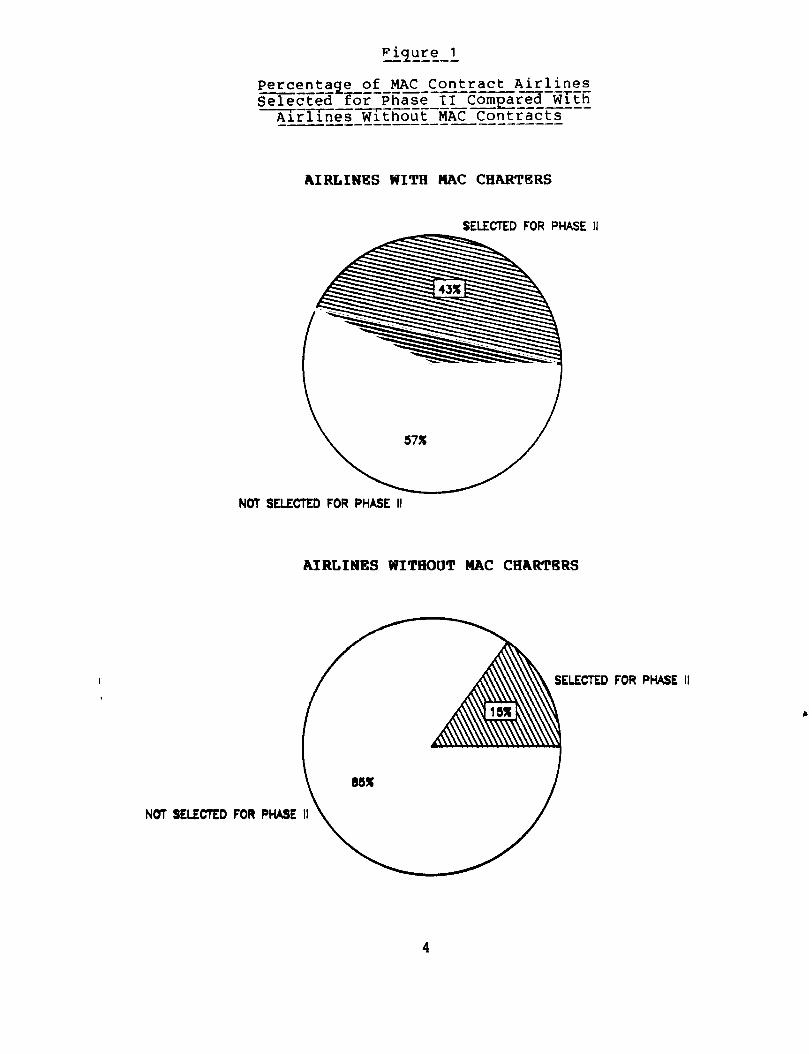
Figure 1: Percentage of MAC Contract Airlines selected for Phase II Compared With Airlines Without MAC Contracts
Figure 2: Rate of Adverse Comments for Airlines With MAC Contracts and Other Airlines
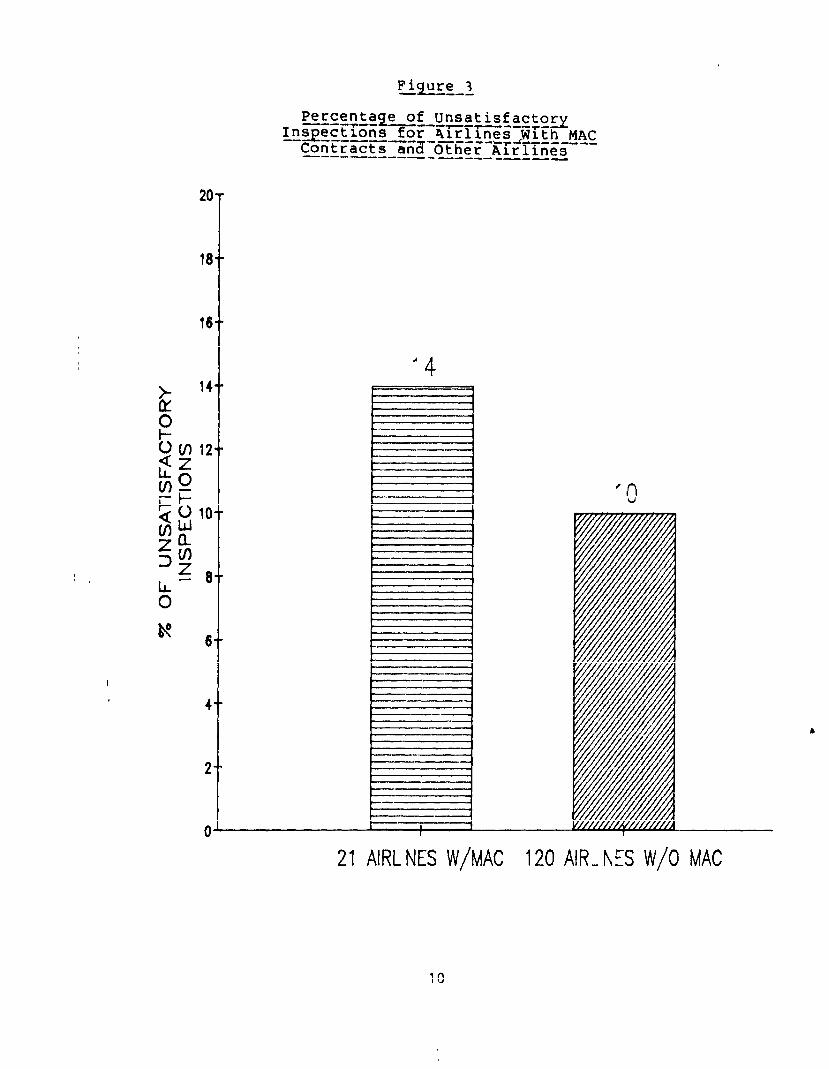
Figure 3: Percentage of Unsatisfactory Inspections for Airlines With MAC Contracts and Other Airlines
TABLES
I Table 1: Ranking of MAC Contract Airlines With Severity Level 3 Adverse Comments Above the 11.8 Median for All Airlines
Table 2: List of Part 121 Airlines According to the Rate of Severity Level 3 Adverse Comments
FAA FAR GAO MAC NAT1
ABBREVIATIONS -------
Federal 4viation Administration Federal Aviation Regulation General Accounting Office Military Airlift Command National Air Transportation Inspection
11
10
8
12
3
Ficlure 1
NOT SELECTED FOR PHASE
Percentage of MAC Contract Airlines m-w- Selected for-~~a~e-~?orn~r~ wT~E
Airrrneswr~~ut-~~ContraSts-- ---_---___- ---e -- - --____
AIRLINES WITH MAC CHARTERS
SELECTED FOR PHASE II
NOT SELECTED FOR PHASE II
AIRLINES WITHOUT MAC CHARTERS
FOR PHASE II
4

SECTION 1
FAA SELECTED A MUCH HIGHER PERCENTAGE OF MAC CONTRACT AIRLINES
FOR PHASE II NAT1 INSPECTION COMPARED WITH OTHER AIRLINES
FAA selected airlines for NAT1 Phase II in-depth inspections when deficiencies identified during Phase I of the NAT1 program proved significant enough to warrant further inspection. FAA found that many airlines selected for Phase II inspections exhibited one or more of the following characteristics. These airlines
--performed significant amounts of maintenance and training by contract;
--recently experienced a major change in the scope or type of operation, such as significant route expansion, fleet expansion, or introduction of new types of aircraft:
--experienced financial, labor/management, or other corporate problems;
--lacked internal audit procedures; or
--had management skills and philosophies incompatible with sound safety practices.
For Phase II inspection, FAA selected a total of 27 Part 121 airlines. Included in this group were 9 of the 21 airlines (43 percent) with MAC contracts. In addition, FAA selected 18 of the 120 airlines (15 percent) without MAC contracts for Phase II inspection.

Figure 2 - -----
30
25
Rate of Adverse Comments ForA~irnesWrth-~ACCon~racts --------------F-
and Other AirTine<- ---
---e---e------
SEVERIY LEVEL 1 SEVERITY LEVEL 3
SEVERITY LEVEL 2
liiiz!l WITHOUT MAC CHARTERS
El WITH MAC CHARTERS
6
SECTION 2
THE RATE OF ADVERSE COMMENTS WAS HIGHER FOR MAC
CONTRACT AIRLINES THAN FOR OTHER AIRLINES
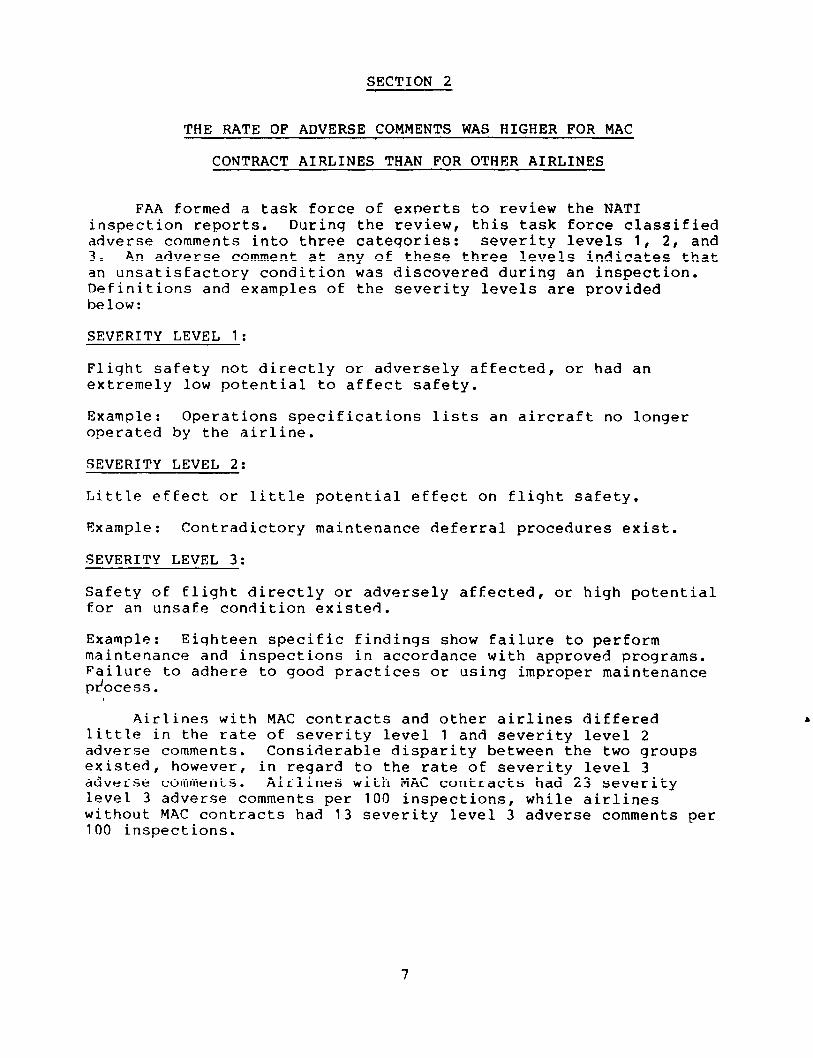
FAA formed a task force of experts to review the NAT1 inspection reports. Durinq the review, this task force classified adverse comments into three categories: severity levels 1, 2, and 3. An adverse comment at any of these three levels indicates that an unsatisEactory condition was discovered during an inspection. Definitions and examples of the severity levels are provided below:
SEVERITY LEVEL 1:
Fliqht safety not directly or adversely affected, or had an extremely low potential to affect safety.
Example: Operations specifications lists an aircraft no longer operated by the airline.
SEVERITY LEVEL 2:
Little effect or little potential effect on fliqht safety.
Example: Contradictory maintenance deferral procedures exist.
SEVERITY LEVEL 3:
Safety of flight directly or adversely affected, or high potential for an unsafe condition existed.
Example: Eiqhteen specific findinqs show failure to perform maintenance and inspections in accordance with approved programs. Failure to adhere to good practices or using improper maintenance pr'ocess.
Airlines with MAC contracts and other airlines differed little in the rate of severity level 1 and severity level 2 adverse comments. Considerable disparity between the two groups existed, however, in reqard to the rate of severity level 3 adverse comments. Airlines with MAC contracts had 23 severity level 3 adverse comments per 100 inspections, while airlines without MAC contracts had 13 severity level 3 adverse comments per 100 inspections.

Table 1
Ranking of MAC Contract Airlines With Severity Level 3 Adverse Comments Above the 11.8 Median for all Airlines
Airline
Number of severity Ranking among all level 3 adverse airlines in rate comments per 100 of severity level
inspections 3 comments
Rich International United Air Carriers Arrow Airways South Pacific Island
Airways Jet Charter Pan American Capitol International
Airways Key Airlines Flying Tiger Line Transamerica Airlines World Airways Air Resorts Eastern Airlines Hawaiian Airlines American Trans Air Evergreen International Reeve Aleutian Airways United Airlines Airlift International
119.2 4 83.3 6 69.9 9
63.2 10 45.0 13 43.5 14
35.1 30.8 26.3 25.8 23.5 22.2 21.4 19.4 17.1 16.5 14.3 13.5 12.5
24 28 34 36 38 42 45 53 57 58
6": 67
Source: FAA, Memorandum on Evaluation of National Air Transportation Inspection Program Inspection Reports, April 1985.
SECTION 3
MOST AIRLINES WITH MAC CONTRACTS HAD A HIGHER
RATE OF SEVERITY LEVEL 3 ADVERSE COMMENTS
THAN THE MEDIAN FOR ALL AIRLINES
The median rate of severity level 3 adverse comments for all airlines was 11.8 comments per 100 inspections. That is, 70 of the 141 airlines had a higher rate of adverse comments than the median of 11.8, while the remaining 70 had a lower rate than the median.
Of airlines with MAC contracts, 19 of 21 (90 percent) had higher rates of severity level 3 adverse comments than the 11.8 median for all airlines.
9
F>c&re 3 ----
20-
18.-
16--
Percentage of Unsatisfactory ----p-v w--e Inspections for \irlineii-ii~~fi MAC ------~------~r~-r------
Contracts and Other Airllnes ------- we----- --w-u
I
0-
-_I-
I
21 AIRLNES W/MAC 120 AIR-h3 W/O MAC
10
SECTION 4
AIRLINES WITH MAC CONTRACTS HAD A HIGHER PERCENTAGE OF
UNSATISFACTORY INSPECTIONS THAN OTHER AIRLINES
FAA qave NAT1 inspections an overall rating of satisfactory or unsatisfactory. The task force of retired inspectors evaluated the number and criticality of the severity codes, as well as the number of inspections performed. An overall unsatisfactory inspection rating was given when (1) there was at least one severity level 3 adverse comment, (2) there were three or more severity level 2 adverse comments, or (3) there were four or more severity level 1 comments.
For the 21 airlines with MAC contracts, the average percentage of unsatisfactory inspections was 14 percent. The 120 airlines without MAC contracts had an unsatisfactory inspection average of 10 percent.
11

Table 2
List of Part 121 Airlines Accordinq to the Rate of Severity Level 3 Adverse Ccnrnents (Airlines With Military Contracts Are in Capital Letters)
Airline
Arista International 14 57.1 164.3 Southern Flyer, Inc. 6 83.3 133.3 Air National 9 33.3 122.2 RICH INTERNATIONAL 26 50.0 119.2 Galaxy 6 50.0 116.7 UNITED AIR CARRIERS 18 50.0 83.3 Conner Airlines 9 33.3 77.8 Rrennan & Hargreaves 8 37.5 75.0 ARw3w AIRWAYS 73 41.1 69.9 SOUTH PACIFIC ISLAND AIRWAYS 19 21.1 63.2 Cam Air 43 44.2 62.8 Air North 22 40.9 59.1 Jl7t?CHARTER 20 30.0 45.0 PAN AMERICAN 184 19.6 43.5 Southern Air Transport 28 21.4 42.9 7'ower Air 10 30.0 40.0 Pacific Fast Air, Inc. 15 13.3 40.0 Viking International Airlines 33 30.3 39.4 Northeastern International 46 34.8 39.1 Horizon Air 18 22.2 38.9 Air Pat, Inc. 19 26.3 36.8 Rzople Express Airlines 129 24.0 35.7 Eaqle Aviation, Inc. 17 29.4 35.3 CAPITOL INTERNATIONAL AIRWAYS 37 24.3 35.1 Newair, Inc. 73 23.3 32.9 Markair 28 25.0 32.1 Aloha Airlines 22 13.6 31.8 KEY AIRLINES 13 15.4 30.8 Buffalo Airways 10 30.0 30.0 Flnerald Air 71 22.5 29.6 Air Florida, Inc. 42 21.4 28.6 Caribbean Air Services 7 28.6 28.6 msenbalm Aviation 30 16.7 26.7 FLYING TIGER LINE 114 15.8 26.3 Aspen Airways 23 13.0 26.1 TRANSAMERICA AIRLINES 62 16.1 25.8 Jet America 35 22.9 25.7 WRLD AIRWAYS 34 17.6 23.5 Air North, Inc. 70 12.9 22.9 Excellair, Inc. 22 18.2 22.7 combs Freightair/Front Co. 58 24.1 22.4 AIR RESORTS 18 55.6 22.2
Numberof inspections
Percentage of unsatisfactory
inspections
Rate of severity level 3 carments
Had military contract
12

Airline
Continental Airlines FB-S-Aire FX3I'EBN AIRLINES Marco Island Airways Provincetown-Boston i3ar Harbr Air California Surnnit Airways Rio Airways T-fUrd Air HAWAIIAN AIRLINES International Air Service Florida West Airlines Alaska Airlines AMERICANTRANS AIR EYEFGREXN INTERNATICMAL Wright REEVE AIXUTIAN AImAyS Ftxedan Airlines Facific Southwest UVITED AIRLJWES Frontier Airlines, Inc. Delta Airlines Wings West ATI?LII?T INTERNATIONAL WS Air, Inc. Best Airlines Sea Airmotive, Inc. Air Che Ransome Airlines Southwest Airlines Co. Lincoln Atlantic Southeast Chaparral Airlines TransrCentral Airlines Imperial Airlines Frovidence Air Virginia, Inc. Muse Air Corp. Fiestern Midway Airlines Atlantic csllf Airlines Coastal Airlines, Inc. Air Atlanta, Tnc. byale Airlines, Inc. Rritt Airlines NORTRWRSTAIRLINES, INC. Simmons Airlines, Inc.
Percentageof Numberof unsatisfactory
inspections
271 23
384 19
157 al 43 39
144 5
36 48 11 66
;9' a7
7 35 50
384 113 433
31
3:: 24 33
1:: 113
26 44 a9 ai 28
ii': 41
113 52 32 11 33
221 213 238
a3
13
inspections
16.2 13.0 14.8 15.8 15.9 14.8 11.6 15.4 14.6 40.0 19.4 14.6 13.6 12.1
8.6 10.1 11.5 14.3 14.3 6.0 9.6 a.8
10.9 9.7
12.5 8.6
12.5 6.1 7.8 9.8 9.7
15.4 6.6 9.0 8.6
10.7 30.0 11.0
4.9 15.9
7.7 15.6
69:; 6.8 9.4 5.9
10.8
Rate of severity level 3 cxfrments
21.8 21.7 21.4 21.1 21.0 21.0 20.9 20.5 20.1 20.0 19.4 18.8 la.2 18.2 17.1 16.5 14.9 14.3 14.3 14.0 13.5 13.3 13.2 12.9 12.5 12.5 12.5 12.1 11.8 11.6 11.5 11.5 11.4 11.2 11.1 10.7 10.0 9.9 9.a 9.7 9.6 9.4 9.1 9.1 9.0 a.9 a.4 8.4
Had military mntract

Airline
Percentage of Number of unsatisfactory
inspections inspections
Jet Fleet Corp. 12 M-IL Cargo/Air ePlynesia 25 Frontier Horizon 25 America West 51 Braniff, Inc. la4 Air Illinois 14 Gulf Air Transport 15 Fisher Brothers Aviation 31 Piedmont 170 SMB Stage Lines 47 &public Airlines 315 Ocean Air 33 Surburban Airlines 99 Pennsylvania Airlines 98 Pilgram 88 Wien Air Alaska 36 Sunworld Intl Airways 21 American Airlines, Inc. 450 Metro Airlines 171 TRANS WDRLD AIRLINES, INC. 283 Cascade Airways, Inc. 44 American International Air, Inc. 50 Rocky Mountain Airlines 27 Puerto Rico International Airlines 83 Federal Express 112 New York Air 88 Interstate Airlines 31
j Orion 64 Zantop International Airlines 66 Ryan Aviation Corp. 43 Ozark Airlines 158 Sun Country 13 Florida Express 28 Challenge Air Transfer 13 AiraWisconsin 60 Basler Flight Service 1 Pacific Alaska Airlines 17 Bangor International 5 Sierra Pacific Airlines 7 Blue Bell 7 Trans Air Link 11 Airborne Express, Inc. 78 Jet East 12 Pacific Air Express 19 Trans Florida Airline All Star
a.3 a.0 a.0 7.8 6.0 7.1 6.7 6.5 7.1 4.3 3.8 6.1 7.1 6.1 6.8
11.1 14.3 4.0 5.8 4.2 4.5
12.0 3.7 3.6 1.8
la.2 3.2 6.3 4.5 2.4 1.3 7.7 3.6 0.0 1.7 0.0 0.0 0.0 0.0
14.3 0.0 0.0
0"::
i::
Rate of severity level 3 carments
Bad military contract
a.3 No a.0 No a.0 No 7.8 No 7.6 No 7.1 No 6.7 No 6.5 No 6.5 No 6.4 No 6.3 No 6.1 No 6.1 No 6.1 No 5.7 No 5.6 No 4.8 No 4.7 No 4.7 No 4.6 YES 4.5 No 4.0 No 3.7 No 3.6 No 3.6 No 3.4 NO. 3.2 No 3.1 No 3.0 No 2.4 No 1.3 No 0.0 No 0.0 No 0.0 No 0.0 No 0.0 No 0.0 No 0.0 No 0.0 No 0.0 No 0.0 No 0.0 w 0.0 No 0.0 No 0.0 No 0.0 No
14
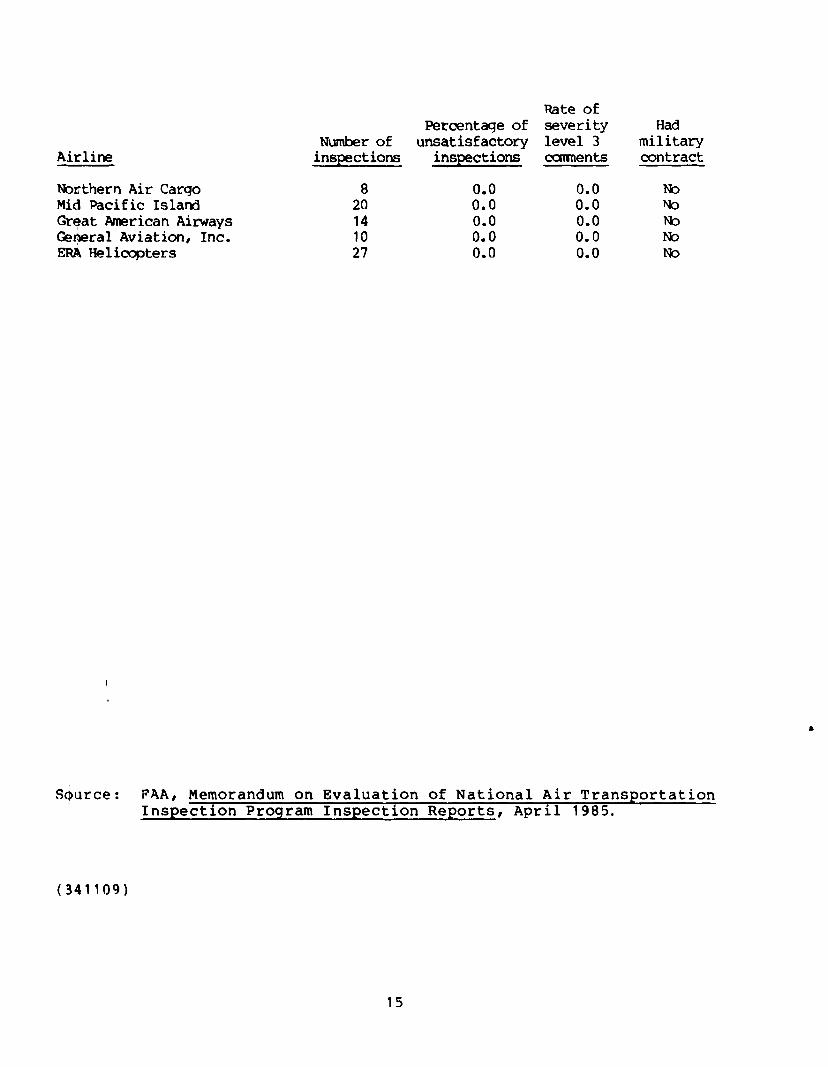
Airline
Nol;thern Air Cargo Mid Pacific Island Grqat American Airways Ger$eral Aviation, Inc. ERA Helicopters
Percentage of Numberof unsatisfactory
inspections inspections
a 0.0 20 0.0 14 0.0 10 0.0 27 0.0
Rate of severity level 3 canner&
0.0 0.0 0.0 0.0 0.0
Had military contract
No No No No No
S&urce: FAA, Memorandum on Evaluation of National Air Transportation Inspection Program Inspection Reports, April 1985.
($41109)
15

Hequests for coplcs of GAO reports shonld bc sent to:
ITS General Accounting Office Post Office ISox 60 15 Gait hersburg, Maryland 20877
Telephone 202-275-6241
The first five copies of each report are free. Additional copies are $2.00 each.
There is a 25% discount on orders for 100 or more copies mailed to a single address.
Orders must be prepaid by cash or by check or money order made out to the Superintendent of Documents
United States General Accounting Offke Washington, D.C. 20548
Official Business Penalty for Private Use $300
Address Correction Requested
*