rc 163170 - cornerstone annual... · 5 corporate information contd. 2016 annual report &...
TRANSCRIPT

21, Water Corporation Drive, Off Ligali Ayorinde Street, Victoria Island, Lagos.
Tel: 012806500 Web: www.cornerstone.com.ng
Email: [email protected]
RC 163170
2016ANNUAL REPORT & ACCOUNTS
PROFESSIONALISM

30
Risk Management Declaration
Financial Statements63Consolidated and Separate Statement of Financial Position
Statement of Cash Flows68
Takaful Life Business Revenue Account73
Notes to the Consolidated and Separate Financial Statements
75
Dividend History145
Results at a Glance
Chairman’s Statement
Corporate Governance Report
Complaints and Feedback
Statement of Changes in Equity

2
NOTICE OF ANNUAL GENERAL MEETING 2016 Annual Report & Accounts
ORDINARY BUSINESS
1. To receive the Audited Financial Statements of the Company for the year ended December 31, 2016 together with the Reports of the Directors, Auditors and Audit Committee thereon;
2. To elect and re-elect Directors;
3. To authorise the Directors to fix the remuneration of the Auditors;
4. To elect shareholders' representatives to the Audit Committee; and
5. To consider and if thought fit, pass the following resolution as an ordinary resolution of which Special Notice has been given in accordance with Section 364 (1) (a) of the Companies and Allied Matters Act, CAP C20, LFN, 2004:
“that Messrs. Akintola Williams Deloitte, shall retire as Auditors of the Company in line with Section 8 (iii) of the NAICOM Code of Corporate Governance and in their stead, Messrs, KPMG Professional Services be and are hereby appointed as Auditors of the Company.
SPECIAL BUSINESS
6. To consider and if thought fit, pass the following as an ordinary resolution:
Approval of Related Party Transactions
“That a General Mandate be and is hereby given to the Company to enter into recurrent transactions with related parties for the Company's day-to-day operations, including the procurement of goods and services, on normal commercial terms in compliance with the Nigerian Stock Exchange Rules Governing Transactions with Related Parties or Interested Persons.”
PROXY A member entitled to attend and vote at the Annual General Meeting may appoint a proxy to attend and vote in his/her stead. A proxy need not be a member of the Company. A form of proxy is attached to the Annual Report and if intended to be used, it must be executed and returned to the office of the Registrars, Lighthouse Registrars Limited, Kingsway Building (3rd Floor) 2/4, Davis Street, Lagos or the office of the Company Secretary, PAC Solicitors, 16, Kofo Abayomi Street, Victoria Island, Lagos, not later than 48 hours before the time fixed for the meeting.
NOTES
1. CLOSURE OF REGISTER OF MEMBERS AND TRANSFER BOOKS
The Register of Members and Transfer Books of the Company will be closed from June 5 to June 9, 2017 (both days inclusive) to enable the Registrar update the Register of members.
2. AUDIT COMMITTEE• Pursuant to Section 359(5) of the Companies and
Allied Matters Act 2004, any Shareholder may nominate another shareholder for appointment to the Audit Committee by giving notice in writing of such nomination to the Company Secretary at least Twenty One (21) days before the Annual General Meeting.
• Please note that The Code of Corporate Governance for Public Companies issued by the Securities and Exchange Commission provides that members of the Audit Committee should be financially literate and able to read financial statements. We therefore request that all nominations to the Audit Committee should be accompanied with the Curriculum Vitae of the Nominees.
3. ELECTION/RE-ELECTION OF DIRECTORS
3.1. Election of Directorsi. To elect Mr. Ekwunife Okoli as a non-executive
independent Director with effect from 22 July, nd
2016;ii. To elect Ms. Elizabeth Amadiume as a non-
executive independent Director with effect from 21 October, 2016;st
iii. To elect Mr. Anthony Egbuna as a non-executive Director with effect from 21 October, 2016;st
iv. To elect Mr. Segun Adebanji as a non-executive Director with effect from 28 April, 2017th
The profiles of the Directors are contained in the Annual Report and Accounts.
3.2. Re-election of Directors Pursuant to Section 259 (1) of the Companies and
Allied Matters Act, CAP C20, LFN, 2004, the Directors to retire by rotation are Mr. Ayo Osunbunmi, Mr. Dominic Ichaba and Mr. Steve Iwenjora.
Their profiles are contained in the Annual Reports and Accounts and are also available for viewing on www.cornerstone.com.ng
NOTICE IS HEREBY GIVEN that the Twenty Fifth Annual General Meeting of Cornerstone Insurance PLC will hold at ththe Agip Recital Hall, MUSON Centre, Onikan, Lagos on Thursday, June 15 , 2017 at 11.00am to transact the following
businesses:
3
TABLE OF CONTENT2016 Annual Report & AccountsNOTICE OF ANNUAL GENERAL MEETING CONTD.
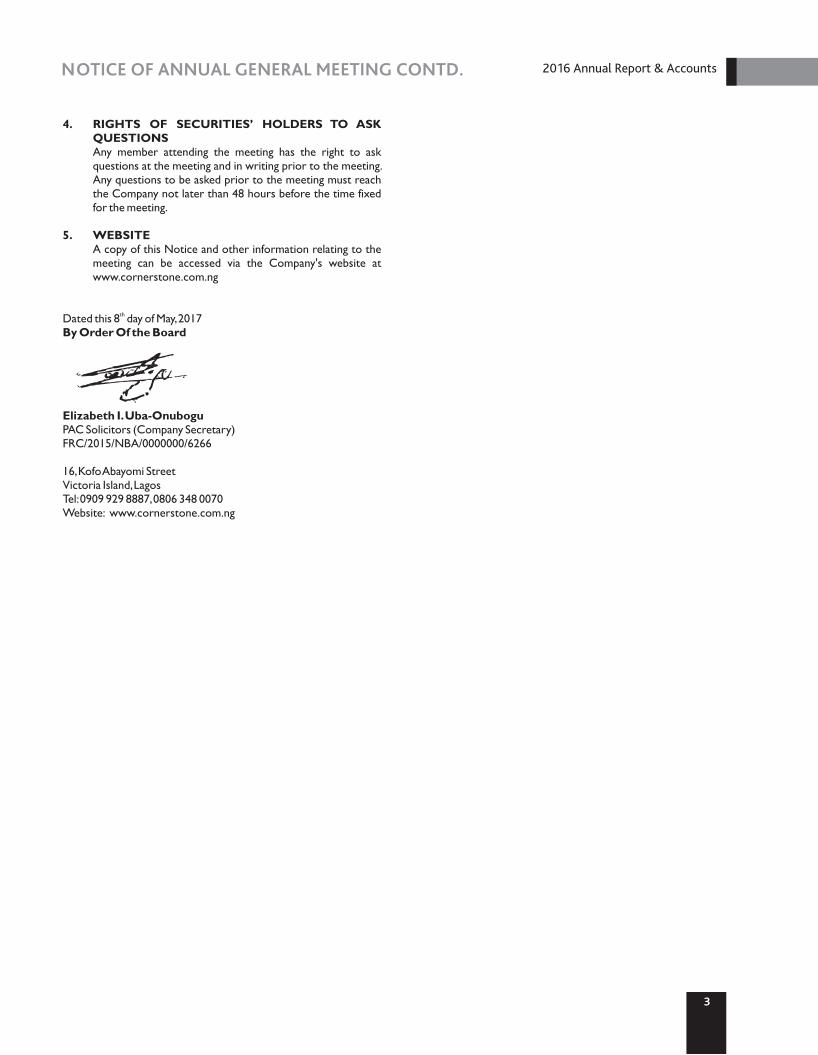
4. RIGHTS OF SECURITIES’ HOLDERS TO ASK QUESTIONS
Any member attending the meeting has the right to ask questions at the meeting and in writing prior to the meeting. Any questions to be asked prior to the meeting must reach the Company not later than 48 hours before the time fixed for the meeting.
5. WEBSITE A copy of this Notice and other information relating to the
meeting can be accessed via the Company's website at www.cornerstone.com.ng
thDated this 8 day of May, 2017By Order Of the Board
Elizabeth I. Uba-Onubogu PAC Solicitors (Company Secretary) FRC/2015/NBA/0000000/6266
16, Kofo Abayomi Street Victoria Island, Lagos Tel: 0909 929 8887, 0806 348 0070Website: www.cornerstone.com.ng

2016 Annual Report & Accounts
TABLE OF CONTENTCORPORATE INFORMATION
BOARD OF DIRECTORS Mr. Segun AdebanjiMr. Paul KokorichaMr. Adedotun Sulaiman (MFR) Mr. Richard IkiebeMr. Ganiyu Musa Mr. Oladapo EgbeyemiAlhaji Hussaini AbdulrahmanMr. Peter Ameadaji (Alternate)Mr. Dominic IchabaMr Steve IwenjoraMrs. Ndidi Okonkwo Nwuneli (MFR) Mr. Ekwunife OkoliMs. Elizabeth AmadiumeMr. Anthony EgbunaMr. Tokunbo BelloMr. Ayo Osunbunmi
Group Chairman( From April 28, 2017)Group Chairman( From October, 2016 to April 2017)Group Chairman( Retired September, 2016)Vice Chairman( Retired March 2016)Group Managing Director/CEONon-executive Director( Retired March, 2016)Non-executive Director( Retired March, 2016)Non-executive Director( Retired March, 2016)Non-Executive DirectorNon-Executive DirectorIndependent Director(Resigned December 2016)Independent Director( Appointed July 22, 2016)Independent Director( Appointed October 21, 2016)Non-Executive Director(appointed October 21, 2016)Executive DirectorExecutive Director
LEGAL ADVISER Ifeoma Utah21, Water Corporation Drive, Off Ligali Ayorinde Street, Victoria Island, Lagos
COMPANY SECRETARY PAC Solicitors16 Kofo Abayomi Street, Victoria Island, Lagos.Tel: +234-805-056-9557, +234(01)7611191, +234(01) 2701121,+234(01)8980746
REGISTERED OFFICE: 136, Lewis Street, Lagos. Tel:01-0126332863, 2630722,2631832 (Lagos Island Office)Website: www.cornerstone.com.ng
CORPORATE HEAD OFFICE: 21, Water Corporation Drive, Off Ligali Ayorinde Street, Victoria Island, LagosTel: 01-2806500 Website: www.cornerstone.com.ngEmail: [email protected]
1) 136, Lewis Street, Lagos. Tel:01-2632863,2630722,2631832(Lagos Island Office)2) 79, Allen Avenue(Samsung House) Ikeja, Lagos. Tel: 0802306981,01-81829843) Polysonic Mall(2nd Floor)42/44, Warehouse Road, Apapa, Lagos. Tel: 08033911435,070288565894) 191, Herbert Macaulay Street, Yaba.5) Idowu Tailor, Victoria Island Lagos
LAGOS BRANCHES:
OTHER BRANCHES 1) KM 20, Constitution Road, Kaduna Tel:070292341552) 67, Aboderin Layout, Oni& Sons Area, Ring Road, Ibadan Tel:02-87356493) 180, Aba Express Road, Port Harcourt Tel: 07029325494, 080569384544) Plot 487, Adetokunbo Ademola Str., Wuse II, Abuja Tel: 09-87766611,070284155415) Suite 7, No.5, Bank Road, Kano Tel:064-913241,064-9255786) 57, Effurun / Sapele Road, Effurun-Warri, Delta State Tel:070290663137) 110, Muritala Muhammed Highway, Calabar Municipality, Calabar, Cross Rivers State. Tel: 087-845147,080569384548) Agbeloba Buildin. 56, Quarry Road, Abeokuta, Ogun State. Tel:01-73630429) 3, Sokoto Road, Sabo Oke, Ilorin, Kwara State. Tel: 080595581032
4
2016 Annual Report & Accounts
5
CORPORATE INFORMATION CONTD. 2016 Annual Report & Accounts
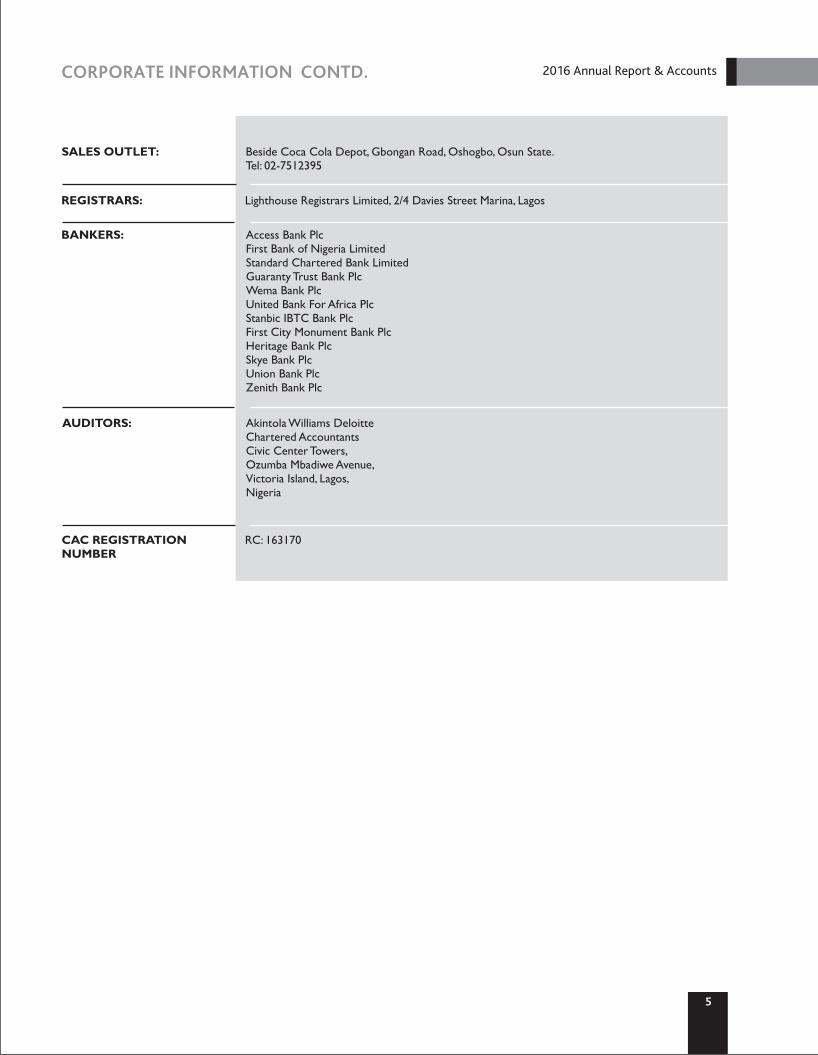
SALES OUTLET: Beside Coca Cola Depot, Gbongan Road, Oshogbo, Osun State. Tel: 02-7512395
REGISTRARS: Lighthouse Registrars Limited, 2/4 Davies Street Marina, Lagos
BANKERS: Access Bank PlcFirst Bank of Nigeria LimitedStandard Chartered Bank LimitedGuaranty Trust Bank PlcWema Bank PlcUnited Bank For Africa PlcStanbic IBTC Bank PlcFirst City Monument Bank PlcHeritage Bank PlcSkye Bank PlcUnion Bank PlcZenith Bank Plc
AUDITORS: Akintola Williams DeloitteChartered AccountantsCivic Center Towers,Ozumba Mbadiwe Avenue, Victoria Island, Lagos,Nigeria
CAC REGISTRATION NUMBER
RC: 163170
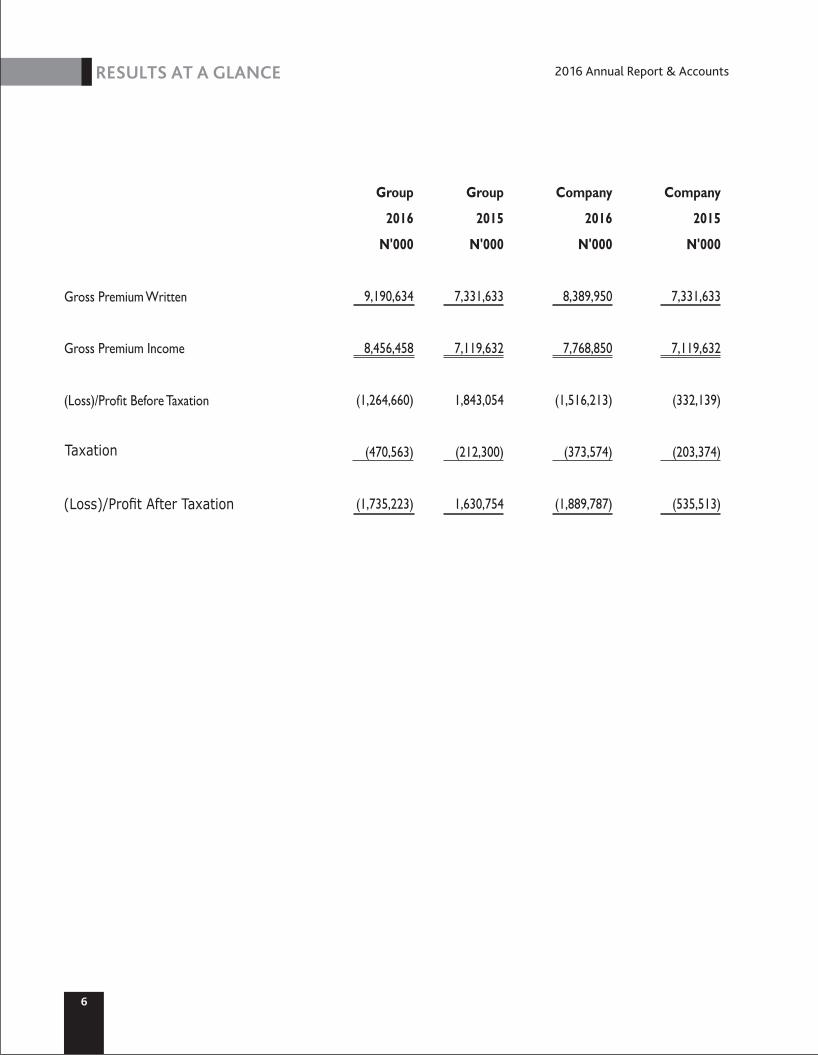
TABLE OF CONTENT
6
RESULTS AT A GLANCE 2016 Annual Report & Accounts
Group
2016
N'000
9,190,634
8,456,458
(1,264,660)
(470,563)
(1,735,223)
Group
2015
N'000
7,331,633
7,119,632
1,843,054
(212,300)
1,630,754
Company
2016
N'000
8,389,950
7,768,850
(1,516,213)
(373,574)
(1,889,787)
Company
2015
N'000
7,331,633
7,119,632
(332,139)
(203,374)
(535,513)
Gross Premium Written
Gross Premium Income
(Loss)/Profit Before Taxation
Taxation
(Loss)/Profit After Taxation

CHAIRMAN’SSTATEMENT

CHAIRMAN’S STATEMENT 2016 Annual Report & Accounts
28
MR. PAUL KOKORICHA Outgoing Group Chairman
MR. SEGUN ADEBANJIGroup Chairman

TABLE OF CONTENT
9
CHAIRMAN’S STATEMENT CONTD. 2016 Annual Report & Accounts
Distinguished shareholders, members of the Board of Directors, thinvited guests, ladies and gentlemen. I welcome you all to the 25
Annual General Meeting of our Company, Cornerstone Insurance PLC (“the Company”). I hereby present to you the Annual Report and accounts for the financial year ended 31 December, 2016 as well as an overview of the major developments that shaped our financial results.
The Global EconomyPerhaps two of the most significant socio-political events of the year occurred in the United Kingdom (UK) and the United States (US). A referendum on European Union (EU) membership resulted in a 52% vote in favour of the UK leaving the EU while Donald Trump emerged winner of the US Presidential election.
The “Brexit” vote created immediate economic shocks that reverberated globally, as the UK currency experienced an initial 11% drop in value; the largest in the era of free-floating currencies and over USD$2 trillion in value was lost in stocks globally. Later in the year, President Trump's nationalist posture signified possible changes to the Trans-Pacific Partnership Agreement (TPPA) which would have accounted for a third of global trade. This development altered the dynamics of the economic and political landscape in Asia. The eventual withdrawal of the US from the TPPA is expected to provide China a great opportunity to consolidate its influence in the region and bolster its economic recovery.
A number of African countries saw their currencies weaken as the US Federal Reserve raised interest rates by 0.25% to 1% late in the year. With significant dollar-denominated bonds and high debt to GDP ratios, countries like Ghana, South Africa, Kenya and Tunisia face tough economic challenges.
Despite the volatility however, the world economy still grew by an estimated 3.1%, a slight reduction from the 3.2% achieved in 2015 due mainly to weaker-than-expected growth in the United States and uncertainties regarding the institutional and trade arrangements between the European Union and post-Brexit United Kingdom. Growth in emerging markets and developing economies remained subdued as commodity exporters struggled. Whilst emerging Asia continued to register strong growth and slight improvements recorded in recession-hit Brazil and Russia, activity weakened in sub-Saharan Africa as South Africa continued to grapple with severe unemployment while resource-rich Nigeria faced severe economic and security challenges.
Macroeconomic ReviewBefore the start of the year, analysts and macroeconomic commentators alike were largely unanimous in projecting a negative outlook for the Nigerian economy in 2016. Indeed, the first quarter of the year ended with a GDP contraction of -0.36%. This was off the back of lower economic activity and depressed foreign exchange (forex) earnings caused in part by a 22% drop in the average price of Bonny Light compared to the previous quarter (US$34.39 per barrel from US$44.08 per barrel).
Moreover, renewed militancy in large parts of some oil producing states, characterized by the destruction of pipelines and other related infrastructures, further lowered the country's output and earning capacity. Crude oil production dropped by 3.7% in Q1 2016 from 1.89 million barrels per day in the previous quarter to
1.82 million barrels per day. By the end of the second quarter, Nigeria had recorded two consecutive quarters of contraction (-2.06% in Q2) and for the first time in 29 years, the economy was officially in a recession.
Among other factors, the sharp drop in forex income, in an import dependent economy, played a major role in the decline of the value of the Naira. With increasing pressure on forex reserves, the Central Bank of Nigeria (CBN) resorted to controlling demand for forex through multiple exchange rates and a series of circulars to market operators while also attempting to checkmate nefarious activities in the forex markets.
With the gap between the official and parallel exchange rates widening to as much as N50 in Q2, a devaluation of the currency was inevitable and in June 2016, the CBN announced a new forex policy which was effectively a devaluation. The start of the managed float regime saw the official rate of the Naira plummet by 29% from the peg of N197/US$1 to N254/US$1 within 24 hours. By the end of the second half of the year and after periodic interventions, the official exchange rate stood at N304/US$1 while the parallel market rate continued to rise and closed the year at N490/US$1, creating a gap of N186 or 61%. Higher rates of forex and higher costs of importation dovetailed into rising prices. The Consumer Price Index (CPI), which started the year in single digits, at 9.62%, inched upwards month on month and ended the year at 18.55%, an 11-year high. The key drivers of the almost 100% rise in the inflation rate (Year on Year) were electricity, fuel prices and road transportation.
Amidst the harsh economic climate, the President presented an expansionary 2016 budget of N6.07 trillion with a 30% allocation towards capital expenditure and N200 billion allocated to special intervention programmes at the grass root level.
In summary, the macroeconomic environment was characterised by thinner margins for most corporations in the manufacturing and FMCG industries. It was a year characterised more by incremental growth and cost control measures than by capacity expansion projects. For the average Nigerian, the year was one of shrinking disposable incomes caused by sharp price increases of imported and locally produced household items. Asset acquisition gave way to asset consolidation and reduced discretionary expenses.
The magnitude of the economic downturn had a significant adverse impact on insurance. The rapid rise in prices of goods and services was particularly detrimental to the insurance industry. Not only did this affect the ability of customers to pay premiums, the claims ratios increased astronomically as replacement costs for items lost or damaged were disproportionate to the premiums collected for contracts written in the prior 12 months.
The Insurance IndustryNotwithstanding the overall macroeconomic outlook, there was justifiable reason for cautious optimism for the insurance industry at the beginning of the year. An expansionary budget focused on infrastructure spending could open additional insurance opportunities whilst a business friendly regulatory and consultative regulatory framework would create an enabling environment for innovation and growth.

10
CHAIRMAN’S STATEMENT CONTD. 2016 Annual Report & Accounts
During the year, the Insurance regulator, the National Insurance Commission (NAICOM) announced that guidelines were being drafted for new alternative distribution channels. NAICOM, through the Nigerian Bar Association and members of the Nigerian Stock Exchange commenced discussions with stakeholders to design structures for the distribution of Insurance products. It is expected that the new channels will act as referral channels only and will not be involved in the actual sale of insurance products. Nonetheless, when launched, the new channels are expected to have a significant impact by increasing insurance penetration in the country. A l so i n t h e distribution space, there were a number of regulatory interventions that addressed breaches in commission payments to unlicensed intermediaries. The Commission suspended all distribution partnerships with banks, telco's, airlines and web-based aggregators that were in violation of Section 34 of the Insurance Act 2003.
Company Financial PerformanceThe harsh economic climate notwithstanding, your Company has sustained its growth trajectory by growing Gross Premium Written by 25% to N9.1 billion from N7.3 billion in 2015. Sales to retail customers accounted for 25% of premiums while Special Risks products to the Oil & Gas and Engineering sectors contributed the second highest proportion at 23%. The increased financial strength from the conclusion of the acquisition of Fin Insurance and their growing reputation as a credible partner is now opening the opportunity for leadership position on major transactions as well as provide support for our retail expansion.
However, high claims inflation and the security challenges in the North East and South-South zones of the country led to a significant deterioration in the claims experience during the year under review. Gross claims for the year totalled N4.5 billion representing an increase of 61% from the previous year of N2.8 billion, driven largely by death claims from the group life, credit life and third party motor classes of insurance. The company has since carried out a comprehensive portfolio review and corrective actions have been taken to improve terms and conditions, reduce participation or exit the business as appropriate.
Net investment income increased by 98%, from N.74 billion to N1.47 billion, mainly due to the consolidation of the investment income of the subsidiary. The unlisted equities portfolio suffered significant impairment while the financial commitment on our new head office building constrained the liquidity that would have benefited from attractive yields on short term instruments. Similarly, the rising cost of goods and services, coupled with the first-time consolidation of the operations of the subsidiary led to a 45% increase in management expenses. Significant investments are being made in improving the technology and distribution infrastructure to support the company's retail strategy. Indeed, the agency network almost doubled from 832 to 1,600 agents while a robust platform has been built for the rollout of the bancassurance channel. While these costs are being accounted for in the current financial statements, we expect the benefits to accrue over several accounting periods.
As a result, despite the modest growth in revenue, the combined effects of the harsh macroeconomic environment, high claims cost, rising inflation and benign investment income have led to a
reported Loss before Tax of N1.26 billion (2015: N1.52billion). Understandably, this is a matter of much disappointment for all our shareholders, the Board and management.
Board of DirectorsOn the 2 of April, 2017, I assumed the role of Chairman of the th8Board of Directors. This follows the retirement of the erstwhile Chairman, Mr. Paul Kokoricha who took over as Chairman from Mr. Adedotun Sulaiman. Mr. Adedotun Sula iman and Mr. Paul Kokoricha retired in line with the Code of Corporate Governance issued by NAICOM. As Mr. Sulaiman informed you at the last Annual General Meeting, four other members of the Board of Directors (Mr. Richard Ikiebe who served as Vice Chairman, Mr. Peter Ameadaji, Alhaji Hussaini Abdulrahman and Mr. Oladapo Egbeyemi) had also retired in line with the NAICOM Code of Corporate Governance.
In December 2016, Mrs. Ndidi Okonkwo Nwuneli resigned as an Independent Non-Executive Director to pursue other interests and attend to other commitments.
I would like to express my thanks to each of them for the professionalism and dedication they have demonstrated throughout the time they served on the Board and the contribution that they have made to the Company. I wish them the best in their future endeavours.
On July 22 2016, Mr. Ekwunife Okoli was appointed as an nd
Independent Non-Executive Director. He has proved a strong and positive fit to the Board, bringing new perspective to Board deliberations.
On October 2 2016, Ms. Elizabeth Amadiume and Mr. Anthony st1Egbuna joined the Board as Independent Non-Executive Director and Non-Executive Director respectively. They are all highly qualified and seasoned professionals and their appointments will bring a renewed dynamism to the Board. They will be presented to you for election at this Annual General Meeting.
OutlookEven though the country is not out of recession yet, the early signs give cause for cautious optimism that the worst may be over and economic activity may begin to improve. The rise in international crude oil prices above the US$50 per barrel mark bolstered foreign exchange reserves more than US$30 billion towards the tail end of Q1 2017. The CBN has directed an ample proportion of the reserves towards defending the Naira.
The proposed 2017 Federal budget of N7.29 trillion is a strong indication that President Buhari is committed to turning the economy around during the year. As in 2016, 30% (N2.24 trillion) of the expenditure will go towards capital projects of which N791 billion will be allocated to infrastructure projects in the Power, Works Housing and Transport sectors.
In a bid to address the root causes of the economic downturn, the Federal Government also unveiled a 4-year Economic Recovery and Growth Plan with one of its objectives being to achieve macroeconomic stability and economic diversification. The plan projects a 2.19% growth in GDP in 2017, reaching 7% by 2020. The full effects of the government's plans would have trickled down by

the second half of the year and economic activity is expected to pick up by then.
We have also seen early signs of greater collaboration amongst the financial services regulators which should lead to the satisfactory resolution of impediments in the areas of new products and distribution channels, especially bancassurance and annuity. Overall, I would say that the prospects for the Insurance industry are slightly positive with potential for moderate growth.
The Board of Directors and the management of your Company have also put in place additional cost management and revenue enhancement measures to ensure a quick return to profitability. Strict cost control measures on management expenses have been put in place and will be closely monitored as the year progresses.
There are also ongoing efforts to diversify sources of revenue into allied industries with higher profit margins. The Company made significant progress on our new Head Office under construction. When completed, we will operate from a complex befitting our status as a leading insurance player as well as obtain investment income from lettable floors.
I would like to conclude by appreciating our valued customers and their intermediaries for their continued patronage, as we hope to continue to provide effective solutions to your financial needs.
May God bless Cornerstone Insurance plc.
MR. SEGUN ADEBANJIGroup Chairman
CHAIRMAN’S STATEMENT CONTD. 2016 Annual Report & Accounts
11

REPORT
CORPORATE GOVERNANCEAs at 31st December, 2016

14
BOARD OF DIRECTORS 2016 Annual Report & Accounts
SEGUN ADEBANJIGROUP CHAIRMAN
Mr. Segun Adebanji, has had over 35 years working experience in blue chip companies. Prior to joining Africa Capital Alliance in January 2011, Mr. Segun Adebanji was the Executive Vice Chairman of Alvac Company Limited. Mr. Segun Adebanji's working experience includes UAC and Unilever PLC London and South Africa. He has served as Financial Director of Nigerian Breweries PLC and later Managing Director, Heineken Ghana Breweries and Namibia Breweries. Mr. Adebanji is a non-Executive Director of Nigerian Breweries Plc and Chairman, Bevpak Nigeria Limited. He is a Fellow of both the Chartered Association of Certified Accountants and the Institute of Chartered Accountants of Nigeria.
* thMr. Segun Adebanji was appointed as Chairman of the Board effective 28 April, 2017.
PAUL KOKORICHANON-EXECUTIVE DIRECTOR
Mr. Paul Kokoricha is an Executive Partner at African Capital Alliance and has over Thirty Years' experience in the financial services industry.
Mr. Paul Kokoricha holds a Bachelor of Science Degree, Second Class Upper Division in Economics and won the Departmental Prize for the Best Graduating Student in Economics in 1982 from the University of Nigeria, Nsukka. He is a Fellow of the Institute of Chartered Accountants of Nigeria.
* rdMr. Paul Kokoricha resigned from the Board as Chairman effective 23 April, 2017.
GANIYU MUSAMANAGING DIRECTOR
Mr. Ganiyu Musa worked at African Reinsurance Corporation for 19 years in various capacities including Director of Finance & Accounts/Chief Financial Officer for 10 years and Deputy Managing Director, Services for 5 years.
Mr. Ganiyu Musa is a highly experienced management professional with diversified experience in insurance, reinsurance, audit, consulting and financial management. He has over 27 years working experience and has served in different capacities at Pannell Kerr Forster, a firm of Chartered Accountants, Arthur Andersen and African Reinsurance Corporation.
He holds a Bachelor of Science degree in Business Administration and a Masters in Banking and Finance degree, both from the University of Lagos. He is a Fellow of the Institute of Chartered Accountants of Nigeria. He is also a Member of the Chartered Insurance Institute of London and a Senior Member of the Chartered Insurance Institute of Nigeria.
DOMINIC ICHABANON – EXECUTIVE DIRECTOR
Mr. Dominic Ichaba a former Managing Director of Cornerstone Insurance PLC, is a Legal Practitioner and a Chartered Stockbroker. He has experience in Banking, Insurance, Strategy development and Human Resources Management.
He is a graduate of the Ahmadu Bello University, Zaria and the Nigerian Law School and holds a Masters Degree in Business Administration. He is also an alumnus of the London Business School, the I.E.S.E Business School, Barcelona and the Wharton School, USA.

15
BOARD OF DIRECTORS’ PROFILE 2016 Annual Report & Accounts
STEVE IWENJORANON – EXECUTIVE DIRECTOR
Mr. Steve Iwenjora has over 17 years cognate experience in the financial services sector, spanning banking, private equity and investment management with local and international organisations. He is presently the Managing Director of CAN Fund Manager Limited, a Company under African Capital Alliance (ACA). He worked with Citi Bank and Continental Trust Bank before joining ACA in 2004. He is a Fellow of the Institute of Chartered Accountants of Nigeria and holds a Bachelors Degree in Accounting (2nd Class Upper Division) from the University of Lagos.
EKWUNIFE OKOLINON-EXECUTIVE INDEPENDENT DIRECTOR
Mr. Ekwunife Okoli has over 30 years consumer goods industry experience in a wide cross section of over 20 African countries including Nigeria, Ghana, Cameroun, Ethiopia, Angola and Mozambique among others.
Mr. Ekwunife Okoli worked with Diageo for many years and served in different capacities including as Managing Director, Guinness Ghana, Managing Director, Guinness Cameroun, Marketing Director, Guinness Nigeria PLC and Guinness Brand Director, Africa with the last 10 years as CEO of large consumer goods markets and the last 4 years as a Regional Managing Director and acquired strong FMCG commercial and Brand Marketing experience at Diageo.
He possesses significant corporate governance experience especially in difficult geographies and has held executive and non-executive board positions in various Diageo subsidiaries including Guinness Nigeria PLC, Guinness Ghana and Seychelles Breweries Limited. He is very passionate about Africa and its potential business and social opportunities and is currently the founder of Advantage Consult Limited. * ndHe was appointed to the Board with effect from 22 July, 2016.
ELIZABETH AMADIUMENON-EXECUTIVE INDEPENDENT DIRECTOR
Ms. Elizabeth Amadiume has over 32 years working experience in all aspects of non-life insurance operations. She is a member of the Board of Directors of the African Reinsurance Corporation (South Africa) Limited. She has also served as the Director, Central Operations and Special Risks of African Reinsurance Corporation and its Regional Director of Mauritius.
Ms. Amadiume Elizabeth was President of the Insurance Institute of Mauritius from April 2006 to March 2009, and was a Member of the Mauritius Financial Services Consultative Council Technical Committee for Insurance - 2007 to 2008; Member of the General Insurance Technical Committee, Kenya 2004, Member of the Joint Insurance Industry Risk Evaluation Committee, Kenya 2004; and Visiting lecturer, College of Insurance Kenya for several years up to 2004.
Ms. Elizabeth Amadiume is a Fellow of the Chartered Insurance Institute, UK and has a Masters Degree in French Language and Literature from the Voronezh State University, then USSR. She is also an alumnus of the Harvard Management and Leadership Programme. * stMrs. Elizabeth Amadiume was appointed to the Board with effect from 21 October, 2016.

16
BOARD OF DIRECTORS 2016 Annual Report & Accounts
TOKUNBO BELLOEXECUTIVE DIRECTOR
Mr. Tokunbo Bello is a consummate professional with over 20 years' experience in financial services consultancy and personal wealth management, he has extensive knowledge in various aspects of financial services having spent seven years at Citibank Life in the United Kingdom as a branch executive and manager responsible for new financial consultants and client portfolio management.
Mr. Tokunbo Bello holds a Bachelor's degree in Biology from the Ahmadu Bello University, Zaria and a Master's degree in Information Systems Management from the University of Stirling, Scotland. He is a member of the Chartered Institute of Insurance and also holds the Financial Planning Certificates 1, 2 and 3 and a Certificate in Mortgage Advice and Practice.
AYO OSUNBUNMIEXECUTIVE DIRECTOR
Ayo Osunbunmi joined Cornerstone Insurance PLC as Chief Operating Officer in 2015. Prior to this appointment, he was a member of general management at Union Bank of Nigeria PLC where he coordinated the pre-acquisition and post-acquisition due diligence activities on the bank that resulted in the acquisition of the bank by an investor group. He also worked with KPMG Professional Services and Arthur Andersen. In the course of his professional career, he has gained valuable experience in corporate governance, risk management, internal auditing, internal controls and investor relations among other skills.
Mr. Ayo Osunbunmi has a Bachelor of Science degree in Civil Engineering from the University of Ibadan and a Masters Degree in Business Administration (MBA) from the Stephen M. Ross School of Business at the University of Michigan. He also has a Master of Science (M.Sc.) degree in Computer Science from the West Chester University of Pennsylvania, West Chester, Pennsylvania, USA. He is a Fellow of the Institute of Chartered Accountants of Nigeria (ICAN), a Certified Information Systems Security Professional (CISSP), a Certified Information Systems Auditor (CISA) and a Certified Fraud Examiner (CFE).
ANTHONY EGBUNANON – EXECUTIVE DIRECTOR
Mr. Anthony Egbuna serves as a Vice President and Investment Officer at African Capital Alliance. Mr. Egbuna joined African Capital Alliance in 2009. He worked at Arthur Andersen, FSB International Bank, ProAce Consulting, and United Bank for Africa, as well as in Reynolds American, Winston Salem, and Jefferson Wells. Mr. Egbuna was one of a two-man team that led the turnaround consulting engagement at the then Federal Savings Bank.
He has more than 28 years of varied experience in financial management, banking, auditing, process improvement, strategic planning and enterprise risk management, having been exposed to financial services, oil and gas, manufacturing, consumer products and several other industries as auditor, consultant, and banker. He serves as Non-Executive Director at e-Tranzact International PLC.
Mr. Egbuna is a Chartered Accountant and holds an M.B.A. degree from Wake Forest University, Winston Salem and a first class Bachelor of Science degree in Social Sciences from the University of Ife. * stMr. Anthony Egbuna was appointed to the Board with effect from 21 October, 2016.
217
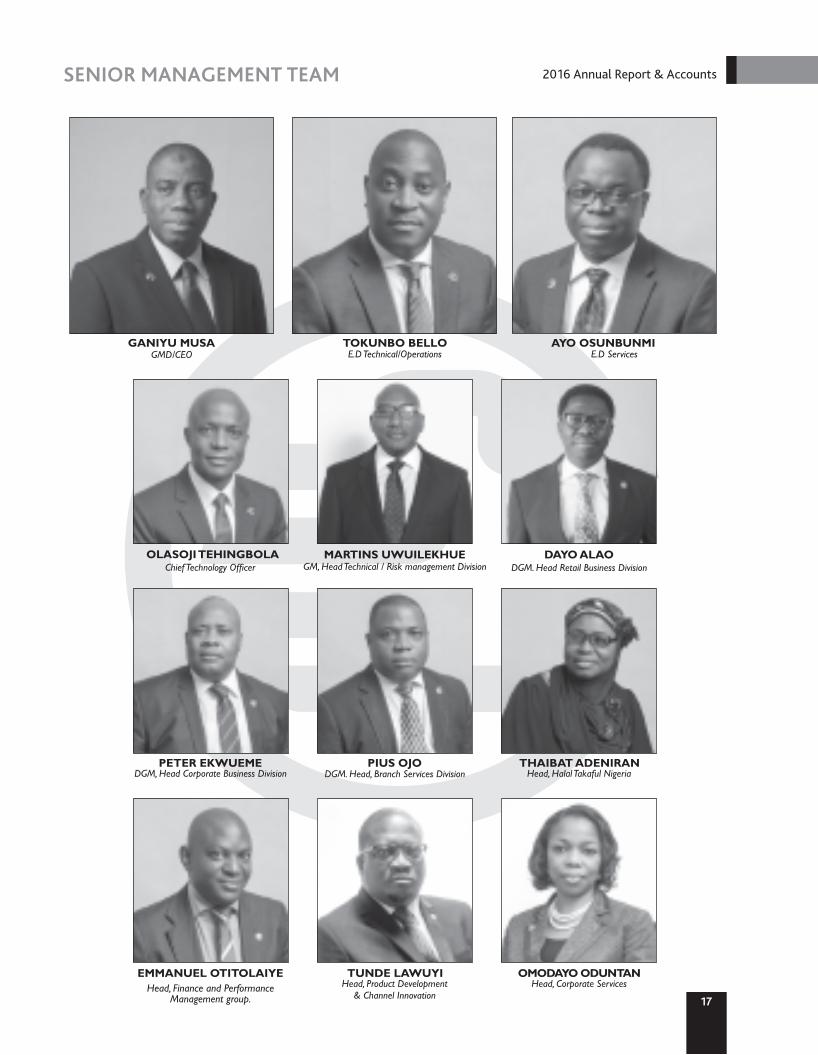
SENIOR MANAGEMENT TEAM 2016 Annual Report & Accounts
Head, Finance and Performance Management group.
GANIYU MUSA GMD/CEO
TOKUNBO BELLO E.D Technical/Operations
AYO OSUNBUNMI E.D Services
OLASOJI TEHINGBOLA Chief Technology Officer
MARTINS UWUILEKHUE GM, Head Technical / Risk management Division
DAYO ALAO DGM. Head Retail Business Division
PETER EKWUEME DGM, Head Corporate Business Division
PIUS OJO DGM. Head, Branch Services Division
THAIBAT ADENIRAN Head, Halal Takaful Nigeria
EMMANUEL OTITOLAIYE TUNDE LAWUYI Head, Product Development
& Channel Innovation
OMODAYO ODUNTAN Head, Corporate Services
18
CORPORATE GOVERNANCE REPORT 2016 Annual Report & Accounts
CORPORATE GOVERNANCE COMPLIANCE STATEMENTGovernance is central to the operations and structure of Cornerstone Insurance PLC and good corporate governance is an essential part of the spirit of the Board. Our Company's governance structures and practices align with applicable local legislation and international best practices including compliance with the Code of Corporate Governance issued by the National Insurance Commission (NAICOM) for the Insurance Industry in Nigeria and the Code of Corporate Governance for Public Companies issued by the Securities and Exchange Commission. Further, we ensure continuous review of our governance approach and practices to promote accountability and transparency.
The Board also ensures that its governance approach is reflected throughout the organisation and has developed a culture where managers at every level are accountable and stakeholder views are taken seriously. The Board determines the governance culture of the organisation and ensures that it leads by example by exhibiting responsible behaviour which is expected from every stakeholder in the organisation.
At the beginning of 2017, NAICOM issued a statement to the industry highlighting its regulatory priorities for the year 2017 part of which was monitoring the behavioural aspects of corporate governance. In furtherance of this objective, NAICOM subsequently issued a circular dated 25 August, 2016 clarifying th
some provisions of its Code of Corporate Governance. The circular, among other things, compressed the existing committees of insurance companies to three namely:
a. Finance, Investment and General Purposesb. Audit and Compliancec. Enterprise Risk Management and Governance
In compliance with this circular, the Board reviewed its committee structure and approved changes to the committees' Terms of Reference.
Some of the key initiatives which the Board embarked on in 2016 to strengthen its corporate governance processes include but are not limited to the following:
1. Appointment of the firm of J.K Randle as external consultants to conduct the annual Board evaluation of the Board in line with the provisions of the NAICOM Code of Corporate Governance;
2. Extensive review of the Company's Code of Business Ethics to guide employees, Directors and other stakeholders who transact with the Company. The Code contains clear provisions and guidelines on anti-bribery, conflict of interest situations, whistle blowing and ethical conduct;
3. Codification of the Company's Anti-money Laundering (AML) and Combating the Financing of Terrorism (CFT) policies;
4. Peer Review of the Company's compensation and remuneration levels to ensure that the Company remains competitive and can attract, motivate and retain skilled and qualified persons needed to manage the business of the organisation;
5. Constant monitoring of corporate governance regulations
and best practices to ensure that the Company is compliant at all times. The Board conducted a company-wide corporate governance audit to gauge the Company's compliance with extant regulations and best practices and devised action plans to address gaps which were identified;
6. The Company improved its interaction and engagement with various regulators as well as its stakeholders and has put in place measures to continue to strengthen these relationships.
7. The Company has a policy of zero tolerance for non-compliance and has developed a robust Compliance Framework to ensure compliance at all levels.
Governance StructureThe governance of the Company resides with the Board of Directors who are accountable to shareholders for creating and delivering sustainable value through the management of the Company's business.
The Board is responsible for the efficient operation of the Company and ensures the Company fully discharges its legal, financial and regulatory responsibilities. These oversight functions of the Board of Directors are exercised through its various Committees.
The matters which are more specifically reserved for the Board to ensure that it maintains full and effective control over appropriate strategic, financial, operational and compliance issues are:
• Maintenance of clear investment objectives and risk management policies;
• Formulation and Monitoring of the Group's Strategy and Implementation of that Strategy;
• Monitoring all business activities of the Company from analysis of investment performance to review of quarterly management accounts;
• Capital raising and Budget Allocation• Accounting policies, and financial reporting • Internal Control• Approval of material acquisitions and disposal of assets• Consideration and approval of Board and Senior
Management appointments or removals• Shareholder communication• Authorisation of Directors' conflicts or possible conflicts of
interest;• Review of terms of reference and membership of Board
Committees;
The Board delegates the operational management of the Group's businesses to the Group Chief Executive who reports to the Board and who can sub-delegate any of his powers as appropriate.
Board CompositionThe Board of Directors of Cornerstone Insurance PLC is comprised of experienced people with significant achievements in their respective professions.
As at December 31, 2016, there were Nine (9) members on the Board of Directors comprising Four (4) Non-Executive Directors, one of whom is the Chairman, Two (2) Independent Directors and Three (3) Executive Directors, one of whom is the Managing Director.
19
CORPORATE GOVERNANCE REPORT CONTD. 2016 Annual Report & Accounts
Changes to the Board
Resignations• Messrs. Richard Ikiebe, Oladapo In March, 2016,
Egbeyemi, Alhaji Hussaini Abdulrahman and Peter Ameadaji (alternate) retired as Directors from the Board in line with the NAICOM Code of Corporate Governance on tenure of Directors. The Chairman made this announcement to shareholders in his statement at the 2016 AGM of the Company.
• Mr. Adedotun SulaimanIn September, 2016, retired from the Board in compliance with the provisions of the NAICOM Code of Corporate Governance on tenure of Directors. The Board subsequently appointed Mr. Paul Kokoricha to replace him as Chairman.
• Mrs. Ndidi Okonkwo NwuneliIn December, 2016, resigned from the Board as a non-executive independent Director in order to pursue other interests and commitments.
Appointments/Election of Directors• In July 2016, the Board strengthened its composition with the
appointment of as a non-executive Mr. Ekwunife Okoliindependent Director. Details of his experience can be found on page 4.
The Board hereby presents the appointment of Mr. Ekwunife Okoli as a non-executive independent Director for approval at this Annual General Meeting.
• The Board through the ERM and Governance Committee reviewed its composition and recognised the need for greater diversity on the Board. In October, 2016, the Board appointed
Ms. Elizabeth Amadiume as a non-executive Independent Director. Details of her experience can be found on Page 4.
Ms. The Board hereby presents the appointment of Elizabeth Amadiume as a non-executive independent Director for approval at this Annual General Meeting.
• Mr. Anthony In October, 2016, the Board appointed Egbuna as a non-executive Director. Details of his experience can be found on Page 4.
Mr. The Board hereby presents the appointment of Anthony Egbuna as a non-executive Director for approval at this Annual General Meeting.
Post Y ear End Events• Mr. Segun Adebanji replaced Mr. Paul Kokoricha who
rdresigned from the Board as Chairman effective from 23 April, 2017. Details of his experience can be found on Page 2.
Mr. Segun The Board hereby presents the appointment of Adebanji as a non-executive Director for approval at this Annual General Meeting.
Re-Election of DirectorsIn accordance with Section 259(1) of the Companies and Allied Matters Act, CAP C20, LFN, 2004, the following Directors retiring by rotation in accordance with Section 259 of the Companies and Allied Matters Act being eligible are presenting themselves for re-election:a. Mr. Ayo Osunbunmib. Mr. Dominic Ichabac. Mr. Steve Iwenjora
Their profiles are contained in the section for Directors' Profiles.
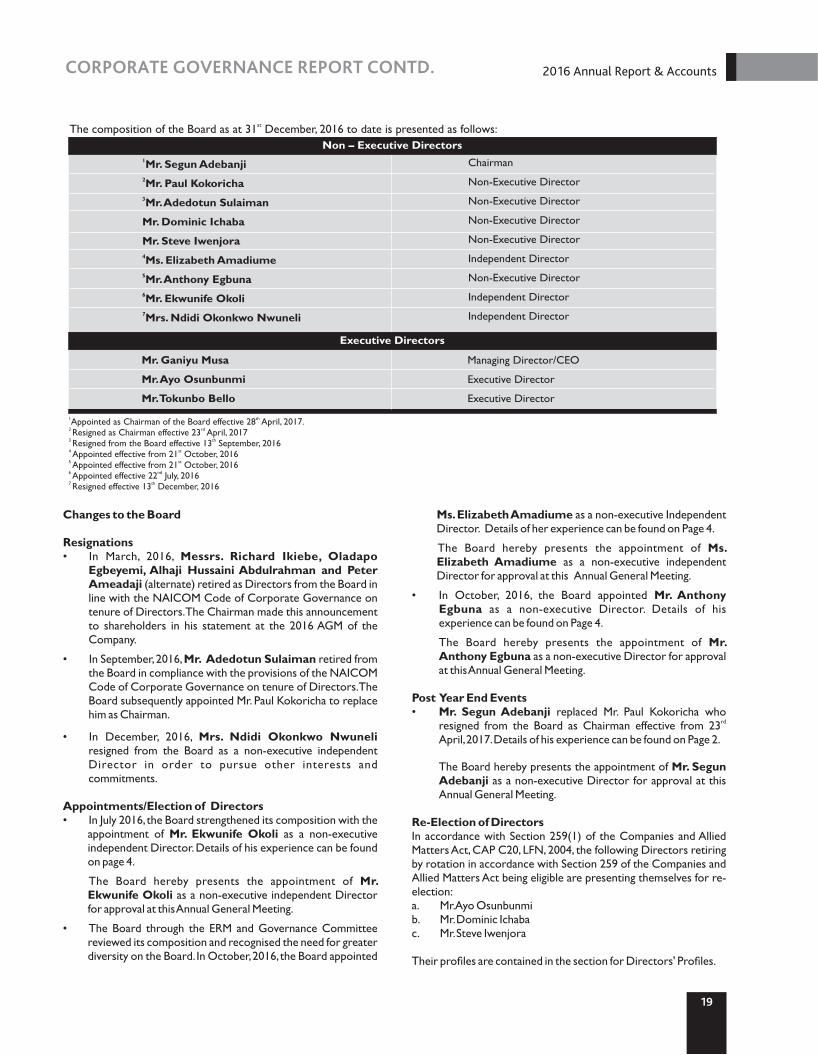
stThe composition of the Board as at 31 December, 2016 to date is presented as follows:
Mr. Ganiyu Musa
Mr. Ayo Osunbunmi
Mr. Tokunbo Bello
Managing Director/CEO
Executive Director
Executive Director
1Mr. Segun Adebanji2Mr. Paul Kokoricha3Mr. Adedotun Sulaiman
Mr. Dominic Ichaba
Mr. Steve Iwenjora4Ms. Elizabeth Amadiume5Mr. Anthony Egbuna6Mr. Ekwunife Okoli7Mrs. Ndidi Okonkwo Nwuneli
Chairman
Non-Executive Director
Non-Executive Director
Non-Executive Director
Non-Executive Director
Independent Director
Non-Executive Director
Independent Director
Independent Director
Non – Executive Directors
Executive Directors
1 thAppointed as Chairman of the Board effective 28 April, 2017.2 rdResigned as Chairman effective 23 April, 20173 thResigned from the Board effective 13 September, 20164 stAppointed effective from 21 October, 20165 stAppointed effective from 21 October, 20166 ndAppointed effective 22 July, 20167 thResigned effective 13 December, 2016

2
CORPORATE GOVERNANCE REPORT CONTD. 2016 Annual Report & Accounts
20
Board Appointment, Induction and TrainingThe Board through the Enterprise Risk Management (ERM) and Governance Committee is responsible for determining the required knowledge, skills and experience, required for the Board as a whole and for individual members. Members are expected to meet the standard requirements set by the Board and should also possess expertise and insights in the industry and other areas relevant to the Company.
All new non-executive Directors appointed to the Board are issued a letter of appointment which contains their fiduciary duties as Directors, their roles and responsibilities, remuneration and information on Board meetings among other things. On appointment, Directors receive information about Cornerstone Insurance including financial data and key policies supporting the Company's business practices. They also receive copies of the Terms of Reference of the Board and committees to which they have been appointed and the Company's Memorandum and Articles of Association. All new Directors are required to disclose their memberships on other Boards and any real or potential conflict of interest situations which they are aware of.
Directors are encouraged to update their skills and knowledge and the Board and individual Directors receive ongoing training as required. In 2016, Board members were trained and tested on AML and CFT regulations and processes. Directors also partook in the Fiduciary Awareness Certification Test (FACT) organised by the Nigerian Stock Exchange (NSE) in collaboration with the Centre for Business (CBI) Integrity as part of the Corporate Governance Rating System for companies listed on the Nigerian Stock Exchange.
Meetings of the BoardThe Board formally met Six (6) times in 2016. The Board meets at least once every quarter to perform its oversight function and to monitor the performance of management. Special Board meetings are scheduled whenever business exigencies arise which require the urgent attention of the Board. Between meetings, the Board maintains regular contact with Management.
Details of attendance by each of the Directors at Board meetings are shown in the table below.
stAttendance Register of the Members of the Board for the year ended 31 December, 2016
Annual Board EvaluationIn compliance with the NAICOM Code of Corporate Governance, the Company appointed the firm of J.K Randle to conduct the annual Board Evaluation exercise for the year ended 31 December, 2016. The report of the Board Evaluation is contained on page of the Annual st 24Report. At the Annual General Meeting of the Company held 21 July, 2015, the Company's shareholders approved the appointment of JK st Randle Professional Services to facilitate the evaluation of the Board. The Board is confident that JK Randle Professional Services will continue to deliver value to the Board.
During the year, the ERM and Governance Committee considered the report of the Board Evaluation carried out for the year ended 31 st
December 2015, identified areas of specific focus and developed action plans to address those areas.
1 2 3 4 5 6MEETINGS
NAMES
Mr. Adedotun Sulaiman
Mr. Paul Kokoricha
Mr. Segun Adebanji
Mr. Ganiyu Musa
Mr. Dominic Ichaba
Mr. Anthony Egbuna
Mr. Steve Iwenjora
Mr.Ekwunife Okoli
Mr. Ndidi O. Nwuneli
Ms. Elizabeth Amadiume
Mr. Tokunbo Bello
Mr. Ayo Osunbunmi
26/01/16 16/03/16 26/04/16 22/07/16 21/10/16 15/12/16Strategy Session
✓
✓
NYA
✓
✓
NYA
✓
NYA
✗
NYA
✗
✓
NLD
✓
✓
✓
✓
✓
✗
✓
✓
✓
✓
✓
Key: ✓-Present ✗-Absent NYA-Not Yet Appointed NLD- No Longer Director
✓
✓
NYA
✓
✓
NYA
✓
NYA
✓
NYA
✓
✓
✓
✓
NYA
✓
✓
NYA
û
NYA
✓
NYA
û
✓
✓
✓
NYA
✓
✓
NYA
✓
NYA
✓
NYA
✓
✓
NLD
✓
NYA
✓
✓
NYA
✓
✓
✓
NYA
✓
✓
21
CORPORATE GOVERNANCE REPORT CONTD. 2016 Annual Report & Accounts
BOARD COMMITTEESThe Board is supported by a number of committees which underpin the Board's assurance and oversight of the organisation. The Board committees are part of Cornerstone's formal governance structure and provide the Board with regular reporting and formal assurance.
This helps the Board to spend a significant proportion of its time on strategic decision-making, whilst obtaining proper assurance that decisions across the organisation have been made effectively based on the correct information. Committee chairs report to the Board on their activities following each meeting of their respective committee.
There were Four (4) standing Committees of the Board at the beginning of the year under review, namely;
a. Governance and Establishment Committee b. Financial Performance and Enterprise Risk Management Committeec. Finance and Investment Committee and d. Audit Committee
As highlighted above, these Committees were reconstituted in line with the NAICOM Code of Corporate Governance by the fourth quarter of 2016. The Committees of the Board as at 31 December 2016 to date are:st
a. Enterprise Risk Management and Governance Committeeb. Audit and Compliance Committeec. Finance, Investments and General Purposes Committeed. Statutory Audit Committee
All the Committees have Terms of Reference that guide Committee members in the execution of their duties. The Committees report to the Board and provide recommendations to the Board on matters reserved for Board approval.
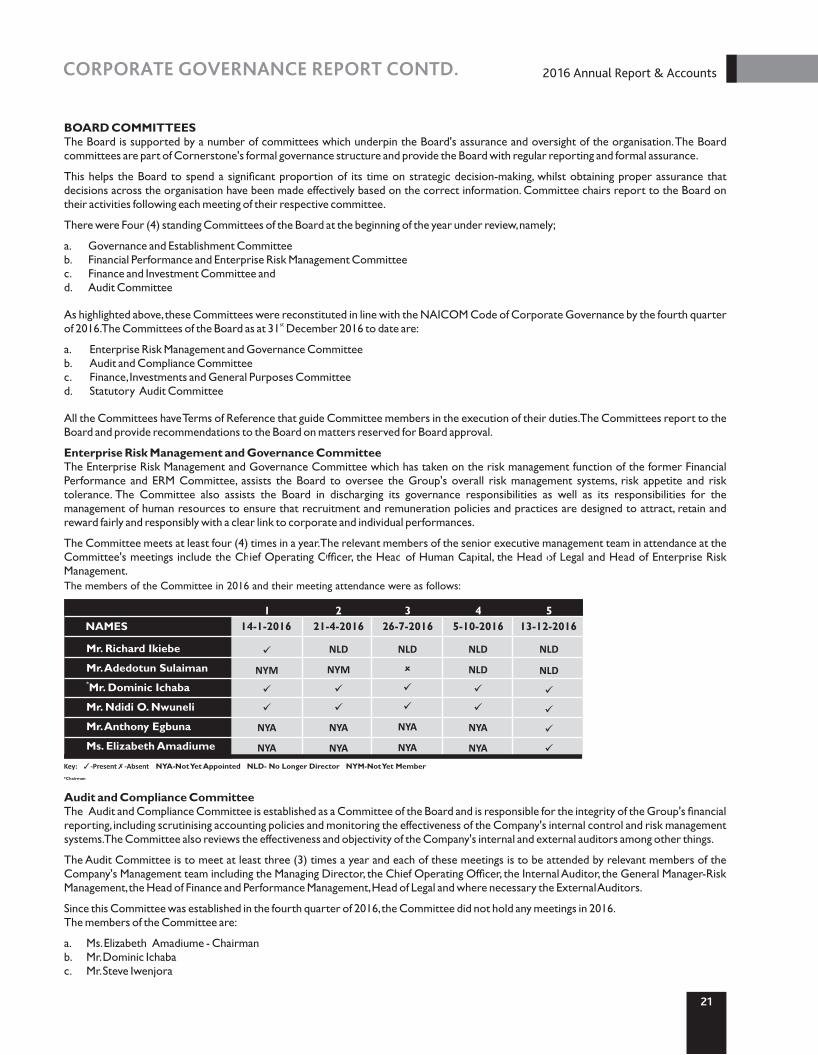
Enterprise Risk Management and Governance CommitteeThe Enterprise Risk Management and Governance Committee which has taken on the risk management function of the former Financial Performance and ERM Committee, assists the Board to oversee the Group's overall risk management systems, risk appetite and risk tolerance. The Committee also assists the Board in discharging its governance responsibilities as well as its responsibilities for the management of human resources to ensure that recruitment and remuneration policies and practices are designed to attract, retain and reward fairly and responsibly with a clear link to corporate and individual performances.
The Committee meets at least four (4) times in a year. The relevant members of the senior executive management team in attendance at the Committee's meetings include the Chief Operating Officer, the Head of Human Capital, the Head of Legal and Head of Enterprise Risk Management.The members of the Committee in 2016 and their meeting attendance were as follows:
Key: ✓-Present✗ -Absent NYA-Not Yet Appointed NLD- No Longer Director NYM-Not Yet Member*Chairman
1 2 3 4 5NAMES
Mr. Richard Ikiebe
Mr. Adedotun Sulaiman*Mr. Dominic Ichaba
Mr. Ndidi O. Nwuneli
Mr. Anthony Egbuna
Ms. Elizabeth Amadiume
21-4-201614-1-2016 26-7-2016 5-10-2016 13-12-2016
ü
NYM
ü
ü
NYA
NYA
NLD
NYM
ü
ü
NYA
NYA
NLD
û
ü
ü
NYA
NYA
NLD
NLD
ü
ü
NYA
NYA
NLD
NLD
ü
ü
ü
ü
Audit and Compliance CommitteeThe Audit and Compliance Committee is established as a Committee of the Board and is responsible for the integrity of the Group's financial reporting, including scrutinising accounting policies and monitoring the effectiveness of the Company's internal control and risk management systems. The Committee also reviews the effectiveness and objectivity of the Company's internal and external auditors among other things.
The Audit Committee is to meet at least three (3) times a year and each of these meetings is to be attended by relevant members of the Company's Management team including the Managing Director, the Chief Operating Officer, the Internal Auditor, the General Manager-Risk Management, the Head of Finance and Performance Management, Head of Legal and where necessary the External Auditors.
Since this Committee was established in the fourth quarter of 2016, the Committee did not hold any meetings in 2016.The members of the Committee are:
a. Ms. Elizabeth Amadiume - Chairmanb. Mr. Dominic Ichabac. Mr. Steve Iwenjora
22
CORPORATE GOVERNANCE REPORT CONTD. 2016 Annual Report & Accounts
ü
NYM
ü
ü
ü
ü
NYM
ü
NYM
ü
✗
NLD
ü
NYM
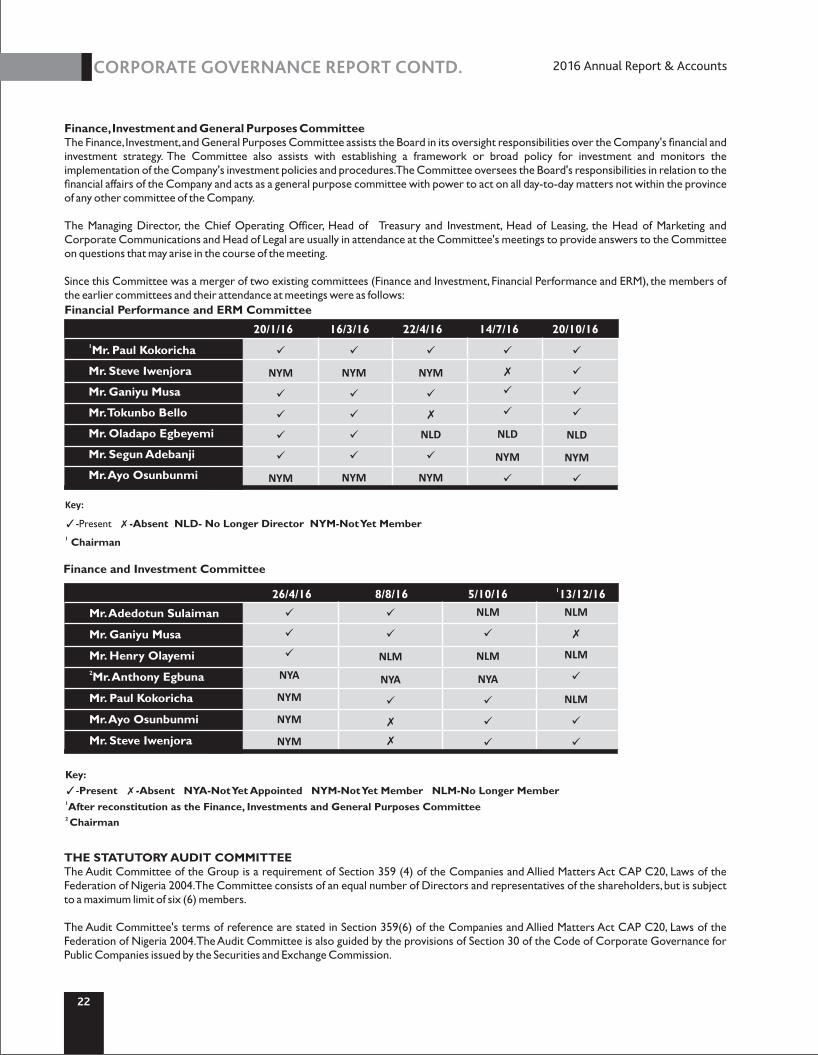
Financial Performance and ERM Committee
20/1/16 16/3/16 22/4/16 14/7/16 20/10/161Mr. Paul Kokoricha
Mr. Steve Iwenjora
Mr. Ganiyu Musa
Mr. Tokunbo Bello
Mr. Oladapo Egbeyemi
Mr. Segun Adebanji
Mr. Ayo Osunbunmi
ü
NYM
ü
ü
ü
ü
NYM
ü
✗
ü
ü
NLD
NYM
ü
ü
ü
ü
ü
NLD
NYM
ü
Key:
✓-Present ✗-Absent NLD- No Longer Director NYM-Not Yet Member 1 Chairman
Finance and Investment Committee
ü
ü
ü
NYA
NYM
NYM
NYM
NLM
ü
NLM
NYA
ü
ü
ü
ü
ü
NLM
NYA
ü
✗
✗
NLM
✗
NLM
ü
NLM
ü
ü
Mr. Adedotun Sulaiman
Mr. Ganiyu Musa
Mr. Henry Olayemi2Mr. Anthony Egbuna
Mr. Paul Kokoricha
Mr. Ayo Osunbunmi
Mr. Steve Iwenjora
126/4/16 8/8/16 5/10/16 13/12/16
Key:✓-Present ✗-Absent NYA-Not Yet Appointed NYM-Not Yet Member NLM-No Longer Member1After reconstitution as the Finance, Investments and General Purposes Committee2 Chairman
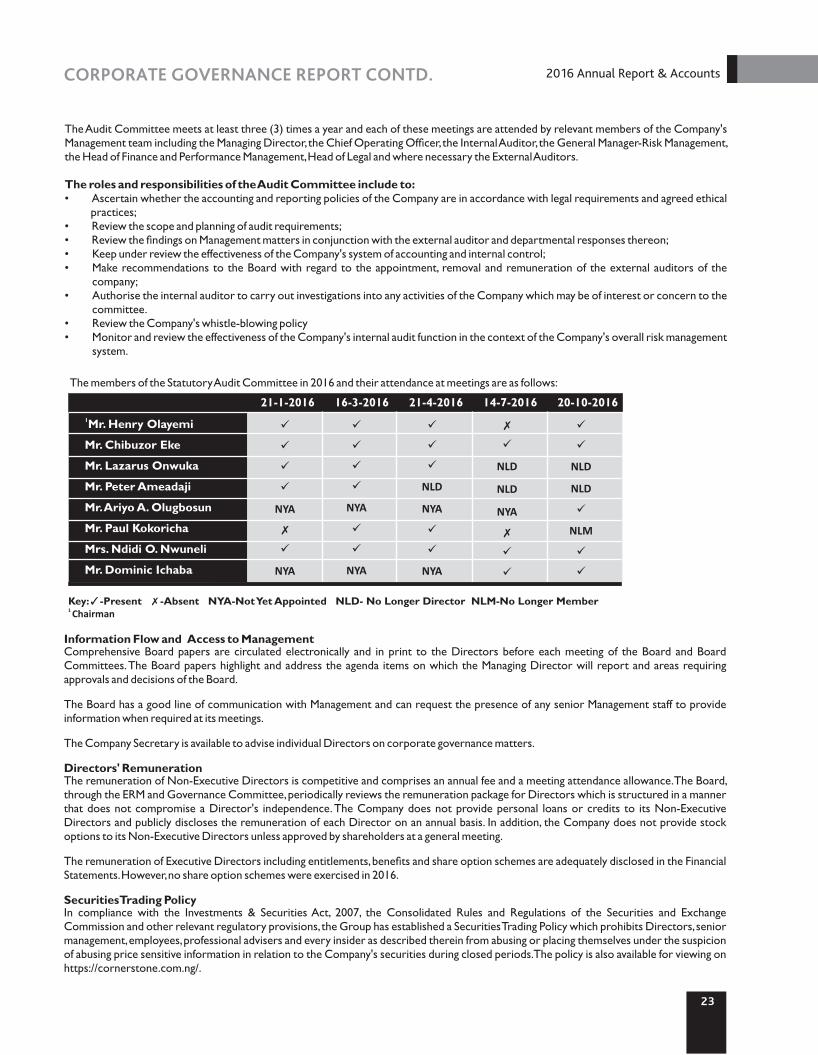
THE STATUTORY AUDIT COMMITTEEThe Audit Committee of the Group is a requirement of Section 359 (4) of the Companies and Allied Matters Act CAP C20, Laws of the Federation of Nigeria 2004. The Committee consists of an equal number of Directors and representatives of the shareholders, but is subject to a maximum limit of six (6) members.
The Audit Committee's terms of reference are stated in Section 359(6) of the Companies and Allied Matters Act CAP C20, Laws of the Federation of Nigeria 2004. The Audit Committee is also guided by the provisions of Section 30 of the Code of Corporate Governance for Public Companies issued by the Securities and Exchange Commission.
Finance, Investment and General Purposes CommitteeThe Finance, Investment, and General Purposes Committee assists the Board in its oversight responsibilities over the Company's financial and investment strategy. The Committee also assists with establishing a framework or broad policy for investment and monitors the implementation of the Company's investment policies and procedures. The Committee oversees the Board's responsibilities in relation to the financial affairs of the Company and acts as a general purpose committee with power to act on all day-to-day matters not within the province of any other committee of the Company.
The Managing Director, the Chief Operating Officer, Head of Treasury and Investment, Head of Leasing, the Head of Marketing and Corporate Communications and Head of Legal are usually in attendance at the Committee's meetings to provide answers to the Committee on questions that may arise in the course of the meeting.
Since this Committee was a merger of two existing committees (Finance and Investment, Financial Performance and ERM), the members of the earlier committees and their attendance at meetings were as follows:
23
CORPORATE GOVERNANCE REPORT CONTD. 2016 Annual Report & Accounts
Information Flow and Access to ManagementComprehensive Board papers are circulated electronically and in print to the Directors before each meeting of the Board and Board Committees. The Board papers highlight and address the agenda items on which the Managing Director will report and areas requiring approvals and decisions of the Board.
The Board has a good line of communication with Management and can request the presence of any senior Management staff to provide information when required at its meetings.
The Company Secretary is available to advise individual Directors on corporate governance matters.
Directors' RemunerationThe remuneration of Non-Executive Directors is competitive and comprises an annual fee and a meeting attendance allowance. The Board, through the ERM and Governance Committee, periodically reviews the remuneration package for Directors which is structured in a manner that does not compromise a Director's independence. The Company does not provide personal loans or credits to its Non-Executive Directors and publicly discloses the remuneration of each Director on an annual basis. In addition, the Company does not provide stock options to its Non-Executive Directors unless approved by shareholders at a general meeting.
The remuneration of Executive Directors including entitlements, benefits and share option schemes are adequately disclosed in the Financial Statements. However, no share option schemes were exercised in 2016.
Securities Trading PolicyIn compliance with the Investments & Securities Act, 2007, the Consolidated Rules and Regulations of the Securities and Exchange Commission and other relevant regulatory provisions, the Group has established a Securities Trading Policy which prohibits Directors, senior management, employees, professional advisers and every insider as described therein from abusing or placing themselves under the suspicion of abusing price sensitive information in relation to the Company's securities during closed periods. The policy is also available for viewing on https://cornerstone.com.ng/.
ü
ü
ü
ü
NYA
✗
ü
NYA
ü
ü
NLD
NLD
ü
NLM
ü
ü
21-1-2016 16-3-2016 21-4-2016 14-7-2016 20-10-20161Mr. Henry Olayemi
Mr. Chibuzor Eke
Mr. Lazarus Onwuka
Mr. Peter Ameadaji
Mr. Ariyo A. Olugbosun
Mr. Paul Kokoricha
Mrs. Ndidi O. Nwuneli
Mr. Dominic Ichaba
ü
ü
ü
ü
NYA
ü
ü
NYA
ü
ü
ü
NLD
NYA
ü
ü
NYA
✗
ü
NLD
NLD
NYA
✗
ü
ü
Key:✓-Present ✗-Absent NYA-Not Yet Appointed NLD- No Longer Director NLM-No Longer Member 1 Chairman
The members of the Statutory Audit Committee in 2016 and their attendance at meetings are as follows:
The Audit Committee meets at least three (3) times a year and each of these meetings are attended by relevant members of the Company's Management team including the Managing Director, the Chief Operating Officer, the Internal Auditor, the General Manager-Risk Management, the Head of Finance and Performance Management, Head of Legal and where necessary the External Auditors.
The roles and responsibilities of the Audit Committee include to:• Ascertain whether the accounting and reporting policies of the Company are in accordance with legal requirements and agreed ethical
practices;• Review the scope and planning of audit requirements;• Review the findings on Management matters in conjunction with the external auditor and departmental responses thereon;• Keep under review the effectiveness of the Company's system of accounting and internal control;• Make recommendations to the Board with regard to the appointment, removal and remuneration of the external auditors of the
company; • Authorise the internal auditor to carry out investigations into any activities of the Company which may be of interest or concern to the
committee.• Review the Company's whistle-blowing policy• Monitor and review the effectiveness of the Company's internal audit function in the context of the Company's overall risk management
system.
REPORT OF THE EXTERNAL CONSULTANTS 2016 Annual Report & Accounts
he Board of Directors of Cornerstone Insurance Plc. renewed its mandate to J. K. Randle International to conduct the evaluation of Tthe Board of Directors of the company for the year ended 31st December, 2016 in accordance with the provisions of the NAICOM Code of Good Corporate Governance for the Insurance Industry in Nigeria, February, 2009 (NAICOM Code).
The Board of Cornerstone Insurance Plc. had ten Directors as at 31 December 2016. This consisted of Three Executive Directors, including the Managing Director/Chief Executive Officer and Seven Non-Executive Directors. Three Non-Executive Directors and one alternate Director resigned from the Board having completed their tenures.
Three Non-Executive Directors were appointed to fill the vacancies created by the resignations. Members of the Board remained conscious of their responsibilities in respect of the operations of the Board and the Company. They possess the requisite backgrounds to supervise the operations of the Company as well as the performance of Management. The composition of the Board conformed with the provisions of the NAICOM Code on the ratio of executive directors to non-executive directors. The number of committees conformed with the requirements of the NAICOM Code.
Despite the changes on the Board, the skills mix, experience base, and diversity remained adequate for the effective performance of the Board’s functions. We noted in particular, that the Board continued to review the performance of Management in line with the Company’s business plan during the year. The Board adequately challenged the assumptions of Management in the implementation of the Company’s business plans. It also ensured that the Company maintained very good relationship with the regulators and monitored compliance as appropriate. We observed that the operations of the Board met the requirements of Best Practice and the NAICOM Code. Frequency of Board meetings exceeded the minimum requirement of the NAICOM Code. The Board held six meetings which included a strategy session, and the level of attendance was satisfactory.
The conduct of the meetings followed conventional procedures in a conducive atmosphere where all members expressed their views freely. The agenda of the Board consisted of relevant strategic issues in order to address the critical and emerging challenges within the Company and the industry. The activities of the Board were well documented in the minutes book.
The Board performed all the functions that fell within the purview of its oversight responsibilities which arose during the period under review. In particular the Board reviewed the Company’s Investment Policy. It also approved an Underwriting Policy to regulate the Company’s dealings in bonds. It strengthened the governance structures by reconstituting the Board Committees for more effectiveness.
The Board was actively involved in overseeing the internal audit functions as well as prudential matters such as Solvency Margin and Technical matters such as risk management. The Board also performed other statutory responsibilities including rendering the accounts of the operations and activities of the Company to the shareholders.
At the conclusion of the exercise, we recommended that the Board of Directors of Cornerstone Insurance Plc. should address highlighted issues in respect of a continued drive to strengthen the boards of the Company’s subsidiaries. The Board should also intensify efforts to complete the review of the Committees’ Terms of Reference following their reconstitution in line with NAICOM guidelines.The performance of the Board did not violate the NAICOM Code in any material manner and was adjudged to be satisfactory.
BASHORUN J. K. RANDLE, OFRChairman/Chief ExecutiveFRC/2013/ICAN/00000002703Dated 22nd March, 2017
REPORT OF THE EXTERNAL CONSULTANTS ON THE APPRAISAL OF THE BOARD OF DIRECTORS OFCORNERSTONE INSURANCE PLC FOR THE YEAR ENDED 31ST DECEMBER, 2016
24

Directors' shareholding: The Directors of the Company who held office during the year together with their direct and indirect interest in the issued share capital of the Company as recorded in the Register of Directors shareholding and as notified by the Directors in line with section 275 and 276 of the Company and Allied Matters Act and the Listing requirements of the Nigeria Stock Exchange are as follows:
The Directors of Cornerstone Insurance PLC (“Cornerstone'' or the “Company”) present their Report on the affairs of Cornerstone and its subsidiaries (together referred to as “the Group”), together with the Audited consolidated and separate financial statements and the Auditor's report for the year ended December 31 2016. st
LEGAL FORM AND PRINCIPAL ACTIVITYThe Company was incorporated on 26 July, 1991 as a private limited liability company and converted to a public limited company on 17 June, 1997.
The Company's principal activity continues to be the provision of risk underwriting and related financial services to its customers. Such services include provision of life and non-life insurance services for both corporate and individual customers.
The Company has two wholly owned subsidiaries – Cornerstone Leasing and Investment Limited and Fin Insurance Company Limited. Cornerstone Leasing and Investment Limited commenced operations on 1 July 2004 and provides convenient asset acquisition options to
both corporate organizations and individuals. FIN Insurance Company Limited is a private limited liability company incorporated in Nigeria and its primary activity is the provision of general insurance business. Fin Insurance Company Limited was acquired in the year 2015. Cornerstone Insurance Plc acquired 96.68% equity interest in Fin Insurance Company Limited thereby qualifying Fin Insurance Company Limited as a subsidiary. The Company prepares consolidated financial statements. The financial results of all its subsidiaries have been consolidated in this Annual Report and Accounts.
2016 Annual Report & AccountsFor the year ended 31st December, 2016DIRECTORS’ REPORT
* These Directors represent the interest of Banc-Assure Limited and Capasure Limited on the Board of the Company
Operating Results: The following is a summary of the operating results:
Group Group Company Company Group Company 2016 2015 2016 2015 YOY % YOY % N’000 N’000 N’000 N’000 Growth Growth
Gross Premium Written 9,190,634 7,331,633 8,389,950 7,331,633 25% 14%
Gross Premium Income 8,456,458 7,119,632 7,768,850 7,119,632 19% 9% (Loss)/Profit before taxation (1,264,660) 1,843,054 (1,516,213) (332,139) -169% 356% Taxation charge (470,563) (212,300) (373,574) (203,374) 122% 84%
(Loss)/Profit after taxation (1,735,223) 1,630,754 (1,889,787) (535,513) -206% 253%
Mr. -
NA
-
-
-
-
NA
-
NA
2,239,000
-
-
-
503,360
NA
DIRECT INDIRECT TOTAL
-
NA
2,239,000
-
-
503,360
NA
NAMES OF DIRECTORS
Mr. Paul Kokoricha *Ganiyu Musa
Mr. Dominic Ichaba
Mr. Anthony Egbuna *Mr. Steve Iwenjora *Mr. Ekwunife Okoli
Ms. Elizabeth Amadiume
Mr. Segun Adebanji *
Mr. Tokunbo Bello
Mr. Ayo Osunbunmi
25

26
2016 Annual Report & AccountsFor the year ended 31st December, 2016DIRECTORS’ REPORT
ANALYSIS OF SHAREHOLDING Shareholding Structure as at 31 December 2016 The analysis of the distribution of the shares of the Company at the end of the financial year was as follows:
The free float of shares as at the year ended 2016 stands at 46.4%. Property and Equipment Information relating to changes in property and equipment is given in Note 15 to the financial statements.
HUMAN CAPITALThe Company's Human Capital unit is responsible for driving and enhancing the performance of the organisation as well as attracting high potential professionals. All Human Capital policies of the Company are subject to local laws and regulations in Nigeria. One of the objectives of the unit is to provide a work environment that is conducive for both personal and professional growth and ensure that Management aligns with global best practice.
Employment of Physically Challenged Persons The Group operates a non-discriminatory policy in the consideration of applications for employment, including those received from physically challenged persons. The Group's policy is that the most qualified and experienced persons are recruited for appropriate job levels irrespective of an applicant's state of origin, ethnicity, religion or physical condition. In the event that an employee becomes physically challenged in the course of employment, the Group is in a position to arrange appropriate training to ensure the continuous employment of such a person without subjecting him/her to any disadvantage in his/ her career development. As at 31 December 2016, the Group had no physically challenged persons in its employment.
Range Number of shareholders
Number of shares held
1 -500
501 -1 ,000
1,001 -5 ,000
5 ,001 -10 ,000
10,001 -20,000
20,001 -50,000
50,001 -1,00 ,000
1,00,001 -5, 00,000
5,00,001 -1 ,000,000
1,000,001 -ABOVE
TOTAL
1,007
1,185
7,764
5,382
3,934
4,075
2,092
1,520
219
213
27,391
% of number of shares held
0.00
0.01
0.19
0.32
0.44
0.99
1.16
2.30
1.20
93.40
100
% of number of shareholders
3.68
4.33
28.35
19.65
14.36
14.88
7.64
5.55
0.80
0.78
100
277,293
1,088,001
28,038,546
46,479,215
64,504,551
145,733,030
170,930,503
339,083,286
176,515,413
13,756,948,770
14,729,598,613
SUBSTANTIAL INTEREST IN SHAREHOLDING AS AT 31 DECEMBER, 2016
BANC-ASSURE LIMITED 7,143,885,379 49 CAPASURE LIMITED 4,498,205,285 31
NAME SHAREHOLDING % OF SHAREHOLDING
Name Of Director Interest In Company Name Of Company Services
Mr. Dominic Ichaba Director/Shareholder Pac Solicitors Legal Services
DIRECTORS' INTEREST IN CONTRACTS In accordance with section 277 of the companies and Allied Matters Act of Nigeria, The Board received a declaration from the following Director in respect of the services set against his name.
27
2016 Annual Report & AccountsFor the year ended 31 December, 2016DIRECTORS’ REPORT
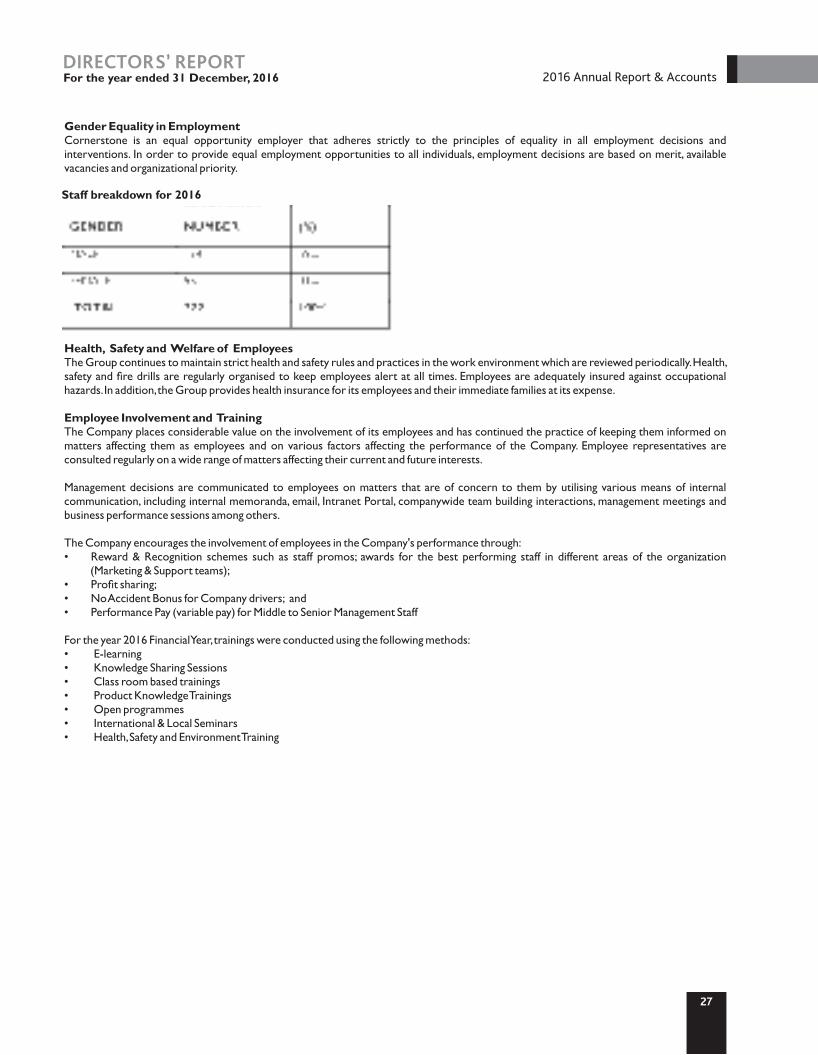
Gender Equality in Employment Cornerstone is an equal opportunity employer that adheres strictly to the principles of equality in all employment decisions and interventions. In order to provide equal employment opportunities to all individuals, employment decisions are based on merit, available vacancies and organizational priority.
Health, Safety and Welfare of Employees The Group continues to maintain strict health and safety rules and practices in the work environment which are reviewed periodically. Health, safety and fire drills are regularly organised to keep employees alert at all times. Employees are adequately insured against occupational hazards. In addition, the Group provides health insurance for its employees and their immediate families at its expense.
Employee Involvement and Training The Company places considerable value on the involvement of its employees and has continued the practice of keeping them informed on matters affecting them as employees and on various factors affecting the performance of the Company. Employee representatives are consulted regularly on a wide range of matters affecting their current and future interests. Management decisions are communicated to employees on matters that are of concern to them by utilising various means of internal communication, including internal memoranda, email, Intranet Portal, companywide team building interactions, management meetings and business performance sessions among others. The Company encourages the involvement of employees in the Company's performance through: • Reward & Recognition schemes such as staff promos; awards for the best performing staff in different areas of the organization
(Marketing & Support teams); • Profit sharing; • No Accident Bonus for Company drivers; and • Performance Pay (variable pay) for Middle to Senior Management Staff
For the year 2016 Financial Year, trainings were conducted using the following methods: • E-learning • Knowledge Sharing Sessions • Class room based trainings • Product Knowledge Trainings • Open programmes • International & Local Seminars • Health, Safety and Environment Training
Staff breakdown for 2016

28
2016 Annual Report & AccountsFor the year ended 31st December, 2016DIRECTORS’ REPORT
ENTERPRISE RISK MANAGEMENT
OverviewCornerstone's Enterprise Risk Management (ERM) model originates from a compendium of International risk standards. Foremost of the three (3) models is the ISO 31000 - Risk Management - Principles and Guidelines. The definition of risk represents the foundation of Cornerstone's risk management philosophy as contained in the ERM framework document. Corresponding supporting frameworks include:
• The COSO integrated framework and• The three (3) lines of risk defense model - Risk owners, ERM
& Internal Control/Audit
In addition to developing veritable structures in responding to the traditional Insurance Industry risks of claims management and underwriting risks among others, the Board of Directors and Management appreciate the dynamism risk portends for the business. For this reason, risk management structures have been instituted to administer material changes in the corporate risk management framework. These risks include: compliance/ regulatory, health and safety, strategic, reputational, operational and financial risks.
The Board is vested with the overall responsibility of overseeing the Group's risk management and internal control mechanism. The Group's internal Audit/Control function is instituted to strategically manage risks in the overall rather than exclude material risks in relation to the attainment of corporate objectives. The Group promotes the culture of risk awareness through policy directives, communication and training. Management is responsible for identifying, assessing and addressing material risks, and designing internal controls accordingly. Standard operating procedures and inherent controls are subject to periodic reviews by the Enterprise Risk Management unit, Management and Board Committees. The key financial and non-financial risks and uncertainties faced by the Group, have been considered during the year, and our approaches to managing them, are described in this report.
The Cornerstone Enterprise Risk Management (ERM) Programme
The Group's Enterprise Risk Management (ERM) Programme comprises instituted structures designed to manage a myriad of uncertainties and threats and equally explore opportunities in enhancing the Group's performance standards. The Group's ERM practice involves a cross-functional and multi-dimensional approach to corporate risk management. An ERM unit has been specifically charged with the function of identifying, evaluating, monitoring and reporting uncertainties (risks and opportunities) that may impact on corporate objectives (ISO: 31000) using the RAG (Red, Amber and Green) rating methodology.
The Group's risk context delineates the scope of the risk management process and sets the standards against which risks will be assessed in accordance with the Group's primary objective to be the leading insurance based financial services Group that transforms. The Group appreciates the myriad of uncertainties inherent in underwriting insurance and managing ancillary risks and how such risks potentially impact achievement of business objectives if left unaddressed via a structured /multi-dimensional risk management approach. It is to this end that the Group's ethics, philosophy and risk culture are embodied in our integrated risk management and control function.
Enterprise Risk Management (ERM) Governance A system of risk governance is realised by establishing standards related to organisational structure, risk strategy, written policies, limit systems, documentation and reporting. These structures ensure the timely movement of risk-related information and a s t ructured approach towards dec i s ion-mak ing and implementation.
Risk Management PhilosophyThe key elements of the Group's risk management philosophy are as follows:
• The Group considers sound risk management as the foundation of a long lasting financial institution.
• The Group shall continue to adopt a holistic and integrated approach to risk management.
• Risk officers shall be empowered to perform their duties professional ly and independently without undue interference.
• Risk management shall be governed by policies which are well defined and clearly communicated Group-wide.
• Risk management represents a shared responsibility. Therefore, the Group aims to build a shared -perspective on risks that is grounded on consensus.
Risk CultureThe Board and Senior management set the tone-at-the-top, by promoting accountable approaches to risks which are targeted at ensuring that the long-term rewards and the reputation of the Group is not jeopardized in a bid to achieve set objectives.
• The apex responsibility for risk management and control is fully vested in the Board of Directors.
• The Group's Management shall promote risk awareness and risk management practice across the enterprise.
• The Group advocates risk event reporting and whistle blowing, in order to properly monitor incidences of unethical practices.
• The Group shall maintain a firm obligation to ethical principles, which shall be demonstrated in the ethical performance of staff and in the decision making process.
Risk Management and Internal Control Integrated Framework The ERM and Internal Audit/control practice of the Group derives its functionality from the Committee of Sponsoring Organizations of the Treadway Commission (COSO) Enterprise Risk Management – Integrated Framework. The framework highlights the nucleus of the Enterprise risk management process, the synergy of operations amongst the Board of Directors, Management and other personnel across the enterprise.The Group's ERM/internal control integrated framework primarily consists of the following five (5) constituents in accordance with best practices:• Control environment• Risk assessment• Control activities• Information & communication• Monitoring
Control EnvironmentThe Group's control environment refers to established standards and structures that provide a foundation for the risk management/internal control and actions to thrive across the Group. The Board of Directors and Senior Management institutes

2016 Annual Report & Accounts
29
For the year ended 31 December, 2016DIRECTORS’ REPORT
the tone at the top regarding the importance of internal control.Furthermore, the control environment comprises our Five (5) corporate values of integrity, empathy, professionalism, innovation and team spirit that exhibit the Group's commitment to essential values. These values provide the necessary advantages that enables Management establish the mode of business operations and the Board of Directors to effectively execute its independent oversight functions by setting the tone at the top. The operating and corporate governance structure, establishment of standards of conduct, enforcement of accountability through structures and authorities represent critical success factors responsible for the thriving risk management culture within the Group thus far.
Risk AssessmentRisk assessment involves an iterative method of identifying and evaluating risks that could constitute threats to the enterprise as a whole, usually emanating from business units and are capable of impacting the Group's objectives. Designated risk champions and risk officers are responsible for risk identification/reporting, while the ERM unit conducts an evaluation and assessment of risk identified, with the intention of developing action plans for implementation and assessing the effectiveness thereof. Risk assessment reports are presented at the quarterly Board meetings of the Enterprise Risk Management and Governance Committee (formerly the Financial Performance and Enterprise Risk Management Committee.
The 2016 risk assessment was administered via the Risk Control Self-Assessment exercise. The objective is to identify risks across the enterprise via process owners and risk officers and evaluate the adequacy of internal control vis-a-vis risks identified using probability and impact metrics (RAG methodology). The Group shall ensure that risks are kept as-low-as-reasonably practicable with similar emphasis on potential risk embedded therein.
Control ActivitiesControl activities are actions instituted through internal practices that help safeguard the implementation of the Group's directives to mitigate risk exposures and or promote business opportunities that may possibly influence the achievement of corporate strategic objectives. Control activities are entity-specific and are performed at all levels across the Group at various stages within business processes and over the technology environment.
Information and CommunicationThe Group firmly appreciates that management of information is critical for the enterprise to proficiently implement internal control functions and has developed and utilises information from internal and external sources to underpin the current internal control system. This information also supports business decision-making.
MonitoringThe current corporate governance structure enables the Group to evaluate the efficacy of its policies and procedures, adherence to its internal control and risk management measures and communicates inherent and potential vulnerabilities in a timely manner to the authorities responsible for taking risk-based corrective actions, including Senior Management and Board Committees.
Reputational Risk ManagementThe Group maintains a zero tolerance policy against all unethical behavior. Furthermore, the Group's corporate values continually promote a responsible approach to avoiding and mitigating reputational risks and ensure that the long term survival and brand
image of the Group is not jeopardized. The Enterprise Risk management function is supported by Customer Experience, Brand, Compliance and Legal functions.
Operational Risk ManagementOperational risks represent the risk of losses that emanate from inadequate or failed internal processes, people and systems or from external events including legal and compliance risks. The Group's ERM framework recognizes external risks, legal and compliance risks and financial crime risks e.g. Anti-Money Laundering (AML) and Combating Financing of Terrorism (CFT). The Group recognizes the pervasiveness of several types of operational risks in our business process; hence policies and tools have been instituted to ensure that resulting impacts are kept as-low-as-reasonably-practicable (ALARP). Some of these processes are:
I. RCSA The Risk and Control Self-Assessment tool is employed to
manage operational risks using a combination probability and impact measurement to calculate risk scores. Risk officers working in designated departments are primarily responsible for risk identification in line with our 1 line of defence st
model, assessment, proffering action plans for implementing and determining the efficacy of these plans in order to mitigate risk exposures.
ii. The Operational Risk Register The Operational Risk Register represents Cornerstone's
operational risk identification and evaluation tool. The tool allows designated Risk Officers, process owners and staff to identify and report operational risk concerns to the ERM unit to administer.
iii. Occupational Health and Safety Management System
The Group reviewed its Occupational Health and Safety Management System (OHSAS) design, in order to meet the requirements of the international standard for OHSAS 1800:2007. The review was necessitated by the need to establish measures aimed at upholding the Group's policy on low risk tolerance against occupational health and safety risks. Risk awareness via communication to staff remains a veritable medium to promote company-wide health and safety.
iv. Environmental and Social Risk Management An Environmental and Social (E&S) monitoring exercise of
Cornerstone for the year 2016 was conducted by Environmental Accord Nigeria Limited (EnvAccord) -an accredited environmental and sustainability consulting firm. With reference to IFC's Policy on E&S Sustainability Framework, Cornerstone Insurance can be classified as a Category C project. This categorization is based on available information, that Cornerstone's operational activities have minimal or no adverse impact on environmental and social activities.
Management is committed to improving identified areas in the Company's E&S performance via the Environmental and Social Action Plan (ESAP).
2017 ERM OutlookWith NAICOM's stated intention to adopt Risk Based Supervision in the Insurance Industry, the focal point of our risk management strategy significantly rests with instituting best practice that meets the regulators' requirements of the Risk based approach framework.
COMPLAINTS AND FEEDBACK Introduction At Cornerstone Insurance PLC, one of our core values is Empathy and this is reflected in the quality of our service delivery to our customers at all times. Our customers are the reason we are in business, to this end, we focus on delivering quality service all times. We engage our customers and utilise feedback received to constantly improve on our service delivery, products offerings and distribution channels.
Complaints Channels We take feedback received from our customers as an opportunity to improve our service delivery. In furtherance of this, we have created various channels through which customers can give us feedback. These channels include:• Customer service representatives at our Corporate Head office and our various branches • Our complaint email channel [email protected]• Our website platform www.cornerstone.com.ng • Our customer service online [email protected]
Resolution MechanismAt Cornerstone Insurance PLC, we have put in place a standard system to ensure that customers' feedback are received and resolved promptly. We have a dedicated customer service unit, which is responsible for the prompt investigation and resolution of customers' complaints within the approved period. The unit interacts with other segments within the organisation to ensure that complaints are satisfactorily resolved.
Customers' complaints are stream-lined based on the type of complaints received in order to provide an enabling environment for proper monitoring, documentation and effective feedback process. The process flow of customer complaint and resolution is as follows:
• The customer care officer acknowledges and attends to the various customers' complaints;• The complaint is reviewed and addressed if it can be resolved at first level; in which case, a response is immediately provided to the
customer;• If such complaint cannot be resolved at the first level, the customer care officer forwards the complaint to the appropriate unit to
handle;• Upon resolution, the customer is contacted and the resolution is communicated to him. Thereafter, the case is closed and marked as
resolved.
Customers' Opinion on ProductsTo enrich our customers' experience, we also periodically evaluate public/customer opinion about our services, products and policies. The evaluation is conducted in various ways including:
• One-on-one focus meetings with key customers• Interviews with selected customers
Feedback on Customers' Complaints to Cornerstone Insurance PLCFeedback on customers' complaints is provided to Management and other relevant units in the organisation. The feedback gathered ensures that:
• Cornerstone retains her customers as they feel appreciated and respected• Quality service delivery is maintained and made uniform across the Cornerstone Group• Identified improvement opportunities are presented to Management for implementation
The feedback is circulated to management staff through the company's internal information channel.
2016 Annual Report & AccountsCOMPLAINTS AND FEEDBACK
30
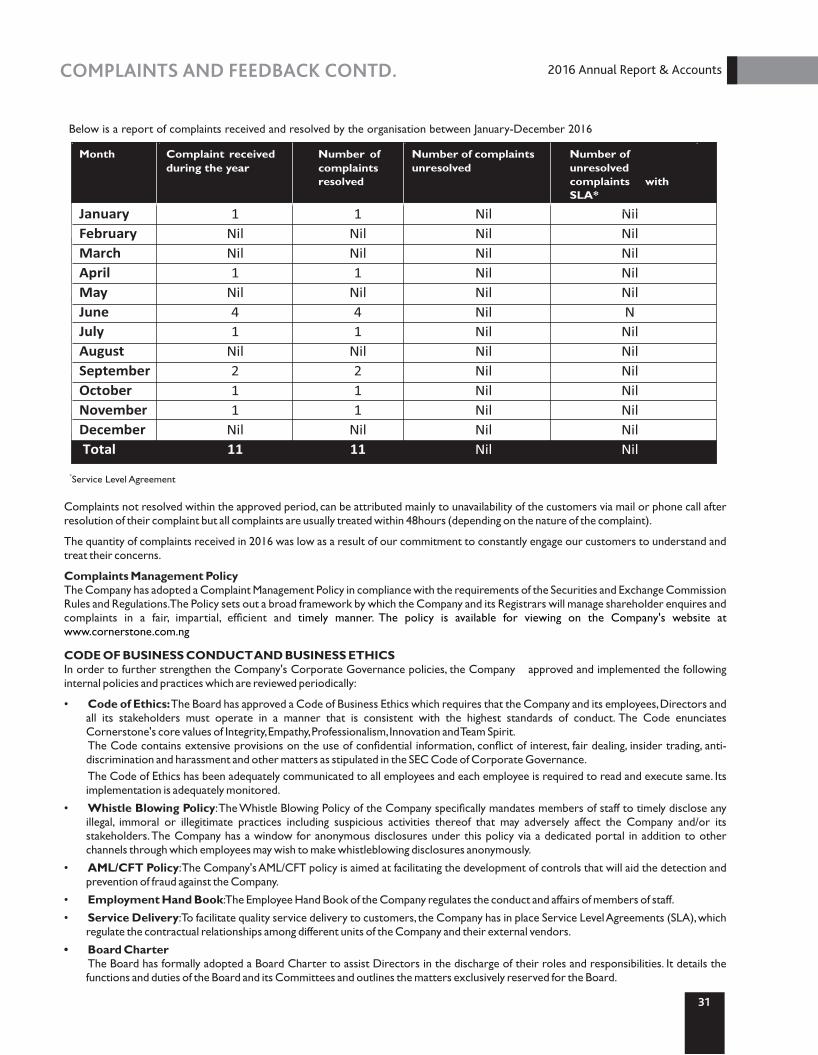
Complaints not resolved within the approved period, can be attributed mainly to unavailability of the customers via mail or phone call after resolution of their complaint but all complaints are usually treated within 48hours (depending on the nature of the complaint).
The quantity of complaints received in 2016 was low as a result of our commitment to constantly engage our customers to understand and treat their concerns.
Complaints Management PolicyThe Company has adopted a Complaint Management Policy in compliance with the requirements of the Securities and Exchange Commission Rules and Regulations. The Policy sets out a broad framework by which the Company and its Registrars will manage shareholder enquires and complaints in a fair, impartial, efficient and timely manner. The policy is available for viewing on the Company's website at www.cornerstone.com.ng
January 1 1 Nil NilFebruary Nil Nil Nil NilMarch
Nil Nil Nil Nil
April
1
1 Nil NilMay
Nil Nil Nil Nil
June
4
4 Nil NJuly
1
1 Nil Nil
August
Nil Nil Nil NilSeptember 2 2 Nil NilOctober 1 1 Nil NilNovember 1
1 Nil NilDecember Nil Nil Nil Nil
Month Complaint received during the year
Number of complaints resolved
Number of complaints unresolved
Number ofunresolved complaints with SLA*
Total 11 11 Nil Nil
*Service Level Agreement
Below is a report of complaints received and resolved by the organisation between January-December 2016
CODE OF BUSINESS CONDUCT AND BUSINESS ETHICSIn order to further strengthen the Company's Corporate Governance policies, the Company approved and implemented the following internal policies and practices which are reviewed periodically:
• The Board has approved a Code of Business Ethics which requires that the Company and its employees, Directors and Code of Ethics:all its stakeholders must operate in a manner that is consistent with the highest standards of conduct. The Code enunciates Cornerstone's core values of Integrity, Empathy, Professionalism, Innovation and Team Spirit.
The Code contains extensive provisions on the use of confidential information, conflict of interest, fair dealing, insider trading, anti-discrimination and harassment and other matters as stipulated in the SEC Code of Corporate Governance.
The Code of Ethics has been adequately communicated to all employees and each employee is required to read and execute same. Its implementation is adequately monitored.
• : The Whistle Blowing Policy of the Company specifically mandates members of staff to timely disclose any Whistle Blowing Policyillegal, immoral or illegitimate practices including suspicious activities thereof that may adversely affect the Company and/or its stakeholders. The Company has a window for anonymous disclosures under this policy via a dedicated portal in addition to other channels through which employees may wish to make whistleblowing disclosures anonymously.
• : The Company's AML/CFT policy is aimed at facilitating the development of controls that will aid the detection and AML/CFT Policyprevention of fraud against the Company.
• : The Employee Hand Book of the Company regulates the conduct and affairs of members of staff.Employment Hand Book• : To facilitate quality service delivery to customers, the Company has in place Service Level Agreements (SLA), which Service Delivery
regulate the contractual relationships among different units of the Company and their external vendors.
• Board Charter The Board has formally adopted a Board Charter to assist Directors in the discharge of their roles and responsibilities. It details the
functions and duties of the Board and its Committees and outlines the matters exclusively reserved for the Board.
31
2016 Annual Report & AccountsCOMPLAINTS AND FEEDBACK CONTD.
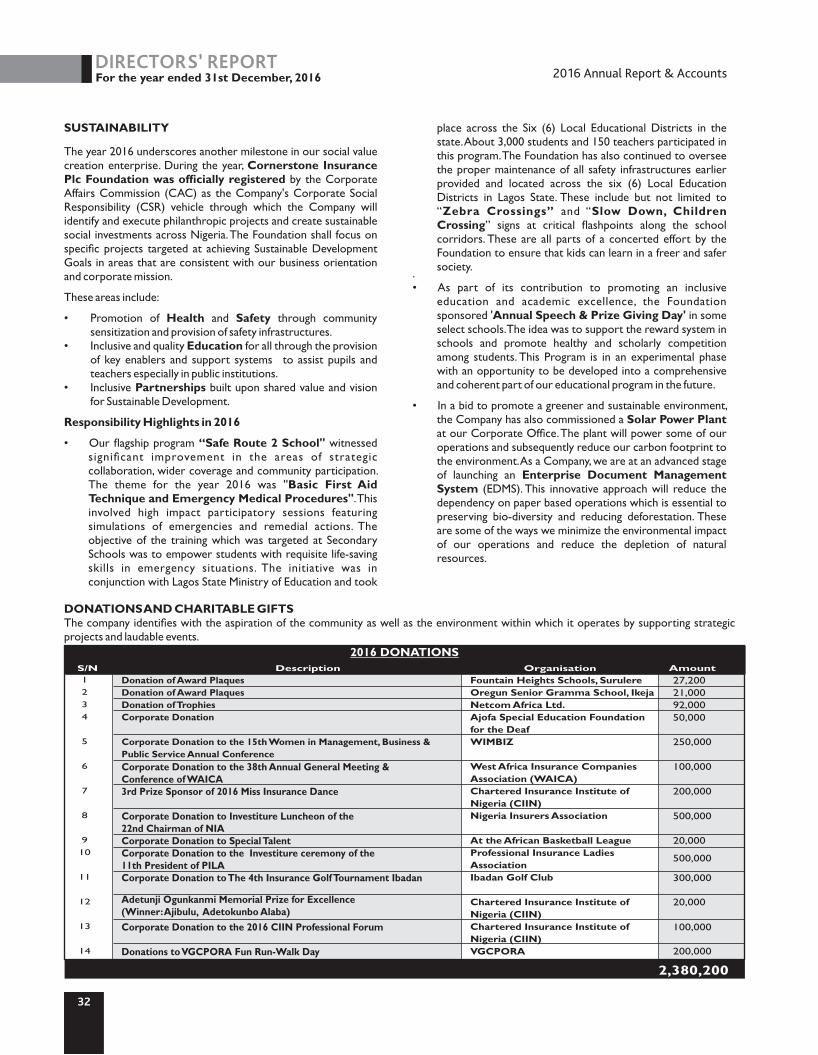
32
2016 Annual Report & AccountsFor the year ended 31st December, 2016DIRECTORS’ REPORT
SUSTAINABILITY
The year 2016 underscores another milestone in our social value creation enterprise. During the year, Cornerstone Insurance Plc Foundation was officially registered by the Corporate Affairs Commission (CAC) as the Company's Corporate Social Responsibility (CSR) vehicle through which the Company will identify and execute philanthropic projects and create sustainable social investments across Nigeria. The Foundation shall focus on specific projects targeted at achieving Sustainable Development Goals in areas that are consistent with our business orientation and corporate mission.
These areas include:
• Promotion of Health and Safety through community sensitization and provision of safety infrastructures.
• Inclusive and quality Education for all through the provision of key enablers and support systems to assist pupils and teachers especially in public institutions.
• Inclusive Partnerships built upon shared value and vision for Sustainable Development.
Responsibility Highlights in 2016
• Our flagship program witnessed “Safe Route 2 School'' significant improvement in the areas of strategic collaboration, wider coverage and community participation. The theme for the year 2016 was ''Basic First Aid Technique and Emergency Medical Procedures''. This involved high impact participatory sessions featuring simulations of emergencies and remedial actions. The objective of the training which was targeted at Secondary Schools was to empower students with requisite life-saving skills in emergency situations. The initiative was in conjunction with Lagos State Ministry of Education and took
place across the Six (6) Local Educational Districts in the state. About 3,000 students and 150 teachers participated in this program. The Foundation has also continued to oversee the proper maintenance of all safety infrastructures earlier provided and located across the six (6) Local Education Districts in Lagos State. These include but not limited to “ and “Zebra Crossings” Slow Down, Children Crossing ” signs at critical flashpoints along the school corridors. These are all parts of a concerted effort by the Foundation to ensure that kids can learn in a freer and safer society..
• As part of its contribution to promoting an inclusive education and academic excellence, the Foundation sponsored ' in some Annual Speech & Prize Giving Day'select schools. The idea was to support the reward system in schools and promote healthy and scholarly competition among students. This Program is in an experimental phase with an opportunity to be developed into a comprehensive and coherent part of our educational program in the future.
• In a bid to promote a greener and sustainable environment, the Company has also commissioned a Solar Power Plant at our Corporate Office. The plant will power some of our operations and subsequently reduce our carbon footprint to the environment. As a Company, we are at an advanced stage of launching an Enterprise Document Management System (EDMS). This innovative approach will reduce the dependency on paper based operations which is essential to preserving bio-diversity and reducing deforestation. These are some of the ways we minimize the environmental impact of our operations and reduce the depletion of natural resources.
1234
5
6
7
8
910
11
12
13
14
Donation of Award PlaquesDonation of Award PlaquesDonation of Trophies Corporate Donation
Corporate Donation to the 15th Women in Management, Business & Public Service Annual ConferenceCorporate Donation to the 38th Annual General Meeting & Conference of WAICA3rd Prize Sponsor of 2016 Miss Insurance Dance
Corporate Donation to Investiture Luncheon of the 22nd Chairman of NIACorporate Donation to Special Talent Corporate Donation to the Investiture ceremony of the 11th President of PILACorporate Donation to The 4th Insurance Golf Tournament Ibadan
Adetunji Ogunkanmi Memorial Prize for Excellence (Winner: Ajibulu, Adetokunbo Alaba)Corporate Donation to the 2016 CIIN Professional Forum
Donations to VGCPORA Fun Run-Walk Day
Fountain Heights Schools, Surulere Oregun Senior Gramma School, IkejaNetcom Africa Ltd.Ajofa Special Education Foundation for the DeafWIMBIZ
West Africa Insurance Companies Association (WAICA)Chartered Insurance Institute of Nigeria (CIIN)Nigeria Insurers Association
At the African Basketball LeagueProfessional Insurance Ladies Association Ibadan Golf Club
Chartered Insurance Institute of Nigeria (CIIN) Chartered Insurance Institute of Nigeria (CIIN) VGCPORA
27,20021,00092,00050,000
250,000
100,000
200,000
500,000
20,000
500,000
300,000
20,000
100,000
2016 DONATIONS S/N Description Organisation Amount
200,000
2,380,200
DONATIONS AND CHARITABLE GIFTSThe company identifies with the aspiration of the community as well as the environment within which it operates by supporting strategic projects and laudable events.
CorruptionThe Board of Directors has a long-standing commitment to good corporate governance, in addition to zero-tolerance to corrupt practices, including bribery and breach of applicable anti-corruption laws. Sections of the Employee hand book stipulate measures that guide staff professional conduct and ethical behavior in line with the Group's core values.
Environmental Policies The Group has established eco-friendly occupational practices as part of its operational resource management system. These practices are targeted at controlling the adverse impact of our operations on the environment to its barest minimum. The Group identifies and complies with applicable environmental laws and regulations.
Cornerstone acknowledges the impact our operations have on the environment; hence we strive to maintain a veritable balance between profit making and environmental protection. In addition to conducting our operations in an environmentally friendly and sustainable manner; the Group continually seeks opportunities for improving its environmental performance standards.
Use of energy efficient office equipment, a practice of e-document usage and storage, prudent use of office paper, deployment of solar energy are practical examples of the Group's sustainable business practices that reduce our carbon footprint.
Events after the reporting date There were no events after the reporting date which could have a material effect on the state of affairs of the Company as at 31 December 2016 and the profit for the year ended on that date that have not been adequately provided for or disclosed in this Annual Report and Accounts.
Auditors Akintola Williams Deloitte will retire in line with the provisions of the NAICOM Code of Corporate Governance on the tenure of External Auditors. The Board is presenting Messrs, KPMG Professional Services at the Annual General Meeting for appointment as External Auditors of the Company. BY ORDER OF THE BOARD
Elizabeth I. Uba-Onubogu Company Secretary (PAC Solicitors) 21, Water Corporation Drive Off Ligali Ayorinde Victoria - Island Lagos, Nigeria
33
2016 Annual Report & AccountsFor the year ended 31st December, 2016DIRECTORS’ REPORT
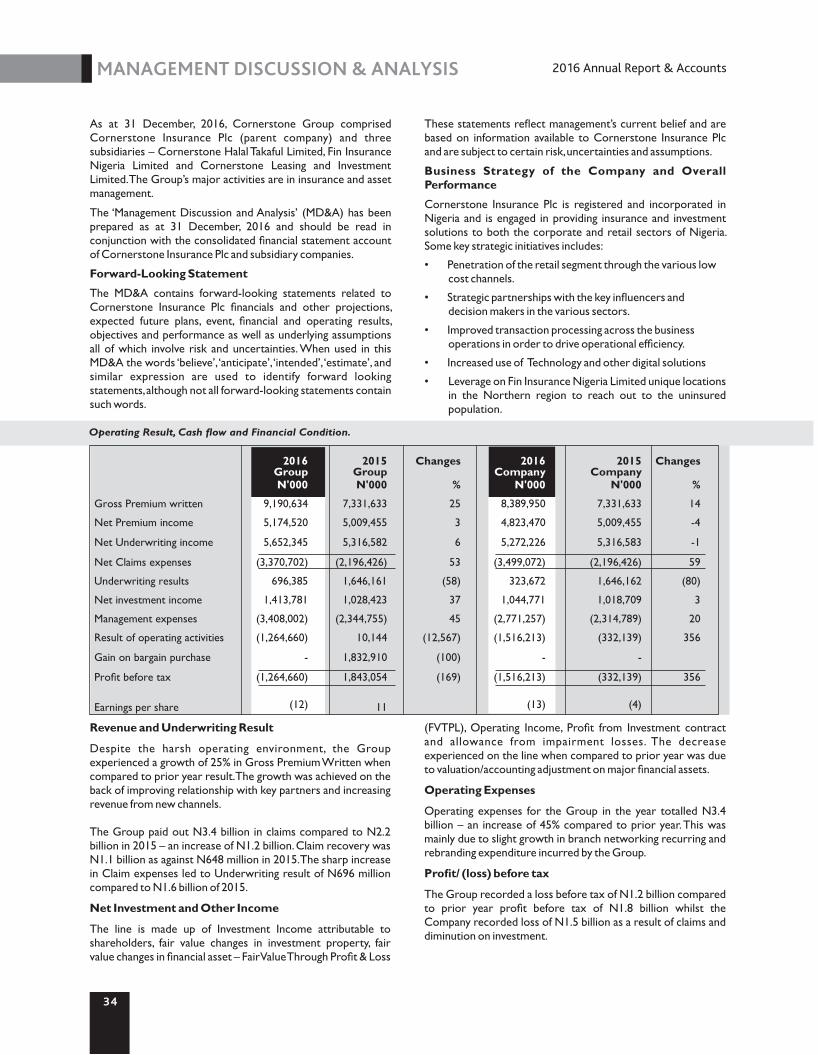
34
MANAGEMENT DISCUSSION & ANALYSIS 2016 Annual Report & Accounts
As at 31 December, 2016, Cornerstone Group comprised Cornerstone Insurance Plc (parent company) and three subsidiaries – Cornerstone Halal Takaful Limited, Fin Insurance Nigeria Limited and Cornerstone Leasing and Investment Limited. The Group’s major activities are in insurance and asset management. The ‘Management Discussion and Analysis’ (MD&A) has been prepared as at 31 December, 2016 and should be read in conjunction with the consolidated financial statement account of Cornerstone Insurance Plc and subsidiary companies. Forward-Looking Statement The MD&A contains forward-looking statements related to Cornerstone Insurance Plc financials and other projections, expected future plans, event, financial and operating results, objectives and performance as well as underlying assumptions all of which involve risk and uncertainties. When used in this MD&A the words ‘believe’, ‘anticipate’, ‘intended’, ‘estimate’, and similar expression are used to identify forward looking statements, although not all forward-looking statements contain such words.
These statements reflect management’s current belief and are based on information available to Cornerstone Insurance Plc and are subject to certain risk, uncertainties and assumptions.
Business Strategy of the Company and Overall Performance Cornerstone Insurance Plc is registered and incorporated in Nigeria and is engaged in providing insurance and investment solutions to both the corporate and retail sectors of Nigeria. Some key strategic initiatives includes: • Penetration of the retail segment through the various low cost channels. • Strategic partnerships with the key influencers and decision makers in the various sectors. • Improved transaction processing across the business operations in order to drive operational efficiency. • Increased use of Technology and other digital solutions • Leverage on Fin Insurance Nigeria Limited unique locations
in the Northern region to reach out to the uninsured population.
Revenue and Underwriting Result Despite the harsh operating environment, the Group experienced a growth of 25% in Gross Premium Written when compared to prior year result. The growth was achieved on the back of improving relationship with key partners and increasing revenue from new channels. The Group paid out N3.4 billion in claims compared to N2.2 billion in 2015 – an increase of N1.2 billion. Claim recovery was N1.1 billion as against N648 million in 2015. The sharp increase in Claim expenses led to Underwriting result of N696 million compared to N1.6 billion of 2015. Net Investment and Other Income The line is made up of Investment Income attributable to shareholders, fair value changes in investment property, fair value changes in financial asset – Fair Value Through Profit & Loss
(FVTPL), Operating Income, Profit from Investment contract and allowance from impairment losses. The decrease experienced on the line when compared to prior year was due to valuation/accounting adjustment on major financial assets. Operating Expenses Operating expenses for the Group in the year totalled N3.4 billion – an increase of 45% compared to prior year. This was mainly due to slight growth in branch networking recurring and rebranding expenditure incurred by the Group. Profit/ (loss) before tax The Group recorded a loss before tax of N1.2 billion compared to prior year profit before tax of N1.8 billion whilst the Company recorded loss of N1.5 billion as a result of claims and diminution on investment.
Operating Result, Cash flow and Financial Condition.
2016
2015
Changes
2016
2015
Changes
Group Group
Company
Company
N'000 N'000 % N'000
N'000 %
Gross Premium written 9,190,634 7,331,633 25 8,389,950 7,331,633 14
Net Premium income 5,174,520 5,009,455 3 4,823,470
5,009,455 -4 Net Underwriting income 5,652,345 5,316,582 6 5,272,226
5,316,583 -1 Net Claims expenses (3,370,702) (2,196,426) 53 (3,499,072)
(2,196,426) 59 Underwriting results
696,385
1,646,161
(58)
323,672
1,646,162
(80)
Net investment income
1,413,781
1,028,423
37
1,044,771
1,018,709
3
Management expenses
(3,408,002)
(2,344,755)
45
(2,771,257)
(2,314,789)
20
Result of operating activities
(1,264,660)
10,144
(12,567)
(1,516,213)
(332,139)
356
Gain on bargain purchase
-
1,832,910
(100)
-
-
Profit before tax
(1,264,660)
1,843,054
(169)
(1,516,213)
(332,139)
356
Earnings per share (12) 11 (13) (4)
TABLE OF CONTENT2016 Annual Report & Accounts
235
We, the Directors on behalf of Cornerstone Insurance PLC, hereby endorse to the best of our knowledge and belief, having made appropriate enquires that:
a. The Company has instituted an operational structure aimed at adhering to the guidelines established by the National Insurance Commission in relation to establishing a risk management framework for Insurers and Reinsurers in Nigeria;
b. The Board is satisfied with the efficacy of the methods surrounding the production of financial information of the Company;
c. The Enterprise Risk Management and Internal Control structure functions are embedded in the Company's operational framework and are functioning effectively.
Mr. Paul KokorichaChairman
FRC/2015/ICAN/00000013047
Mr. Ganiyu MusaManaging Director
FRC/2013/ICAN/00000003110
RISK MANAGEMENT DECLARATIONFor the year ended 31 December, 2016
2
STATEMENT OF DIRECTORS’ RESPONSIBILITIES 2016 Annual Report & Accounts
36
The Directors of Cornerstone Insurance PLC are responsible for the preparation of the consolidated and separate financial statements that give a true and fair view of the financial position of the Group and Company as at 31 December 2016, and the results of its operations, statements of cash flows and changes in equity for the year ended, in compliance with International Financial Reporting Standards ("IFRS") and in the manner required by the Companies and Allied Matters Act of Nigeria, CAP C20, the Insurance Act CAP 117 LFN 2004, relevant guidelines and circulars issued by the National Insurance Commission (NAICOM) and the Financial Reporting Council of Nigeria Act 2011. In preparing the consolidated and separate financial statements, the Directors are responsible for:
• Properly selecting and applying accounting policies;
• Presenting information, including accounting policies, in a manner that provides relevant, reliable, comparable and understandable information;
• Providing additional disclosures when compliance with the specific requirements of the IFRSs are insufficient to enable users to understand the impact of particular transactions, other events and conditions on the Group and Company's financial position and financial performance; and
• Making an assessment of the Group's ability to continue as a going concern.
The Directors are also responsible for:• Designing, implementing and maintaining an
effective and sound system of internal controls throughout the Group and Company;
• Maintaining adequate accounting records that are sufficient to show and explain the Group's and Company's transactions and disclose with reasonable accuracy at any time the financial position of the Group and Company, and which enable them to ensure that the financial statements of the Group and Company comply with IFRS;
• Maintaining statutory accounting records in compliance with the legislation of Nigeria and IFRS;
• Taking such steps as are reasonably available to them to safeguard the assets of the Group and Company; and
• Preventing and detecting fraud and other irregularities.
Going Concern: The Directors have made an assessment of the Group's and Company's ability to continue as a going concern and have no reason to believe the Group and Company will not remain a going concern in the year ahead. The consolidated financial statements of the Group and Company for the year ended 31 December st
2016 were approved by the Board of Directors on 9 March 2017. th
SIGNED ON BEHALF OF THE DIRECTORS BY:
Paul Kokoricha Chairman FRC/2015/ICAN/00000013047
th9 March, 2017
Ganiyu MusaManaging DirectorFRC/2013/ICAN/00000003110
th9 March, 2017
STATEMENT OF DIRECTORS' RESPONSIBILITIES IN RELATION TO THE FINANCIAL STATEMENTS FOR THE YEAR ENDED 31 DECEMBER, 2016
2
REPORT OF THE AUDIT COMMITTEEE 2016 Annual Report & Accounts
37
In accordance with the provisions of Section 359 (6) of the Companies and Allied Matters Act, Cap C20, Laws of the Federation of Nigeria 2004, we the members of the Audit Committee of Cornerstone Insurance PLC report as follows:
1. We have exercised our statutory functions under Section 359 (6) of the Companies and Allied Matters Act, Cap C20, Laws of the Federation of Nigeria 2004 and acknowledge the co-operation of Management and staff in the conduct of these functions.
2. We are of the opinion that the accounting and reporting policies of the Company and Group are in accordance with legal and ethical practices and that the scope of the external and internal audits for the year ended December 31, 2016 was satisfactory and reinforce the Group's internal control systems.
3. We have deliberated with the External Auditors, who confirmed that they received Management's cooperation in the course of their audit and we are satisfied with Management's responses to the Management Letter on the audit of the financial statements of the Company and Group.
Mr. Steve Iwenjora Member, Audit Committee FRC/2015/ICAN/00000012066 3 March, 2017
Members of the Audit Committee are:
1 Mr. Henry Olayemi Chairman/shareholder2 Mr. Eke Chibuzor Emmanuel Member - Shareholders representative3 Mr. Ariyo OlugbosunMember Shareholders representative4 Ms. Elizabeth Amadiume Member Non Executive Director5 Mr. Dominic Ichaba Member Non Executive Director6 Mr. Steve iwenjora Member Non Executive Director
REPORT OF THE AUDIT COMMITTEE FOR THE YEAR ENDED DECEMBER 31, 2016 TO THE MEMBERS OF CORNERSTONE INSURANCE PLC
INDEPENDENT AUDITOR’S REPORT TO THE SHAREHOLDERS OF CORNERSTONE INSURANCE PLCREPORT ON THE AUDIT OF THE CONSOLIDATED AND SEPARATE FINANCIAL STATEMENTS
Under IFRS 4, the Group is required to perform liability adequacy test on its insurance liabilities to ensure the carrying value of the liabilities is adequate.
Liability Adequacy test are carried out separately for the Life and Non-Life business of the Group. As disclosed in note 19 to the consolidated and separate financial statements, the insurance contract liabilities for the Group amounted to N6,941,872,000 (Company: 6,307,846,000) [2015: Group – N5,619,757,000, Company – N4,862,365,000] and this represents 63% of the total liabilities of the Group (Company: 63%) as at 31 December 2016 and 63% in the prior year for both Group and Company.
The Company usually involves an actuary in the determination of its insurance liability on a yearly basis after considering the accuracy and integrity of data used in the valuation. Necessary adjustments are made in the financial statements to reflect the liabilities determined by the actuary.
Key Audit Matter How the matter was addressed in the audit
Insurance contract liabilities
This insurance contract liabilities was significant to our audit because the balance is material to the financial statements. Also, the valuation of Insurance contract liabilities entails the use of assumptions and estimates which may be subject to management bias in the considerations of data used for the actuarial valuation of the insurance contract liabilities.
Our procedures included the following among others: • We reviewed the methodology and processes adopted
by management for making reserves in the books of the company.
• Tested entity’s control around reserving process and maintenance of data for valuation of insurance contract liabilities.
• We reviewed and benchmarked the valuation method of the insurance contract liabilities with the recommended approach by NAICOM and industry best practice.
• We validated the data used in the valuation of the insurance contract liabilities.
• We involved Deloitte Actuary in the review of the assumptions and estimates used by management and
OpinionWe have audited the accompanying consolidated and separate financial statements of Cornerstone Insurance Plc (“the Company”) and its subsidiaries (together referred to as “the Group”) which comprise the consolidated and separate statement of financial position as at 31 December 2016, the consolidated and separate statement of profit or loss and other comprehensive income, consolidated and separate statement of changes in equity, consolidated and separate statements of cash flows for the year then ended and the notes to the consolidated and separate financial statements including a summary of significant accounting policies
In our opinion, the consolidated and separate financial statements give a true and fair view of the consolidated and separate financial position of Cornerstone Insurance Plc as at 31 December 2016 and the consolidated and separate financial performance and statement of cash flows for the year then ended in accordance with the International Financial Reporting Standards, the Companies and Allied Matters Act Cap C20 LFN 2004, the Insurance Act CAP I17 LFN 2004, circulars and guidelines issued by the National Insurance Commission (NAICOM) and the Financial Reporting Council of Nigeria Act, 2011.
Basis for OpinionWe conducted our audit in accordance with International Standards on Auditing (ISAs). Our responsibilities under those standards are further described in the Auditor’s Responsibilities for the Audit of the Consolidated and Separate Financial Statements section of our report. We are independent of the Group in accordance with the requirements of the Institute of Chartered Accountants of Nigeria Professional Code of Conduct and Guide for Accountants (ICAN Code) and other independence requirements applicable to performing audits of financial statements in Nigeria. We have fulfilled our other ethical responsibilities in accordance with the ICAN Code and in accordance with other ethical requirements applicable to performing audits in Nigeria. The ICAN Code is consistent with the International Ethics Standards Board for Accountants Code of Ethics for Professional Accountants (Parts A and B). We believe that the audit evidence we have obtained is sufficient and appropriate to provide a basis for our opinion.
Key Audit MattersKey audit matters are those matters that, in our professional judgment, were of most significance in our audit of the consolidated and separate financial statements of the current year. These matters were addressed in the context of our audit of the consolidated and separate financial statements as a whole, and in forming our opinion thereon, and we do not provide a separate opinion on these matters.
Akintola Williams DeloitteChartered AccountantsCivic Center Towers,Ozumba Mbadiwe Avenue, Victoria Island, Lagos,Nigeria
Tel: +234 (1) 271 78800www.deloitte.com/ng
38

39
assessment of the adequacy of the insurance liabilities in line with Liability Adequacy Test (“LAT”) based on requirement of IFRS 4.
• We ensured the appropriateness of the journals posted, footed and agreed the figures disclosed in the financial statements to the figures stated in the actuarial valuation after thorough review of the basis and assumptions.
• For the purposes of our audit, we focused our audit
effort on the insurance contract liabilities valuation in relation to the assumptions and estimates made by management.
We concluded that the actuarial valuation of the insurance contract liabilities appeared appropriate based on our review of the data, assumptions and basis of estimates.
Other Information
The directors are responsible for the other information. The other information comprises the Directors’ Report and Audit Committee’s Report, which we obtained prior to the date of this auditor’s report, which is expected to be made available to us after that date. The other information does not include the consolidated and separate financial statements and our auditor’s report thereon.
Our opinion on the consolidated and separate financial statements does not cover the other information and we do not express any form of assurance conclusion thereon.
In connection with our audit of the consolidated and separate financial statements, our responsibility is to read the other information and, in doing so, consider whether the other information is materially inconsistent with the consolidated and separate financial statements or our knowledge obtained in the audit, or otherwise appears to be materially misstated.
Based on the work we have performed on the other information that we obtained prior to the date of this auditor’s report, if we conclude that there is a material misstatement of this other information, we are required to report that fact. We have nothing to report in this regard.
Responsibilities of the Directors for the Consolidated and Separate Financial StatementsThe directors are responsible for the preparation of the consolidated and separate financial statements that give a true and fair view in accordance with International Financial Reporting Standards and the requirements of the Companies and Allied Matters Act CAP C20 LFN 2004, Insurance Act CAP I17 LFN 2004, circulars and guidance issued by the National Insurance Commission (NAICOM), Financial Reporting Council Act, 2011 and for such internal control as the directors determine is necessary to enable the preparation of consolidated financial statements that are free from material misstatement, whether due to fraud or error.
In preparing the consolidated and separate financial statements, the directors are responsible for assessing the Group’s and the Company’s ability to continue as a going concern, disclosing, as applicable, matters related to going concern and using the going concern basis of accounting unless the directors either intend to liquidate the Group and the Company or to cease operations, or have no realistic alternative but to do so.
Auditor's Responsibilities for the Audit of Consolidated and Separate Financial StatementsOur objectives are to obtain reasonable assurance about whether the consolidated financial statements as a whole are free from material misstatement, whether due to fraud or error, and to issue an auditor's report that includes our opinion. Reasonable assurance is a high level of assurance, but is not a guarantee that an audit conducted in accordance with ISAs will always detect a material misstatement when it exists. Misstatements can arise from fraud or error and are considered material if, individually or in the aggregate, they could reasonably be expected to influence the economic decisions of users taken on the basis of these consolidated and separate financial statements.
As part of an audit in accordance with ISAs, we exercise professional judgment and maintain professional scepticism throughout the audit. We also:
• Identify and assess the risks of material misstatement of the consolidated and separate financial statements, whether due to fraud or error, design and perform audit procedures responsive to those risks, and obtain audit evidence that is sufficient and appropriate to provide a basis for our opinion. The risk of not detecting a material misstatement resulting from fraud is higher than for one resulting from error, as fraud may involve collusion, forgery, intentional omissions, misrepresentations, or the override of internal control.
• Obtain an understanding of internal control relevant to the audit in order to design audit procedures that are appropriate in the circumstances, but not for the purpose of expressing an opinion on the effectiveness of the Group and the Company's internal control.
• Evaluate the appropriateness of accounting policies used and the reasonableness of accounting estimates and related disclosures made by the directors.
• Conclude on the appropriateness of the directors' use of the going concern basis of accounting and based on the audit evidence obtained, whether a material uncertainty exists relating to events or conditions that may cast significant doubt on the Group and

40
For: Akintola Williams Deloitte Chartered AccountantsLagos, Nigeria18 April, 2017
Engagement partner: Joshua Ojo FRC/2013/ICAN/00000000849
Company's ability to continue as a going concern. If we conclude that a material uncertainty exists, we are required to draw attention in our auditor's report to the related disclosures in the consolidated and separate financial statements or, if such disclosures are inadequate, to modify our opinion. Our conclusions are based on the audit evidence obtained up to the date of our auditor's report. However, future events or conditions may cause the Group and Company to cease to continue as a going concern.
• Evaluate the overall presentation, structure and content of the consolidated and separate financial statements, including the disclosures, and whether the Group and Company's financial statements represent the underlying transactions and events in a manner that achieves fair presentation.
• Obtain sufficient appropriate audit evidence regarding the financial information of the entities or business activities within the Group to express an opinion on the consolidated and separate financial statements. We are responsible for the direction, supervision and performance of the Group's audit. We remain solely responsible for our audit opinion.
We communicate with the audit committee and the directors regarding, among other matters, the planned scope and timing of the audit and significant audit findings, including any significant deficiencies in internal control that we identify during our audit
We also provide the audit committee and directors with a statement that we have complied with relevant ethical requirements regarding independence, and to communicate with them all relationships and other matters that may reasonably be thought to bear on our independence, and where applicable, related safeguards.
From the matters communicated with the audit committee and/or the directors, we determine those matters that were of most significance in the audit of the financial statements of the current year and are therefore the key audit matters. We describe these matters in our auditor's report unless law or regulation precludes public disclosure about the matter or when, in extremely rare circumstances, we determine that a matter should not be communicated in our report because the adverse consequences of doing so would reasonably be expected to outweigh the benefits derivable by the public from such communication.
Report on Other Legal and Regulatory Requirements In accordance with the Sixth Schedule of Companies and Allied Matters Act CAP C20 LFN 2004 we expressly state that:
i) We have obtained all the information and explanation which to the best of our knowledge and belief were necessary for the purpose of our audit.
ii) The Group has kept proper books of account, so far as appears from our examination of those books.iii) The Group and Company's financial position and its statement of profit or loss and other comprehensive income are in
agreement with the books of account and returns.
The Company contravened certain sections of Insurance Act or NAICOM circulars and guidelines with respect to its activities in 2016. The particulars thereof and penalties paid are as disclosed in Note 41 to the financial statements.
POLICIESACCOUNTING

ACCOUNTING POLICIES
1.1 Reporting entity Cornerstone Insurance Plc (the Company) was incorporated on 26th July 1991 as a private limited liability company and converted to a public limited liability company on 17 June 1997. The Company's principal activity continues to be the provision of risk underwriting and related financial services to its customers. Such service includes the provision of Life and Non-life insurance services for both corporate and individual customers.
The Company has two subsidiaries -Fin Insurance Company Limited and Cornerstone Leasing and Investment Limited. Cornerstone Leasing and Investment Limited commenced operations on 1 July 2004 and provides convenient asset acquisition options to both corporate organisations and individuals. FIN Insurance Company Limited however was incorporated in 1981 as Yankari Insurance Company Limited. The name has since changed to FIN Insurance Company Limited in 2008. The main activity of the Company is the provision of General Insurance business. This includes Marine Insurance, Motor Insurance, Accident Insurance, Fire Insurance and other non-life insurance services.
During the year, Cornerstone Insurance Plc acquired a joint venture interest in Caphoenix Cornerstone Limited but this was no consolidated as management considered that control does not exist over the entity. See details in note 12 to the financial statements and section 3.51 of the statement of accounting policies.
The financial statements of Cornerstone Insurance Plc have been prepared on a going concern basis. The directors of the company have a reasonable expectation that the Group and the Company have adequate resources to continue in operational existence for the foreseeable future. The consolidated annual financial statements of the group for the year ended 31 December 2016 comprises the parent company and its subsidiaries.
1.2 Principal activities Cornerstone Insurance Plc and its subsidiaries (the Group) are engaged in various business lines ranging from property-casualty
insurance, life/health insurance, asset management and leasing. The Group’s products are classified at inception, for accounting purposes, as either Insurance contracts or Investment contracts.
A contract that is classified as insurance contract remains an insurance contract for the remainder of its lifetime, even if the insurance risk reduces significantly during this period; unless all rights and obligations are extinguished or expire. Investment contracts can, however, be reclassified as insurance contracts after inception if insurance risk becomes significant.
1.3 Going concern These financial statements have been prepared on the going concern basis. The group has no intention or need to reduce substantially its business operations. The management believes that the going concern assumption is appropriate for the group and company due to sufficient capital adequacy ratio and projected liquidity, based on historical experience that short-term obligations will be refinanced in the normal course of business. Liquidity ratio and continuous evaluation of current ratio of the group is carried out to ensure that there are no going concern threats to the operation of the group.
2.2 Adoption of new and revised International Financial Reporting Standards (IFRS)
2.2.1 New and revised IFRSs affecting amounts
reported and/or disclosures in the financial statements
In the current year, the company has applied a number of new and revised IFRSs issued by the International Accounting Standards Board (IASB) that are mandatorily effective for an accounting period that begins on or after 1 January 2013. New standards and amendments that will be effective for the reporting period that begins on or after 1 January 2016 A number of standards, interpretations and amendments thereto, has been issued by the IASB which are effective but do not impact on these consolidated financial statements as summarised in the table below:
IFRS Effective Date Subject of Standard/Amendment
IFRS 14 Regulatory Deferral Accounts
1 January 2016 IFRS 14 specifies the accounting for regulatory deferral account balances that arise from rate-regulated activities. The Standard is available only to first-time adopters of IFRSs who recognised regulatory deferral account balances under their previous GAAP. IFRS 14 permits eligible first-time adopters of IFRSs to continue their previous GAAP rate-regulated accounting policies, with limited changes, and requires separate presentation of regulatory deferral account balances in the statement of financial position and statementof profit or loss and other comprehensive income. Disclosures are also required to identify the nature of, and risks associated with, the form of rate regulation that has given rise to the recognition of regulatory deferral account balances.
This standard does not impact on the consolidated financial statements as the Group does not provide services subject to rate regulation and in addition, the group has applied IFRS 1 in prior year when converting to IFRS.
42
2016 Annual Report & Accounts
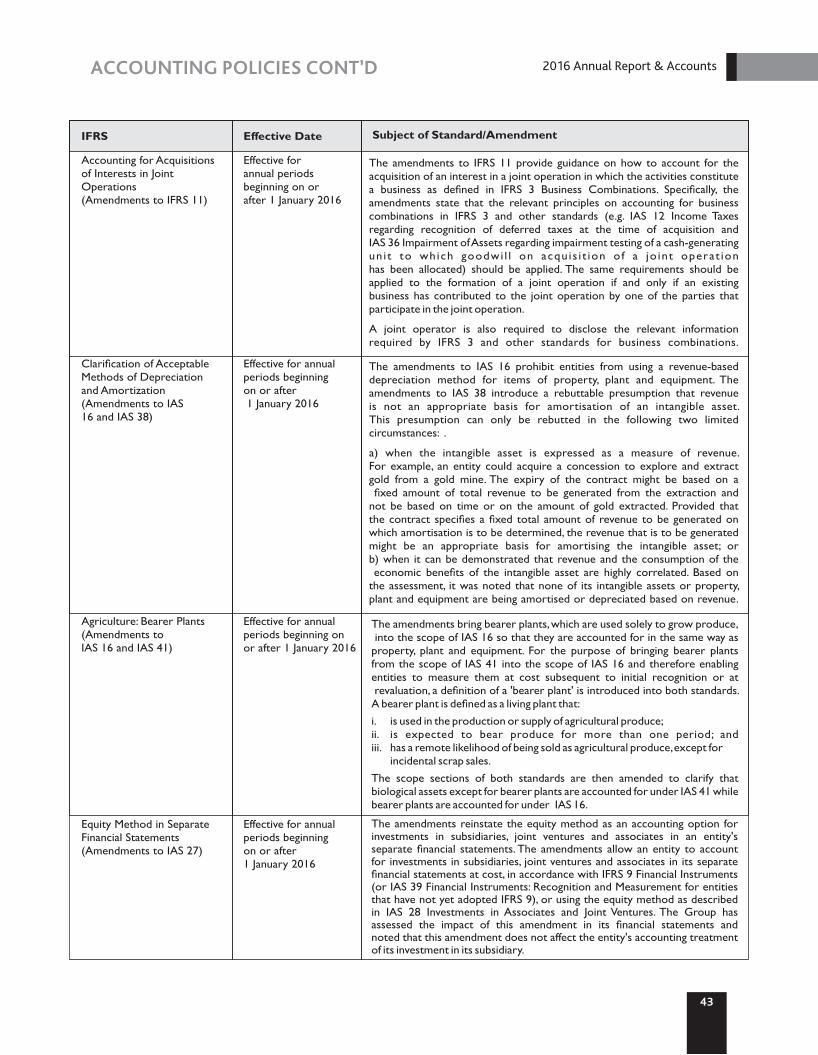
43
ACCOUNTING POLICIES CONT’D 2016 Annual Report & Accounts
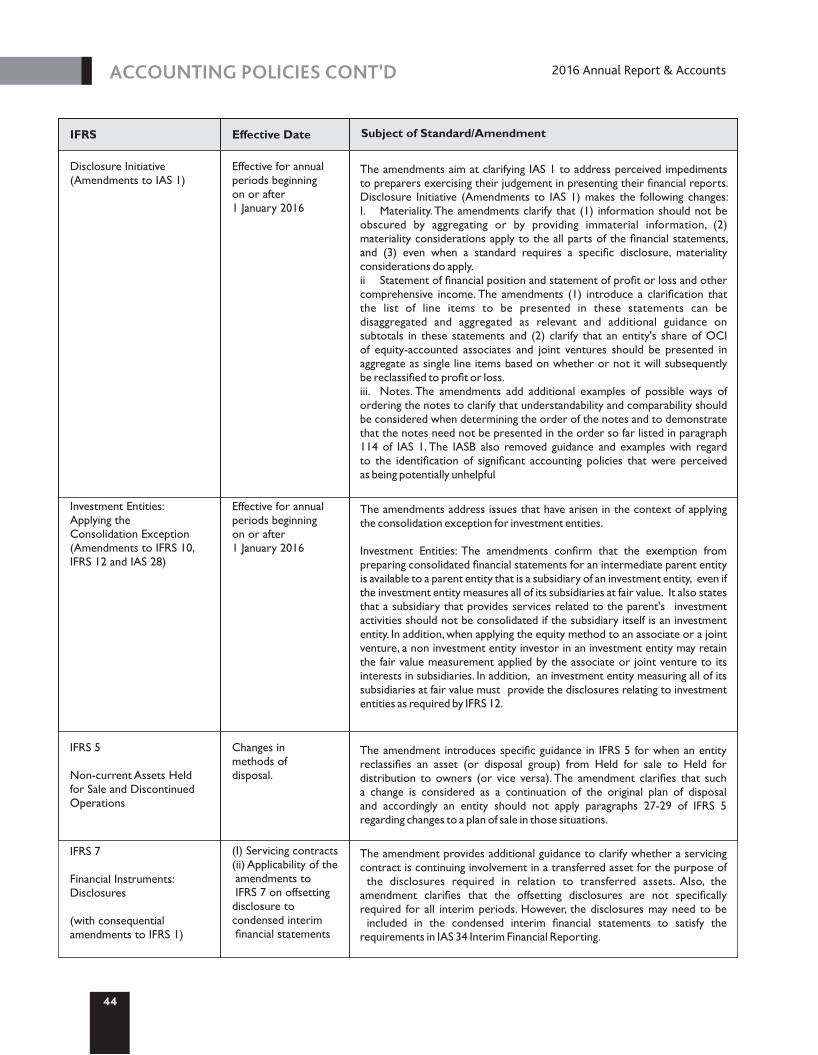
ACCOUNTING POLICIES CONT’D
IFRS Effective Date Subject of Standard/Amendment
Disclosure Initiative (Amendments to IAS 1)
Effective for annual periods beginning on or after 1 January 2016
Investment Entities: Applying the Consolidation Exception (Amendments to IFRS 10, IFRS 12 and IAS 28)
Effective for annual periods beginning on or after 1 January 2016
The amendments aim at clarifying IAS 1 to address perceived impediments to preparers exercising their judgement in presenting their financial reports. Disclosure Initiative (Amendments to IAS 1) makes the following changes: I. Materiality. The amendments clarify that (1) information should not be obscured by aggregating or by providing immaterial information, (2) materiality considerations apply to the all parts of the financial statements, and (3) even when a standard requires a specific disclosure, materiality considerations do apply. ii Statement of financial position and statement of profit or loss and other comprehensive income. The amendments (1) introduce a clarification that the list of line items to be presented in these statements can be disaggregated and aggregated as relevant and additional guidance on subtotals in these statements and (2) clarify that an entity's share of OCI of equity-accounted associates and joint ventures should be presented in aggregate as single line items based on whether or not it will subsequently be reclassified to profit or loss. iii. Notes. The amendments add additional examples of possible ways of ordering the notes to clarify that understandability and comparability should be considered when determining the order of the notes and to demonstrate that the notes need not be presented in the order so far listed in paragraph114 of IAS 1. The IASB also removed guidance and examples with regard to the identification of significant accounting policies that were perceived as being potentially unhelpful
The amendments address issues that have arisen in the context of applying the consolidation exception for investment entities.
Investment Entities: The amendments confirm that the exemption from preparing consolidated financial statements for an intermediate parent entity is available to a parent entity that is a subsidiary of an investment entity, even if the investment entity measures all of its subsidiaries at fair value. It also states that a subsidiary that provides services related to the parent's investment activities should not be consolidated if the subsidiary itself is an investment entity. In addition, when applying the equity method to an associate or a joint venture, a non investment entity investor in an investment entity may retain the fair value measurement applied by the associate or joint venture to its interests in subsidiaries. In addition, an investment entity measuring all of its subsidiaries at fair value must provide the disclosures relating to investment entities as required by IFRS 12.
IFRS 7
Financial Instruments:Disclosures
(with consequential amendments to IFRS 1)
(I) Servicing contracts(ii) Applicability of the amendments to IFRS 7 on offsetting disclosure to condensed interim financial statements
IFRS 5
Non-current Assets Held for Sale and Discontinued Operations
Changes in methods of disposal.
The amendment introduces specific guidance in IFRS 5 for when an entity reclassifies an asset (or disposal group) from Held for sale to Held for distribution to owners (or vice versa). The amendment clarifies that such a change is considered as a continuation of the original plan of disposal and accordingly an entity should not apply paragraphs 27-29 of IFRS 5 regarding changes to a plan of sale in those situations.
The amendment provides additional guidance to clarify whether a servicing contract is continuing involvement in a transferred asset for the purpose of the disclosures required in relation to transferred assets. Also, the amendment clarifies that the offsetting disclosures are not specifically required for all interim periods. However, the disclosures may need to be included in the condensed interim financial statements to satisfy the requirements in IAS 34 Interim Financial Reporting.
44
2016 Annual Report & Accounts

New and revised IFRSs that are not mandatorily effective (but allow early application) for the year ending 31 December 2016 Below is a list of new and revised IFRSs that are not yet mandatorily effective (but allow early application) for the year ending 31 December 2016:
I IFRS 9 Financial Instruments; ii. IFRS 15 Revenue from Contracts with Customers;iii. Amendments to IFRS 10 and IAS 28 Sale or
Contribution of Assets between an Investor and its Associate or Joint Venture
iv. IFRS 16 Leasesv. Amendments to IAS 12 Recognition of Deferred Tax
Assets for Unrealised Lossesvi. Amendments to IAS 7 Additional disclosure on changes
in financing activities vii. Amendments to IFRS 2 Classification and Measurement
of Share-based Payment Transactionsviii. Amendments to IFRS 4 upon applying IFRS 9 IFRS 9 Financial Instruments (Effective for annual periods beginning on or after 1 January 2018)In July 2014, the IASB finalised the reform of financial instruments accounting and issued IFRS 9 (as revised in 2014), which contains the requirements for a) the classification and measurement of financial assets and financial liabilities, (b) impairment methodology, and (c) general hedge accounting.IFRS 9 (as revised in 2014) will supersede IAS 39 Financial
Instruments: Recognition and Measurement upon its effective date. Phase 1:
Classification and measurement of financial assets and financial liabilities With respect to the classification and measurement, the number of categories of financial assets under IFRS 9 has been reduced; all recognised financial assets that are currently within the scope of IAS 39 will be subsequently measured at either amortised cost or fair value under IFRS 9. Specifically: • a debt instrument that (i) is held within a business model
whose objective is to collect the contractual cash flows and (ii) has contractual cash flows that are solely payments of principal and interest on the principal amount outstanding must be measured at amortised cost (net of any write down for impairment), unless the asset is designated at fair value through profit or loss (FVTPL) under the fair value option.
• a debt instrument that (i) is held within a business model
whose objective is achieved both by collecting contractual cash flows and selling financial assets and (ii) has contractual terms that give rise on specified dates to cash flows that are solely payments of principal and interest on the principal amount outstanding, must be measured at fair value through other comprehensive income (FVTOCI), unless the asset is designated at FVTPL under the fair value option.
• all other debt instruments must be measured at FVTPL. • all equity investments are to be measured in the statement of
Standard Subject of amendment Details
Annual Improvements to IFRSs 2010 - 2012 Cycle(Effective for annual periods beginning on or after 1 January 2016, except as detailed below)The Annual Improvements include amendments to a number of IFRSs, which have been summarised below.
IAS 34
Interim Financial Reporting
Disclosure of information 'elsewhere in theinterim financial report'.
IAS 19
Employee Benefits
Discount rate: regional market issue
The amendment clarifies that the rate used to discount post-employment benefit obligations should be determined by reference to market yields at the end of the reporting period on high quality corporate bonds. The basis for conclusions to the amendment also clarifies that the depth of the market for high quality corporate bonds should be assessed at a currency level which is consistent with the currency in which the benefits are to be paid. For currencies for which there is no deep market in such high quality bonds, the market yields (at the end of the reporting period) on government bonds denominated in that currency should be used.
The amendment clarifies the requirements relating to information require by paragraph 16A of IAS 34 that is presented elsewhere within the interim financial report but outside the interim financial statements. The amendment requires that such information to be included either in the interim financial statements or incorporated by way of a cross-reference from the interim financial statements to the other part of the interim financial report that is available to users on the same terms and at the same time as the interim financial statements.
ACCOUNTING POLICIES CONT’D
45
2016 Annual Report & Accounts
financial position at fair value, with gains and losses recognised in profit or loss except that if an equity investment is not held for trading, an irrevocable election can be made at initial recognition to measure the investment at FVTOCI, with dividend income recognised in profit or loss.
IFRS 9 also contains requirements for the classification and measurement of financial liabilities and derecognition requirements. One major change from IAS 39 relates to the presentation of changes in the fair value of a financial liability designated as at FVTPL attributable to changes in the credit risk of that liability. Under IFRS 9, such changes are presented in other comprehensive income, unless the presentation of the effect of the change in the liability’s credit risk in other comprehensive income would create or enlarge an accounting mismatch in profit or loss. Changes in fair value attributable to a financial liability’s credit risk are not subsequently reclassified to profit or loss. Under IAS 39, the entire amount of the change in the fair value of the financial liability designated as FVTPL is presented in profit or loss.
Phase 2: Impairment methodology
The impairment model under IFRS 9 reflects expected credit losses, as opposed to incurred credit losses under IAS 39. Under the impairment approach in IFRS 9, it is no longer necessary for a credit event to have occurred before credit losses are recognised. Instead, an entity always accounts for expected credit losses and changes in those expected credit losses. The amount of expected credit losses should be updated at each reporting date to reflect changes in credit risk since initial recognition.
Phase 3: Hedge accounting
The general hedge accounting requirements of IFRS 9 retain the three types of hedge accounting mechanisms in IAS 39. However, greater flexibility has been introduced to the types of transactions eligible for hedge accounting, specifically broadening the types of instruments that qualify as hedging instruments and the types of risk components of non-financial items that are eligible for hedge accounting. In addition, the effectiveness test has been overhauled and replaced with the principle of an ‘economic relationship’. Retrospective assessment of hedge effectiveness is no longer required. Far more disclosure requirements about an entity’s risk management activities have been introduced.
The work on macro hedging by the IASB is still at a preliminary stage - a discussion paper was issued in April 2014 to gather preliminary views and direction from constituents with a comment period which ended on 17 October 2014. The project is under redeliberation at the time of writing. Transitional provisions
IFRS 9 (as revised in 2014) is effective for annual periods beginning on or after 1 January 2018 with earlier application permitted. If an entity elects to apply IFRS 9 early, it must apply all of the requirements in IFRS 9 at the same time, except for those relating to:
1. The presentation of fair value gains and losses attributable to changes in the credit risk of financial liabilities designated as at FVTPL, the requirements for which an entity may early apply without applying the other requirements in IFRS 9; and
2. hedge accounting, for which an entity may choose to continue to apply the hedge accounting requirements of IAS 39 instead of the requirements of IFRS 9.
An entity may early apply the earlier versions of IFRS 9 instead of the 2014 version if the entity’s date of initial application of IFRS 9 is before 1 February 2015. The date of initial application is the beginning of the reporting period when an entity first applies the requirements of IFRS 9.
IFRS 9 contains specific transitional provisions for I) classification and measurement of financial assets; ii) impairment of financial assets; and iii) hedge accounting. Please see IFRS 9 for details.
IFRS 15 Revenue from Contracts with Customers
(Effective for annual periods beginning on or after 1 January 2018)IFRS 15 establishes a single comprehensive model for entities to use in accounting for revenue arising from contracts with customers. It will supersede the following revenue Standards and Interpretations upon its effective date:
• IAS 18 Revenue; • IAS 11 Construction Contracts; • IFRIC 13 Customer Loyalty Programmes; • IFRIC 15 Agreements for the Construction of Real Estate; • IFRIC 18 Transfers of Assets from Customers; and • SIC 31 Revenue-Barter Transactions Involving Advertising
Services.
As suggested by the title of the new revenue Standard, IFRS 15 will only cover revenue arising from contracts with customers. Under IFRS 15, a customer of an entity is a party that has contracted with the entity to obtain goods or services that are an output of the entity's ordinary activities in exchange for consideration.
Unlike the scope of IAS 18, the recognition and measurement of interest income and dividend income from debt and equity investments are no longer within the scope of IFRS 15. Instead, they are within the scope of IAS 39 Financial Instruments: Recognition and Measurement (or IFRS 9 Financial Instruments, if IFRS 9 is early adopted).
As mentioned above, the new revenue Standard has a single model to deal with revenue from contracts with customers. Its core principle is that an entity should recognise revenue to depict the transfer of promised goods or services to customers in an amount that reflects the consideration to which the entity expects to be entitled in exchange for those goods or services. The new revenue Standard introduces a 5-step approach to revenue recognition and measurement:
ACCOUNTING POLICIES CONT’D
46
2016 Annual Report & Accounts
Step 1: Identify the contract with a customerStep 2: Identify the performance obligations in the contractStep 3: Determine the transaction priceStep 4: Allocate the transaction price to the performance obligations in the contractStep 5: Recognise revenue when (or as) the entity satisfies a performance obligation.
Far more prescriptive guidance has been introduced by the new revenue Standard:
• Whether or not a contract (or a combination of contracts) contains more than one promised good or service, and if so, when and how the promised goods or services should be unbundled.
• Whether the transaction price allocated to each performance obligation should be recognised as revenue over time or at a point in time. Under IFRS 15, an entity recognises revenue when a performance obligation is satisfied, which is when ‘control’ of the goods or services underlying the particular performance obligation is transferred to the customer. Unlike IAS 18, the new Standard does not include separate guidance for 'sales of goods' and 'provision of services'; rather, the new Standard requires entities to assess whether revenue should be recognised over time or a particular point in time regardless of whether revenue relates to 'sales of goods' or 'provision of services'.
• When the transaction price includes a variable consideration element, how it will affect the amount and timing of revenue to be recognised. The concept of variable consideration is broad; a transaction price is considered variable due to discounts, rebates, refunds, credits, price concessions, incentives, performance bonuses, penalties and contingency arrangements. The new Standard introduces a high hurdle for variable consideration to be recognised as revenue – that is, only to the extent that it is highly probable that a significant reversal in the amount of cumulative revenue recognised will not occur when the uncertainty associated with the variable consideration is subsequently resolved.
• When costs incurred to obtain a contract and costs to fulfil a contract can be recognised as an asset.
Amendments to IFRS 10 and IAS 28 Sale or Contribution of Assets between an Investor and its Associate or Joint Venture The amendments clarify that the exemption from preparing consolidated financial statements is available to a parent entity that is a subsidiary of an investment entity, even if the investment entity measures all its subsidiaries at fair value in accordance with IFRS 10. Consequential amendments have also been made to IAS 28 to clarify that the exemption from applying the equity method is also applicable to an investor in an associate or joint venture if that investor is a subsidiary of an investment entity that measures all its subsidiaries at fair value.
The amendments further clarify that the requirement for an investment entity to consolidate a subsidiary providing services related to the former’s investment activities applies only to subsidiaries that are not investment entities themselves.Moreover, the amendments clarify that in applying the equity method of accounting to an associate or a joint venture that is an investment entity, an investor may retain the fair value measurements that the associate or joint venture used for its subsidiaries. Lastly, clarification is also made that an investment entity that measures all its subsidiaries at fair value should provide the disclosures required by IFRS 12 Disclosures of Interests in Other Entities.
The amendments apply retrospectively for annual periods beginning on or after 1 January 2016 with earlier application permitted.
IFRS 16 Leases IFRS 16 Leases was issued, it specifies how an IFRS reporter will recognize, measure, present and disclose leases. The standard provides a single lessee accounting model, requiring lessees to recognize assets and liabilities for all leases unless the lease term is 12 months or less or the underlying asset has a low value. Lessors continue to classify leases as operating or finance, with IFRS 16's approach to lessor accounting substantially unchanged from its predecessor, IAS 17.
Effective date of this standard is 1 January 2018Amendments to IAS 12 Recognition of Deferred Tax Assets for Unrealised LossesIAS 12 Income Taxes was amended to clarify the following aspects: Unrealized losses on debt instruments measured at fair value and measured at cost for tax purposes give rise to a deductible temporary difference regardless of whether the debt instrument's holder expects to recover the carrying amount of the debt instrument by sale or by use. The carrying amount of an asset does not limit the estimation of probable future taxable profits. Estimates for future taxable profits exclude tax deductions resulting from the reversal of deductible temporary differences. An entity assesses a deferred tax asset in combination with other deferred tax assets. Where tax law restricts the utilization of tax losses, an entity would assess a deferred tax asset in combination with other deferred tax assets of the same type.
Effective date of the amendment is 1 January, 2017Amendments to IAS 7 Additional disclosure on changes in financing activities IAS 7 was amended to clarify that entities shall provide disclosures that enable users of financial statements to evaluate changes in liabilities arising from financing activities. Amendments to IFRS 2 Classification and Measurement of Share-based Payment TransactionsIFRS 2 was amended to clarify the standard in relation to the accounting for cash-settled share-based payment transactions that include a performance condition, the classification of share-
ACCOUNTING POLICIES CONT’D
47
2016 Annual Report & Accounts
based payment transactions with net settlement features, and the accounting for modifications of share-based payment transactions from cash-settled to equity-settled.
Effective date is 1 January 2018 Amendments to IFRS 4 upon applying IFRS 9 IFRS 4 Insurance Contracts was amended to provide two options for entities that issue insurance contracts within the scope of IFRS 4:
i. an option that permits entities to reclassify, from profit or loss to other comprehensive income, some of the income or expenses arising from designated financial assets; this is the so-called overlay approach;
ii. an optional temporary exemption from applying IFRS 9 for entities whose predominant activity is issuing contracts within the scope of IFRS 4; this is the so-called deferral approach.
The application of both approaches is optional and an entity is permitted to stop applying them before the new insurance contracts standard is applied. Overlay approach to be applied when IFRS 9 is first applied.
3 SIGNIFICANT ACCOUNTING POLICIES 3.1 Statement of compliance
The consolidated financial statements have been prepared in accordance with International Financial Reporting Standards ("IFRS") issued by the International Accounting Standards Board (IASB) and adopted by the Financial Reporting Council of Nigeria for the financial year starting from 1 January, 2016. The consolidated financial statements comply with the requirement of the Companies and Allied Matters Act CAP C20 LFN 2004, Insurance Act, CAP 117 LFN 2004 and the Guidelines issued by the National Insurance Commission to the extent that they are not in conflict with the International Financial Reporting Standards (IFRS). 3.2 Basis of preparation
The Consolidated and separate financial statements for the year ended 31 December 2016 have been prepared in accordance with the International Financial Reporting Standards and IFRS Interpretation committee (IFRIC) applicable to companies reporting under IFRS.
Basis of measurement
These consolidated and separate financial statements have been prepared on the historical cost basis except for the following:
• non-derivative financial instruments designated at fair value through profit or loss.
• available-for-sale financial assets are measured at fair value.
• held for trading assets measured at fair value.• investment property is measured at fair value.• insurance liabilities measured at present value of future
cashflows.• share based payment at fair value or an approximation of
fair value allowed by the relevant standard
The consolidated and separate financial statements have been prepared on the historical cost basis except for certain properties and financial instruments that are measured at revalued amounts or fair values, as explained in the accounting policies below. Historical cost is generally based on the fair value of the consideration given in exchange transactions except for certain investments whose valuation was based on observable input from asset managers. 3.3 Reporting currency
The consolidated and separate financial statements are presented in Nigeria Naira (=N=) and are rounded to the nearest thousand (‘000) unless otherwise stated. 3.4 Basis of consolidation
The consolidated financial statements incorporate the financial statements of the Company and its subsidiaries.
IFRS 10 changes the definition of control such that an investor has control over an investee when (a) it has power over the investee, (b) it is exposed, or has rights, to variable returns from its involvement with the investee and (c) has the ability to use its power to affect its returns. All three of these criteria must be met for an investor to have control over an investee. Previously, control was defined as the power to govern the financial and operating policies of an entity so as to obtain benefits from its activities.
Income and expenses of subsidiaries acquired or disposed of during the year are included in the consolidated statement of comprehensive income from the effective date of acquisition and up to the effective date of disposal, as appropriate. Total comprehensive income of subsidiaries is attributed to the owners of the Company and to the non-controlling interests even if this results in the non-controlling interests having a deficit balance. When necessary, adjustments are made to the financial statements of subsidiaries to bring their accounting policies in line with the Group accounting policies. All intra-group transactions, balances, income and expenses are eliminated in full on consolidation. 3.5 Changes in the Group's ownership interest in
existing subsidiaries
Changes in the Group's ownership interests in subsidiaries that do not result in the Group losing control over the subsidiaries are accounted for as equity transactions. The carrying amounts of the Group's interests and the non-controlling interests are
ACCOUNTING POLICIES CONT’D
48
2016 Annual Report & Accounts
ACCOUNTING POLICIES CONT’D
49
2016 Annual Report & Accounts
adjusted to reflect the changes in their relative interests in the subsidiaries. Any difference between the amount by which the non-controlling interests are adjusted and the fair value of the consideration paid or received is recognized directly in equity and attributed to owners of the Company. When the Group loses control of a subsidiary, a gain or loss is recognized in profit or loss and is calculated as the difference between: (i) the aggregate of the fair value of the consideration received and the fair value of any retained interest and; (ii) the previous carrying amount of the assets (including goodwill), and liabilities of the subsidiary and any non-controlling interests. When assets of the subsidiary are carried at revalued amounts or fair values and the related cumulative gain or loss has been recognized in other comprehensive income and accumulated in equity, the amounts previously recognized in other comprehensive income and accumulated in equity are accounted for as if the Group had directly disposed of the relevant assets (i.e. reclassified to profit or loss or transferred directly to retained earnings as specified by applicable IFRSs). The fair value of any investment retained in the former subsidiary at the date when control is lost is regarded as the fair value on initial recognition for subsequent accounting under IAS 39 Financial Instruments: Recognition and Measurement, or when applicable, the cost on initial recognition of an investment in an associate or a jointly controlled entity. 3.5.1 A joint venture is a joint arrangement whereby the parties that have joint control of the arrangement have rights to the net assets of the joint arrangement. Joint control is the contractually agreed sharing of control of an arrangement, which exists only when decisions about the relevant activities require unanimous consent of the parties sharing control.
An investment in a joint venture is accounted for using the equity method from the date on which the investee becomes a joint venture in accordance with the provision of IFRS 11:24.
The results of a joint venture is incorporated in these consolidated financial statements using the equity method of accounting, except when the investment, or a portion thereof, is classified as held for sale, in which case it is accounted for in accordance with IFRS 5. Under the equity method, an investment in a joint venture is initially recognized in the consolidated statement of financial position at cost and adjusted thereafter to recognize the Group’s share of the profit or loss and other comprehensive income of the joint venture. When the Group’s share of losses of a joint venture exceeds the Group’s interest in that joint venture (which includes any long-term interests that, in substance, form part of the Group’s net investment in the joint venture), the Group discontinues recognizing its share of further losses. Additional losses are recognized only to the extent that the Group has incurred legal or constructive obligations or made payments on behalf of the joint venture.
3.6 Foreign currenciesIn preparing the financial statements of each individual group entity, transactions in currencies other than the entity's functional currency (foreign currencies) are recognized at the rates of exchange prevailing at the dates of the transactions. At the end of each reporting period, monetary items denominated in foreign currencies are retranslated at the rates prevailing at that date. Non-monetary items carried at fair value that are denominated in foreign currencies are retranslated at the rates prevailing at the date when the fair value was determined.
Non-monetary items that are measured in terms of historical cost in a foreign currency are not translated. Exchange differences on monetary items are recognized in profit or loss in the period in which they arise except for: * Exchange differences on foreign currency borrowings relating to assets under construction for future productive use, which are included in the cost of those assets when they are regarded as an adjustment to interest costs on those foreign currency borrowings;
* Exchange differences on transactions entered into in order to hedge certain foreign currency risks (below for hedging accounting policies); and
* Exchange differences on monetary items receivable from or payable to a foreign operation for which settlement is neither planned nor likely to occur (therefore forming part of the net investment in the foreign operation), which are recognized initially in other comprehensive income and reclassified from equity to profit or loss on repayment of the monetary items.
For the purposes of presenting consolidated financial statements, the assets and liabilities of the Group's foreign operations are translated into currency units using exchange rates prevailing at the end of each reporting period. Income and expense items are translated at the average exchange rates for the period, unless exchange rates fluctuate significantly during that period, in which case the exchange rates at the dates of the transactions are used. Exchange differences arising, if any, are recognized in other comprehensive income and accumulated in equity (attributed to non-controlling interests as appropriate).On the disposal of a foreign operation (i.e. a disposal of the Group's entire interest in a foreign operation, or a disposal involving loss of control over a subsidiary that includes a foreign operation, a disposal involving loss of joint control over a jointly controlled entity that includes a foreign operation, or a disposal involving loss of significant influence over an associate that includes a foreign operation), all of the exchange differences accumulated in equity in respect of that operation attributable to the owners of the Company are reclassified to profit or loss.
In addition, in relation to a partial disposal of a subsidiary that does not result in the Group losing control over the subsidiary, the proportionate share of accumulated exchange differences

are re-attributed to non-controlling interests and are not recognized in profit or loss. For all other partial disposals (i.e. partial disposals of associates or jointly controlled entities that do not result in the Group losing significant influence or joint control), the proportionate share of the accumulated exchange differences is reclassified to profit or loss.
Fair value adjustments on identifiable assets and liabilities acquired arising on the acquisition of a foreign operation are treated as assets and liabilities of the foreign operation and translated at the rate of exchange prevailing at the end of each reporting period. Exchange differences arising are recognized in equity. 3.7 Cash and cash equivalents
Cash and cash equivalents include cash in hand, deposits held at call with banks and other short term highly liquid investments with original maturities of three months or less, these assets readily convertible into known amounts of cash. Cash and cash equivalents comprise cash at bank and in hand and short-term deposits with an original maturity of three months or less in the statement of financial position.
3.8 Financial instruments
Financial assets are classified into the following specified categories: financial assets ‘at fair value through profit or loss' (FVTPL), ‘held-to-maturity' investments, ‘available-for-sale' (AFS) financial assets and ‘loans and receivables'. The classification depends on the nature and purpose of the financial assets and is determined at the time of initial recognition. All regular way purchases or sales of financial assets are recognized and derecognized on a trade date basis. Regular way purchases or sales are purchases or sales of financial assets that require delivery of assets within the time frame established by regulation or convention in the marketplace.
3.9 Effective interest method
The effective interest method is a method of calculating the amortized cost of a debt instrument and of allocating interest income over the relevant period. The effective interest rate is the rate that exactly discounts estimated future cash receipts (including all fees and points paid or received that form an integral part of the effective interest rate, transaction costs and other premiums or discounts) through the expected life of the debt instrument, or, where appropriate, a shorter period, to the net carrying amount on initial recognition. Income is recognized on an effective interest basis for debt instruments other than those financial assets classified as at FVTPL.
3.10 Financial assets at fair value through profit or loss
Financial assets are classified as at fair value through profit or loss when the financial asset is either held for trading or it is designated as at FVTPL.
A financial asset is classified as held for trading if:
* It has been acquired principally for the purpose of selling it in the near term; or
* On initial recognition it is part of a portfolio of identified financial instruments that the Group manages together and has a recent actual pattern of short-term profit-taking; or
* A financial asset other than a financial asset held for trading may be designated as at FVTPL upon initial recognition if:
* Such designation eliminates or significantly reduces a measurement or recognition inconsistency that would otherwise arise; or
* The financial asset forms part of a group of financial assets or financial liabilities or both, which is managed and its performance is evaluated on a fair value basis, in accordance with the Group's documented risk management or investment strategy, and information
n about the grouping is provided internally on that basis; or
* It forms part of a contract containing one or more embedded derivatives, and IAS 39 Financial Instruments: Recognition and Measurement permits the entire combined contract (asset or liability) to be designated as at FVTPL.
Financial assets at FVTPL are stated at fair value, with any gains or losses arising on remeasurement recognized in profit or loss. The net gain or loss recognized in profit or loss incorporates any dividend or interest earned on the financial asset and is included in the ‘other gains and losses' line item in the consolidated statement of comprehensive income/income statement. 3.11 Loans and receivables
Loans and receivables are non-derivative financial assets with fixed or determinable payments and fixed maturity dates that are not quoted in an active market, which the Group has the positive intent and ability to hold to maturity. Subsequent to initial recognition, held-to-maturity investments are measured at amortized cost using the effective interest method less any impairment. 3.12 Available-for-sale financial assets (AFS financial assets)
AFS financial assets are non-derivatives that are either designated as available for sale or are not classified as (a) loans and receivables, (b) held-to-maturity investments or (c) financial assets at fair value through profit or loss.
The Group also has investments in unlisted shares that are not traded in an active market but that are also classified as AFS financial assets and stated at fair value at the end of each reporting period (because the directors consider that fair value
ACCOUNTING POLICIES CONT’D
50
2016 Annual Report & Accounts
can be reliably measured). . Changes in the carrying amount of AFS monetary financial assets relating to changes in foreign currency rates, interest income calculated using the effective interest method and dividends on available for sale equity investments are recognized in profit or loss. Other changes in the carrying amount of available-for-sale financial assets are recognized in other comprehensive income and accumulated under the heading of investments revaluation reserve. When the investment is disposed of or is determined to be impaired, the cumulative gain or loss previously accumulated in the investments revaluation reserve is reclassified to profit or loss.
Dividends on available for sale equity instruments are recognized in profit or loss when the Group's right to receive the dividends is established.
The fair value of AFS monetary financial assets denominated in a foreign currency is determined in that foreign currency and translated at the spot rate prevailing at the end of the reporting period. The foreign exchange gains and losses that are recognized in profit or loss are determined based on the amortized cost of the monetary asset. Other foreign exchange gains and losses are recognized in other comprehensive income.
Available for sale equity investments that do not have a quoted market price in an active market and whose fair value cannot be reliably measured and derivatives that are linked to and must be settled by delivery of such unquoted equity investments are measured at cost less any identified impairment losses at the end of each reporting period. 3.13 Impairment of financial assets
Financial assets, other than those at fair value through profit or loss, are assessed for indicators of impairment at the end of each reporting period. Financial assets are considered to be impaired when there is objective evidence that, as a result of one or more events that occurred after the initial recognition of the financial asset, the estimated future cash flows of the investment have been affected. For available for sale equity investments, a significant or prolonged decline in the fair value of the security below its cost is considered to be objective evidence of impairment.For all other financial assets, objective evidence of impairment could include:
* Significant financial difficulty of the issuer or counterparty; or
* Breach of contract, such as a default or delinquency in interest or principal payments; or
* It becoming probable that the borrower will enter bankruptcy or financial re-organisation; or
* The disappearance of an active market for that financial asset because of financial difficulties.
For financial assets carried at amortized cost, the amount of the impairment loss recognized is the difference between the asset's carrying amount and the present value of estimated future cash flows, discounted at the financial asset's original effective interest rate.
For financial assets carried at cost, the amount of the impairment loss is measured as the difference between the asset's carrying amount and the present value of the estimated future cash flows discounted at the current market rate of return for a similar financial asset. Such impairment loss will not be reversed in subsequent periods.
The carrying amount of the financial asset is reduced by the impairment loss directly for all financial assets with the exception of trade receivables, where the carrying amount is reduced through the use of an allowance account. When a trade receivable is considered uncollectible, it is written off against the allowance account. Subsequent recoveries of amounts previously written off are credited against the allowance account. Changes in the carrying amount of the allowance account are recognized in profit or loss. When an AFS financial asset is considered to be impaired, cumulative gains or losses previously recognized in other comprehensive income are reclassified to profit or loss in the period.
For financial assets measured at amortized cost, if, in a subsequent period, the amount of the impairment loss decreases and the decrease can be related objectively to an event occurring after the impairment was recognized, the previously recognized impairment loss is reversed through profit or loss to the extent that the carrying amount of the investment at the date the impairment is reversed does not exceed what the amortized cost would have been had the impairment not been recognized. In respect of AFS equity securities, impairment losses previously recognized in profit or loss are not reversed through profit or loss. Any increase in fair value subsequent to an impairment loss is recognized in other comprehensive income and accumulated under the heading of investments revaluation reserve. In respect of AFS debt securities, impairment losses are subsequently reversed through profit or loss if an increase in the fair value of the investment can be objectively related to an event occurring after the recognition of the impairment loss.
3.14 Determination of fair value
For financial instruments traded in active markets, the determination of fair values of financial assets and financial liabilities is based on quoted market prices or dealer price quotations. This includes listed equity securities and quoted debt instruments on major exchanges. The quoted market price used for financial assets held by the company is the current bid price.
A financial instrument is regarded as quoted in an active market if quoted prices are readily and regularly available from an exchange, dealer, broker, industry group, pricing service or regulatory agency, and those prices represent actual and regularly occurring market transactions on an arm’s length basis. If the above criteria are not met, the market is regarded as being inactive.
For all other financial instruments, fair value is determined using
ACCOUNTING POLICIES CONT’D
51
2016 Annual Report & Accounts
ACCOUNTING POLICIES CONT’D
52
2016 Annual Report & Accounts
valuation techniques. In these techniques, fair values are estimated from observable data in respect of similar financial instruments, using models to estimate the present value of expected future cash flows or other valuation techniques, using inputs (for example, NIBOR, MPR etc.) existing at the dates of the statement of financial position.
The company uses widely recognised money market rates in determining fair values of non-standardised financial instruments of lower complexity like placements, and treasury bills. These financial instruments models are generally market observable. The carrying value less impairment provision of trade receivables and payables are assumed to approximate their fair values.
The fair value of financial liabilities for disclosure purposes is estimated by discounting the future contractual cash flows at the current market interest rate that is available to the company for similar financial instruments. 3.15 Derecognition of financial assets
The Group derecognizes a financial asset only when the contractual rights to the cash flows from the asset expire, or when it transfers the financial asset and substantially all the risks and rewards of ownership of the asset to another entity. If the Group neither transfers nor retains substantially all the risks and rewards of ownership and continues to control the transferred asset, the Group recognizes its retained interest in the asset and an associated liability for amounts it may have to pay.
If the Group retains substantially all the risks and rewards of ownership of a transferred financial asset, the Group continues to recognize the financial asset and also recognizes a collateralized borrowing for the proceeds received.
On derecognition of a financial asset in its entirety, the difference between the asset's carrying amount and the sum of the consideration received and receivable and the cumulative gain or loss that had been recognized in other comprehensive income and accumulated in equity is recognized in profit or loss. On derecognition of a financial asset other than in its entirety (e.g. when the Group retains an option to repurchase part of a transferred asset), the Group allocates the previous carrying amount of the financial asset between the part it continues to recognize under continuing involvement, and the part it no longer recognizes on the basis of the relative fair values of those parts on the date of the transfer. The difference between the carrying amount allocated to the part that is no longer recognized and the sum of the consideration received for the part no longer recognized and any cumulative gain or loss allocated to it that had been recognized in other comprehensive income is recognized in profit or loss. A cumulative gain or loss that had been recognized in other comprehensive income is allocated between the part that continues to be recognized and the part that is no longer recognized on the basis of the relative fair values of those parts.
3.16 Trade receivables
Receivables include amounts due from agents, brokers and
insurance contract holders. Receivables arising under insurance contracts are measured on initial recognition at the fair value of the consideration received or receivable. Subsequent to initial recognition, insurance receivables are measured at amortised cost, using the effective interest rate method. The carrying value of insurance receivables is reviewed for impairment whenever events or circumstances indicate that the carrying amount may not be recoverable, with the impairment loss recorded in the income statement.
3.17 Other receivables
Other receivables principally consist of prepayments, accrued income and sundry debtors and are carried at amortised cost. 3.18.1 Reinsurance contracts
The Group enters into reinsurance contracts in the normal course of business in order to limit the potential for losses arising from certain exposures. Outwards reinsurance premiums are accounted for in the same period as the related premiums for the direct inwards reinsurance business being reinsured. 3.18.2 Reinsurance Assets
The Group cedes insurance risk in the normal course of business on the bases of our treaty and facultative agreements. Reinsurance assets represent balances due from reinsurance companies. Amounts recoverable from reinsurers are estimated in a manner consistent with settled claims associated with the reinsurer’s policies and are in accordance with the related reinsurance contract. The Group assesses its reinsurance assets for impairment at each reporting date or move frequently when an indication of impairment arises during the reporting year. If there is objective evidence that the reinsurance asset is impaired, the Group reduces the carrying amount of the reinsurance asset to its recoverable amount and recognises that impairment loss in the income statement. The Group gathers the objective evidence that a reinsurance asset it impaired using the same process adopted for financial assets held at amortised cost. The impairment loss is calculated using the incurred loss model for these financial assets.
Premiums, losses and other amounts relating to reinsurance treaties are recognized over the period from inception of a treaty to expiration of the related business.
Ceded reinsurance arrangements do not relieve the Company from its obligations to policyholders.Reinsurance assets or liabilities are derecognized when the contractual rights are extinguished or expire or when the contract is transferred to another party.Reinsurance contracts that do not transfer significant insurance risk are accounted for directly through the statement of financial position. These are deposit assets that are recognised based on the consideration paid less any explicit identified premiums or fees to be retained by the reinsured.
Investment income on these contracts is accounted for using the effective interest rate method when accrued.
3.18.3 Impairment of reinsurance asset
Reinsurance assets are subject to impairment testing and the carrying amount is reduced to its recoverable amount. The impairment loss is recognised as an expense in the income statement. The asset is impaired if objective evidence is available to suggest that it is probable that the Group will not be able to collect the amounts due from reinsurers.
3.18.4 Reinsurance recoveries
Reinsurance recoveries in respect of incurred but not reported (IBNR) claims are assumed to be consistent with the historical recoveries on paid and outstanding claims, adjusted to reflect changes in the nature and extent of the Group’s reinsurance programmes. An assessment is made of the recoverability of reinsurance having regard to available data on the financial strength of the reinsurance companies. 3.18.5 Reinsurance liabilities
Reinsurance liabilities comprise premiums payable for outwards reinsurance contracts and are recognised as an expense when due. Gains or losses on buying reinsurance are recognised in income at the date of purchase and are not amortised. 3.19 Deferred charges
3.19.1 Deferred acquisition costs and deferred origination costs
The incremental costs directly attributable to the acquisition of new business for other participating investment contracts are deferred by recognising an asset. For other insurance contracts, acquisition costs including both incremental acquisition costs and other indirect costs of acquiring and processing new businesses are deferred (deferred acquisition costs).
For investment contracts without discretionary features incremental costs directly attributable to acquiring the contracts are deferred (deferred original costs) Where such business is reinsured the reinsurers’ share is carried forward as deferred income.
Deferred acquisition costs and deferred origination costs are amortised systematically over the life of the contracts and tested for impairment at each reporting date. Any amount not recoverable is expensed. They are derecognised when the related contracts are settled or disposed of. 3.19.2 Deferred income - Reinsurance commissions
The Group recognises commissions receivable on outwards reinsurance contracts as a deferred income and amortised over
the average term of the expected premiums payable. 3.19.3 Deferred expenses- Investment management
services
The Group defers those incremental costs incurred during the financial period directly attributable to securing investment contracts without discretionary participation features (DPF), under which the Group renders investment management services (to the extent that these costs can be identified separately, measured reliably and it is probable that these costs will be recovered out of future revenue margins); and amortised over the average expected period.
Incremental cost is a cost that would not have been incurred if the Group had not secured the investment contracts without DPF. The other transaction costs are included in the financial liability in accordance with IAS 39.
For all deferred charges under an insurance contracts and investment contracts (with or without DPF), an impairment review is performed at the end of each reporting period, or more frequently, when an indication of impairment arises. When the recoverable amount is less than the carrying amount, an impairment loss is recognised in profit or loss. The group equally assesses "future servicing rights" in order to establishing an onerous contract provision for each reporting period. 3.20 Leasing
Leases are classified as finance leases whenever the terms of the lease transfer substantially all the risks and rewards of ownership to the lessee. All other leases are classified as operating leases. 3.20.1 The Group as a lessor
Amounts due from lessees under finance leases are recognized as receivables at the amount of the Group's net investment in the leases. Finance lease income is allocated to accounting periods so as to reflect a constant periodic rate of return on the Group's net investment outstanding in respect of the leases.
Rental income from operating leases is recognized on a straight-line basis over the term of the relevant lease. Initial direct costs incurred in negotiating and arranging an operating lease are added to the carrying amount of the leased asset and recognized on a straight-line basis over the lease term. 3.20.2 The Group as a lessee
Assets held under finance leases are initially recognized as assets of the Group at their fair value at the inception of the lease or, if lower, at the present value of the minimum lease payments. The corresponding liability to the lessor is included in the consolidated statement of financial position as a finance lease obligation.
Lease payments are apportioned between finance expenses and reduction of the lease obligation so as to achieve a constant rate
ACCOUNTING POLICIES CONT’D
53
2016 Annual Report & Accounts
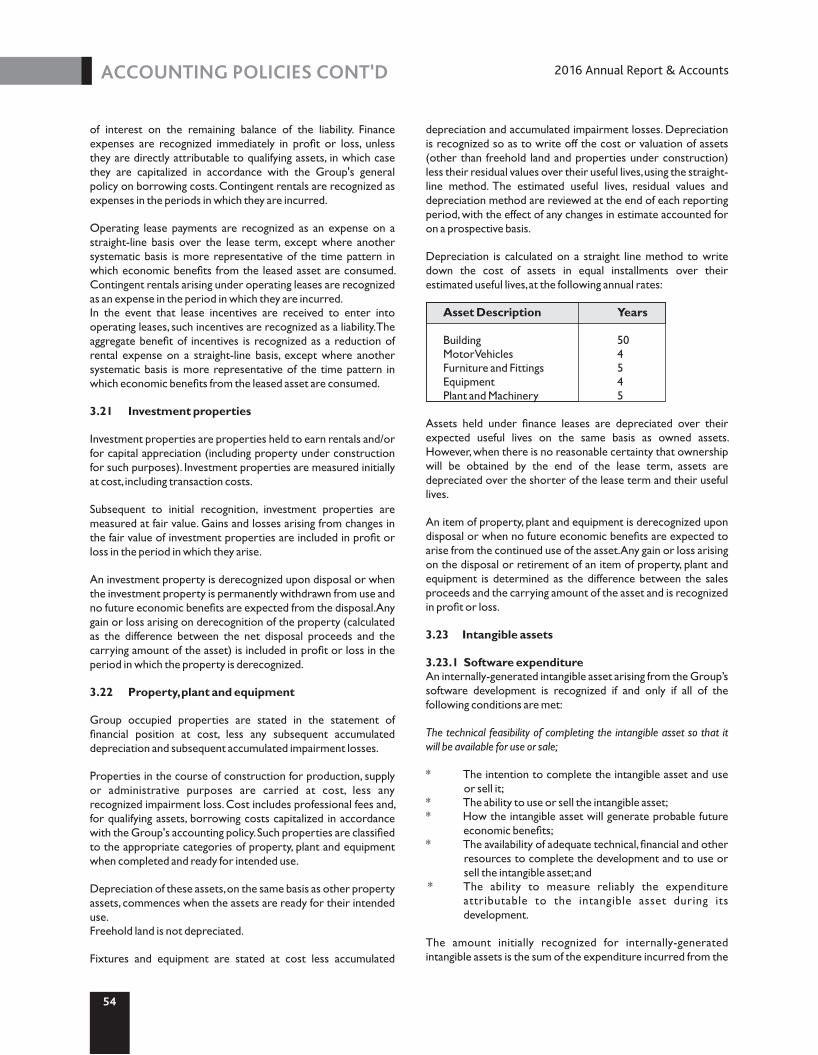
of interest on the remaining balance of the liability. Finance expenses are recognized immediately in profit or loss, unless they are directly attributable to qualifying assets, in which case they are capitalized in accordance with the Group's general policy on borrowing costs. Contingent rentals are recognized as expenses in the periods in which they are incurred.
Operating lease payments are recognized as an expense on a straight-line basis over the lease term, except where another systematic basis is more representative of the time pattern in which economic benefits from the leased asset are consumed. Contingent rentals arising under operating leases are recognized as an expense in the period in which they are incurred. In the event that lease incentives are received to enter into operating leases, such incentives are recognized as a liability. The aggregate benefit of incentives is recognized as a reduction of rental expense on a straight-line basis, except where another systematic basis is more representative of the time pattern in which economic benefits from the leased asset are consumed. 3.21 Investment properties
Investment properties are properties held to earn rentals and/or for capital appreciation (including property under construction for such purposes). Investment properties are measured initially at cost, including transaction costs.
Subsequent to initial recognition, investment properties are measured at fair value. Gains and losses arising from changes in the fair value of investment properties are included in profit or loss in the period in which they arise. An investment property is derecognized upon disposal or when the investment property is permanently withdrawn from use and no future economic benefits are expected from the disposal. Any gain or loss arising on derecognition of the property (calculated as the difference between the net disposal proceeds and the carrying amount of the asset) is included in profit or loss in the period in which the property is derecognized. 3.22 Property, plant and equipment
Group occupied properties are stated in the statement of financial position at cost, less any subsequent accumulated depreciation and subsequent accumulated impairment losses. Properties in the course of construction for production, supply or administrative purposes are carried at cost, less any recognized impairment loss. Cost includes professional fees and, for qualifying assets, borrowing costs capitalized in accordance with the Group's accounting policy. Such properties are classified to the appropriate categories of property, plant and equipment when completed and ready for intended use.
Depreciation of these assets, on the same basis as other property assets, commences when the assets are ready for their intended use. Freehold land is not depreciated. Fixtures and equipment are stated at cost less accumulated
depreciation and accumulated impairment losses. Depreciation is recognized so as to write off the cost or valuation of assets (other than freehold land and properties under construction) less their residual values over their useful lives, using the straight-line method. The estimated useful lives, residual values and depreciation method are reviewed at the end of each reporting period, with the effect of any changes in estimate accounted for on a prospective basis.
Depreciation is calculated on a straight line method to write down the cost of assets in equal installments over their estimated useful lives, at the following annual rates:
Asset Description Years
Building 50Motor Vehicles 4Furniture and Fittings 5Equipment 4 Plant and Machinery 5
Assets held under finance leases are depreciated over their expected useful lives on the same basis as owned assets. However, when there is no reasonable certainty that ownership will be obtained by the end of the lease term, assets are depreciated over the shorter of the lease term and their useful lives.
An item of property, plant and equipment is derecognized upon disposal or when no future economic benefits are expected to arise from the continued use of the asset. Any gain or loss arising on the disposal or retirement of an item of property, plant and equipment is determined as the difference between the sales proceeds and the carrying amount of the asset and is recognized in profit or loss.
3.23 Intangible assets 3.23.1 Software expenditure An internally-generated intangible asset arising from the Group’s software development is recognized if and only if all of the following conditions are met: The technical feasibility of completing the intangible asset so that it will be available for use or sale; * The intention to complete the intangible asset and use
or sell it;* The ability to use or sell the intangible asset;* How the intangible asset will generate probable future
economic benefits;* The availability of adequate technical, financial and other
resources to complete the development and to use or sell the intangible asset; and
* The ability to measure reliably the expenditure attributable to the intangible asset during its development.
The amount initially recognized for internally-generated intangible assets is the sum of the expenditure incurred from the
ACCOUNTING POLICIES CONT’D
54
2016 Annual Report & Accounts
date when the intangible asset first meets the recognition criteria listed above. Where no internally-generated intangible asset can be recognized, development expenditure is recognized in profit or loss in the period in which it is incurred.
Subsequent to initial recognition, internally-generated intangible assets are reported at cost less accumulated amortization and accumulated impairment losses, on the same basis as intangible assets that are acquired separately. Its estimated useful life is 3 years. 3.23.2 Impairment of tangible and intangible assets
other than goodwill
At the end of each reporting period, the Group reviews the carrying amounts of its tangible and intangible assets to determine whether there is any indication that those assets have suffered an impairment loss. If any such indication exists, the recoverable amount of the asset is estimated in order to determine the extent of the impairment loss (if any). When it is not possible to estimate the recoverable amount of an individual asset, the Group estimates the recoverable amount of the cash-generating unit to which the asset belongs. When a reasonable and consistent basis of allocation can be identified, corporate assets are also allocated to individual cash-generating units, or otherwise they are allocated to the smallest group of cash-generating units for which a reasonable and consistent allocation basis can be identified.
3.23.3 Impairment of tangible and intangible assets other than goodwill
Intangible assets with indefinite useful lives and intangible assets not yet available for use are tested for impairment at least annually, and whenever there is an indication that the asset may be impaired.
Recoverable amount is the higher of fair value less costs to sell and value in use. In assessing value in use, the estimated future cash flows are discounted to their present value using a pre-tax discount rate that reflects current market assessments of the time value of money and the risks specific to the asset for which the estimates of future cash flows have not been adjusted. If the recoverable amount of an asset (or cash-generating unit) is estimated to be less than its carrying amount, the carrying amount of the asset (or cash-generating unit) is reduced to its recoverable amount. An impairment loss is recognized immediately in profit or loss, unless the relevant asset is carried at a revalued amount, in which case the impairment loss is treated as a revaluation decrease.
When an impairment loss subsequently reverses, the carrying amount of the asset (or a cash-generating unit) is increased to the revised estimate of its recoverable amount, but so that the increased carrying amount does not exceed the carrying amount that would have been determined had no impairment loss been recognized for the asset (or cash-generating unit) in prior years. A reversal of an impairment loss is recognized immediately in profit or loss, unless the relevant asset is carried at a revalued
amount, in which case the reversal of the impairment loss is treated as a revaluation increase. 3.24 Statutory deposit
Statutory deposit represents a deposit of 10% of the regulatory share capital kept with the Central Bank of Nigeria. The amount held will increase or decrease in relation to the amount of paid up share capital in issue. The cash amount held is considered to be a restricted cash balance and stated at cost.
3.25 Non-life insurance contract liabilities 3.25.1 Provision for outstanding claims and incurred
but not reported (IBNR) claims
Provisions for liabilities of non-life insurance contracts is made for outstanding claims and settlement expenses incurred at the reporting date including an estimate for the cost of claims incurred but not reported (IBNR) at that date. Included in the provision is an estimate of the internal and external costs of handling the outstanding claims. Material salvage and other recoveries including reinsurance recoveries are presented as assets. Significant delays are experienced in the notification and settlement of certain types of general insurance claims, particularly in respect of liability business, environmental and pollution exposures, the ultimate cost of which may vary from the original assessment. Adjustments to the amounts of claims provisions established in prior years are reflected in the financial statements for the period in which the adjustments are made and disclosed separately, if material. The liability for Incurred But Not Reported (IBNR) claims is calculated at the end of the reporting period, using a range of standard actuarial claim projection techniques, based on empirical data and current assumptions that may include a margin for adverse deviation. The liability was not discounted for time value of money; and no further provision was made for equalisation or catastrophe reserves (as prohibited by IFRS 4).
These liabilities are derecognised when the obligation to pay a claim is extinguished (i.e. expires, discharged or cancelled).
3.25.2 Provision for unearned premiums and unexpired risks
The provision for unearned premiums represents that part of written premiums, gross of commission payable to intermediaries that is estimated to be earned in subsequent periods. The change in the provision is recorded in the income statement to recognise revenue over the period of the risk.
3.25.3 Liability adequacy
At each reporting date the Group performs a liability adequacy test on its insurance liabilities less related deferred acquisition costs and intangible assets to ensure that the carrying value is
ACCOUNTING POLICIES CONT’D
55
2016 Annual Report & Accounts
adequate, using current estimates of future cash flows, taking into account the relevant investment return. If that assessment shows that the carrying amount of the liabilities is inadequate, any deficiency is recognised as an expense to the income statement initially by writing off the intangible assets and subsequently by recognising an additional liability for claims provisions or recognising a provision for unexpired risks.
The unexpired risks provision is assessed in aggregate for business classes which are managed together. 3.25.4 Actuarial valuation of life fund
This is made up of the net liabilities on all policies in force as computed at the time of the actuarial valuation. Actuarial valuation of life fund is carried out annually for the purpose of determining the surplus or deficit at the end of the year. All deficits/surpluses arising thereon are charged/credited to the profit or loss. 3.25.5 Life insurance contract liabilities Individual life These contracts insure mainly against death. For the annual statement of accounts, the contracts are valued using a gross premium valuation, taking into account the present value of expected future premium claim and associated expense cash flow. Group lifeThese contracts insure against death on a group basis. These contracts are short term in nature and are typically renewed annually. Insurance contracts with discretionary participation featuresCornerstone group issues endowment contracts that provide primarily savings benefits to policyholders but also transfer insurance risk. The benefit payable under each contract increases each year by a reversionary bonus. Bonus distribution to policy holders is at the discretion of Cornerstone group’s management.
These contracts are valued on a gross premium valuation basis. 3.25.6 Investment contract
Receipts from investment contracts with guaranteed returns (welfare scheme/deposit administration) and other businesses that are savings related are recognised as liabilities. Interest accruing from investment of the savings is recognised in the profit or loss account (deposit administration revenue account) in the year it is earned while guaranteed interest due to depositors is recognised as expense. The net result of deposit administration revenue account is transferred to statement of profit and loss account of the group. The policy liabilities are determined by the accrued benefits of relevant policy holders. 3.26 Financial liabilities and equity instruments
3.26.1 Classification as debt or equity
Debt and equity instruments issued by a group entity are classified as either financial liabilities or as equity in accordance with the substance of the contractual arrangements and the definitions of a financial liability and an equity instrument. 3.26.2 Equity instruments
An equity instrument is any contract that evidences a residual interest in the assets of an entity after deducting all of its liabilities. Equity instruments issued by the Group are recognized at the proceeds received, net of direct issue costs. Repurchase of the Company's own equity instruments is recognized and deducted directly in equity. No gain or loss is recognized in profit or loss on the purchase, sale, issue or cancellation of the Company's own equity instruments.
3.26.3 Compound instruments
The component parts of compound instruments (convertible notes) issued by the Company are classified separately as financial liabilities and equity in accordance with the substance of the contractual arrangements and the definitions of a financial liability and an equity instrument. Conversion option that will be settled by the exchange of a fixed amount of cash or another financial asset for a fixed number of the Company's own equity instruments is an equity instrument.
At the date of issue, the fair value of the liability component is estimated using the prevailing market interest rate for similar non-convertible instruments. This amount is recorded as a liability on an amortized cost basis using the effective interest method until extinguished upon conversion or at the instrument's maturity date.
The conversion option classified as equity is determined by deducting the amount of the liability component from the fair value of the compound instrument as a whole. This is recognized and included in equity, net of income tax effects, and is not subsequently re-measured. In addition, the conversion option classified as equity will remain in equity until the conversion option is exercised, in which case, the balance recognized in equity will be transferred to other equity. When the conversion option remains unexercised at the maturity date of the convertible note, the balance recognized in equity will be transferred to retained profits. No gain or loss is recognized in profit or loss upon conversion or expiration of the conversion option.
Transaction costs that relate to the issue of the convertible notes are allocated to the liability and equity components in proportion to the allocation of the gross proceeds. Transaction costs relating to the equity component are recognized directly in equity. Transaction costs relating to the liability component are included in the carrying amount of the liability component and are amortized over the lives of the convertible notes using the effective interest method.
ACCOUNTING POLICIES CONT’D
56
2016 Annual Report & Accounts
Once the convertible security is not convertible to fixed number of ordinary shares, it cannot be considered a compound instrument. 3.26.4 Trade Payables
Trade Payables are measured on initial recognition at the fair value and subsequently measure at amortised cost, using the effective interest rate method. The fair value of a non-interest bearing liability is its discounted repayment amount. If the due date of the liability is less than one year discounting is omitted. 3.26.4.1 Other payables and accruals
Other payables and accruals are recognised initially at fair value and subsequently measured at amortised cost using the effective interest method. The fair value of a non-interest bearing liability is its discounted repayment amount. If the due of the liability is less one year discounting is omitted. A financial liability is derecognized when the obligation under the liability is discharged or cancelled or expires. When an existing financial liability is replaced by another from the same lender on substantially different terms, or the terms of an existing liability, are substantially modified, such as exchange or modification is treated as a derecognition of the original liability and the recognition of a new liability, and the difference in the respective carrying amounts is recognised in the income statement. Gains and losses are recognised in the income statements when the liabilities are derecognized.
3.26.5 Trust and managed funds
Trust and managed funds consist of investments held by the Group as Trust Manager on behalf of third parties. 3.27 Financial liabilities
Financial liabilities are classified as either financial liabilities ‘at FVTPL' or ‘other financial liabilities'. 3.27.1 Financial liabilities at fair value through profit or
loss
Financial liabilities are classified as at fair value through profit or loss when the financial liability is either held for trading or it is designated as at fair value through profit or loss. A financial liability is classified as held for trading if:
* It has been acquired principally for the purpose of repurchasing it in the near term; or
* On initial recognition it is part of a portfolio of identified financial instruments that the Group manages together and has a recent actual pattern of short-term profit-taking; or
* It is a derivative that is not designated and effective as a hedging instrument.
A financial liability other than a financial liability held for trading may be designated as at FVTPL upon initial recognition if: * such designation eliminates or significantly reduces a
measurement or recognition inconsistency that would otherwise; or
* the financial liability forms part of a group of financial assets or financial liabilities or both, which is managed and its performance is evaluated on a fair value basis, in accordance with the Group's documented risk management or investment strategy, and information about the grouping is provided internally on that basis; or
* it forms part of a contract containing one or more embedded derivatives, and IAS 39 Financial Instruments: Recognition and Measurement permits the entire combined contract (asset or liability) to be designated as at FVTPL.
Financial liabilities at FVTPL are stated at fair value, with any gains or losses arising on remeasurement recognized in profit or loss. The net gain or loss recognized in profit or loss incorporates any interest paid on the financial liability and is included in the ‘other gains and losses' line item in the consolidated statement of comprehensive income/income statement. 3.27.2 Other financial liabilities
Other financial liabilities (including borrowings and trade and other payables) are subsequently measured at amortized cost using the effective interest method. The effective interest method is a method of calculating the amortized cost of a financial liability and of allocating interest expense over the relevant period. The effective interest rate is the rate that exactly discounts estimated future cash payments (including all fees and points paid or received that form an integral part of the effective interest rate, transaction costs and other premiums or discounts) through the expected life of the financial liability, or (where appropriate) a shorter period, to the net carrying amount on initial recognition. 3.27.3 Financial guarantee contracts A financial guarantee contract is a contract that requires the issuer to make specified payments to reimburse the holder for a loss it incurs because a specified debtor fails to make payments when due in accordance with the terms of a debt instrument. Financial guarantee contracts issued by the Group are initially measured at their fair values and, if not designated as at FVTPL, are subsequently measured at the higher of: * The amount of the obligation under the contract, as
determined in accordance with IAS 37 Provisions, Contingent Liabilities and Contingent Assets; and
* The amount initially recognized less, where appropriate, cumulative amortization recognized in accordance with the revenue recognition policies.
ACCOUNTING POLICIES CONT’D
57
2016 Annual Report & Accounts
3.27.4 Derecognition of financial liabilities
The Group derecognizes financial liabilities when, and only when, the Group's obligations are discharged, cancelled or they expire. The difference between the carrying amount of the financial liability derecognized and the consideration paid and payable is recognized in profit or loss. 3.27.5 Fair value of financial instrument
The fair value of non-derivative financial assets and liabilities with standard terms and conditions and traded at an active liquid market are determined by reference to quoted market prices. Financial assets in this category include listed equities, listed debt securities and mortgages. Financial liabilities include borrowing, net asset value attributable to unit-holders and liabilities for investment contracts without DPF. The fair value of other non-derivative financial assets and liabilities are determined in accordance with generally accepted pricing models based on discounted cash flow analysis using prices from observable current market transactions and dealer quotes for similar instruments. 3.28 Provisions
Provisions are recognized when the Group has a present obligation (legal or constructive) as a result of a past event, it is probable that the Group will be required to settle the obligation, and a reliable estimate can be made of the amount of the obligation.
The amount recognized as a provision is the best estimate of the consideration required to settle the present obligation at the end of the reporting period, taking into account the risks and uncertainties surrounding the obligation.
When a provision is measured using the cash flows estimated to settle the present obligation, its carrying amount is the present value of those cash flows (when the effect of the time value of money is material).
When some or all of the economic benefits required to settle a provision are expected to be recovered from a third party, a receivable is recognized as an asset if it is virtually certain that reimbursement will be received and the amount of the receivable can be measured reliably.
3.29 Taxation
Income tax expense represents the sum of the tax currently payable and deferred tax.
3.29.1 Current tax
The tax currently payable is based on taxable profit for the year. Taxable profit differs from profit as reported in the consolidated statement of comprehensive income/income statement because of items of income or expense that are taxable or deductible in other years and items that are never taxable or deductible. The
Group's liability for current tax is calculated using tax rates that have been enacted or substantively enacted by the end of the reporting period. The current taxes include: Company Income Tax at 30% of taxable profit; Education Tax at 2% of assessable profit; Capital Gain Tax at 10% of chargeable gains; and Information Technology Development Levy at 1% of accounting profit before tax.
3.29.2 Deferred tax
Deferred tax is recognized on temporary differences between the carrying amounts of assets and liabilities in the consolidated financial statements and the corresponding tax bases used in the computation of taxable profit.
Deferred tax liabilities are generally recognized for all taxable temporary differences. Deferred tax assets are generally recognized for all deductible temporary differences to the extent that it is probable that taxable profits will be available against which those deductible temporary differences can be utilized. Such deferred tax assets and liabilities are not recognized if the temporary difference arises from goodwill or from the initial recognition (other than in a business combination) of other assets and liabilities in a transaction that affects neither the taxable profit nor the accounting profit.
Deferred tax liabilities are recognized for taxable temporary differences associated with investments in subsidiaries and associates, and interests in joint ventures, except where the Group is able to control the reversal of the temporary difference and it is probable that the temporary difference will not reverse in the foreseeable future.
Deferred tax assets arising from deductible temporary differences associated with such investments and interests are only recognized to the extent that it is probable that there will be sufficient taxable profits against which to utilise the benefits of the temporary differences and they are expected to reverse in the foreseeable future.
The carrying amount of deferred tax assets is reviewed at the end of each reporting period and reduced to the extent that it is no longer probable that sufficient taxable profits will be available to allow all or part of the asset to be recovered. Deferred tax liabilities and assets are measured at the tax rates that are expected to apply in the period in which the liability is settled or the asset realised, based on tax rates (and tax laws) that have been enacted or substantively enacted by the end of the reporting period. The measurement of deferred tax liabilities and assets reflects the tax consequences that would follow from the manner in which the Group expects, at the end of the reporting period, to recover or settle the carrying amount of its assets and liabilities.
3.29.3 Current and deferred tax for the year
Current and deferred tax are recognized in profit or loss, except when they relate to items that are recognized in other
ACCOUNTING POLICIES CONT’D
58
2016 Annual Report & Accounts
comprehensive income or directly in equity, in which case, the current and deferred tax are also recognized in other comprehensive income or directly in equity respectively. Where current tax or deferred tax arises from the initial accounting for a business combination, the tax effect is included in the accounting for the business combination.
3.30.1 Retirement benefit costs
Payments to defined contribution retirement benefit plans are recognised as an expense when employees have rendered service entitling them to the contributions.
This is done in line with the Pension Reform Act 2014, whereby the minimum rate of Pension Contribution is 18% of monthly emolument, where 8% will be contributed by employee and 10% by employer.
3.30.2 Borrowing and finance costs
Borrowing costs comprise interest payable on loans and bank overdrafts as well as commission fees charged in respect of letters of credit. They are charged to profit or loss as incurred, except those that relate to qualifying assets. Arrangement fees in respect of financing arrangements including letters of credit are charged to borrowing costs over the life of the related facility.
After initial recognition, interest bearing loans and borrowings are subsequently measured at amortised cost using the effective interest rate method. Gains and losses are recognised in the income statement when the liabilities are derecognised as well as through the effective interest rate (EIR) amortisation process. Amortised cost is calculated by taking into account any discount or premium on acquisition and fee or costs that is an integral part of the EIR. The EIR amortisation is included in finance cost in the income statement Borrowing costs directly attributable to the acquisition, construction or production of an asset ("qualifying asset") that necessarily takes a substantial period of time to get ready for use or sale are capitalized as part of the cost of the respective assets. 3.31 Share capital
Shares are classified as equity when there is no obligation to transfer cash or other assets. Incremental external costs that are directly attributable to the issue of these shares are recognised in equity, net of tax. 3.32 Contingency reserves 3.32.1 Non-life business
The company maintains contingency reserves in accordance with the provision of section 21(2) of the Insurance Act, CAP 117 LFN 2004 to cover fluctuations in securities and variations in statistical estimates at a rate equal to greater of 3% of total premium or 20% of net profits until the accumulated amount reaches the greater of the minimum paid-up capital or 50% of the net premium.
3.32.2 Life business
Contingency reserves are done in accordance with the provisions of the Insurance Act, CAP II7 LFN 2004. The contingency reserve is credited with the higher of an amount equal to 1% of the gross premium or 10% of the profits.
3.33 Treasury shares
Own equity instruments which are acquired (treasury shares) are deducted from equity and accounted for at weighted average cost. No gain or loss is recognised in the income statement on the purchase, sale, issue or cancellation of the Group’s own equity instruments. Any difference between the carrying amount and the consideration is recognised in other capital reserves. Voting rights related to treasury shares are nullified for the Group and no dividends are allocated to them respectively
Contracts on own shares that require physical settlement of a fixed number of own shares for a fixed consideration are classified as equity and added to or deducted from equity. Contracts on own shares that require net cash settlement or provide a choice of settlement is classified as trading instruments. Changes in the fair value are reported in the income statement.
3.34 Contingent liabilities
A contingent liability is a possible obligation that arises from past event and whose existence will be confirmed only by the occurrence or non-occurrence of one or more uncertain future events, not wholly within the control of the Group or the Group has a present obligation as a result of past events which is not recognized because it is not probable that an outflow of resources will be required to settle the obligation, or the amount cannot be reliability estimated. 3.35 Retained earnings
Retained earnings are the carried forward recognized income net of expenses plus current period profit attributable to shareholders. 3.36 Dividend Dividend distribution to the shareholders of the group is recognised in the period in which the dividends are paid as a first interim dividend or is a second interim dividend approved by the group’s shareholders at the group’s annual general meeting.
Dividend for the year that are approved after the reporting date are dealt with as an event after the reporting date. 3.37 Premiums 3.37.1 Non-life business
Written premiums for non-life (general) insurance business comprise the premiums on contracts incepted in the financial
ACCOUNTING POLICIES CONT’D
59
2016 Annual Report & Accounts

year. Written premiums are stated gross of commissions that are payable to intermediaries and exclusive of taxes and duties on premiums.
Unearned premiums are those proportions of the premium which relate to periods of risk after the reporting date
Unearned premiums are calculated on time apportionment basis. 3.37.2 Life business
Gross recurring premiums on life and investment contracts with Discretionary Participation Features (DPF) are recognised as revenue when payable by the policyholder. For single premium business, revenue is recognised on the date on which the policy is effective. 3.37.3 Fees and commission income
Fees and commission income consists primarily of Agency and brokerage commission, reinsurance and profit commissions, policyholder administration fees and other contract fees. Reinsurance commissions receivable are deferred in the same way as acquisition costs. All other fee and commission income is recognized as the services are provided. 3.38 Insurance benefits and claims 3.38.1 Non-life business
Non-life insurance claims include all claims occurring during the year, whether reported or not, related internal and external claims handling costs that are directly related to the processing and settlement of claims, a reduction for the value of salvage and other recoveries, and any adjustments to claims outstanding from previous years. 3.38.2 Reinsurance claims
The Group recognises reinsurance claims when the related gross insurance claims are recognised according to the terms of the relevant contracts.
3.38.3 Life business 3.38.4 Gross benefits and claims
ross benefits and claims for life insurance contracts and for investment contracts with the Discretionary Participatory Feature (DPF) include the cost of all claims arising during the year, including internal and external claims handling costs that are directly related to the processing and settlement of claims and policyholder bonuses declared on DPF contracts. Changes in the gross valuation of insurance and investment contract liabilities with DPF are also included. Death claims and surrenders are recorded on the basis of notifications received. Maturities and annuity payments are recorded when due. 3.39 Investment income
Investment income consists of dividends, interest and rent
receivables, movements in amortized cost on debt securities and other loans and receivables, realized gains and losses, and unrealized gains and losses on fair value assets. 3.39.1 Interest income
Interest income is recognized in the statement of profit or loss and other comprehensive income as it accrues and is calculated by using the effective interest rate method. Fees and commissions that are an integral part of the effective yield of the financial asset or liability are recognized as an adjustment to the effective interest rate of the instrument. 3.39.2 Dividend income
Dividend income from investments is recognized when the company’s’ rights to receive payment have been established.
3.39.3 Rental income
Rental income is recognized on an accrual basis.
3.39.4 Realized gains and losses
Gains and losses on the sale of investments are calculated as the difference between net sales proceeds and the original or amortized cost and are recorded on occurrence of the sale transaction.
3.39.5 Unrealised gains and losses
Unrealized gains or losses represent the difference between the carrying value at the year end and the carrying value at the previous year end or purchase value during the year, less the reversal of previously recognized unrealized gains and losses in respect of disposals during the year. 3.40 Other expenses
All other operating expenses are recognized directly in profit or loss as when incurred.
3.40.1 Underwriting expenses
Underwriting expenses comprise acquisition costs and other underwriting expenses. Acquisition costs comprise all direct and indirect costs arising from the writing of insurance contracts. Examples of these costs include, but are not limited to, commission expense, supervisory levy, superintending fees and other technical expenses. Other underwriting expenses are those incurred in servicing existing policies/ contract. These expenses are charges in the accounting year in which they are incurred. 3.40.2 Management expenses
Management expenses are expenses other than claims and underwriting expenses. They include salaries and wages, depreciation expenses and other non-operating expenses. They are accounted for on an accrual basis.
ACCOUNTING POLICIES CONT’D
60
2016 Annual Report & Accounts
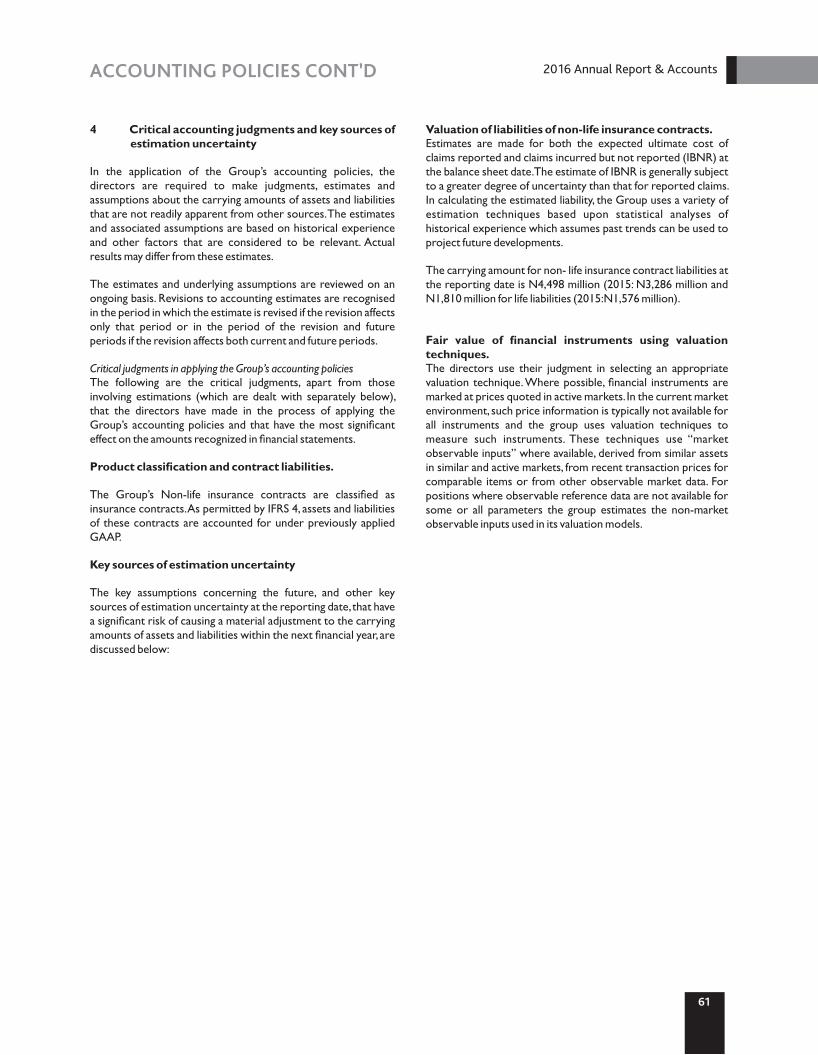
4 Critical accounting judgments and key sources of estimation uncertainty
In the application of the Group’s accounting policies, the directors are required to make judgments, estimates and assumptions about the carrying amounts of assets and liabilities that are not readily apparent from other sources. The estimates and associated assumptions are based on historical experience and other factors that are considered to be relevant. Actual results may differ from these estimates.
The estimates and underlying assumptions are reviewed on an ongoing basis. Revisions to accounting estimates are recognised in the period in which the estimate is revised if the revision affects only that period or in the period of the revision and future periods if the revision affects both current and future periods. Critical judgments in applying the Group’s accounting policiesThe following are the critical judgments, apart from those involving estimations (which are dealt with separately below), that the directors have made in the process of applying the Group’s accounting policies and that have the most significant effect on the amounts recognized in financial statements. Product classification and contract liabilities.
The Group’s Non-life insurance contracts are classified as insurance contracts. As permitted by IFRS 4, assets and liabilities of these contracts are accounted for under previously applied GAAP.
Key sources of estimation uncertainty
The key assumptions concerning the future, and other key sources of estimation uncertainty at the reporting date, that have a significant risk of causing a material adjustment to the carrying amounts of assets and liabilities within the next financial year, are discussed below:
Valuation of liabilities of non-life insurance contracts.Estimates are made for both the expected ultimate cost of claims reported and claims incurred but not reported (IBNR) at the balance sheet date. The estimate of IBNR is generally subject to a greater degree of uncertainty than that for reported claims. In calculating the estimated liability, the Group uses a variety of estimation techniques based upon statistical analyses of historical experience which assumes past trends can be used to project future developments.
The carrying amount for non- life insurance contract liabilities at the reporting date is N4,498 million (2015: N3,286 million and N1,810 million for life liabilities (2015:N1,576 million).
Fair value of financial instruments using valuation techniques.The directors use their judgment in selecting an appropriate valuation technique. Where possible, financial instruments are marked at prices quoted in active markets. In the current market environment, such price information is typically not available for all instruments and the group uses valuation techniques to measure such instruments. These techniques use “market observable inputs” where available, derived from similar assets in similar and active markets, from recent transaction prices for comparable items or from other observable market data. For positions where observable reference data are not available for some or all parameters the group estimates the non-market observable inputs used in its valuation models.
ACCOUNTING POLICIES CONT’D
61
2016 Annual Report & Accounts


STATEMENTSFINANCIAL
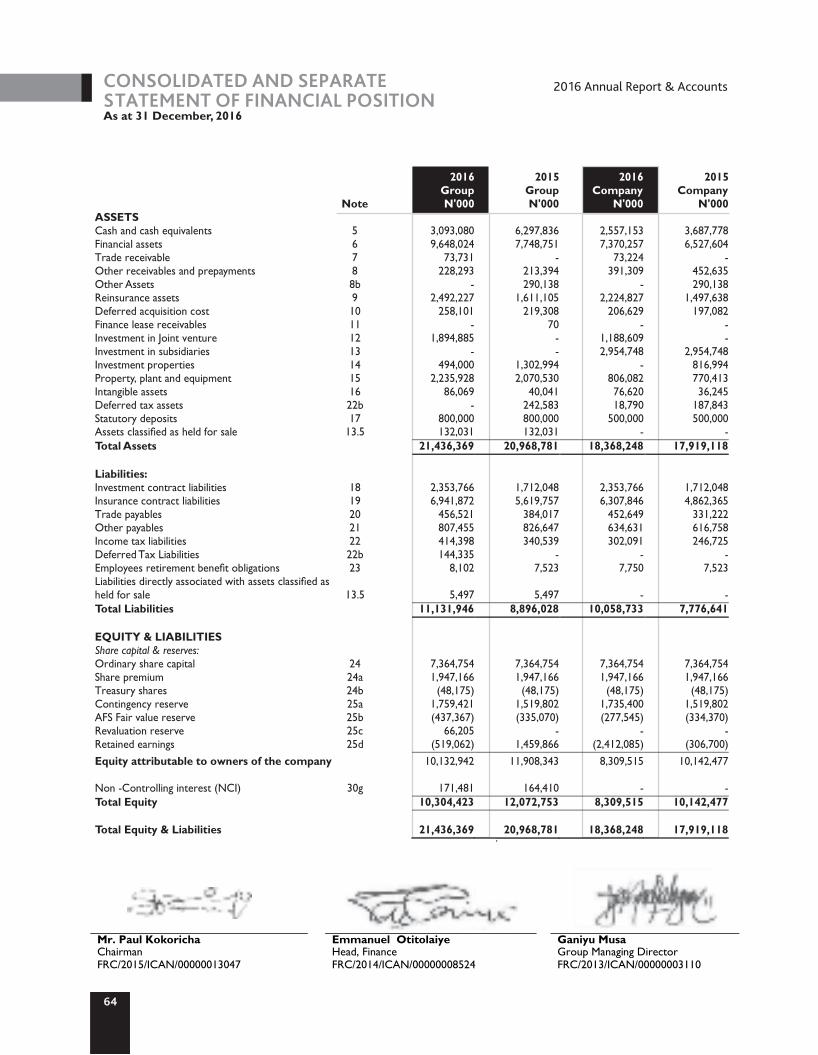
Mr. Paul Kokoricha
Emmanuel Otitolaiye
Ganiyu Musa
Chairman
Head, Finance
Group Managing Director FRC/2015/ICAN/00000013047
FRC/2014/ICAN/00000008524
FRC/2013/ICAN/00000003110
As at 31 December, 2016
CONSOLIDATED AND SEPARATE STATEMENT OF FINANCIAL POSITION
2016 Annual Report & Accounts
64
2016
2015
2016
2015
Group
Group
Company
Company
Note
N'000
N'000
N'000
N'000
ASSETS Cash and cash equivalents
5
3,093,080
6,297,836
2,557,153
3,687,778
Financial assets
6
9,648,024 7,748,751
7,370,257
6,527,604
Trade receivable
7
73,731
-
73,224
-Other receivables and prepayments
8
228,293
213,394
391,309
452,635
Other Assets
8b
-
290,138
- 290,138
Reinsurance assets
9
2,492,227 1,611,105
2,224,827
1,497,638
Deferred acquisition cost
10
258,101
219,308 206,629
197,082
Finance lease receivables
11
-
70
-
-Investment in Joint venture
12
1,894,885
-
1,188,609
-
Investment in subsidiaries
13
-
-
2,954,748
2,954,748Investment properties
14
494,000
1,302,994
-
816,994Property, plant and equipment
15
2,235,928
2,070,530
806,082
770,413Intangible assets
16
86,069
40,041
76,620
36,245Deferred tax assets
22b
-
242,583
18,790
187,843Statutory deposits
17
800,000
800,000
500,000
500,000Assets classified as held for sale
13.5
132,031
132,031
-
-Total Assets
21,436,369
20,968,781
18,368,248
17,919,118
Liabilities:
Investment contract liabilities
18
2,353,766
1,712,048
2,353,766
1,712,048Insurance contract liabilities
19
6,941,872
5,619,757
6,307,846
4,862,365Trade payables
20
456,521
384,017
452,649
331,222Other payables
21
807,455
826,647
634,631
616,758Income tax liabilities
22
414,398
340,539
302,091
246,725Deferred Tax Liabilities
22b
144,335
-
-
-Employees retirement benefit obligations
23
8,102
7,523
7,750
7,523Liabilities directly associated with assets classified as held for sale
13.5
5,497
5,497
-
-Total Liabilities
11,131,946
8,896,028
10,058,733
7,776,641
EQUITY & LIABILITIES
Share capital & reserves:
Ordinary share capital
24
7,364,754
7,364,754
7,364,754
7,364,754Share premium
24a
1,947,166
1,947,166
1,947,166
1,947,166Treasury shares
24b
(48,175)
(48,175)
(48,175)
(48,175)Contingency reserve
25a
1,759,421
1,519,802
1,735,400
1,519,802AFS Fair value reserve
25b
(437,367)
(335,070)
(277,545)
(334,370)Revaluation reserve
25c
66,205
-
-
-Retained earnings
25d
(519,062)
1,459,866
(2,412,085)
(306,700)Equity attributable to owners of the company
10,132,942
11,908,343
8,309,515
10,142,477
Non -Controlling interest (NCI) 30g 171,481 164,410 - -Total Equity 10,304,423 12,072,753 8,309,515 10,142,477
Total Equity & Liabilities 21,436,369 20,968,781 18,368,248 17,919,118

For the year ended 31 December, 2016
CONSOLIDATED AND SEPARATE STATEMENT OF PROFIT OR LOSS AND OTHER COMPREHENSIVE INCOME
65
2016 Annual Report & Accounts
Earnings per shareBasic and diluted 37 (12) 11 (13) (4)
2016 2015 2016 2015Group Group Company Company
Note
N'000
N'000
N'000
N'000
Gross Premium written
26a
9,190,634
7,331,633
8,389,950
7,331,633Change in unearned premium
26a
(734,176)
(212,001)
(621,100)
(212,001)Gross Premium income
8,456,458
7,119,632
7,768,850
7,119,632Reinsurance Expenses
26b
(3,281,938)
(2,110,177)
(2,945,380)
(2,110,177)
Net premium income
5,174,520
5,009,455 4,823,470
5,009,455
Fees and commission income
27
477,825
307,128
448,756
307,128
Net underwriting income
5,652,345
5,316,583 5,272,226
5,316,583
Insurance claims and benefits expense-
Gross (including loss adjustment expenses)
28
(4,573,714)
(2,844,291)
(4,527,743)
(2,844,291)
Insurance claims recoverable from reinsurance Companies
28.1
1,203,012
647,865
1,028,671
647,865Net Claims expenses
28 (3,370,702) (2,196,426) (3,499,072) (2,196,426)
Acquisition cost 29(a) (1,122,676) (1,108,961) (991,747) (1,108,961)Maintenance cost 29(b) (462,582) (365,034) (457,735) (365,034)Net Underwriting expenses 29 (1,585,258) (1,473,995) (1,449,482) (1,473,995) Underwriting result 696,385 1,646,161 323,672 1,646,161Profit/( Loss) from investment contract 18.1 (16,019) 23,761 (16,019) 23,761
Investment income attributable to Policyholders' funds 30(a) 203,118 407,488 203,118 407,488
Investment income attributable to Shareholders' fund 30(b) 540,354 780,062 207,938 780,062Fair value changes in investment property 14 8,000 64,480 - 64,480Fair value changes in financial assets-FVTPL
30(d)
(2,390,911)
(656,266)
(2,390,911)
(656,266)
Operating income
30e
3,160,568
432,659
3,024,626
422,946
Share of loss from Joint venture
12
(2,340)
-
(1,285)
-Allowance for impairment losses
31
(35,118)
(311,180)
(82,666)
(695,860)
Management expenses
32
(3,408,668)
(2,344,755) (2,771,273)
(2,314,789)
Bank charges
33
(20,029) (32,266)
(13,413)
(10,123)
Results of operating activities
(1,264,660)
10,144
(1,516,213)
(332,139)Gain on bargain purchase
30f
-
1,832,910
-
-
Profit before tax
(1,264,660)
1,843,054
(1,516,213)
(332,139)
Income tax expense
34
(470,563)
(212,300)
(373,574)
(203,374)Profit for the year from continuing operations
(1,735,223)
1,630,754
(1,889,787)
(535,513)Other Comprehensive Income net of tax
Items that may not be reclassified subsequently to profit or loss:
Revaluation gain on property and equipment
15
85,127
-
-
-Related tax
22b
(18,922)
-
-
-
66,205
-
-
-Items that may be reclassified subsequently to profit or loss:
Fair value adjustment on available for sale securities
6.21
(416,155)
(257,173)
56,825
(257,173)Foreign currency gain on available for sale securities
6.21
452,634
-
-
-Related tax
22b
(135,790)
-
-
-
(99,311)
(257,173)
56,825
(257,173)
Other Comprehensive Income, net of taxes
(33,106)
(257,173)
56,825
(257,173)
Total Comprehensive Income for the year
(1,768,329)
1,373,581
(1,832,962)
(792,686)
Profit for the year, attributable to:
* Owners' of the company
(1,739,309)
1,630,754
(1,889,787)
(535,513)
* Non-controlling interests
4,086
-
-
-
Total Comprehensive Income, attributable to:* Owners' of the company (1,771,315) 1,373,581 (1,832,962 (792,686)* Non-controlling interests 2,986 - - -
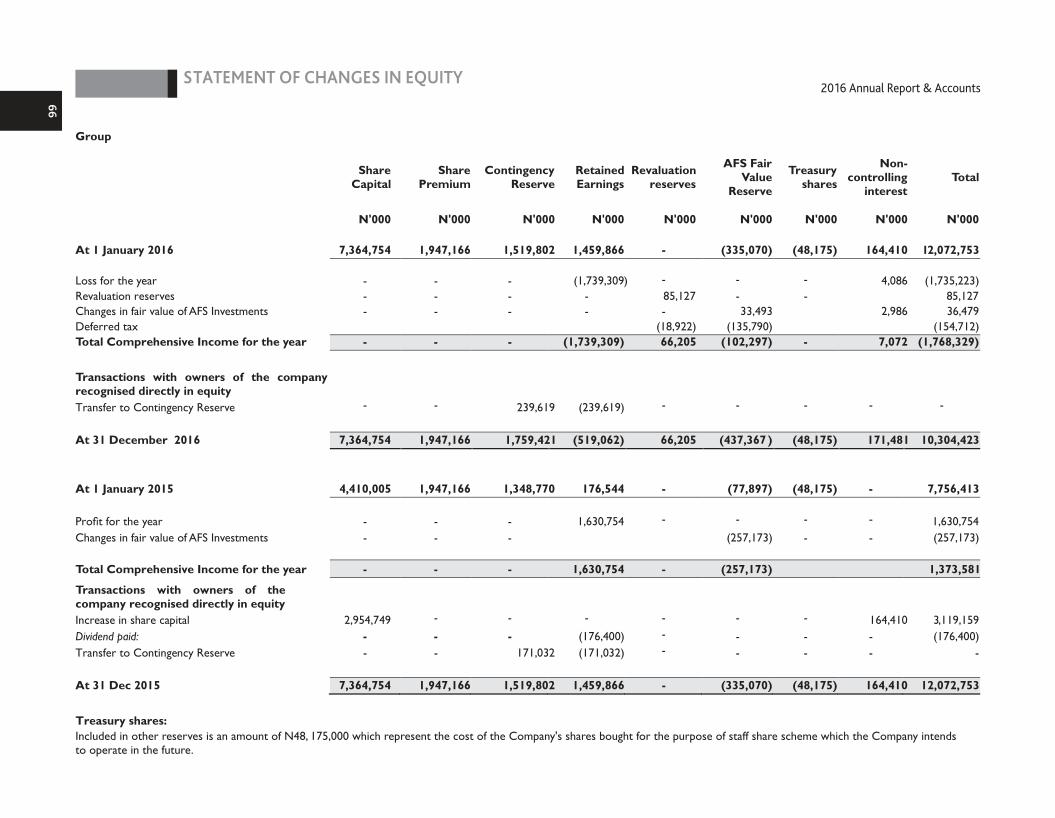
STATEMENT OF CHANGES IN EQUITY
66
Group
Share Capital
Share Premium
Contingency Reserve
Retained Earnings
Revaluation
N'000 N'000 N'000 N'000
At 1 January 2016 7,364,754 1,947,166 1,519,802 1,459,866
Loss for the year - - - (1,739,309) Revaluation reserves - - - - Changes in fair value of AFS Investments - - - - Deferred tax Total Comprehensive Income for the year - - - (1,739,309)
Transactions with owners of the company recognised directly in equity Transfer to Contingency Reserve - - 239,619 (239,619)
At 31 December 2016 7,364,754 1,947,166 1,759,421 (519,062)
At 1 January 2015 4,410,005 1,947,166 1,348,770 176,544
Profit for the year - - - 1,630,754 Changes in fair value of AFS Investments - - -
Total Comprehensive Income for the year - - - 1,630,754
Transactions with owners of the company recognised directly in equity Increase in share capital 2,954,749 - - -
Dividend paid: - - - (176,400) Transfer to Contingency Reserve - - 171,032 (171,032)
At 31 Dec 2015 7,364,754 1,947,166 1,519,802 1,459,866 Treasury shares: Included in other reserves is an amount of N48, 175,000 which represent the cost of the Company's shares bought for the purpose of staff share scheme which the Company intends to operate in the future.
reserves
AFS Fair Value
Reserve
Treasury shares
Non-controlling
interest Total
N'000 N'000 N'000 N'000 N'000
- (335,070) (48,175) 164,410 12,072,753
- - - 4,086 (1,735,223) 85,127 - - 85,127 - 33,493 2,986 36,479
(18,922) (135,790) (154,712) 66,205 (102,297) - 7,072 (1,768,329)
- - - - -
66,205 (437,367 ) (48,175) 171,481 10,304,423
- (77,897) (48,175) - 7,756,413
- - - - 1,630,754 (257,173) - - (257,173)
- (257,173) 1,373,581
- - - 164,410 3,119,159 - - - - (176,400) - - - - -
- (335,070) (48,175) 12,072,753 164,410
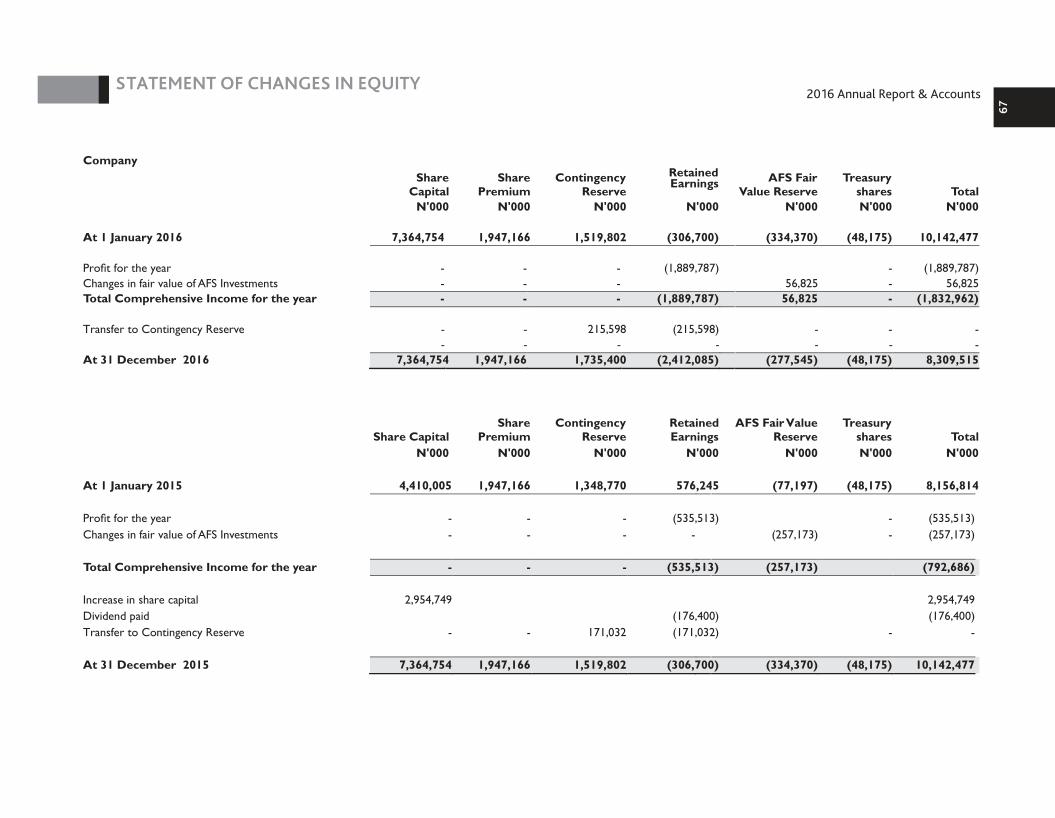
67
Company
Share
Capital Share
Premium Contingency
Reserve
Retained Earnings
N'000 N'000 N'000 At 1 January 2016 7,364,754 1,947,166 1,519,802 (306,700) Profit for the year - - - (1,889,787Changes in fair value of AFS Investments - - - Total Comprehensive Income for the year - - - (1,889,787 Transfer to Contingency Reserve - - 215,598 (215,598) - - - At 31 December 2016 7,364,754 1,947,166 1,735,400 (2,412,085
Share Capital Share
Premium Contingency
Reserve Retained Earnings
N'000 N'000 N'000 N'000 At 1 January 2015 4,410,005 1,947,166 1,348,770 576,245 Profit for the year - - - (535,513)Changes in fair value of AFS Investments - - - Total Comprehensive Income for the year - - - (535,513) Increase in share capital 2,954,749 Dividend paid (176,400)Transfer to Contingency Reserve - - 171,032 (171,032) At 31 December 2015 7,364,754 1,947,166 1,519,802 (306,700)
N'000
-
AFS Fair
Value Reserve Treasury
shares Total N'000 N'000 N'000
(334,370) (48,175) 10,142,477
) - (1,889,787) 56,825 - 56,825
) 56,825 - (1,832,962) - - - - - - - ) (277,545) (48,175) 8,309,515
AFS Fair Value Reserve
Treasury shares Total
N'000 N'000 N'000
(77,197) (48,175) 8,156,814 - (535,513)
(257,173) - (257,173)
(257,173) (792,686) 2,954,749 (176,400) - -
(334,370) (48,175) 10,142,477
STATEMENT OF CHANGES IN EQUITY
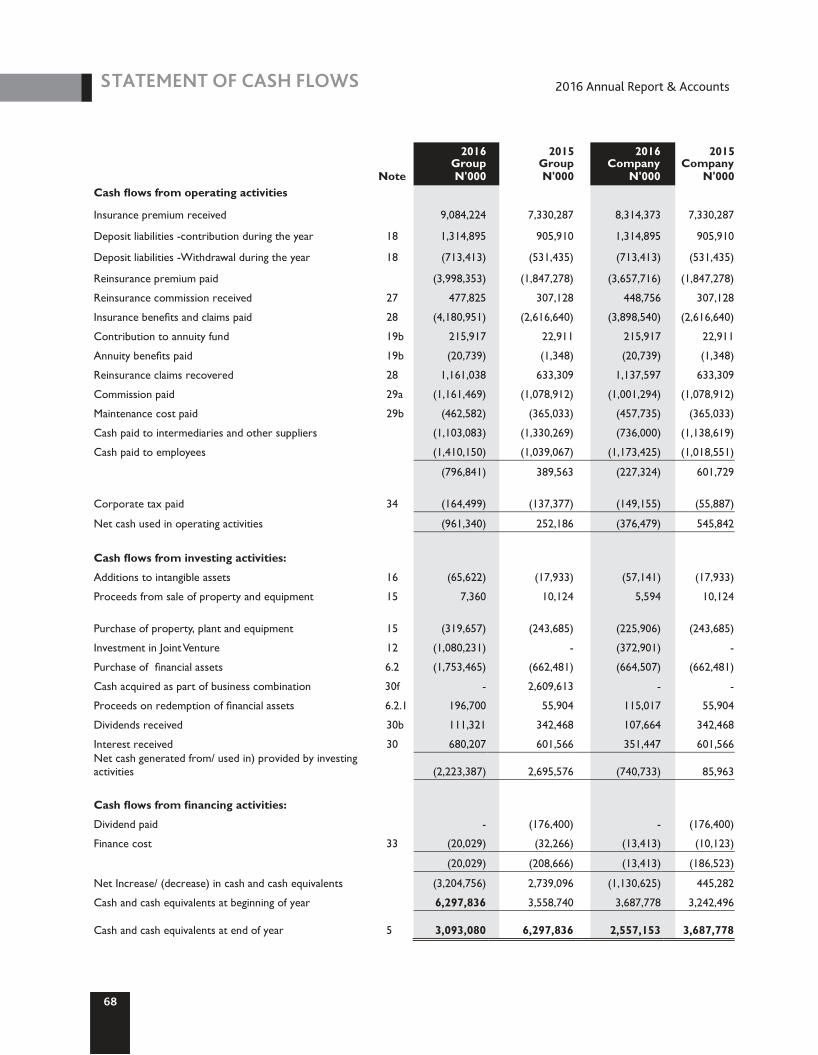
STATEMENT OF CASH FLOWS 2016 Annual Report & Accounts
68
2016
2015
2016
2015
Group Group Company Company
Note N'000 N'000 N'000 N'000 Cash flows from operating activities Insurance premium received 9,084,224 7,330,287 8,314,373 7,330,287
Deposit liabilities -contribution during the year 18 1,314,895 905,910 1,314,895 905,910 Deposit liabilities -Withdrawal during the year 18 (713,413) (531,435) (713,413) (531,435) Reinsurance premium paid (3,998,353) (1,847,278) (3,657,716) (1,847,278) Reinsurance commission received 27 477,825 307,128 448,756 307,128 Insurance benefits and claims paid 28 (4,180,951) (2,616,640) (3,898,540) (2,616,640) Contribution to annuity fund 19b 215,917 22,911 215,917 22,911 Annuity benefits paid
19b
(20,739)
(1,348)
(20,739)
(1,348)
Reinsurance claims recovered
28
1,161,038
633,309
1,137,597
633,309
Commission paid
29a
(1,161,469)
(1,078,912)
(1,001,294)
(1,078,912)
Maintenance cost paid
29b
(462,582)
(365,033)
(457,735)
(365,033)
Cash paid to intermediaries and other suppliers
(1,103,083)
(1,330,269)
(736,000)
(1,138,619)
Cash paid to employees
(1,410,150)
(1,039,067)
(1,173,425)
(1,018,551)
(796,841)
389,563
(227,324)
601,729
Corporate tax paid
34
(164,499)
(137,377)
(149,155)
(55,887)
Net cash used in operating activities
(961,340)
252,186
(376,479)
545,842
Cash flows from investing activities:
Additions to intangible assets
16
(65,622)
(17,933)
(57,141)
(17,933) Proceeds from sale of property and equipment
15
7,360
10,124
5,594
10,124
Purchase of property, plant and equipment
15
(319,657)
(243,685)
(225,906)
(243,685)
Investment in Joint Venture
12
(1,080,231)
-
(372,901)
-
Purchase of financial assets
6.2
(1,753,465)
(662,481)
(664,507)
(662,481)
Cash acquired as part of business combination
30f
-
2,609,613
-
-
Proceeds on redemption of financial assets
6.2.1
196,700
55,904
115,017
55,904
Dividends received
30b
111,321
342,468
107,664
342,468
Interest received
30
680,207
601,566
351,447
601,566
Net cash generated from/ used
in)
provided by investing activities
(2,223,387)
2,695,576
(740,733)
85,963
Cash flows from financing activities:
Dividend paid
-
(176,400)
-
(176,400)
Finance cost
33
(20,029)
(32,266)
(13,413)
(10,123)
(20,029)
(208,666)
(13,413)
(186,523)
Net Increase/ (decrease) in cash and cash equivalents
(3,204,756)
2,739,096
(1,130,625)
445,282
Cash and cash equivalents at beginning of year
6,297,836
3,558,740
3,687,778
3,242,496
Cash and cash equivalents at end of year
3,093,080
6,297,836
2,557,153
3,687,778
5
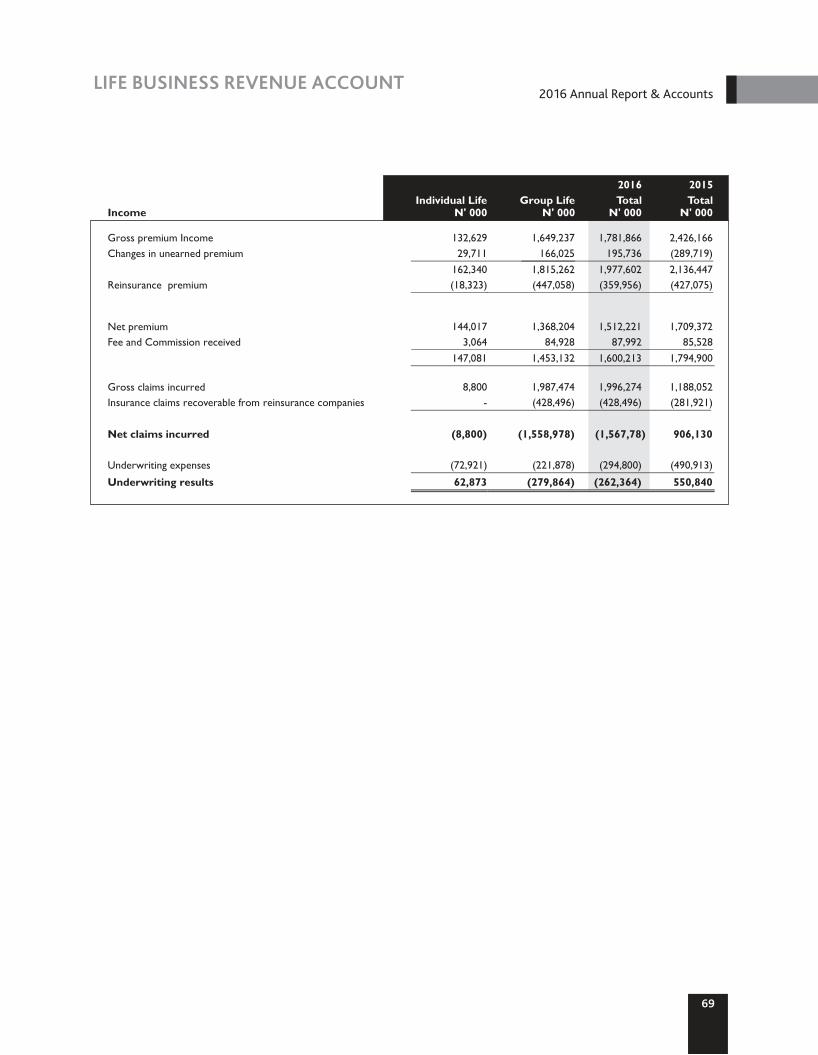
LIFE BUSINESS REVENUE ACCOUNT
69
2016 Annual Report & Accounts
Income Gross premium Income
132,629
1,649,237 2,426,166
Changes in unearned premium
29,711
166,025 (289,719)
162,340
1,815,262 2,136,447Reinsurance premium
(18,323)
(447,058) (427,075)
Net premium
144,017
1,368,204 1,709,372Fee and Commission received
3,064
84,928 85,528
147,081
1,453,132 1,794,900
Gross claims incurred
8,800
1,987,474 1,188,052Insurance claims recoverable from reinsurance companies
-
(428,496) (281,921)
Net claims incurred
(8,800)
(1,558,978) 906,130
Underwriting expenses
(72,921)
(221,878) (490,913)
Underwriting results 62,873 (279,864) 550,840
1,781,866195,736
1,977,602(359,956)
1,512,22187,992
1,600,213
1,996,274(428,496)
(1,567,78)
(294,800)
(262,364)
2015Individual Life Group Life Total
N' 000
N' 000
N' 000
2016 Total N' 000
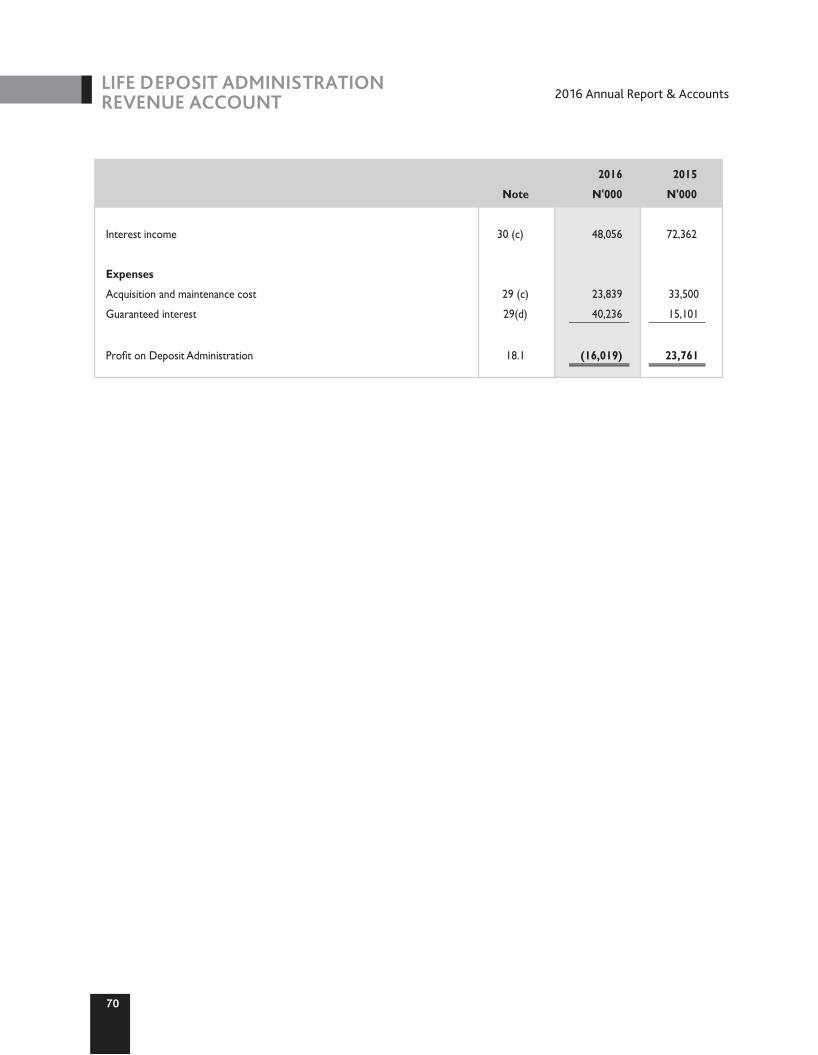
LIFE DEPOSIT ADMINISTRATION REVENUE ACCOUNT
70
2016 Annual Report & Accounts
2016
2015
Note N'000
N'000
Interest income 48,056 72,362
Expenses
Acquisition and maintenance cost 23,839
33,500
Guaranteed interest 40,236
15,101
Profit on Deposit Administration (16,019) 23,761
30 (c)
29 (c)
29(d)
18.1

GENERAL BUSINESS COMPANY REVENUE ACCOUNT
71
2016 Annual Report & Accounts
General Accident Oil & GasMotor Fire Marine
N' 000
N' 000
N' 000
N' 000
N' 000
Income
Direct premium
1,636,415
975,300
1,851,909
1,368,592
506,171
Inward premium
10,131
27,949
16,227
31
7,064
Gross premium written
1,646,546
1,003,249
1,868,136
1,368,623
513,235
(Increase)/decrease in unearned premium
(35,639)
(85,215)
(501,926)
(166,814)
(27,888)
Gross premium earned
1,610,907
918,034
1,366,210
1,201,809
485,347
Outward reinsurance premium
46,921
651,007
1,009,294
1,165,047
298,702
(Increase)/decrease in unexpired reinsurance cost
9,883
(81,840)
(440,536)
(132,897)
(48,669)
Reinsurance cost
56,804
569,167
568,758
1,032,150
250,033
Net premium earned
1,554,103
348,867
797,452
169,659
235,314
Commission earned
12,868
151,060
76,786
71,306
48,333
Total income
1,566,971
499,927
874,238
240,965
283,647
Expenses
Gross Claims paid
1,175,067
398,581
384,419
26,272
81,908
Increase in outstanding claims provision
28,470
130,150
5,837
269,849
(44,843)
Gross claims incurred
1,203,537
528,731
390,256
296,121
37,065 Reinsurance claims recoveries
(44,655) (195,716)
(73,751)
(219,091)
(63,555)
Net claims incurred
1,158,882
333,015
316,505
77,030 (26,490)
Acquisition cost
219,334
158,758
175,002
40,493
79,566 Maintenance cost
123,251
66,622
124,057
90,886
34,082 Underwriting expenses
342,585
225,380
299,059
131,379 113,648
Total Expenses
1,501,467
558,395
615,564
208,409
87,158
Underwriting results
65,504
(58,468)
258,674
32,556 196,489
Total31 Dec
2016
N' 000
6,338,387
61,402
6,399,789
(817,482)
5,582,307
3,170,971
(694,059)
2,476,912
3,105,395
360,353
3,465,748
2,066,247
389,463 2,455,710 (596,768)
1,858,942
673,153 438,898
1,112,051
2,970,993
494,755
4,742,159
43,610
4,785,769
92,108
4,877,877
1,461,374
218,213
1,679,587
3,198,291
220,721
3,419,012
1,496,342
120,839 1,617,181 (365,943)
1,251,238
669,014 286,139
955,153
2,206,391
1,212,621
Total31 Dec
2015
N' 000
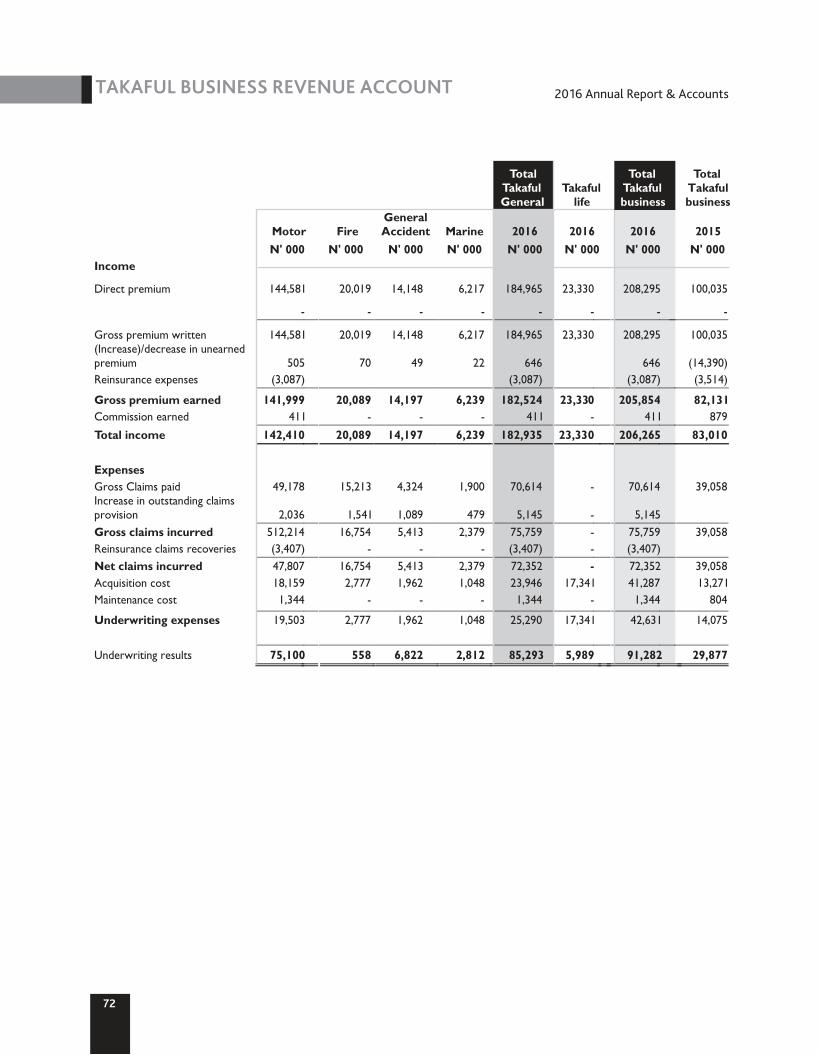
TAKAFUL BUSINESS REVENUE ACCOUNT
72
2016 Annual Report & Accounts
General Accident
Total Takaful General
Takaful life
Motor Fire
Marine 2016 2016 2015
N' 000 N' 000 N' 000 N' 000 N' 000 N' 000 N' 000
Income
Direct premium 20,019 6,217
- -
Gross premium written 20,019 6,217 (Increase)/decrease in unearned premium 70 22
Reinsurance expenses
Gross premium earned 20,089 6,239
Commission earned - -
Total income 20,089 6,239
Expenses Gross Claims paid 15,213 1,900
Increase in outstanding claims provision 1,541 479
Gross claims incurred 16,754 2,379
Reinsurance claims recoveries - -
Net claims incurred 16,754 2,379
Acquisition cost 2,777 1,048
Maintenance cost - -
Underwriting expenses 2,777 1,048
Underwriting results 558
14,148
-
14,148
49
14,197-
14,197
4,324
1,0895,413
-5,4131,962
-
1,962
6,822 2,812
2016 N' 000
184,965
-
184,965
646(3,087)
182,524411
182,935
70,614
5,14575,759(3,407)72,35223,9461,344
25,290
85,293
100,035
-
100,035
(14,390)
(3,514)
82,131
879
83,010
39,058
39,058
39,058
13,271
804
14,075
29,877
144,581
-
144,581
505
(3,087)
141,999
411
142,410
49,178
2,036
512,214
(3,407)
47,807
18,159
1,344
19,503
75,100
23,330
-
23,330
23,330
-
23,330
-
-
-
-
-
17,341
-
17,341
5,989
208,295
-
208,295
646
(3,087)
205,854
411
206,265
70,614
5,145
75,759
(3,407)
72,352
41,287
1,344
42,631
91,282
Takaful Total
business
Total Takaful business

TAKAFUL LIFE BUSINESS
73
2016 Annual Report & Accounts
Revenue Account
Income Gross premium written
Investment linked products
Gross premium written Unearned premium Net Premium Reinsurance cost
Underwriting expenses Underwriting profit
2016
Total
N' 000
319,023
(295,693)
23,330 -
23,330
(17,341)
5,989
2015
Total
N' 000
295,639
(275,978)
19,661
-
19,661
(13,789)
5,872
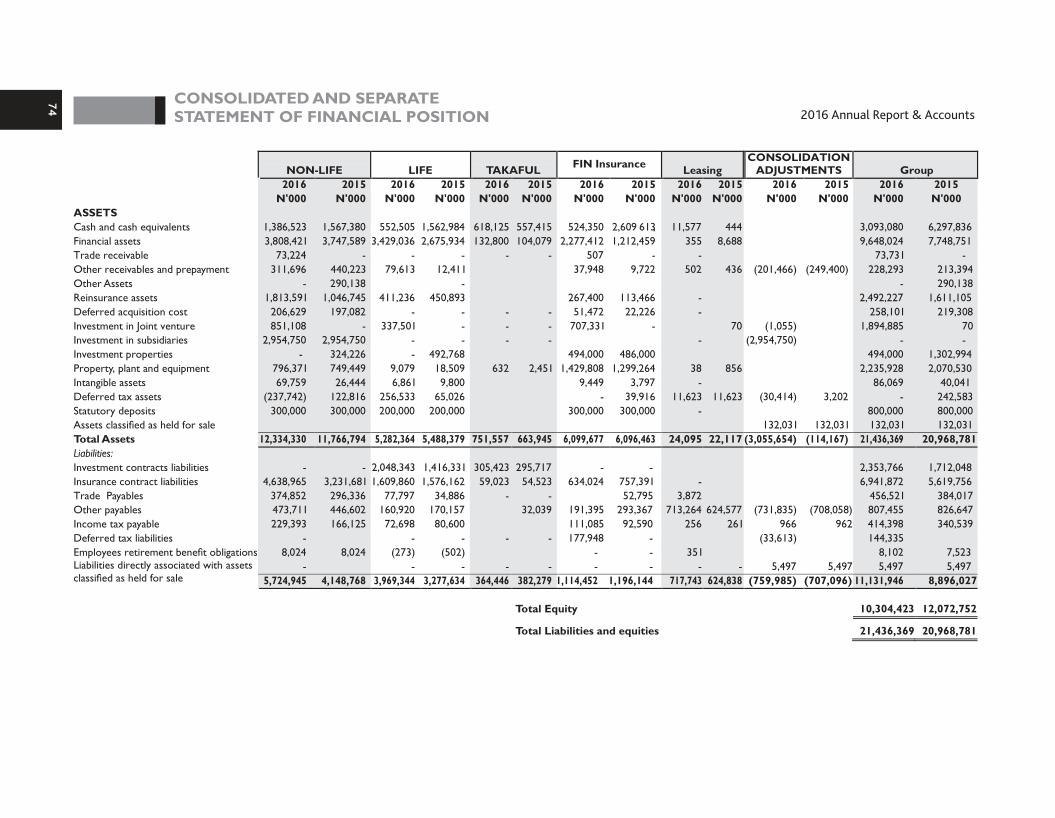
CONSOLIDATED AND SEPARATE STATEMENT OF FINANCIAL POSITION
74
2,609 613
NON-LIFE LIFE 2015 2016 2015 2016
N'000 N'000 N'000 N'000ASSETS Cash and cash equivalents 1,567,380 552,505 1,562,984 618,125Financial assets
3,747,589
3,429,036
2,675,934
132,800
Trade receivable
-
-
-
- Other receivables and prepayment
440,223
79,613
12,411
Other Assets
290,138
- Reinsurance assets
1,046,745
411,236
450,893
Deferred acquisition cost
197,082
-
-
- Investment in Joint venture
-
337,501
-
- Investment in subsidiaries
2,954,750
-
-
- Investment properties
324,226
-
492,768
Property, plant and equipment
749,449
9,079
18,509
632Intangible assets
26,444
6,861
9,800
Deferred tax assets
122,816
256,533
65,026
Statutory deposits
300,000
200,000
200,000
Assets classified as held for sale
Total Assets
-
2016N'000
1,386,5233,808,421
73,224311,696
1,813,591206,629851,108
2,954,750-
796,37169,759
(237,742)300,000
12,334,330
11,766,794
5,282,364
5,488,379
751,557Liabilities:
Investment contracts liabilities
- -
2,048,343
1,416,331
305,423Insurance contract liabilities
3,231,681
1,609,860
1,576,162
59,023Trade Payables
296,336
77,797
34,886
-
Other payables
446,602
160,920
170,157
Income tax payable
166,125
72,698
80,600
Deferred tax liabilities
-
-
-
Employees retirement benefit obligations 8,024
(273)
(502)
Liabilities directly associated with assets classified as held for sale
-
-
-
4,638,965374,852473,711229,393
-8,024
-5,724,945 4,148,768
3,969,344
3,277,634
364,446
TAKAFUL FIN Insurance
2015 2016
N'000 N'000
557,415 524,350
104,079 2,277,412
-
507
37,948
267,400-
51,472-
707,331-
494,000
2,451 1,429,808
9,449
-
300,000
663,945 6,099,677
295,717 -
54,523 634,024-
32,039 191,395
111,085-
177,948
--
-
382,279 1,114,452
Total Equity
Total Liabilities and equities
Leasing CONSOLIDATION
ADJUSTMENTS Group 2015 2016 2015 2015 2016 2015
N'000 N'000 N'000 N'000 N'000 N'000
, 11,577 444 3,093,080 6,297,836
1,212,459
355
8,688
9,648,024
7,748,751
-
-
73,731
-
9,722
502
436
(249,400)
228,293
213,394
-
290,138
113,466
-
2,492,227
1,611,105
22,226
-
258,101
219,308
-
70
1,894,885 70
-
-
-
486,000
494,000
1,302,994
1,299,264
38
856
2,235,928
2,070,530
3,797
-
86,069
40,041
39,916
11,623
11,623
3,202
-
242,583
300,000
-
800,000
800,000
132,031
132,031
132,031
6,096,463
24,095
22,117
(114,167)
21,436,369
20,968,781
-
2,353,766
1,712,048
757,391
-
6,941,872
5,619,756
52,795
3,872
456,521
384,017
293,367
713,264
624,577
(731,835)
(708,058)
807,455
826,647
92,590
256
261
966
962
414,398
340,539
-
(33,613)
144,335
-
351
8,102
7,523
-
-
-
5,497
5,497
5,497
5,497
1,196,144
717,743
624,838
(759,985)
(707,096)
11,131,946
8,896,027
10,304,423
12,072,752
21,436,369
20,968,781
(3,055,654)
2016N'000
(201,466)
(1,055)(2,954,750)
(30,414)
132,031
4 Operating segments IFRS 8 requires operating segments to be identified on the basis of internal reports about components of the Group that are regularly reviewed by the Chief Executive Officer to
allocate resources to the segments and to assess their performance. The Group's reportable segments under IFRS 8 are therefore identified as follows: • Non-life insurance; • Life insurance; • Halal Islamic Insurance; • Fin insurance Company Limited; and • Cornerstone Leasing and Investment The other segment includes corporate expenses and other activities not related to the core business segments and which are not reportable segments due to their immateriality.
Certain expenses, finance costs and taxes are not allocated across the segments.
The accounting policies of the reportable segments are the same as the Group's accounting policies. Segment profit represents the profit earned by each segment without allocation of central corporate expenses, certain finance costs and tax expense. This is the measure reported to the Group's Chief Executive for the purposes of resource allocation and assessment of segment performance.
NOTES TO THE CONSOLIDATED AND SEPARATE FINANCIAL STATEMENTS 75
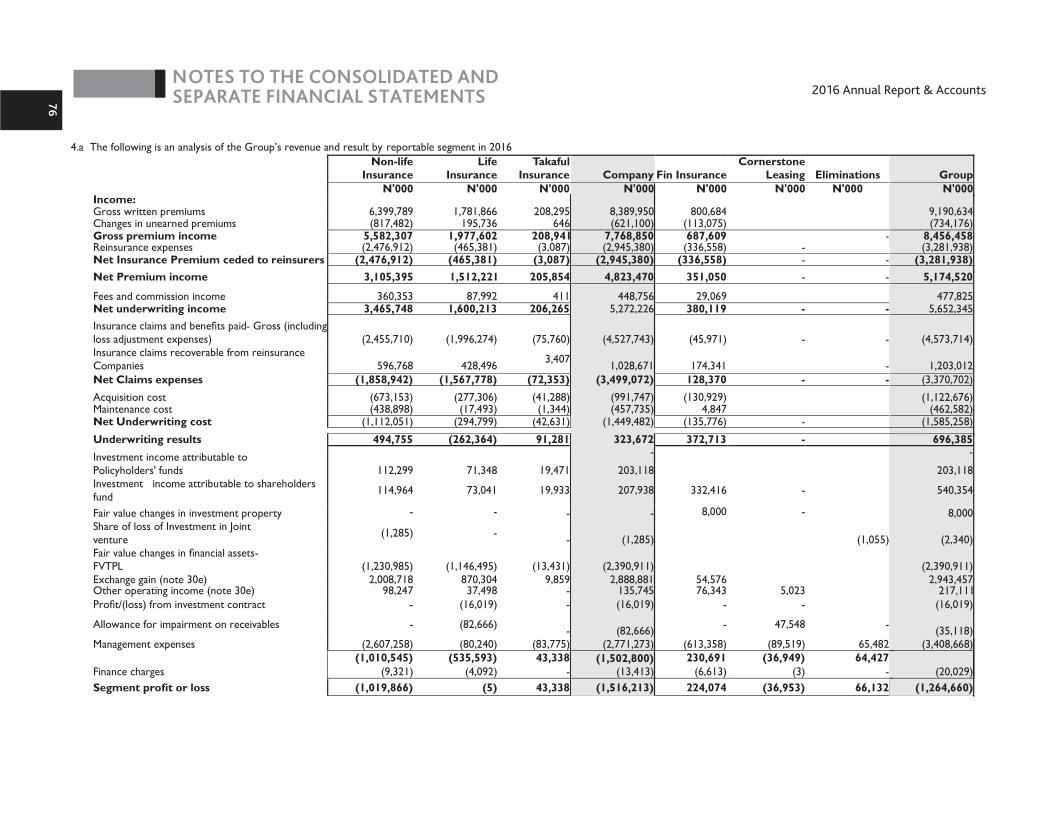
NOTES TO THE CONSOLIDATED AND SEPARATE FINANCIAL STATEMENTS76
4.a The following is an analysis of the Group’s revenue and result by reportable segment in 2016
Non-life
Insurance Life
Insurance Takaful
Insurance Fin Insurance Cornerstone
Leasing Eliminations N'000 N'000 N'000 N'000 N'000 N'000 Income:
Gross written premiums 6,399,789 1,781,866 208,295 800,684 Changes in unearned premiums (817,482) 195,736 646 (113,075) Gross premium income 5,582,307 1,977,602 208,941 687,609 - Reinsurance expenses (2,476,912) (465,381) (3,087) (336,558) - Net Insurance Premium ceded to reinsurers (2,476,912) (465,381) (3,087) (336,558) - - Net Premium income 3,105,395 1,512,221 205,854 351,050 - -
Fees and commission income
360,353
87,992
411
29,069
Net underwriting income
3,465,748
1,600,213
206,265
380,119
-
-
Insurance claims and benefits paid-
Gross (including loss adjustment expenses)
(2,455,710)
(1,996,274)
(75,760)
(45,971)
-
-
Insurance claims recoverable from reinsurance Companies
596,768
428,496
3,407
174,341
-
Net Claims expenses
(1,858,942)
(1,567,778)
(72,353)
128,370
-
-
Acquisition cost
(673,153)
(277,306) (41,288)
(130,929)
Maintenance cost
(438,898)
(17,493)
(1,344)
4,847
Net Underwriting cost
(1,112,051)
(294,799)
(42,631)
(135,776)
-
Underwriting results
494,755
(262,364)
91,281
372,713
-
Investment income attributable to Policyholders' funds
112,299
71,348
19,471
Investment income attributable to shareholders fund
114,964
73,041
19,933
332,416
-
Fair value changes in investment property
-
-
-
8,000
-
Share of loss of Investment in Joint venture
(1,285)
-
-
(1,055)
Fair value changes in financial assets-FVTPL
(1,230,985)
(1,146,495)
(13,431)
Exchange gain (note 30e)
2,008,718
870,304
9,859
54,576
Other operating income (note 30e)
98,247
37,498
-
76,343
5,023
Profit/(loss) from investment contract
-
(16,019)
-
-
-
Allowance for impairment on receivables
-
(82,666)
-
-
47,548
-
Management expenses
(2,607,258)
(80,240)
(83,775)
(613,358)
(89,519)
65,482
(1,010,545)
(535,593)
43,338
230,691
(36,949)
64,427
(1,244,331)
Finance charges
(9,321)
(4,092)
-
(6,613)
(3)
-
Segment profit or loss
(1,019,866)
(5)
43,338
224,074
(36,953)
66,132
GroupN'000
9,190,634(734,176)
8,456,458(3,281,938)
(3,281,938)5,174,520
477,8255,652,345
(4,573,714)
1,203,012(3,370,702)
(1,122,676)(462,582)
(1,585,258)
696,385-
203,118
540,354
8,000
(2,340)
(2,390,911)2,943,457
217,111(16,019)
(35,118)(3,408,668)
(20,029)
Company N'000
8,389,950 (621,100)
7,768,850 (2,945,380) (2,945,380)
4,823,470 448,756 5,272,226
(4,527,743)
1,028,671 (3,499,072) (991,747) (457,735) (1,449,482)
323,672 - 203,118 207,938
-
(1,285)
(2,390,911)
2,888,881
135,745
(16,019)
(82,666)
(2,771,273)
(1,502,800)
(13,413)
(1,516,213)
(1,264,660)

NOTES TO THE CONSOLIDATED AND SEPARATE FINANCIAL STATEMENTS
77
7,331,633(212,001)7,119,632
(2,110,177)(2,110,177)
5,009,455
307,1285,316,583
(2,844,291)
647,865
(2,196,426)(1,108,961)
407,488
1,646,161
780,062
64,480(656,266)
322,752109,907
23,761(311,178)
(2,344,757)42,410
4.b The following is an analysis of the Group's revenue and result by reportable segment in 2015
Life Insurance
Takaful Insurance Takaful
Cornerstone
Leasing Eliminations
General Life N'000 N'000 N'000 N'000 N'000 N'000
Group
N'000
2,426,166 100,035 19,662 (289,719) (14,390) -
2,136,447 85,645 19,662
- (427,076) (3,514) -
(427,076) (3,514) - - -
1,709,371 82,131 19,662 - -
- 85,528 879 1,794,900 83,010 19,662 - -
- (1,188,052) (39,058) - -
281,922 - -
(906,129) (39,058) - - - (412,082) (14,075) (13,789) - -
(78,896) - -
(490,978) (14,075) (13,789)
397,793 29,876 5,873 -
-
--
-
355,660 2,997 7,041 -
38,688
(335,278)
148,701
1,827
9,713
23,761
(405,084)
(24,356) 409,035
(749,826) (37,203) (30,439) (75,699) 45,734
(370,776) 3,689 6,047 (90,342) 454,769
(1,105)
(22,143) -
(1,105) - - (22,143) -
(371,881) 3,689 6,047 (112,485) 454,769
- -
- 1,832,910
(371,881) 3,689 6,047
(157,437) (8,926) -
(529,318) 3,689 6,047 (121,411) 454,769
(203,374)
(535,511)
Company
(365,033)
(32,266)(32,266)
10,144
1,832,910
(212,300)
1,630,754
4,785,770
92,108 4,877,878
(1,679,587) (1,679,587)
3,198,291
220,721 3,419,011
(1,617,181)
365,943
(1,251,238) (669,014)
(286,138)
(955,152)
7,331,633(212,001)7,119,632
(2,110,177)(2,110,177)
5,009,455
307,1285,316,583
(2,844,291)
647,865
(2,196,426)(1,108,961)
(365,033)(1,473,995)1,646,161
780,062
64,480(656,266)
322,752100,194
23,761(695,857)
(2,314,792)(322,014)
-(10,132)
(10,132)(332,137)
-(332,137)
407,488152,981220,903
1,212,621
414,365
25,792
(318,975)
174,051
98,367
-
(290,773)
(1,497,325)
39,027
(9,018)
(9,018)
30,009
-
30,009
(45,937)
(15,928)
Non life Insurance
N'000
10,032 23,572
-(2,013)
- -- -- -- -
-
-
-
-
-
-
--
- -
--
-
-
- -
---
-
-
--
-
-
-
- -
-
-----
(1,473,995)
Income:
Gross written premiums Changes in unearned premiums Premium income Reinsurance expenses Net Insurance Premium ceded to reinsurers
Net Premium income
Fees and commission income Net Income
Insurance claims and benefits paid- Gross (including loss adjustment expenses) Insurance claims recoverable from reinsurance Companies
Net Claims expenses Acquisition cost
Maintenance cost
Net underwriting expenses
Underwriting results
Investment income attributable to shareholdersfund
Fair value changes in investment property
Fair value changes in financial assets-FVTPL
Exchange gain
Other operating income
Profit/(loss) from investment contract
Allowance for impairment on receivables
Management expenses
Finance charges
Gain on bargain purchase
Segment profit or loss before taxation
Taxation
Segment profit or loss after tax
Investment income attributable to Policyholders' fund

4.c Revenue from major products and services The Group’s revenue from major products and services is disclosed in the segment revenue tables. 4.d Geographical information
The Group’s revenue and information about its segment net assets by geographical location are as follows: Revenue Net assets
2016 2015
2016 2015
N'000 N'000 N'000 N'000 Within Nigeria
8,389,950 7,331,633
8,349,754 10,142,477
Outside Nigeria
- -
- -
8,389,950 7,331,633
8,349,754 10,142,477
4.e Information about major customers The Group does not derive revenue from an individual policyholder or intermediary that represents 10% or more of the groups
total revenue. Group Company
2016
2015
N'000 2015N'000
2016N'000 N'000
5 Cash and cash equivalents Cash
1,473 2,313
779 706
Short-term deposits (including demand and time deposits) 3,091,607 6,295,523
2,556,374 3,687,072
Cash and cash equivalents (as per statement of financial statements and cash flows) 3,093,080 6,297,836
2,557,153 3,687,778
Cash equivalents are defined as short-term, highly liquid investments that are readily convertible to known amounts of cash, this includes current account with banks, short term placement with banks and cash in hand. Short–term deposits are made for varying periods of between one day and three months depending on the immediate cash requirements of the Group. All deposits are subject to an average variable interest rate of 14% (2015: 10.81%). The carrying amounts disclosed above reasonably approximate fair value at the reporting date.
78
TABLE OF CONTENT 2016 Annual Report & AccountsNOTES TO THE CONSOLIDATED AND SEPARATE FINANCIAL STATEMENTS

6 Financial assets Group Company
2016 2015
2016 2015
N'000 N'000
N'000 N'000
Available for Sale (AFS) ( note 6.a.1) 3,311,472 2,402,076
2,368,590 1,459,122
Fair value through profit or loss (FVTPL) ( note 6.a.2) 2,836,108 3,510,998
2,836,108 3,510,998 Loans & Receivables ( note 6.a.3) 3,500,444 1,835,677
2,165,560 1,557,484
9,648,024 7,748,751
7,370,258 6,527,603 6.a Classification – carrying amount
6.a.1 Available-for-sale investments (AFS) Carried at fair value(listed security) 805,986 554,780
672,445 467,246
Fair value through other comprehensive income (unlisted security) (Note 6a(ii)) 931,246 903,291
121,904 73,602
Carried at cost (unlisted securities) (Note 6a (i)) 1,574,240 944,005
1,574,240 918,274 3,311,472 2,402,076 2,368,590 1,459,122
6.a.2 Fair value through profit or loss -Unlisted securities (note 6a(ii)) 2,836,108 3,510,998
2,836,108 3,510,998
6.a.3 Loans and receivables investments carried at amortised cost 6a(iii) 3,500,444 1,835,677
2,165,560 1,557,484
9,648,024 7,748,751
7,370,257 6,527,604
6a(i) Details of unlisted securities carried at cost include:
CAPIC(see note i below)
1,413,836 779,020
1,413,836 779,020
Nigeria Oil & Gas Pool (NAL) 5,258 30,989
5,258 5,258 Nigeria Liability Insurance Pool 6,646 6,646
6,646 6,646
Energy & Allied Insurance Pool
61,000 39,850
61,000 39,850
OAK Pension Limited
50,000 50,000
50,000 50,000 Sterling Assurance
37,500 37,500
37,500 37,500
1,574,240 944,005
1,574,240 918,274
The above financial assets have been assessed for impairment and there was no objective evidence that the asset is impaired.
79
2016 Annual Report & AccountsNOTES TO THE CONSOLIDATED AND SEPARATE FINANCIAL STATEMENTS
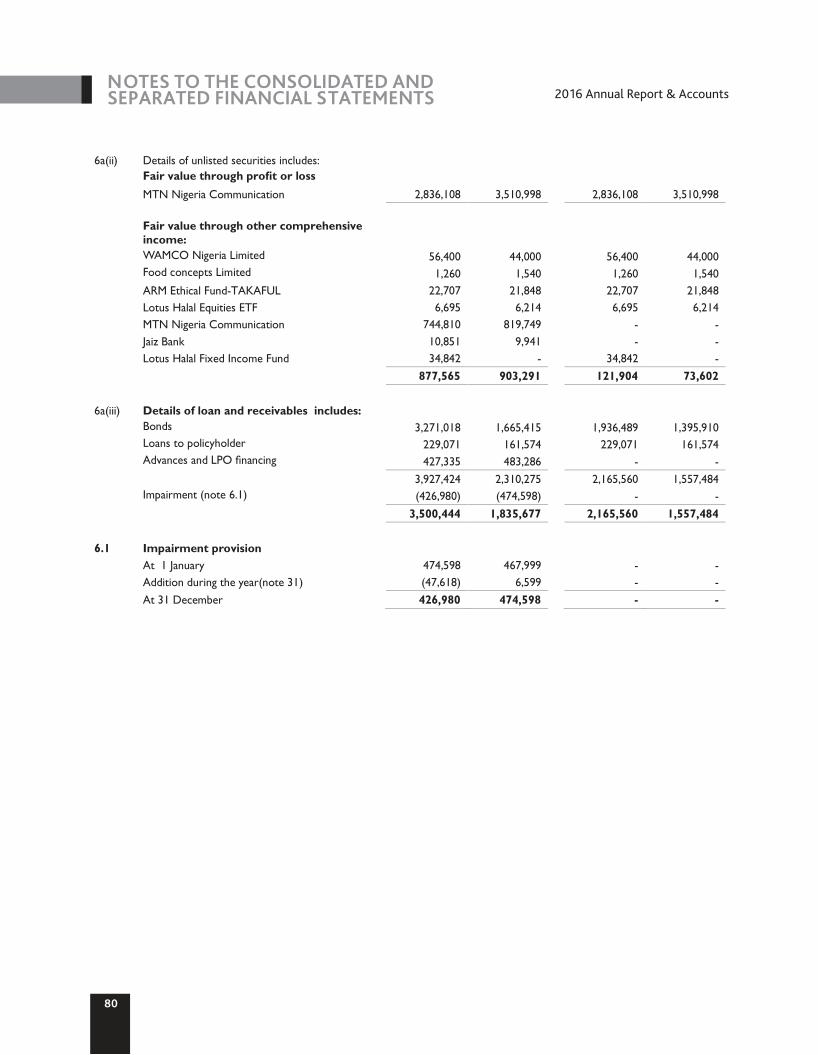
6a(ii) Details of unlisted securities includes:
Fair value through profit or loss MTN Nigeria Communication 2,836,108 3,510,998
2,836,108 3,510,998
Fair value through other comprehensive income:
WAMCO Nigeria Limited
56,400 44,000
56,400 44,000 Food concepts Limited
1,260 1,540
1,260 1,540
ARM Ethical Fund-TAKAFUL 22,707 21,848
22,707 21,848 Lotus Halal Equities ETF
6,695 6,214
6,695 6,214
MTN Nigeria Communication 744,810 819,749
- - Jaiz Bank
10,851 9,941
- -
Lotus Halal Fixed Income Fund
34,842 -
34,842 -
877,565 903,291
121,904 73,602
6a(iii) Details of loan and receivables includes:
Bonds
3,271,018 1,665,415
1,936,489 1,395,910 Loans to policyholder
229,071 161,574
229,071 161,574
Advances and LPO financing
427,335 483,286
- -
3,927,424 2,310,275
2,165,560 1,557,484
Impairment (note 6.1)
(426,980) (474,598)
- -
3,500,444 1,835,677
2,165,560 1,557,484
6.1 Impairment provision At 1 January
474,598 467,999
- - Addition during the year(note 31)
(47,618) 6,599
- -
At 31 December
426,980 474,598
- -
TABLE OF CONTENT
80
NOTES TO THE CONSOLIDATED AND SEPARATED FINANCIAL STATEMENTS 2016 Annual Report & Accounts

6.2.1 Movement in financial assets (Group) – 2016 6.2.1 Movement in financial assets
(Group) - 2016 Available For Sale (AFS)
Fair value(Listed
securities
Fair value (Unlisted
securities)
Carried at cost
(unlisted securities)
Fair value through profit
or loss (FVTPL)
Loans and receivables
Total
N'000
N'000
N'000
N'000
N'000
N'000
Balance as at 1 January 554,780
903,291
944,005
3,510,998
1,835,677
7,748,751
Addition during the year 208,182
34,500
144,440
-
1,366,343
1,753,465
Disposal/Repayment during the year -
-
(25,731)
-
(170,969)
(196,700)
Accrued interest -
-
-
-
55,211
55,211
Fair value Gain/(loss) -
-
-
(2,390,911)
(2,390,911)
Exchange gains/(loss) recognised in income statement -
-
511,526
1,716,021
366,564
2,594,111
Fair value changes in Other comprehensive income 43,024
(459,179)
-
-
(416,155)
Exchange gains/(loss) recognised in other comprehensive income -
452,634
-
-
452,634
Impairment no longer required -
-
-
-
47,618
47,618
Balance as at 31, December 805,986
931,246
1,574,240
2,836,108
3,500,444
9,648,024
Notes to the Consolidated and Separate Financial Statements
NOTES TO THE CONSOLIDATED AND SEPARATE FINANCIAL STATEMENTS 81
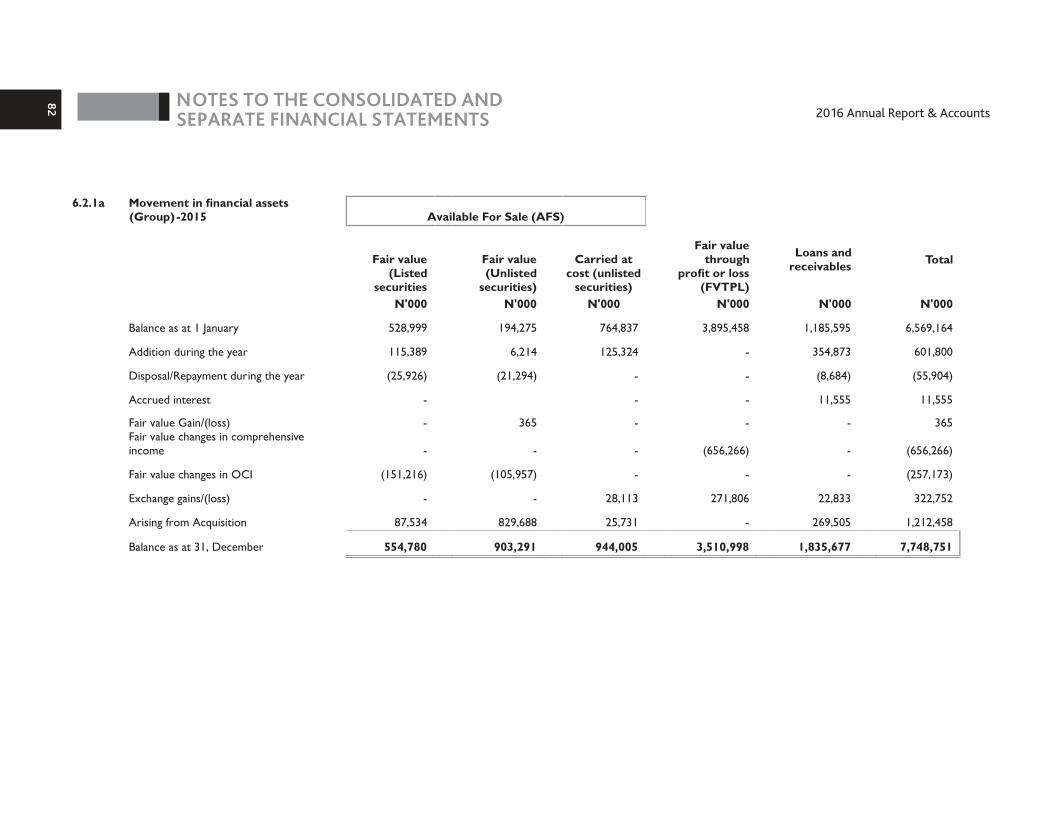
6.2.1a Movement in financial assets (Group) -2015 Available For Sale (AFS)
Fair value (Listed
securities
Fair value (Unlisted
securities)
Carried at cost (unlisted
securities)
Fair value through
profit or loss (FVTPL)
Loans and receivables
Total
N'000
N'000
N'000
N'000
N'000
N'000
Balance as at 1 January 528,999
194,275
764,837
3,895,458
1,185,595
6,569,164
Addition during the year 115,389
6,214
125,324
-
354,873
601,800
Disposal/Repayment during the year (25,926)
(21,294)
-
-
(8,684)
(55,904)
Accrued interest -
-
-
11,555
11,555
Fair value Gain/(loss) -
365
-
-
-
365
Fair value changes in comprehensive income -
-
-
(656,266)
-
(656,266)
Fair value changes in OCI (151,216)
(105,957)
-
-
-
(257,173)
Exchange gains/(loss) -
-
28,113
271,806
22,833
322,752
Arising from Acquisition 87,534
829,688
25,731
-
269,505
1,212,458
Balance as at 31, December 554,780
903,291
944,005
3,510,998
1,835,677
7,748,751
NOTES TO THE CONSOLIDATED AND SEPARATE FINANCIAL STATEMENTS
82

6.2.2 Movement in financial assets (Company) - 2016 Available For Sale (AFS)
Loans and receivables
Total
N'000
N'000
At 1 January 1,557,484
6,527,604
Addition during the year 323,390
664,507
Redemption (115,017)
(115,017)
Accrued interest 54,421
54,420
Fair value Gain/(loss) -
(2,390,911)
Fair value changes in other comprehensive income (OCI) -
56,825
Exchange gains/(loss) 345,282
2,572,829
At 31 December 2,165,560
7,370,257
Carried at cost (unlisted
securities) N'000 918,274 144,441 - - -
-
511,525
1,574,240
Fair value(Listed
securities N'000
467,246 162,175 - - -
43,024
-
672,445
Fair value(Unlisted
securities) N'000 73,602 34,501 - - -
13,801
-
121,905
Fair value
through profit or loss
(FVTPL) N'000 3,510,998 - - - (2,390,911)
-
1,716,021
2,836,108
6.2.2a Movement in financial assets (Company) -2015 Available For Sale (AFS)
Fair value(Listed
securities
Fair value(Unlisted securities)
Carried at cost (unlisted
securities)
Fair value through
profit or loss (FVTPL)
Loans and receivables
Total
N'000
N'000
N'000
N'000
N'000
N'000
At 1 January 528,999
194,275
764,837
3,891,513
1,119,811
6,499,435
Addition during the year 115,389
6,214
125,324
3,945
411,969
662,841
Redemption (25,926)
(21,294)
-
-
(8,684)
(55,904)
Accrued interest -
-
-
11,555
11,555
Fair value Gain/(loss) -
364
-
-
-
364
Fair value changes in comprehensive income
-
-
(656,266)
-
(656,266)
Fair value changes in OCI (151,216)
(105,957)
-
-
(257,173)
Exchange gains/(loss)
28,113
271,806
22,833
322,752
At 31 December 467,246
73,602
918,274
3,510,998
1,557,484
6,527,604
NOTES TO THE CONSOLIDATED AND SEPARATE FINANCIAL STATEMENTS
83
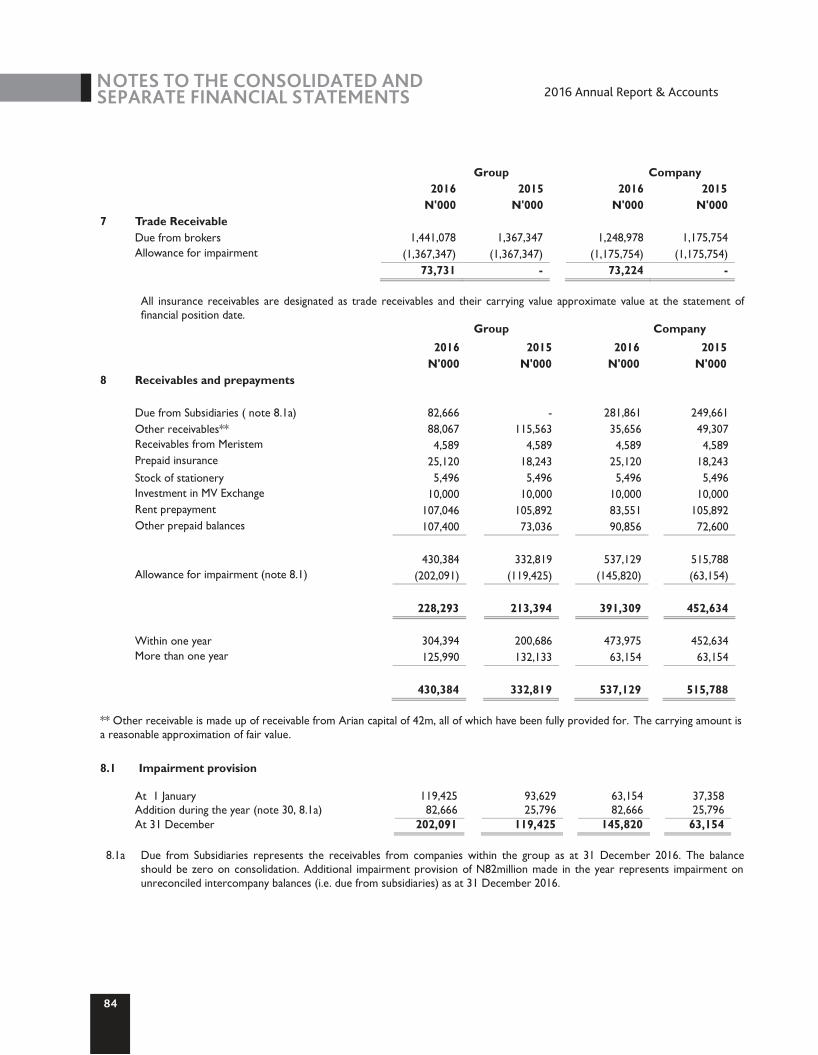
Group Company
2016 2015
2016 2015
N'000 N'000
N'000 N'000
7 Trade Receivable
Due from brokers 1,441,078 1,367,347
1,248,978 1,175,754
Allowance for impairment
(1,367,347) (1,367,347)
(1,175,754) (1,175,754)
73,731 -
73,224 -
All insurance receivables are designated as trade receivables and their carrying value approximate value at the statement of
financial position date.
Group Company
2016
2015
2016
2015
N'000
N'000
N'000
N'000
8 Receivables and prepayments
Due from Subsidiaries ( note 8.1a) 82,666
-
281,861
249,661
Other receivables** 88,067
115,563
35,656
49,307
Receivables from Meristem 4,589
4,589
4,589
4,589
Prepaid insurance 25,120
18,243
25,120
18,243
Stock of stationery
5,496
5,496
5,496
5,496
Investment in MV Exchange 10,000
10,000
10,000
10,000
Rent prepayment 107,046
105,892
83,551
105,892
Other prepaid balances
107,400
73,036
90,856
72,600
430,384
332,819
537,129
515,788
Allowance for impairment (note 8.1)
(202,091)
(119,425)
(145,820)
(63,154)
228,293
213,394
391,309
452,634
Within one year
304,394
200,686
473,975
452,634
More than one year
125,990
132,133
63,154
63,154
430,384
332,819
537,129
515,788
** Other receivable is made up of receivable from Arian capital of 42m, all of which have been fully provided for. The carrying amount is a reasonable approximation of fair value.
8.1 Impairment provision
At 1 January 119,425 93,629 63,154 37,358 Addition during the year (note 30, 8.1a) 82,666 25,796 82,666 25,796 At 31 December 202,091 119,425 145,820 63,154
8.1a Due from Subsidiaries represents the receivables from companies within the group as at 31 December 2016. The balance
should be zero on consolidation. Additional impairment provision of N82million made in the year represents impairment on unreconciled intercompany balances (i.e. due from subsidiaries) as at 31 December 2016.
NOTES TO THE CONSOLIDATED AND SEPARATE FINANCIAL STATEMENTS
84
2016 Annual Report & Accounts
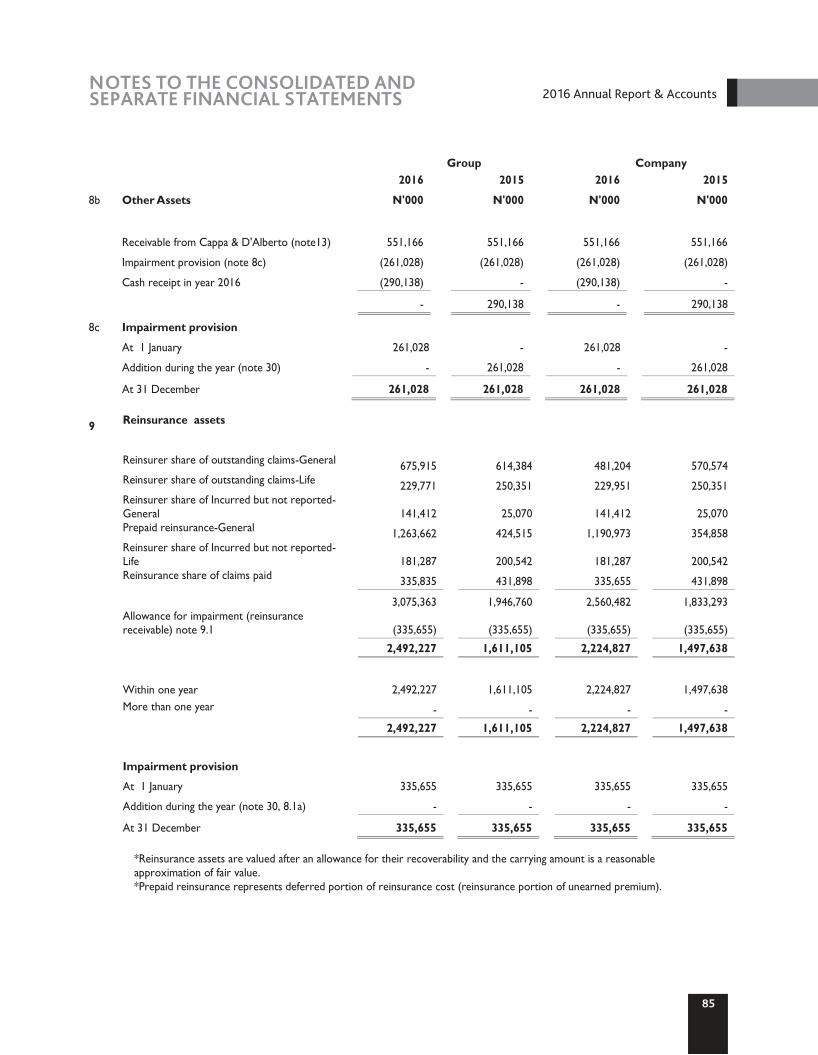
85
2016 Annual Report & AccountsNOTES TO THE CONSOLIDATED AND SEPARATE FINANCIAL STATEMENTS
Group Company
2016 2015 2016 2015
8b Other Assets
N'000
N'000
N'000
N'000
Receivable from Cappa & D'Alberto (note13) 551,166
551,166
551,166
551,166
Impairment provision (note 8c)
(261,028)
(261,028)
(261,028)
(261,028)
Cash receipt in year 2016
(290,138)
-
(290,138)
-
-
290,138
-
290,138
8c Impairment provision
At 1 January
261,028
-
261,028
-
Addition during the year (note 30) -
261,028
-
261,028
At 31 December
261,028
261,028
261,028
261,028
9 Reinsurance assets
Reinsurer share of outstanding claims-General 675,915
614,384
481,204
570,574
Reinsurer share of outstanding claims-Life 229,771
250,351
229,951
250,351
Reinsurer share of Incurred but not reported-General 141,412
25,070
141,412
25,070
Prepaid reinsurance-General 1,263,662
424,515
1,190,973
354,858
Reinsurer share of Incurred but not reported-Life 181,287
200,542
181,287
200,542
Reinsurance share of claims paid 335,835
431,898
335,655
431,898
3,075,363
1,946,760
2,560,482
1,833,293
Allowance for impairment (reinsurance receivable) note 9.1 (335,655)
(335,655)
(335,655)
(335,655)
2,492,227
1,611,105
2,224,827
1,497,638
Within one year
2,492,227
1,611,105
2,224,827
1,497,638
More than one year
-
-
-
-
2,492,227
1,611,105
2,224,827
1,497,638
Impairment provision
At 1 January
335,655
335,655
335,655
335,655
Addition during the year (note 30, 8.1a) -
-
-
-
At 31 December
335,655
335,655
335,655
335,655
*Reinsurance assets are valued after an allowance for their recoverability and the carrying amount is a reasonable
approximation of fair value. *Prepaid reinsurance represents deferred portion of reinsurance cost (reinsurance portion of unearned premium).
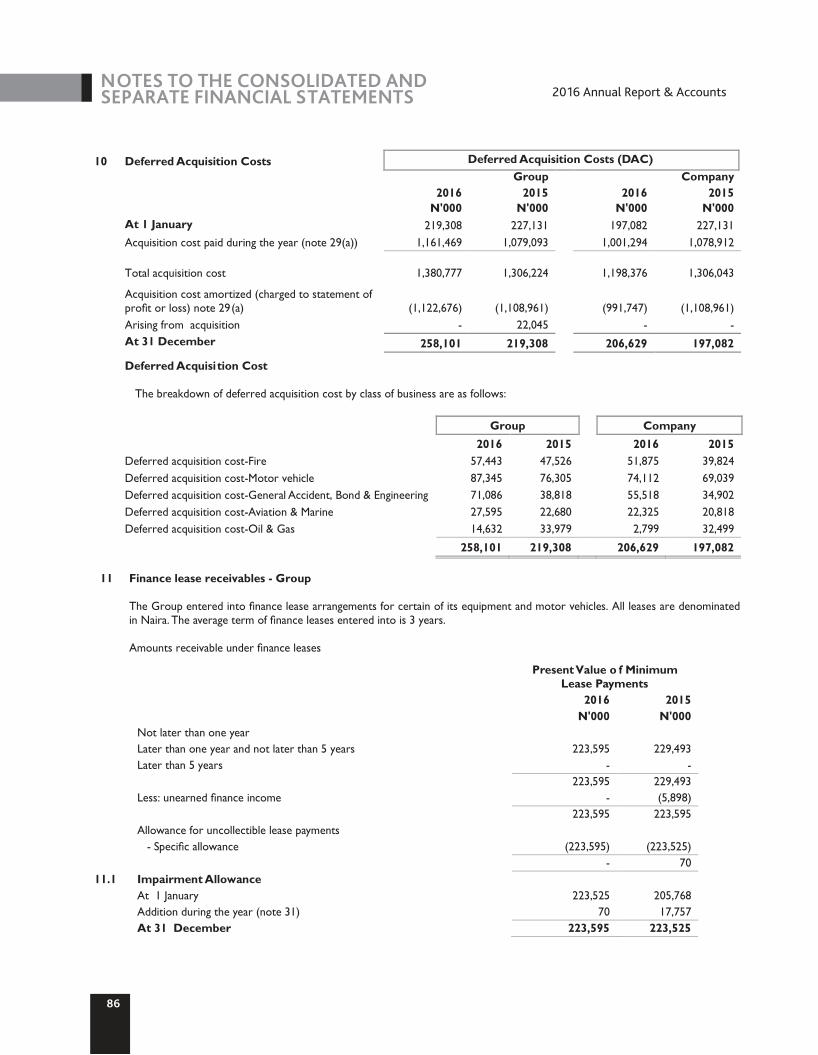
10 Deferred Acquisition Costs Deferred Acquisition Costs (DAC) Group Company
2016 2015 2016 2015
N'000 N'000 N'000 N'000
At 1 January 219,308 227,131
197,082 227,131
Acquisition cost paid during the year (note 29(a)) 1,161,469 1,079,093
1,001,294 1,078,912
Total acquisition cost 1,380,777 1,306,224
1,198,376 1,306,043
Acquisition cost amortized (charged to statement of profit or loss) note 29 (a) (1,122,676) (1,108,961)
(991,747) (1,108,961)
Arising from acquisition - 22,045
- -
At 31 December 258,101 219,308
206,629 197,082
Deferred Acquisition Cost
The breakdown of deferred acquisition cost by class of business are as follows:
Group
Company
2016 2015
2016 2015
Deferred acquisition cost-Fire 57,443 47,526
51,875 39,824
Deferred acquisition cost-Motor vehicle 87,345 76,305
74,112 69,039
Deferred acquisition cost-General Accident, Bond & Engineering 71,086 38,818
55,518 34,902
Deferred acquisition cost-Aviation & Marine 27,595 22,680
22,325 20,818
Deferred acquisition cost-Oil & Gas 14,632 33,979
2,799 32,499
258,101 219,308
206,629 197,082
11 Finance lease receivables - Group
The Group entered into finance lease arrangements for certain of its equipment and motor vehicles. All leases are denominated
in Naira. The average term of finance leases entered into is 3 years.
Amounts receivable under finance leases
Present Value o f Minimum Lease Payments
2016 2015
N'000 N'000
Not later than one year
Later than one year and not later than 5 years 223,595 229,493
Later than 5 years - -
223,595 229,493
Less: unearned finance income - (5,898)
223,595 223,595
Allowance for uncollectible lease payments
- Specific allowance (223,595) (223,525)
- 70
11.1 Impairment Allowance
At 1 January 223,525 205,768
Addition during the year (note 31) 70 17,757
At 31 December 223,595 223,525
NOTES TO THE CONSOLIDATED AND SEPARATE FINANCIAL STATEMENTS
86
2016 Annual Report & Accounts
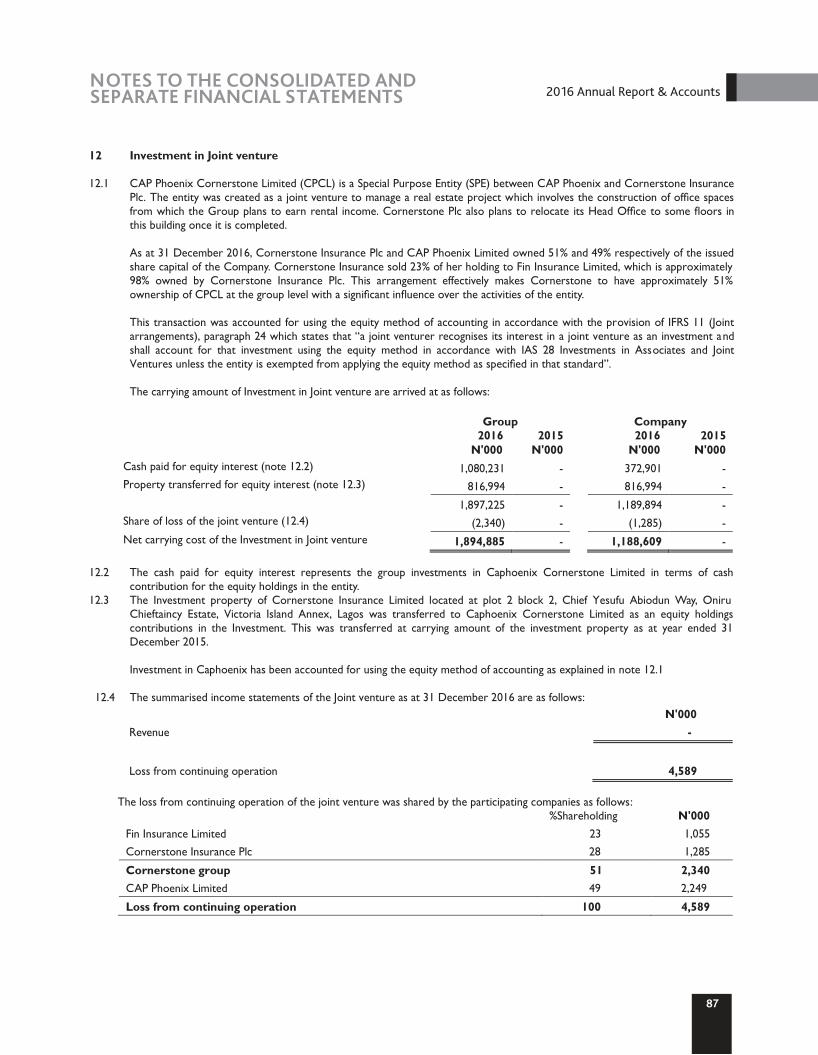
12 Investment in Joint venture
12.1 CAP Phoenix Cornerstone Limited (CPCL) is a Special Purpose Entity (SPE) between CAP Phoenix and Cornerstone Insurance Plc. The entity was created as a joint venture to manage a real estate project which involves the construction of office spaces from which the Group plans to earn rental income. Cornerstone Plc also plans to relocate its Head Office to some floors in this building once it is completed.
As at 31 December 2016, Cornerstone Insurance Plc and CAP Phoenix Limited owned 51% and 49% respectively of the issued
share capital of the Company. Cornerstone Insurance sold 23% of her holding to Fin Insurance Limited, which is approximately 98% owned by Cornerstone Insurance Plc. This arrangement effectively makes Cornerstone to have approximately 51% ownership of CPCL at the group level with a significant influence over the activities of the entity.
This transaction was accounted for using the equity method of accounting in accordance with the provision of IFRS 11 (Joint
arrangements), paragraph 24 which states that “a joint venturer recognises its interest in a joint venture as an investment and shall account for that investment using the equity method in accordance with IAS 28 Investments in Associates and Joint Ventures unless the entity is exempted from applying the equity method as specified in that standard”.
The carrying amount of Investment in Joint venture are arrived at as follows:
Group Company
2016 2015
2016 2015 N'000 N'000 N'000 N'000 Cash paid for equity interest (note 12.2) 1,080,231 -
372,901 -
Property transferred for equity interest (note 12.3) 816,994 -
816,994 -
1,897,225 -
1,189,894 -
Share of loss of the joint venture (12.4) (2,340) -
(1,285) -
Net carrying cost of the Investment in Joint venture 1,894,885 -
1,188,609 -
12.2 The cash paid for equity interest represents the group investments in Caphoenix Cornerstone Limited in terms of cash contribution for the equity holdings in the entity.
12.3 The Investment property of Cornerstone Insurance Limited located at plot 2 block 2, Chief Yesufu Abiodun Way, Oniru Chieftaincy Estate, Victoria Island Annex, Lagos was transferred to Caphoenix Cornerstone Limited as an equity holdings contributions in the Investment. This was transferred at carrying amount of the investment property as at year ended 31 December 2015.
Investment in Caphoenix has been accounted for using the equity method of accounting as explained in note 12.1
12.4 The summarised income statements of the Joint venture as at 31 December 2016 are as follows:
N'000
Revenue
-
Loss from continuing operation
4,589 The loss from continuing operation of the joint venture was shared by the participating companies as follows:
%Shareholding N'000
Fin Insurance Limited 23 1,055
Cornerstone Insurance Plc 28 1,285
Cornerstone group 51 2,340
CAP Phoenix Limited 49 2,249
Loss from continuing operation 100 4,589
87
2016 Annual Report & AccountsNOTES TO THE CONSOLIDATED AND SEPARATE FINANCIAL STATEMENTS
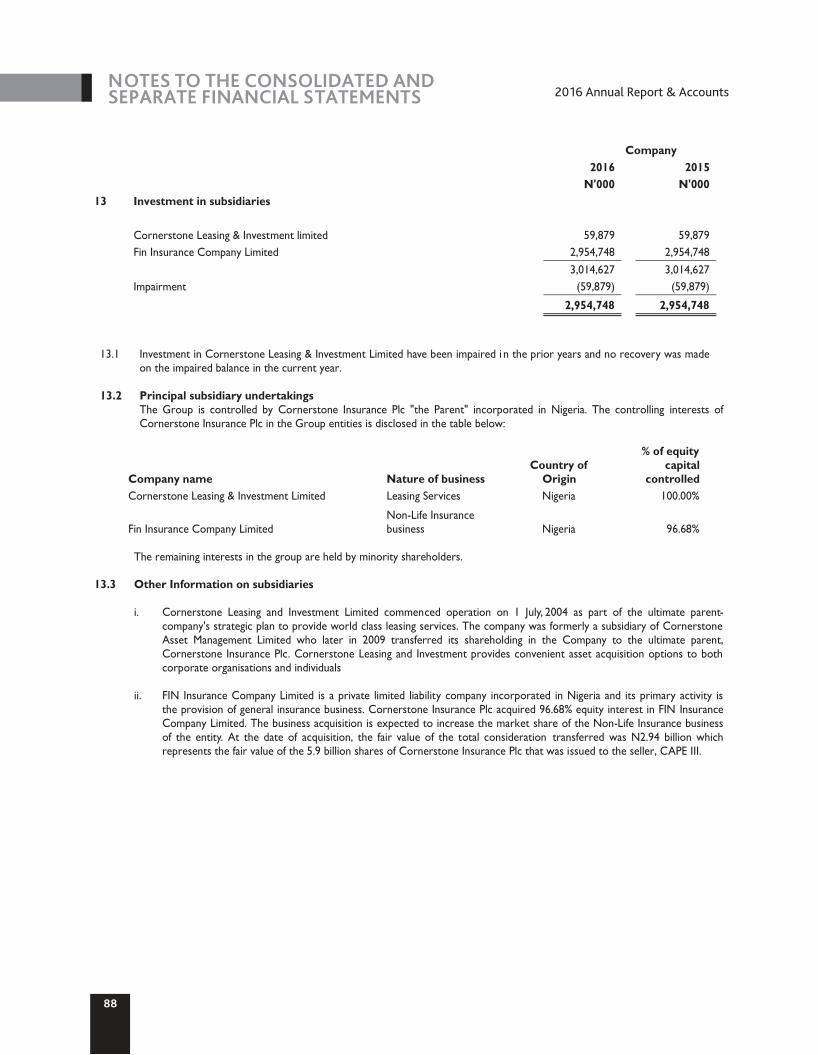
Company
2016
2015
N'000
N'000
13 Investment in subsidiaries
Cornerstone Leasing & Investment limited
59,879
59,879
Fin Insurance Company Limited
2,954,748
2,954,748
3,014,627
3,014,627
Impairment
(59,879)
(59,879)
2,954,748
2,954,748
13.1 Investment in Cornerstone Leasing & Investment Limited have been impaired i n the prior years and no recovery was made
on the impaired balance in the current year.
13.2 Principal subsidiary undertakings The Group is controlled by Cornerstone Insurance Plc "the Parent" incorporated in Nigeria. The controlling interests of
Cornerstone Insurance Plc in the Group entities is disclosed in the table below:
Company name Nature of business
Country of Origin
% of equity capital
controlled
Cornerstone Leasing & Investment Limited Leasing Services
Nigeria
100.00%
Fin Insurance Company Limited
Non-Life Insurance business
Nigeria
96.68%
The remaining interests in the group are held by minority shareholders.
13.3 Other Information on subsidiaries
i. Cornerstone Leasing and Investment Limited commenced operation on 1 July, 2004 as part of the ultimate parent-
company's strategic plan to provide world class leasing services. The company was formerly a subsidiary of Cornerstone Asset Management Limited who later in 2009 transferred its shareholding in the Company to the ultimate parent, Cornerstone Insurance Plc. Cornerstone Leasing and Investment provides convenient asset acquisition options to both corporate organisations and individuals
ii. FIN Insurance Company Limited is a private limited liability company incorporated in Nigeria and its primary activity is
the provision of general insurance business. Cornerstone Insurance Plc acquired 96.68% equity interest in FIN Insurance Company Limited. The business acquisition is expected to increase the market share of the Non-Life Insurance business of the entity. At the date of acquisition, the fair value of the total consideration transferred was N2.94 billion which represents the fair value of the 5.9 billion shares of Cornerstone Insurance Plc that was issued to the seller, CAPE III.
NOTES TO THE CONSOLIDATED AND SEPARATE FINANCIAL STATEMENTS
88
2016 Annual Report & Accounts
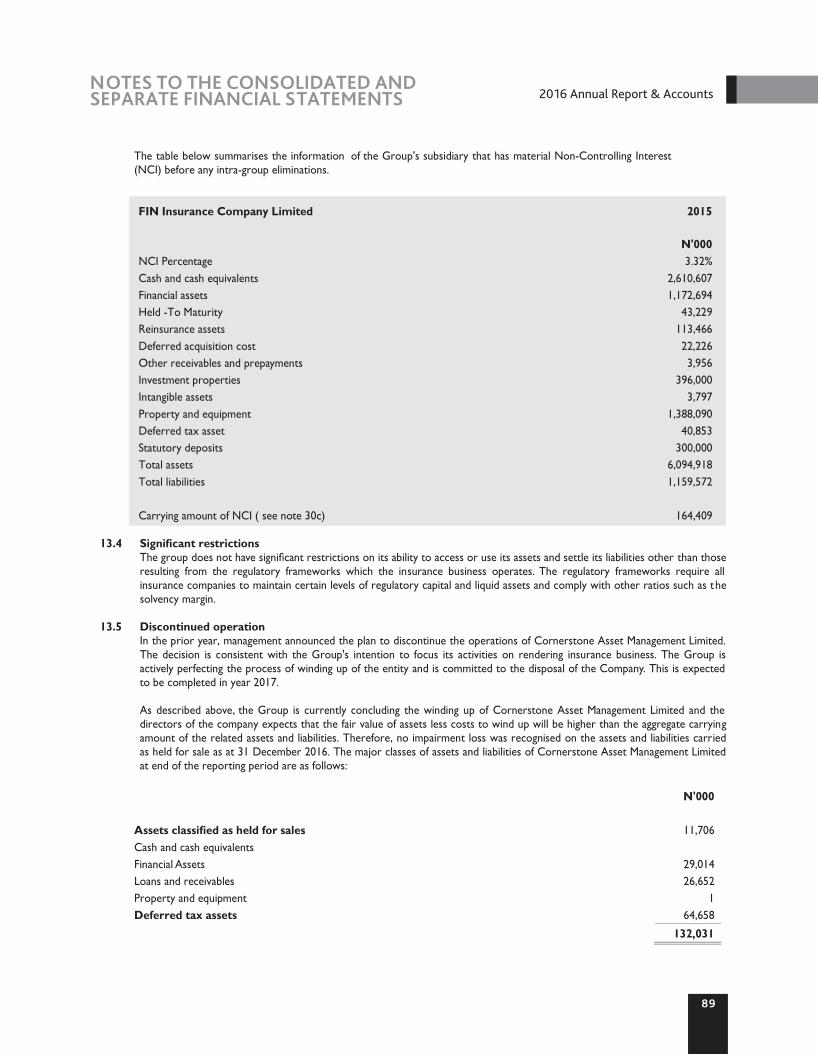
The table below summarises the information of the Group's subsidiary that has material Non-Controlling Interest (NCI) before any intra-group eliminations.
FIN Insurance Company Limited
2015
N'000
NCI Percentage
3.32%
Cash and cash equivalents
2,610,607
Financial assets
1,172,694
Held -To Maturity
43,229
Reinsurance assets
113,466
Deferred acquisition cost
22,226
Other receivables and prepayments
3,956
Investment properties
396,000
Intangible assets
3,797
Property and equipment
1,388,090
Deferred tax asset
40,853
Statutory deposits
300,000
Total assets
6,094,918
Total liabilities
1,159,572
Carrying amount of NCI ( see note 30c)
164,409
13.4 Significant restrictions The group does not have significant restrictions on its ability to access or use its assets and settle its liabilities other than those
resulting from the regulatory frameworks which the insurance business operates. The regulatory frameworks require all insurance companies to maintain certain levels of regulatory capital and liquid assets and comply with other ratios such as the solvency margin.
13.5 Discontinued operation
In the prior year, management announced the plan to discontinue the operations of Cornerstone Asset Management Limited. The decision is consistent with the Group's intention to focus its activities on rendering insurance business. The Group is actively perfecting the process of winding up of the entity and is committed to the disposal of the Company. This is expected to be completed in year 2017.
As described above, the Group is currently concluding the winding up of Cornerstone Asset Management Limited and the
directors of the company expects that the fair value of assets less costs to wind up will be higher than the aggregate carrying amount of the related assets and liabilities. Therefore, no impairment loss was recognised on the assets and liabilities carried as held for sale as at 31 December 2016. The major classes of assets and liabilities of Cornerstone Asset Management Limited at end of the reporting period are as follows:
N'000
Assets classified as held for sales
11,706
Cash and cash equivalents
Financial Assets
29,014
Loans and receivables
26,652
Property and equipment
1
Deferred tax assets
64,658
132,031
89
2016 Annual Report & AccountsNOTES TO THE CONSOLIDATED AND SEPARATE FINANCIAL STATEMENTS
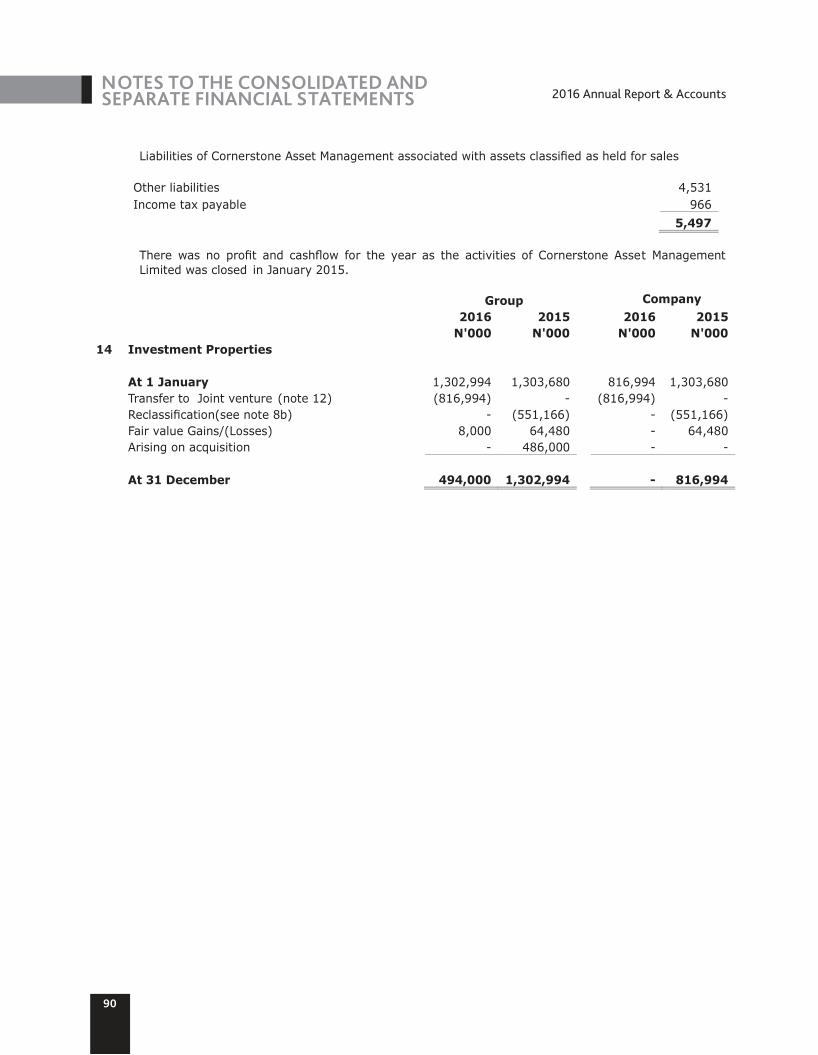
Liabilities of Cornerstone Asset Management associated with assets classified as held for sales
Other liabilities
4,531
Income tax payable
966
5,497
There was no profit and cashflow for the year as the activities of Cornerstone Asset Management Limited was closed in January 2015.
Group Company
2016 2015
2016 2015
N'000 N'000
N'000 N'000
14 Investment Properties
At 1 January
1,302,994 1,303,680
816,994 1,303,680
Transfer to Joint venture (note 12)
(816,994) -
(816,994) -
Reclassification(see note 8b)
- (551,166)
- (551,166)
Fair value Gains/(Losses)
8,000 64,480
- 64,480
Arising on acquisition
- 486,000
- -
At 31 December
494,000 1,302,994
- 816,994
NOTES TO THE CONSOLIDATED AND SEPARATE FINANCIAL STATEMENTS
90
2016 Annual Report & Accounts
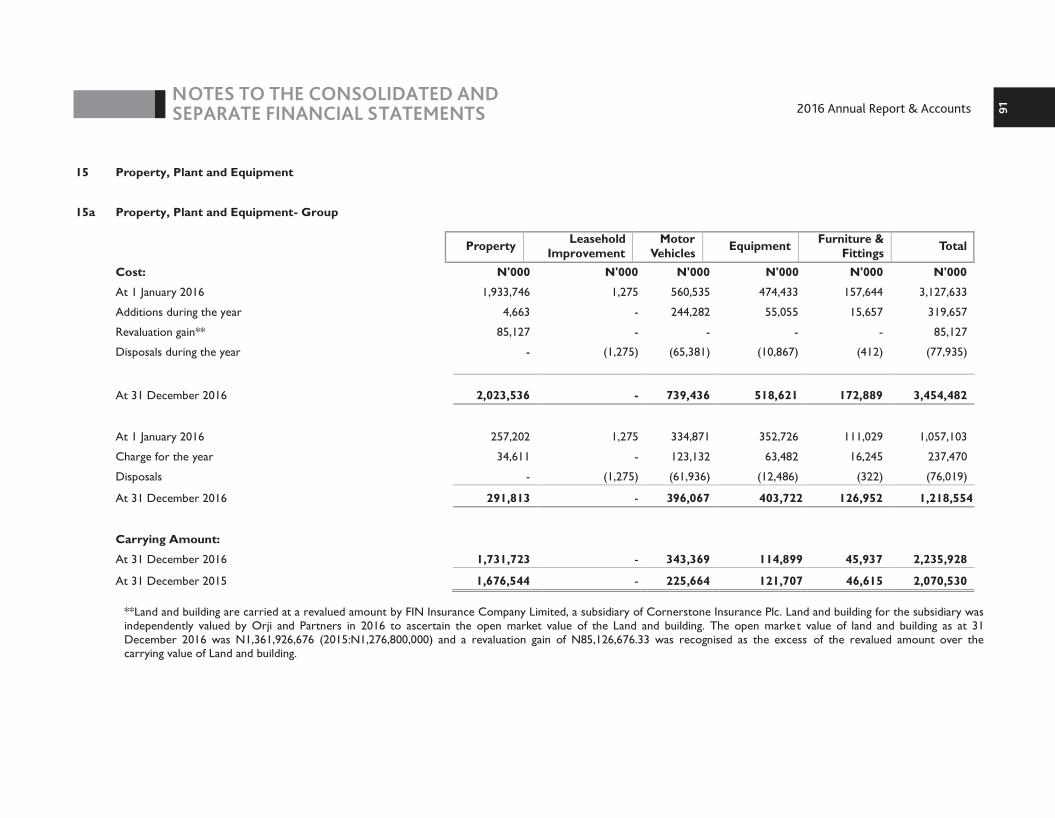
15 Property, Plant and Equipment
15a Property, Plant and Equipment- Group
Cost:
At 1 January 2016
Additions during the year
Revaluation gain**
Disposals during the year
At 31 December 2016
At 1 January 2016
Charge for the year
Disposals
At 31 December 2016
Carrying Amount:
At 31 December 2016
At 31 December 2015
**Land and building are carried at a revalued amount by FIN Insurance Company Limited, a subsidiary of Cornerstone Insurance Plc. Land and building for the subsidiary was independently valued by Orji and Partners in 2016 to ascertain the open market value of the Land and building. The open market value of land and building as at 31 December 2016 was N1,361,926,676 (2015:N1,276,800,000) and a revaluation gain of N85,126,676.33 was recognised as the excess of the revalued amount over the carrying value of Land and building.
91
NOTES TO THE CONSOLIDATED AND SEPARATE FINANCIAL STATEMENTS
N'000 N'000 N'000 N'000 N'000 N'000
1,933,746 1,275 560,535 474,433 157,644 3,127,633
4,663 - 244,282 55,055 15,657 319,657
85,127 - - - - 85,127
- (1,275) (65,381) (10,867) (412) (77,935)
2,023,536 - 739,436 518,621 172,889 3,454,482
257,202 1,275 334,871 352,726 111,029 1,057,103
34,611 - 123,132 63,482 16,245 237,470
- (1,275) (61,936) (12,486) (322) (76,019)
291,813 - 396,067 403,722 126,952 1,218,554
1,731,723 - 343,369 114,899 45,937 2,235,928
1,676,544 - 225,664 121,707 46,615 2,070,530
Property Leasehold Improvement
Motor Vehicles
Equipment Furniture & Fittings
Total
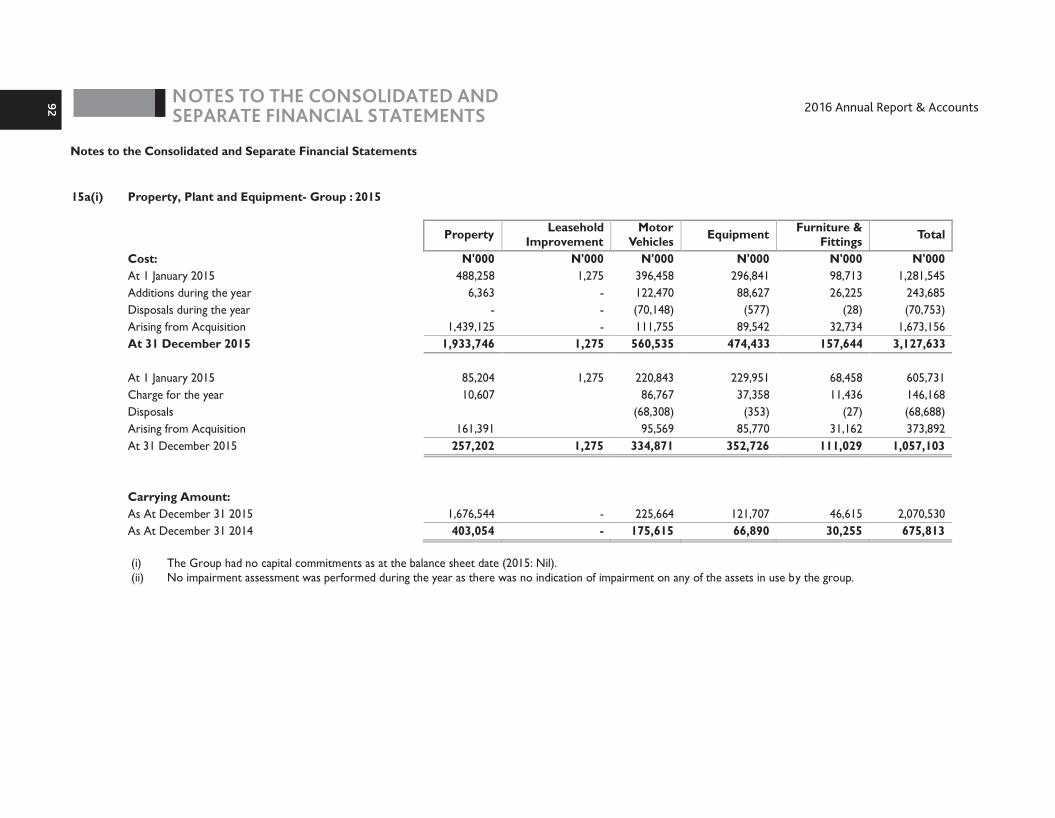
15a(i) Property, Plant and Equipment- Group : 2015
Cost:
N'000 N'000 N'000 N'000 N'000 N'000
Property Leasehold
Improvement Motor
Vehicles Equipment Furniture & Fittings Total
At 1 January 2015
488,258 1,275 396,458 296,841 98,713 1,281,545
Additions during the year 6,363 - 122,470 88,627 26,225 243,685
Disposals during the year - - (70,148) (577) (28) (70,753)
Arising from Acquisition
1,439,125
-
111,755
89,542
32,734
1,673,156
At 31 December 2015
1,933,746
1,275
560,535
474,433
157,644
3,127,633
At 1 January 2015
85,204
1,275
220,843
229,951
68,458
605,731
Charge for the year
10,607
86,767
37,358
11,436
146,168
Disposals
(68,308)
(353)
(27)
(68,688)
Arising from Acquisition
161,391
95,569
85,770
31,162
373,892
At 31 December 2015
257,202
1,275
334,871
352,726
111,029
1,057,103
Carrying Amount:
As At December 31 2015
1,676,544
-
225,664
121,707
46,615
2,070,530
As At December 31 2014
403,054
-
175,615
66,890
30,255
675,813
(i)
The Group had no capital commitments as at the balance sheet date (2015: Nil).
(ii)
No impairment assessment was performed during the year as there was no indication of impairment on any of the assets in use by the group.
Notes to the Consolidated and Separate Financial Statements
92
NOTES TO THE CONSOLIDATED AND SEPARATE FINANCIAL STATEMENTS
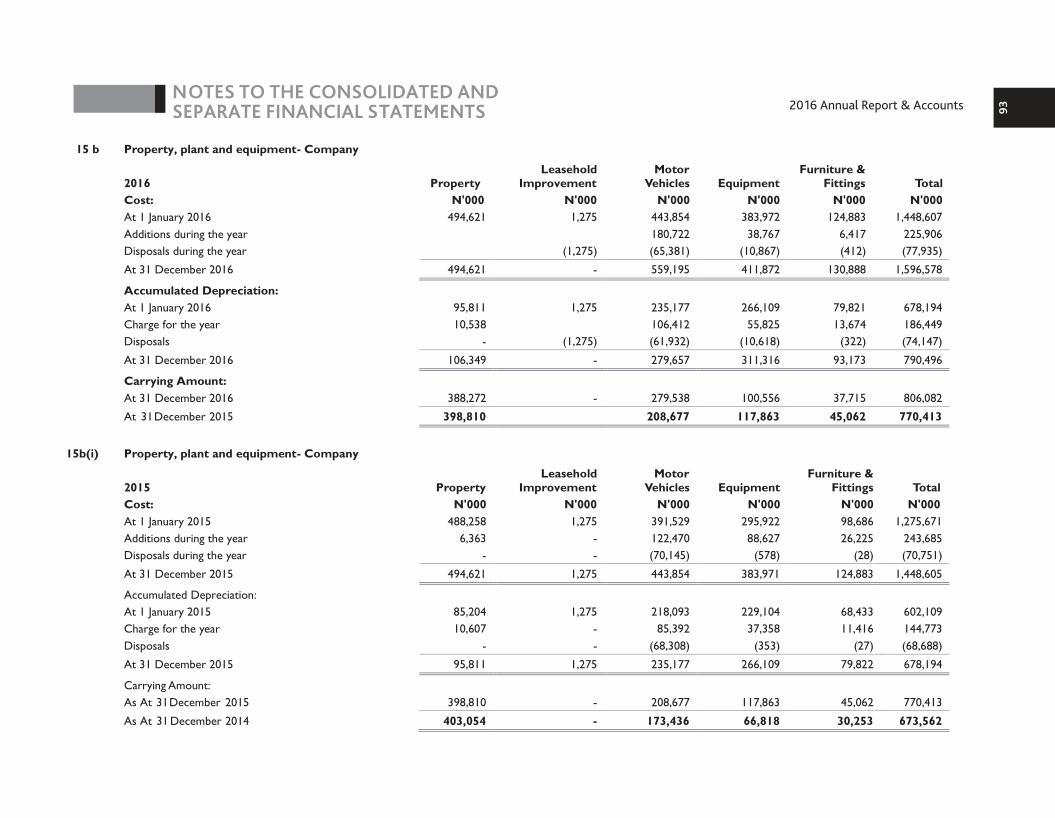
15 b Property, plant and equipment- Company
2016
Property
Leasehold Improvement
Motor Vehicles Equipment
Furniture & Fittings Total
Cost:
N'000 N'000 N'000 N'000 N'000 N'000
At 1 January 2016
494,621 1,275 443,854 383,972 124,883 1,448,607
Additions during the year
180,722 38,767 6,417 225,906
Disposals during the year
(1,275) (65,381) (10,867) (412) (77,935)
At 31 December 2016
494,621 - 559,195 411,872 130,888 1,596,578
Accumulated Depreciation:
At 1 January 2016
95,811 1,275 235,177 266,109 79,821 678,194
Charge for the year
10,538
106,412 55,825 13,674 186,449
Disposals
- (1,275) (61,932) (10,618) (322) (74,147)
At 31 December 2016
106,349 - 279,657 311,316 93,173 790,496
Carrying Amount:
At 31 December 2016
388,272 - 279,538 100,556 37,715 806,082
At December 2015
398,810 208,677 117,863 45,062 770,413
15b(i) Property, plant and equipment- Company
2015
Property
Leasehold Improvement
Motor Vehicles Equipment
Furniture & Fittings Total
Cost:
N'000 N'000 N'000 N'000 N'000 N'000
At 1 January 2015
488,258 1,275 391,529 295,922 98,686 1,275,671
Additions during the year
6,363 - 122,470 88,627 26,225 243,685
Disposals during the year
- - (70,145) (578) (28) (70,751)
At 31 December 2015
494,621 1,275 443,854 383,971 124,883 1,448,605
Accumulated Depreciation:
At 1 January 2015
85,204 1,275 218,093 229,104 68,433 602,109
Charge for the year
10,607 - 85,392 37,358 11,416 144,773
Disposals
- - (68,308) (353) (27) (68,688)
At 31 December 2015
95,811 1,275 235,177 266,109 79,822 678,194
Carrying Amount:
As At December 2015
398,810 - 208,677 117,863 45,062 770,413
As At December 2014
403,054 - 173,436 66,818 30,253 673,562
NOTES TO THE CONSOLIDATED AND SEPARATE FINANCIAL STATEMENTS 93
31
31
31

GROUP COMPANY
2016 2015
2016 2015
N'000 N'000
N'000 N'000
16 Intangible assets - Group/company
Cost:
At 1 January
130,744 93,429
111,362 93,429
Additions
65,622 17,933
57,141 17,933
Arising from acquisition
- 19,382
- -
At 31 December 2016
196,366 130,744
168,503 111,362
Amortisation:
At 1 January
90,703 62,402
75,117 62,402
Charge for the year
19,594 12,715
16,766 12,715
Arising from acquisition
- 15,586
- -
At 31 December
110,297 90,703
91,883 75,117
Carrying Amount:
At 31 December
86,069 40,041
76,620 36,245
At 31 December
86,069 40,041
76,620 36,245
17 Statutory Deposits
Deposits with CBN
800,000 800,000
500,000 500,000
Analysis:
Non-Life Business
600,000 300,000
300,000 300,000
Life Business
200,000 200,000
200,000 200,000
Arising from acquisition
- 300,000
- -
800,000 800,000
500,000 500,000
Statutory deposits represent amounts deposited with the Central Bank of Nigeria (CBN) in accordance with section 9(1) and section 10(3) of Insurance Act 2003. The cash amount held is considered to be a restricted cash as the management does not have access to the balances in its day to day activities. Statutory deposits are measured at cost and interest is earned on t he deposits annually.
18 Investment Contract Liabilities Group Company
2016 2015
2016 2015
N'000 N'000
N'000 N'000
Financial guarantee contracts 2,353,766 1,712,048
2,353,766 1,712,048
At 1 January 1,712,048 1,322,472 1,712,048 1,322,472
Contribution 1,314,895 905,910
1,314,895 905,910
Withdrawals (713,413) (531,435)
(713,413) (531,435)
Guaranteed interest 40,236 15,101
40,236 15,101
At 31 December
2,353,766 1,712,048
2,353,766 1,712,048
Current
2,353,766 1,712,048
2,353,766 1,712,048 Non-current
- -
- -
NOTES TO THE CONSOLIDATED AND SEPARATE FINANCIAL STATEMENTS
94
2016 Annual Report & Accounts

NOTES TO THE CONSOLIDATED AND SEPARATE FINANCIAL STATEMENTS
95
2016 Annual Report & Accounts
2016 2015 N'000 N'000
18.1 Income Statements for Deposit Administration Interest income (note 30c) 48,056 72,362
Expenses Investment contract cost (note 29c) (23,839) (33,500)
Guaranteed interest ( note 29d)
(40,236)
(15,101)
Profit on Deposit Administration
(16,019) 23,761
19
Insurance contract liabilities
19.a (i)
Carrying amount-Group
Gross
Reinsurers’ asset
Net
2016
2015
2016
2015
2016
2015
N'000
N'000
N'000
N'000
N'000
N'000
Life:
Participating life
-
Life Fund
852,187
1,023,373
181,286
200,542
670,901
822,831
-
Claims Outstanding
757,673
523,078
335,196
250,351
422,477
272,727Annuity Fund
-
Life Fund Annuity
200,339
29,711
-
-
200,339
29,711Total life
1,810,199
1,576,162
516,482
450,893
1,293,717
1,125,269
Non-life:
Outstanding claims
2,097,130
1,466,959
652,333
570,574
1,444,797
896,385IBNR
402,930
315,594
164,995
25,070
237,935
290,524IBNR-Takaful
17,582
12,437
-
-
17,582
12,437Arising from Acquisition-Outstanding claims
-
469,767
-
-
-
Arising from Acquisition-IBNR
-
94,718
-
43,810
-
50,908
2,517,642
2,359,475
817,328
639,454
1,700,314
1,250,254
Unearned premiums
2,572,591
1,449,127
1,190,973
354,858
1,381,618
1,094,269Unexpired risks-Takaful
41,440
42,086
-
-
41,440
42,086Arising from consolidation
-
192,907
-
69,656
-
123,251
2,614,031
1,684,120
1,190,973
424,514
1,423,058
1,259,606
Total non -life
5,131,673
4,043,595
2,008,301
1,063,968
3,123,372
2,509,860
Total li abilities
6,941,872
5,619,757
2,524,783
1,514,861
4,417,089
3,635,129
Within one year
6,941,872
5,619,757
2,524,783
1,514,861
4,417,089
3,635,129More than one year - - - - - -
6,941,872 5,619,757 2,524,783 1,514,861 4,417,089 3,635,129

NOTES TO THE CONSOLIDATED AND SEPARATE FINANCIAL STATEMENTS
96
2016 Annual Report & Accounts
19.a (ii) Insurance contract liabilities
Carrying amount-Company
Life: Participating life - Life Fund 852,187 1,023,373 181,286 200,542 670,901 822,831
- Claims Outstanding 757,673 523,078 335,196 250,351 422,478 272,727 - Life Fund Annuity 200,339 29,711 - - 200,339 29,711
Total life 1,810,199 1,576,162 516,482 450,893 1,293,718 1,125,269
Non-life:
Outstanding claims
1,824,644
1,466,959
481,205
570,574
1,343,439
896,385
IBNR
347,372
315,594
141,412
25,070
205,960
290,524
IBNR Takaful
17,582
12,437
-
-
-
12,437
2,189,598
1,794,990
622,617
595,644
1,549,399
1,186,909
Unearned premiums
2,266,609
1,449,127
1,190,973
354,858 1,075,636
1,094,269
Unexpired risks-Takaful
41,440
42,086
-
-
41,440
42,086
2,308,049
1,491,213
1,190,973
354,858
1,117,076
1,136,355
Total non -life
4,497,647
3,286,203
1,813,590
950,502 2,666,475
2,323,264
Total liabilities
6,307,846
4,862,365
2,330,072
1,401,395
3,960,193
3,448,533
Within one year
6,039,725
4,594,244
2,124,672
1,195,995
3,897,472
3,385,812
More than one year
268,121
268,121
205,400
205,400
62,721
62,721
6,307,846 4,862,365 2,330,072 1,401,395 3,960,193 3,448,533
Gross
Reinsurers’ asset
Net
2016
2015
2016
2015
2016
2015
N'000 N'000 N'000 N'000 N'000 N'000
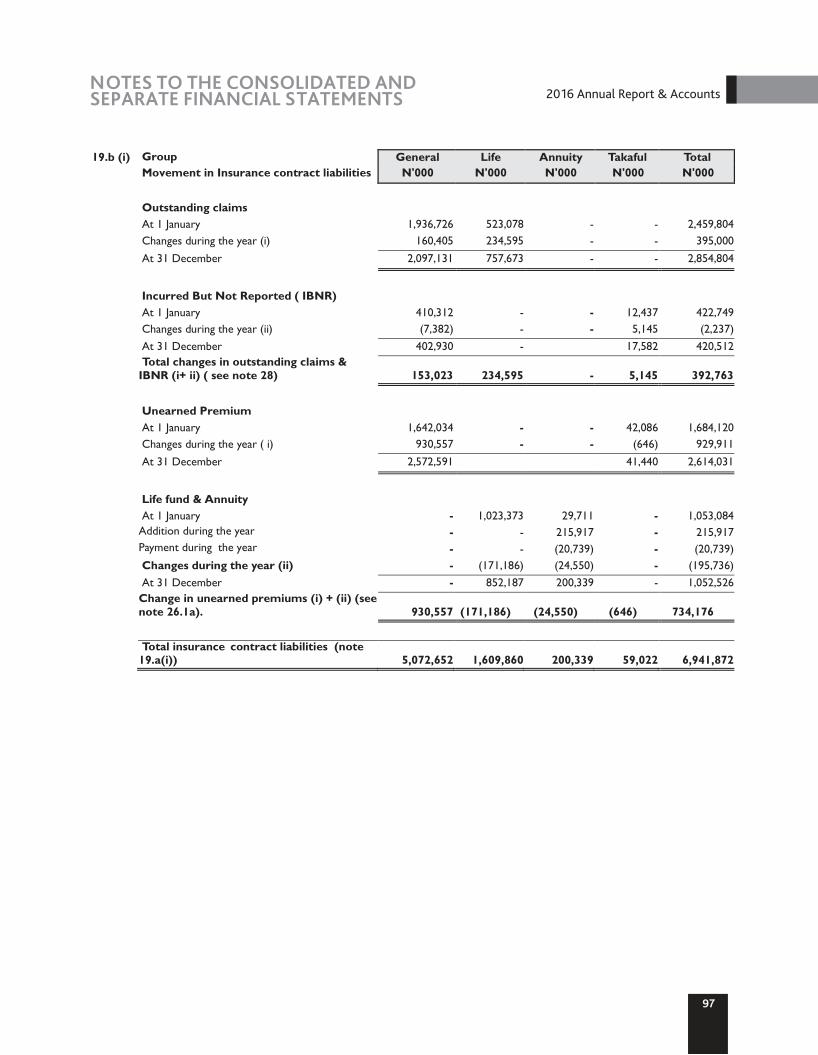
97
2016 Annual Report & AccountsNOTES TO THE CONSOLIDATED AND SEPARATE FINANCIAL STATEMENTS
19.b (i) Group General Life Annuity Takaful Total Movement in Insurance contract liabilities N'000 N'000 N'000 N'000 N'000
Outstanding claims
At 1 January 1,936,726 523,078 - - 2,459,804
Changes during the year (i) 160,405 234,595 - - 395,000
At 31 December 2,097,131 757,673 - - 2,854,804
Incurred But Not Reported ( IBNR)
At 1 January 410,312 - - 12,437 422,749
Changes during the year (ii) (7,382) - - 5,145 (2,237)
At 31 December 402,930 - 17,582 420,512
Total changes in outstanding claims & IBNR (i+ ii) ( see note 28) 153,023 234,595 - 5,145 392,763
Unearned Premium
At 1 January 1,642,034 - - 42,086 1,684,120
Changes during the year ( i)
930,557
- - (646)
929,911
At 31 December
2,572,591
41,440
2,614,031
Life fund & Annuity
At 1 January
-
1,023,373
29,711
-
1,053,084
Addition during the year
-
-
215,917
-
215,917
Payment during the year
-
-
(20,739)
-
(20,739)
Changes during the year (ii)
-
(171,186)
(24,550)
-
(195,736)
At 31 December
-
852,187
200,339
-
1,052,526
Change in unearned premiums (i) + (ii) (see note 26.1a).
930,557
(171,186)
(24,550)
(646)
734,176
Total insurance
contract liabilities (note
19.a(i))
5,072,652
1,609,860
200,339
59,022
6,941,872

NOTES TO THE CONSOLIDATED AND SEPARATE FINANCIAL STATEMENTS
98
2016 Annual Report & Accounts
19.b (ii) Company
Movement in Insurance contract liabilities General Life Annuity Takaful Total
N'000 N'000 N'000 N'000 N'000
Outstanding claims At 1 January 1,466,959 523,078 - - 1,990,037
Changes during the year 357,685 234,595 - - 592,280
At 31 December
1,824,644
757,673
-
-
2,582,317
Incurred But Not Reported ( IBNR)
At 1 January
315,594
-
12,437
328,031
Changes during the year
31,778
-
5,145
36,923
At 31
December
347,372
-
17,582
364,954
Total changes in out standing claims &
IBNR ( note 28)
389,463
234,595
- 5,145
629,203
Unearned Premium
At 1 January
1,449,127
-
-
42,086
1,491,213
Changes during the year ( i)
817,482
-
-
(646)
816,836
At 31 December
2,266,609
-
-
41,440
2,308,049
Life fund & Annuity
At 1 January
-
1,023,373
29,711
-
1,053,084
Addition during the year
-
-
215,917
-
215,917
Payment during the year
-
-
(20,739)
-
(20,739)
Changes during the year (ii)
-
(171,186)
(24,550)
-
(195,736)
At 31 December
-
852,187
200,339
-
1,052,526
Change in unearned premiums (i) + (ii) (see note 26).
817,482
852,187
(24,550)
(646)
621,100
Insurance contract liabilities (note
19.a(ii)) 4,438,625 1,609,860 200,338 59,022 6,307,846
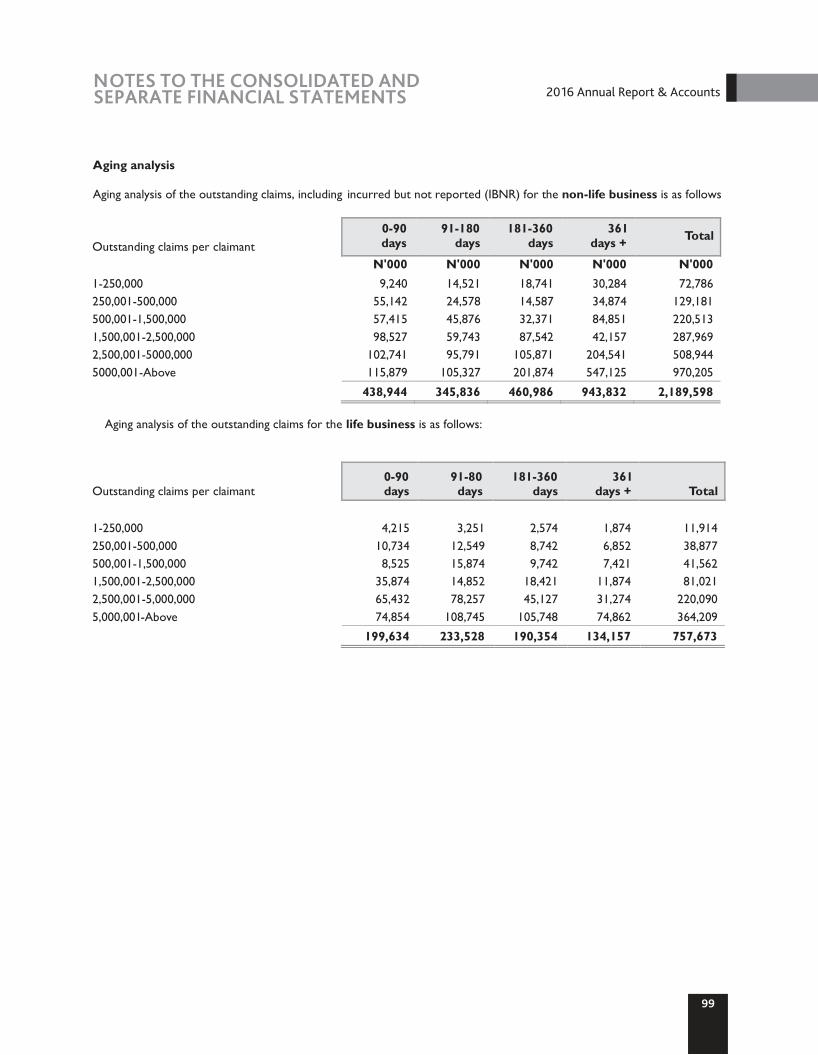
Aging analysis
Aging analysis of the outstanding claims, including - incurred but not reported (IBNR) for the non life business is as follows
Outstanding claims per claimant
0-90 days
91-180 days
181-360 days
361 days + Total
N'000 N'000 N'000 N'000 N'000
1-250,000 9,240 14,521 18,741 30,284 72,786
250,001-500,000 55,142 24,578 14,587 34,874 129,181
500,001-1,500,000 57,415 45,876 32,371 84,851 220,513
1,500,001-2,500,000
98,527
59,743
87,542
42,157
287,969
2,500,001-5000,000
102,741
95,791
105,871
204,541
508,944
5000,001-Above
115,879
105,327
201,874
547,125
970,205
438,944
345,836
460,986
943,832
2,189,598
Aging analysis of the outstanding claims for the life business is as follows:
Outstanding claims per claimant
0-90
days91-80
days181-360
days361
days + Total
1-250,000
4,215
3,251
2,574
1,874
11,914
250,001-500,000
10,734
12,549
8,742
6,852
38,877
500,001-1,500,000
8,525
15,874
9,742
7,421
41,562
1,500,001-2,500,000
35,874
14,852
18,421
11,874
81,021
2,500,001-5,000,000
65,432
78,257
45,127
31,274
220,090
5,000,001-Above
74,854
108,745
105,748
74,862
364,209
199,634
233,528
190,354
134,157
757,673
NOTES TO THE CONSOLIDATED AND SEPARATE FINANCIAL STATEMENTS
99
2016 Annual Report & Accounts

NOTES TO THE CONSOLIDATED AND SEPARATE FINANCIAL STATEMENTS
100
2016 Annual Report & Accounts
19.c Asset Hypothecation NON-LIFE LIFE Takaful
POLICY
HOLDERS ANNUITY POLICY HOLDER
Policy Holders
Share holders TOTAL
N'000 N'000 N'000 N'000 N'000
Cash and cash Equivalents
741,577
50,500
1,269,592
368,126
127,358
2,557,153
Fair value through profit and loss
950,670
-
1,846,059
39,380
-
2,836,109
Available for sales at (Fair value)-unlisted
-
-
-
-
121,904
121,904
Available for sales at cost -unlisted
445,621
20,034
365,820
-
742,765
1,574,240
Available for sales at fair value -listed
-
139,803
-
14,170
518,471
672,444
Held -to-maturity investment carried at amortised cost(HTM)
-
-
-
-
2,165,560
2,165,560
Trade receivable
73,224
-
-
-
-
73,224
Other receivable and prepayment
-
-
-
-
391,309
391,309
Reinsurance assets
2,043,541
-
181,286
-
-
2,224,827
Deferred acquisition cost
206,629
206,629
Investment in Joint venture
-
-
-
-
1,188,609
1,188,609
Investment in subsidiary
-
-
-
-
2,954,748
2,954,748
Property, plant and equipment
-
-
-
-
806,082
806,082
Intangible assets
-
-
-
-
76,620
76,620
Deferred tax assets
-
-
-
-
18,790
18,790
Statutory deposits
-
-
-
-
500,000
500,000
4,461,262
210,337
3,662,757
421,676
9,612,216
18,368,248
INSURANCE FUNDS
NON-LIFE
Annuity
LIFE
Takaful
Share holders
TOTAL
N'000
N'000
N'000
N'000
N'000 N'000
Investment contact liabilities
-
-
2,048,343
305,423
-
2,353,766Insurance contact liabilities 4,456,207 200,338 1,609,860 41,440 - 6,307,846 Shareholders and other funds - - - - 9,706,636 9,706,636
4,456,207 200,338 3,658,203 364,863 9,706,636 18,368,248
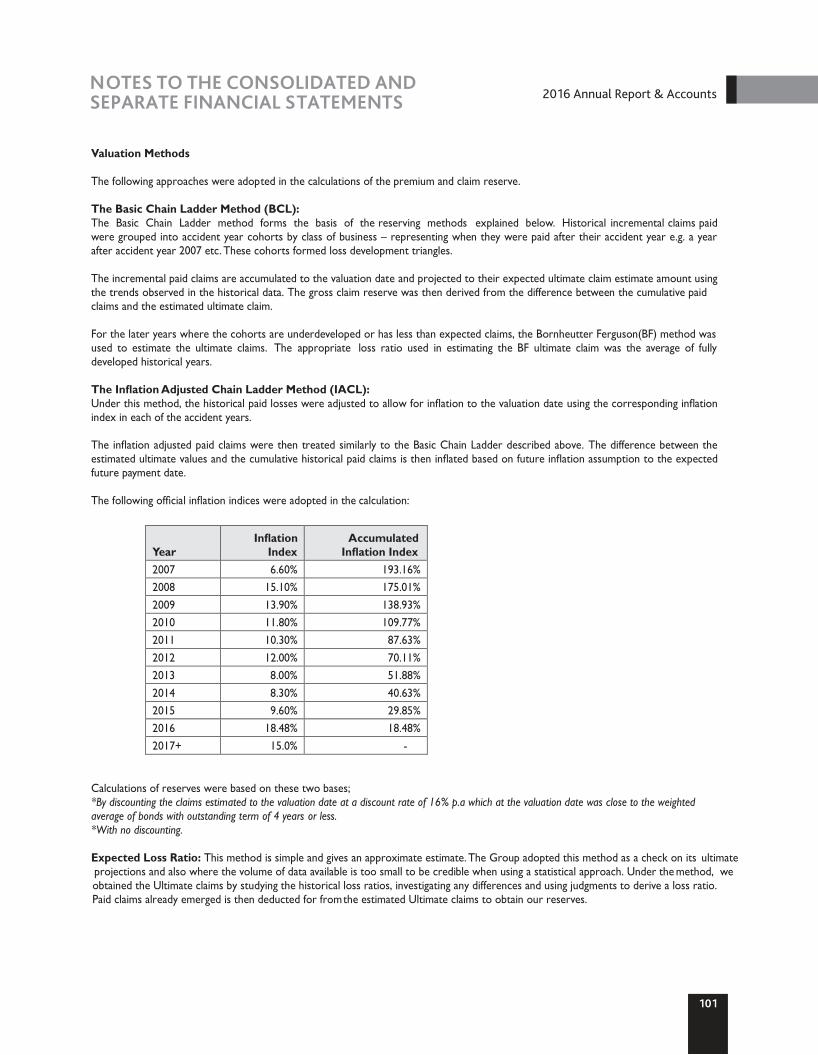
Valuation Methods The following approaches were adopted in the calculations of the premium and claim reserve. The Basic Chain Ladder Method (BCL): The Basic Chain Ladder method forms the basis of the reserving methods explained below. Historical incremental claims paid were grouped into accident year cohorts by class of business – representing when they were paid after their accident year e.g. a year after accident year 2007 etc. These cohorts formed loss development triangles. The incremental paid claims are accumulated to the valuation date and projected to their expected ultimate claim estimate amount using the trends observed in the historical data. The gross claim reserve was then derived from the difference between the cumulative paidclaims and the estimated ultimate claim. For the later years where the cohorts are underdeveloped or has less than expected claims, the Bornheutter Ferguson(BF) method was used to estimate the ultimate claims. The appropriate loss ratio used in estimating the BF ultimate claim was the average of fully developed historical years. The Inflation Adjusted Chain Ladder Method (IACL): Under this method, the historical paid losses were adjusted to allow for inflation to the valuation date using the corresponding inflation index in each of the accident years. The inflation adjusted paid claims were then treated similarly to the Basic Chain Ladder described above. The difference between the estimated ultimate values and the cumulative historical paid claims is then inflated based on future inflation assumption to the expected future payment date. The following official inflation indices were adopted in the calculation:
Year Inflation
Index Accumulated
Inflation Index 2007 6.60% 193.16%
2008 15.10% 175.01% 2009 13.90% 138.93% 2010 11.80% 109.77% 2011 10.30% 87.63% 2012 12.00% 70.11% 2013 8.00% 51.88% 2014 8.30% 40.63% 2015 9.60% 29.85% 2016 18.48% 18.48% 2017+ 15.0% -
Calculations of reserves were based on these two bases; *By discounting the claims estimated to the valuation date at a discount rate of 16% p.a which at the valuation date was close to the weighted average of bonds with outstanding term of 4 years or less. *With no discounting. Expected Loss Ratio: This method is simple and gives an approximate estimate. The Group adopted this method as a check on its ultimate projections and also where the volume of data available is too small to be credible when using a statistical approach. Under the method, weobtained the Ultimate claims by studying the historical loss ratios, investigating any differences and using judgm ents to derive a loss ratio. Paid claims already emerged is then deducted for from the estimated Ultimate claims to obtain our reserves.
NOTES TO THE CONSOLIDATED AND SEPARATE FINANCIAL STATEMENTS
101
2016 Annual Report & Accounts
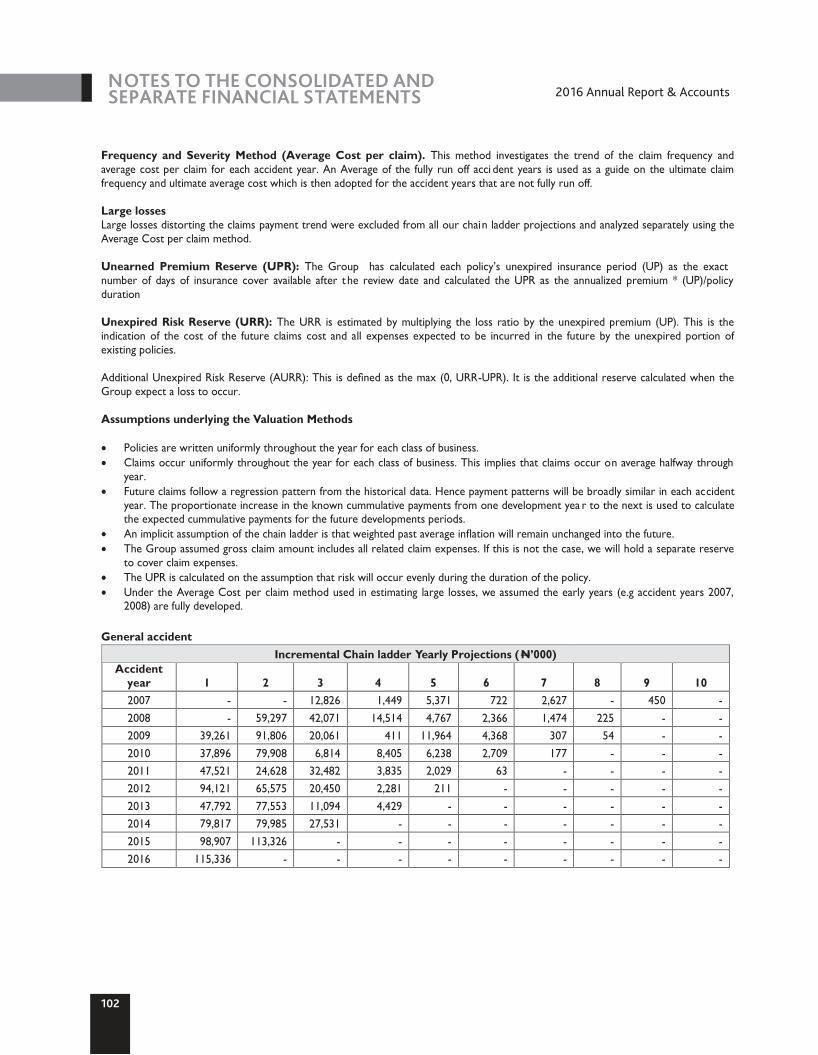
Frequency and Severity Method (Average Cost per claim). This method investigates the trend of the claim frequency and average cost per claim for each accident year. An Average of the fully run off acci dent years is used as a guide on the ultimate claim frequency and ultimate average cost which is then adopted for the accident years that are not fully run off.
Large losses Large losses distorting the claims payment trend were excluded from all our chain ladder projections and analyzed separately using the Average Cost per claim method.
Unearned Premium Reserve (UPR): The Group has calculated each policy’s unexpired insurance period (UP) as the exact number of days of insurance cover available after t he review date and calculated the UPR as the annualized premium * (UP)/policy duration
Unexpired Risk Reserve (URR): The URR is estimated by multiplying the loss ratio by the unexpired premium (UP). This is the indication of the cost of the future claims cost and all expenses expected to be incurred in the future by the unexpired portion of existing policies.
Additional Unexpired Risk Reserve (AURR): This is defined as the max (0, URR-UPR). It is the additional reserve calculated when the Group expect a loss to occur.
Assumptions underlying the Valuation Methods
· Policies are written uniformly throughout the year for each class of business. · Claims occur uniformly throughout the year for each class of business. This implies that claims occur on average halfway through
year. · Future claims follow a regression pattern from the historical data. Hence payment patterns will be broadly similar in each accident
year. The proportionate increase in the known cummulative payments from one development yea r to the next is used to calculate the expected cummulative payments for the future developments periods.
· An implicit assumption of the chain ladder is that weighted past average inflation will remain unchanged into the future. · The Group assumed gross claim amount includes all related claim expenses. If this is not the case, we will hold a separate reserve
to cover claim expenses. · The UPR is calculated on the assumption that risk will occur evenly during the duration of the policy. · Under the Average Cost per claim method used in estimating large losses, we assumed the early years (e.g accident years 2007,
2008) are fully developed.
General accident -
Accident year 1 2 3 4 5 6 7 8 9 10 2007 - - 12,826 1,449 5,371 722 2,627 - 450 - 2008 - 59,297 42,071 14,514 4,767 2,366 1,474 225 - - 2009 39,261 91,806 20,061 411 11,964 4,368 307 54 - - 2010 37,896 79,908 6,814 8,405 6,238 2,709 177 - - - 2011 47,521 24,628 32,482 3,835 2,029 63 - - - - 2012 94,121 65,575 20,450 2,281 211 - - - - - 2013 47,792 77,553 11,094 4,429 - - - - - - 2014 79,817 79,985 27,531 - - - - - - - 2015 98,907 113,326 - - - - - - - - 2016 115,336 - - - - - - - - -
Yearly Projections (Incremental Chain ladder N’000)
NOTES TO THE CONSOLIDATED AND SEPARATE FINANCIAL STATEMENTS
102
2016 Annual Report & Accounts

FIRE
Accident year 1 2 3 4 5 6 7 8 9 9 2007 - - 42,252 100 40 - 15 - - - 2008 - 52,975 12,453 4,090 389 30 - - - - 2009 28,361 65,149 7,614 793 233 - - - - - 2010 72,225 48,575 160 3,079 193 - - - - - 2011 29,065 11,508 9,535 2,264 8,517 - - - - - 2012 82,973 46,408 17,218 - - - - - - - 2013 53,756 52,428 16,327 21 - - - - - - 2014 52,281 35,936 983 - - - - - - - 2015
116,209
83,035
2016
104,258
-
-
-
-
-
-
-
-
-
Marine
Accident year
1
2
3
4
5
6
7
8
9
10 2007
-
-
5,373
1,762
2,335
-
-
-
-
2008
-
23,113
2,331
442
-
-
-
-
-
2009
5,037
14,674
7,744
10,845
2,851
-
-
-
-
2010
14,155
20,768
4,561
6,072
656
-
-
-
-
2011
12,661
6,127
4,977
23,135
267
-
-
-
-
2012
30,116
24,416
4,680
664
-
-
-
-
-
2013
29,124
27,388
2,331
-
-
-
-
-
-
2014
23,424
16,260
204
-
-
-
-
-
-
2015
21,674
17,110
2016
33,990
-
-
-
-
-
-
-
-
Motor
Accident
year
1
2
3
4
5
6
7
8
9
10
2007
-
-
-
3,308
730
1,230
135
-
-
2008
-
-
8,646
1,774
2,460
-
-
-
-
2009
-
140,122
33,076
5,864
-
-
-
-
-
2010
260,284
149,182
11,352
1,781
-
427
-
-
-
2011
226,774
62,179
7,647
428
182
-
-
-
-
2012
244,881
126,118
843
1,145
-
-
-
-
-
2013
270,060
102,542
5,360
-
-
-
-
-
-
2014
315,495
81,431
643
-
-
-
-
-
-
2015
360,538
237,905
2016
701,423
-
-
-
-
-
-
-
-
Incremental Chain ladder-Yearl y Projections (N’000)
Incremental Chain ladder-Yearly Projections (N’000)
Incremental Chain ladder-Yearly Projections (N’000)
NOTES TO THE CONSOLIDATED AND SEPARATE FINANCIAL STATEMENTS
103
2016 Annual Report & Accounts

NOTES TO THE CONSOLIDATED AND SEPARATE FINANCIAL STATEMENTS
104
2016 Annual Report & Accounts
Oil & Gas The table shown below is the output of the Expected Loss Ratio Method used in estimating Gross Claim Reserve for Oil & Gas.
2008 - 3,488 - 3,488 0% 0% - - 2009 - 13,732 - 13,732 0% 0% - - 2010 683,158 5,643 - 5,643 1% 1% 5,643 - 2011 683,158 245,940 215,301 461,241 68% 68% 461,241 215,301 2012 683,158 260,696 263,046 523,742 77% 77% 523,742 263,046 2013 686,106 62,200 66,204 128,405 19% 19% 128,405 66,204 2014 749,765 10,704 240,663 251,367 34% 34% 251,367 240,663 2015 1,040,920 41 85,841 85,882 8% 13% 137,928 137,887 2016 1,192,374 1,923 33,500 35,423 3% 13% 157,997 156,074 Total
904,555
1,079,175
Discounted 920,973
20 Trade payables Group Company
2016 2015
2016 2015
N'000 N'000
N'000 N'000
Reinsurance premium payable
344,221 221,488
344,221 220,442
Premium deposit received
112,300 162,529
108,427 110,780
456,521 384,017
452,649 331,222
Within one year
304,299 228,333
310,871 198,733
More than one year
152,222 155,684
141,778 132,489
456,521 384,017
452,649 331,222
21 Other payables
Accrued expenses (see note (i) below)
411,873 526,916
353,485 377,928
Payable to staff (see note (ii) below)
106,460 92,354
106,460 92,354
National Housing Funds
2,747 4,918
2,668 4,814
PAYE
21,058 15,028
20,837 14,713
Withholding Tax
28,537 19,200
28,537 19,200
ECOWAS BROWN CARD
- 8,798
- 8,798
Honeywell Oil and Gas ltd.
37,855 37,855
37,855 37,855
SO&U SAACHI
4,967 4,967
4,967 4,967
Sundry creditors (see note (iii) below)
193,958 116,611
79,822 56,129
807,455 826,647 634,631 616,758
(i) Accrued expenses is made up of provision for NAICOM fee, professional fee, valuation fees and rent related expenses.
(ii) Payable to staff is provision for 2016 performance pay to staff. (iii) Sundry creditors includes outstanding payments in respect of asset verification and tagging, head office renovation,
land registration statutory fees and other creditors.
Accident year
Gross Earned
Premium (N' 000)
Claims Paid till
date (N' 000)
Total O/s as at 31
Dec 2016 (N'000)
Current Incurred (N'000)
Current Loss
Ratio Ultimate
Loss Ratio
Ultimate Losses
(N'000)
Outstanding Claim
Reserves (N'000)
Expected Loss Ratio Method Table Oil and Gas claims–

NOTES TO THE CONSOLIDATED AND SEPARATE FINANCIAL STATEMENTS
105
2016 Annual Report & Accounts
22 Income tax liabilities Group Company2016 2015 2016 2015N'000 N'000 N'000 N'000
a) Per Statement of Profit or Loss and Other Comprehensive Income:
-
Recognised in profit or loss:
Income tax based on the taxable profit/loss for the year
80,966
211,242
54,456
210,569
Education tax
3,167
3,805
-
3,805
Back duty assessment
152,047
-
150,065
-
Information technology development levy (NITDA)
2,178
1,039
-
1,039
Current tax charge/(Income) for the year
238,358
216,086
204,521
215,413
Deferred tax charged recognised in profit or loss
232,205
(3,786)
169,053
(12,039)
Income tax expense
470,563
212,300
373,574
203,374
b) Current Tax Liabilities/(Assets) as per Statement of Financial Position:
At 1 January
340,539
88,471
246,725
87,199
Charge for the year
238,358
216,086
204,521
215,413
Payment during the year
(164,499)
(56,608)
(149,155)
(55,887)
Arising from acquisition
-
92,590
-
-
At 31 December
414,398
340,539
302,091
246,725
The charge for income tax in these financial statements is based on the provisions of the Companies Income Tax Act, CAP C21 LFN 2004 as amended and Education Tax Act, CAP E4 LFN 2004.
22.1 Reconciliation of effective to statutory tax rate was presented in note 34a.
22 b Deferred Taxation
Deferred income tax assets and liabilities are offset when there is a legally enforceable right to offset current tax assets against current tax liabilities and when the deferred income taxes assets and liabilities relate to income taxes levied by the same taxation authority on either the taxable entity or different taxable entities where there is an intention to settle the balances on a net basis. The offset amounts are as follows:
Group
Company
2016
2015
2016
2015
N'000
N'000
N'000
N'000Deferred tax assets:
Deferred tax asset to be recovered after more than 12 months
-
-
-
-
Deferred tax asset to be recovered within 12 months
(144,335)
242,583
18,790
187,843Deferred tax on asset held for sales
-
-
-Arising from acquisition
-
- (144,335)
242,583
18,790
187,843
The net movement on the deferred income tax account is as follows:
At 1 January
242,583
238,797
187,843
175,804
Deferred tax charged recognised in profit or loss
(232,205)
3,786
(169,053)
12,039
Deferred tax charged recognised in other comprehensive income :
Property and equipmment
(18,922)
-
- -
Unrealised exchange gain (135,791) - - -
At 31 December (144,335) 242,583 18,790 187,843 The charge for income tax in these financial statements is based on the provision of the Companies Income Tax Act CAP C21 LFN 2004 as amended and Education Tax Act. CAP E4 LFN 2004.

NOTES TO THE CONSOLIDATED AND SEPARATE FINANCIAL STATEMENTS
106
2016 Annual Report & Accounts
23 Employees' Retirement Obligations Group Company
2016 2015 2016 2015
N'000 N'000 N'000 N'000
Pensions (outstanding liability) 8,102 7,523 7,750 7,523
Pension:
At 1 January 7,523 11,565 7,523 8,145
Pension Expense for the reporting period
104,722
89,149
101,913
89,149
Payment made during the year
(104,143)
(93,191)
(101,686)
(89,771)
-
-
Net Employees' Retirement Obligations
8,102
7,523
7,750
7,523
The Company operates defined contribution pension plan based on the New Pension Act 2014. All pension contributions are
remitted to the relevant registered PFAs.
24
Share Capital and Share Premium
Issued capital comprises:
2016
2015
2016
2015
N'000
N'000
N'000
N'000
14,729,507,615 fully paid ordinary shares of 50k each
7,364,754
7,364,754
7,364,754
7,364,754
Movement in share capital
At 1 January
7,364,754
4,410,005
7,364,754
4,410,005
Addition during the year(5,909,497,615 @50k/1)
-
2,954,749
-
2,954,749
At 31 December
7,364,754
7,364,754
7,364,754
7,364,754
The total number of issued and fully paid ordinary shares as at year ended 31 December 2016 was 14,729,507,615 with a par value of 50k per share.
The additions to the fully paid ordinary shares in the year 2015 represents the nominal value of the 5,909,497,615 ordinary shares issued in respect of CAPE III; being the consideration paid for the acquisition of Fin Insurance Company Limited. See note 13 and note 30f for additional disclosures on the acquisition of Fin Insurance Company Limited.
24a
Share premium
At 31 December
1,947,166
1,947,166
1,947,166
1,947,166
Share premium comprises additional paid up capital in excess of the par value. This reserve is ordinarily not available for distribution
24b
Treasury shares
At 31 December
48,175
48,175
48,175
48,175
Treasury shares are own equity instruments which are deducted from equity and no dividends are allocated to them.
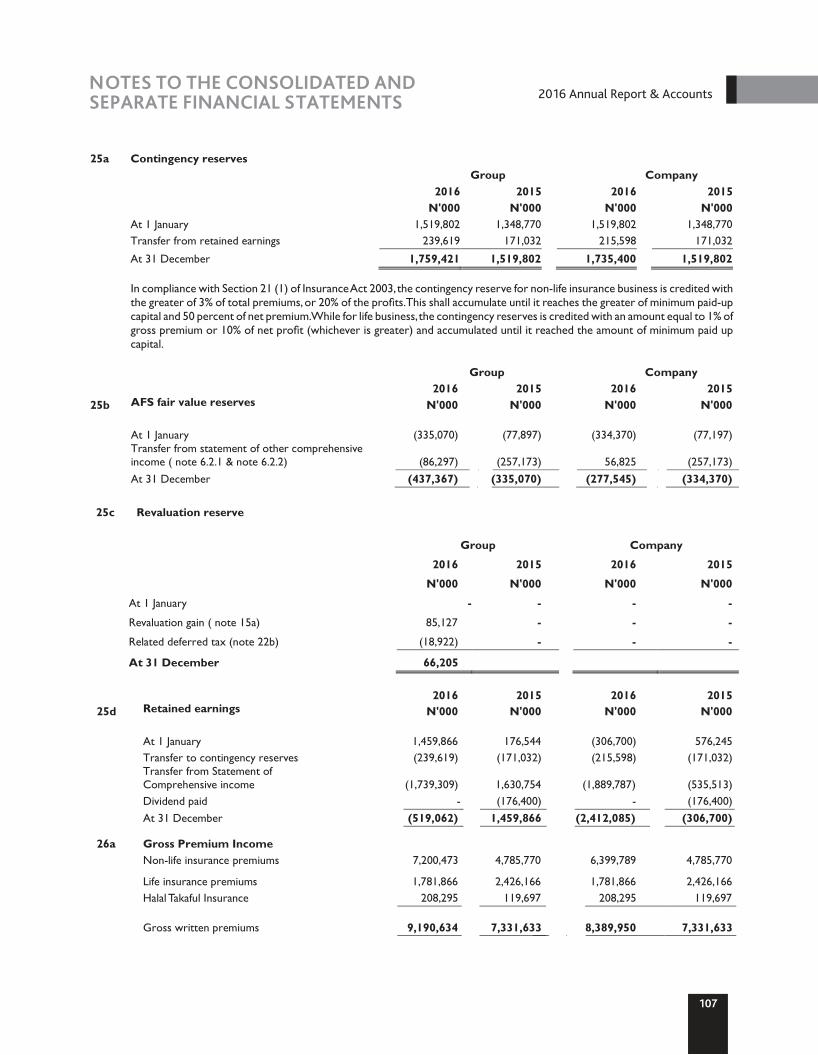
2016 2015
2016 2015 2016 2015
2016 2015
26a
Gross Premium Income
Non-life insurance premiums
4,785,770
6,399,789
4,785,770
Life insurance premiums
2,426,166
1,781,866
2,426,166
Halal Takaful Insurance
208,295
7,200,473
1,781,866
119,697 208,295
119,697
Gross written premiums
9,190,634
7,331,633
8,389,950
7,331,633
25d
Retained earnings
N'000
N'000
N'000
N'000
At 1 January
1,459,866
176,544
(306,700)
576,245
Transfer to contingency reserves
(239,619)
(171,032)
(215,598)
(171,032)
Transfer from Statement of
Comprehensive income
(1,739,309)
1,630,754
(1,889,787)
(535,513)
Dividend paid
-
(176,400)
-
(176,400)
At 31 December
(519,062)
1,459,866
(2,412,085)
(306,700)
25a Contingency reserves
Group Company N'000 N'000 N'000 N'000 At 1 January 1,519,802 1,348,770 1,519,802 1,348,770
Transfer from retained earnings 239,619 171,032 215,598 171,032
At 31 December 1,759,421 1,519,802 1,735,400 1,519,802
Group Company
25b
AFS fair value reserves N'000
N'000
N'000
N'000
At 1 January (335,070)
(77,897)
(334,370)
(77,197)
Transfer from statement of other comprehensive income ( note 6.2.1 & note 6.2.2)
(86,297)
(257,173)
56,825
(257,173)
At 31 December
(437,367) (335,070)
(277,545)
(334,370)
25c
Revaluation reserve
Group
Company
2016
2015
2016
2015
N'000
N'000
N'000
N'000
At 1 January
-
-
-
-
Revaluation gain ( note 15a)
85,127
-
-
-
Related deferred tax (note 22b)
(18,922)
-
-
-
At 31 December
66,205
2016
2015
2016
2015
NOTES TO THE CONSOLIDATED AND SEPARATE FINANCIAL STATEMENTS
107
2016 Annual Report & Accounts
In compliance with Section 21 (1) of Insurance Act 2003, the contingency reserve for non-life insurance business is credited with the greater of 3% of total premiums, or 20% of the profits. This shall accumulate until it reaches the greater of minimum paid-up capital and 50 percent of net premium. While for life business, the contingency reserves is credited with an amount equal to 1% of gross premium or 10% of net profit (whichever is greater) and accumulated until it reached the amount of minimum paid up capital.
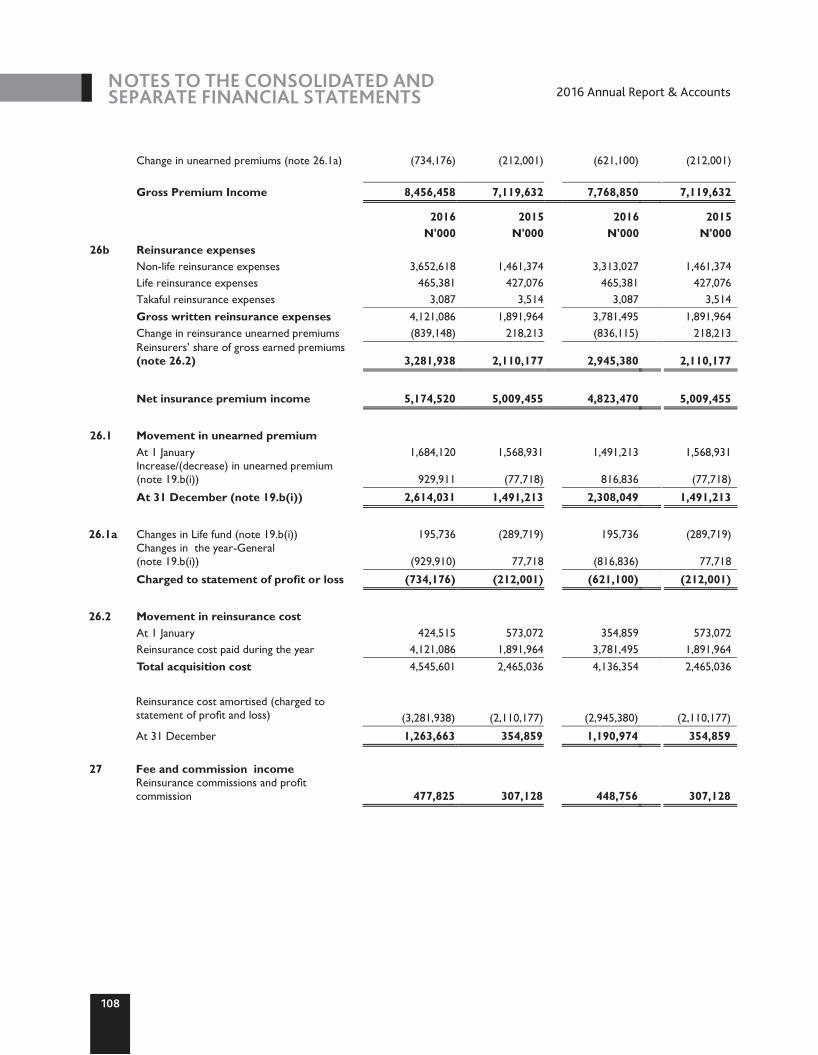
Change in unearned premiums (note 26.1a) (734,176) (212,001) (621,100) (212,001)
Gross Premium Income 8,456,458 7,119,632 7,768,850 7,119,632
Reinsurance cost amortised (charged to
statement of profit and loss)
(3,281,938)
(2,110,177)
(2,945,380)
(2,110,177)
At 31 December
1,263,663
354,859
1,190,974
354,859
27
Fee and commission income
Reinsurance commissions and profit commission
477,825
307,128
448,756
307,128
2016 2015 2016 2015
N'000 N'000 N'000 N'000 26b Reinsurance expenses
Non-life reinsurance expenses 3,652,618 1,461,374 3,313,027 1,461,374
Life reinsurance expenses 465,381 427,076 465,381 427,076
Takaful reinsurance expenses 3,087 3,514 3,087 3,514
Gross written reinsurance expenses 4,121,086 1,891,964 3,781,495 1,891,964
Change in reinsurance unearned premiums (839,148) 218,213 (836,115) 218,213
Reinsurers’ share of gross earned premiums (note 26.2) 3,281,938 2,110,177 2,945,380 2,110,177
Net insurance premium income 5,174,520 5,009,455 4,823,470 5,009,455
26.1
Movement in unearned premium
At 1 January
1,684,120
1,568,931
1,491,213
1,568,931
Increase/(decrease) in unearned premium (note 19.b(i))
929,911
(77,718)
816,836
(77,718)
At 31 December (note 19.b(i))
2,614,031
1,491,213
2,308,049
1,491,213
26.1a
Changes in Life fund (note 19.b(i))
195,736
(289,719)
195,736
(289,719)
Changes in the year-General (note 19.b(i))
(929,910)
77,718
(816,836)
77,718
Charged to statement of profit or loss
(734,176)
(212,001)
(621,100)
(212,001)
26.2
Movement in reinsurance cost
At 1 January
424,515
573,072
354,859
573,072
Reinsurance cost paid during the year
4,121,086
1,891,964
3,781,495
1,891,964
Total acquisition cost
4,545,601
2,465,036
4,136,354
2,465,036
NOTES TO THE CONSOLIDATED AND SEPARATE FINANCIAL STATEMENTS
108
2016 Annual Report & Accounts
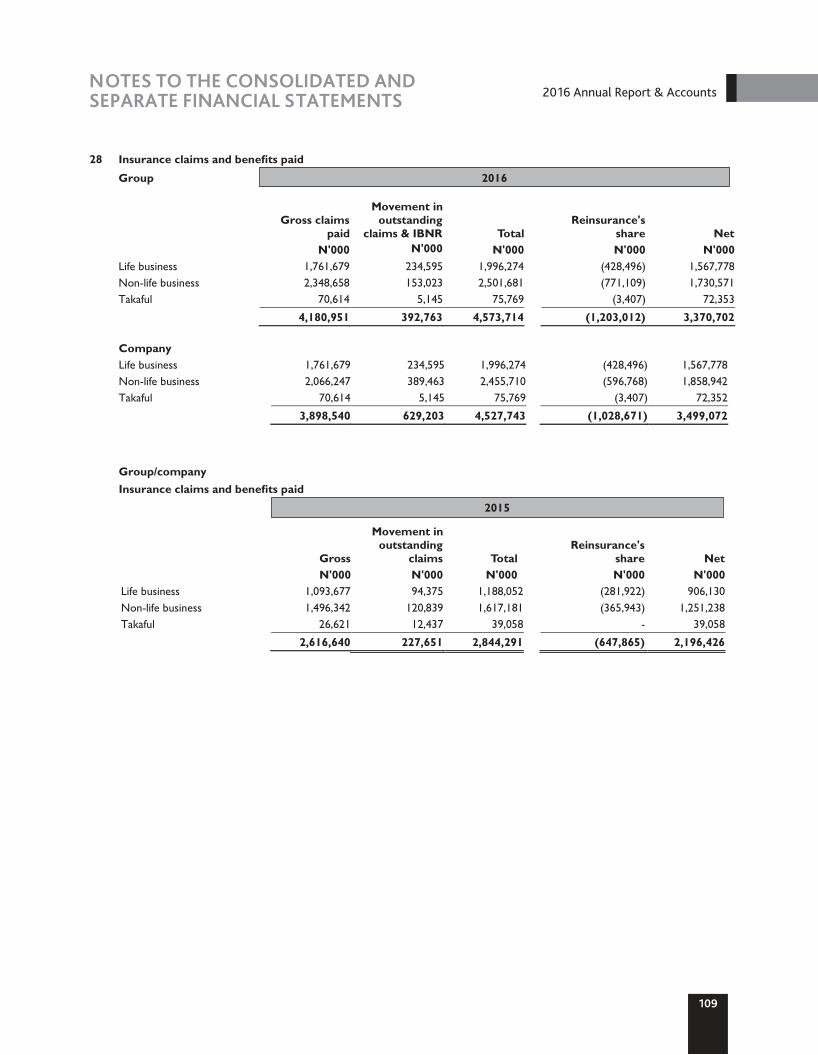
NOTES TO THE CONSOLIDATED AND SEPARATE FINANCIAL STATEMENTS
109
2016 Annual Report & Accounts
28 Insurance claims and benefits paid
Group 2016
Gross claims
paid
Movement in outstanding
claims & IBNR Total Reinsurance's
share Net N'000 N'000 N'000 N'000 N'000 Life business 1,761,679 234,595 1,996,274 (428,496) 1,567,778
Non-life business 2,348,658 153,023 2,501,681 (771,109) 1,730,571 Takaful 70,614 5,145 75,769 (3,407) 72,353
4,180,951 392,763 4,573,714 (1,203,012) 3,370,702
Company Life business 1,761,679 234,595 1,996,274 (428,496) 1,567,778
Non-life business
2,066,247
389,463
2,455,710
(596,768)
1,858,942
Takaful
70,614
5,145
75,769
(3,407)
72,352
3,898,540
629,203
4,527,743
(1,028,671)
3,499,072
Group/company
Insurance claims and benefits paid
2015
Gross
Movement in outstanding
claims
Total
Reinsurance's
share
Net
N'000
N'000
N'000
N'000
N'000
Life business
1,093,677
94,375
1,188,052
(281,922)
906,130
Non-life business
1,496,342
120,839
1,617,181
(365,943)
1,251,238
Takaful
26,621
12,437
39,058
-
39,058
2,616,640
227,651
2,844,291
(647,865)
2,196,426

110
NOTES TO THE CONSOLIDATED AND SEPARATE FINANCIAL STATEMENTS
GROUP
28.1 Claim recoverable from Reinsurance 2016 2015
General business
N'000
LifeN'000
TakafulN'000
TotalN'000
General business
N'000
LifeN'000
TotalN'000
Receipt from reinsurance on claims paid
593,236
564,395
3,407
1,161,038
514,481
118,828
633,309
Changes in reinsurance share of outstanding claims (note 28.2)
61,531
(20,580)
-
40,951
(11,114)
136,428
125,314
Changes in reinsurance share of IBNR (note 28.2)
116,342
(19,256)
-
97,086
(137,424)
27,922
(109,502)
Changes in reinsurance share of claims paid receivable (note 28.2)
-
(96,063)
-
(96,063)
-
(1,256)
(1,256)
Claim recoverable from reinsurance
771,109
428,496
3,407
1,203,012
365,943
281,922
647,865
COMPANY
28.1
Claim recoverable from Reinsurance
2016 2015
busi
General business
N'000
LifeN'000
TakafulN'000
TotalN'000
General ness
N'000
LifeN'000
TotalN'000
Receipt from reinsurance on claims paid
569,795
564,395
3,407
1,137,597
514,481
118,828
633,309
Changes in reinsurance share of outstanding claims (note 28.2)
(89,369)
(20,580)
-
(109,949)
(11,114)
136,428
125,314
Changes in reinsurance share of IBNR (note 28.2)
116,342
(19,256)
-
97,086
(137,424)
27,922
(109,502)
Changes in reinsurance share of claims paid receivable (note 28.2)
-
(96,063)
-
(96,063)
-
(1,256)
(1,256)
Claim recoverable from reinsurance
596,768
428,496
3,407
1,028,671
365,943
281,922
647,865
Group
2016 2015
28.2
Changes in components of reinsurance assets are as follows :
Closing balance
Opening balance
N'000
N'000
Changes N'000
Opening balance
N'000
Closing balance
N'000
Changes N'000
Reinsurance share of outstanding claims -General (note 9)
614,384
675,915
61,531
581,688
570,574
(11,114)
Reinsurance share of outstanding claims -Life (note 9)
250,351
229,771
(20,580)
113,923
250,351
136,428
Reinsurance share of IBNR -General (note 9)
25,070
141,412
116,342
162,494
25,070
(137,424)
Reinsurance share of IBNR -Life (note 9)
200,542
181,286
(19,256)
172,620
200,542
27,922
Reinsurance share of claims paid (note 9)
431,898
335,835
(96,063)
433,154
431,898
(1,256)
1,522,245
1,564,219
41,974
1,463,879
1,478,435
14,556
Prepaid Unexpired Risk (UPR) (note 9)
424,515
1,263,662
839,147
573,072
424,515
(148,557)

Company 2016
2015
28.2 Changes in components of reinsurance assets are as follows : Opening
balance Closing
balance Changes
Opening balance
Closing balance Changes
N'000 N'000 N'000
N'000 N'000 N'000
Reinsurance share of outstanding claims -General (note 9) 570,574 481,205 89,369
581,688 570,574 (11,114)
Reinsurance share of outstanding claims -Life (note 9) 250,351 229,771 20,580
113,923 250,351 136,428
Reinsurance share of IBNR -General (note 9) 25,070 141,412 (116,342)
162,494 25,070 (137,424)
Reinsurance share of IBNR -Life (note 9) 200,542 181,286 19,256
172,620 200,542 27,922
Reinsurance share of claims paid (note 9) 431,898 335,835 96,063
433,154 431,898 (1,256)
1,478,435 1,369,509 108,926
1,463,879 1,478,435 14,556
Prepaid Unexpired Risk (UPR) 354,858 1,190,973 836,115 573,072 354,858 (218,214)
111NOTES TO THE CONSOLIDATED AND
SEPARATE FINANCIAL STATEMENTS
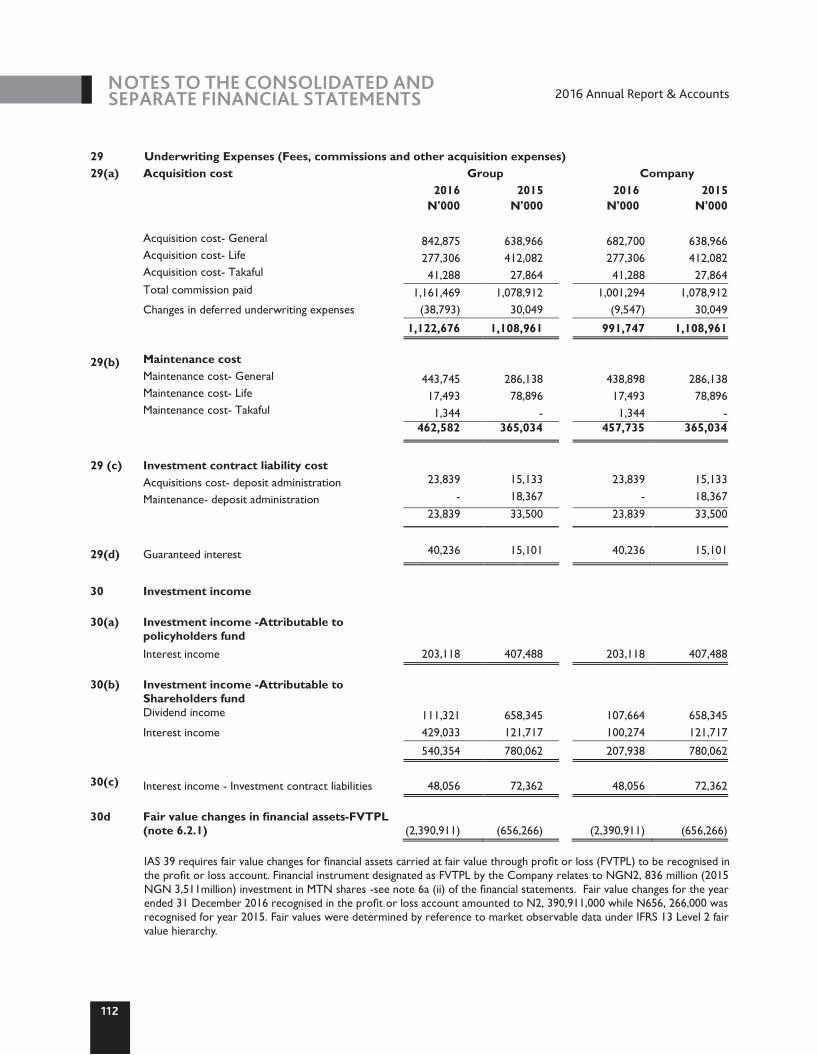
NOTES TO THE CONSOLIDATED AND SEPARATE FINANCIAL STATEMENTS
112
2016 Annual Report & Accounts
29 Underwriting Expenses (Fees, commissions and other acquisition expenses) 29(a) Acquisition cost Group Company
2016N'000
2015N'000
2016N'000
2015N'000
Acquisition cost- General 842,875 638,966 682,700 638,966 Acquisition cost- Life 277,306 412,082 277,306 412,082 Acquisition cost- Takaful 41,288 27,864 41,288 27,864 Total commission paid 1,161,469 1,078,912 1,001,294 1,078,912 Changes in deferred underwriting expenses (38,793) 30,049 (9,547) 30,049
1,122,676 1,108,961 991,747 1,108,961 29(b) Maintenance cost Maintenance cost- General 443,745 286,138 438,898 286,138 Maintenance cost- Life 17,493 78,896 17,493 78,896 Maintenance cost- Takaful 1,344 - 1,344 -
462,582 365,034 457,735 365,034
29 (c) Investment contract liability cost
Acquisitions cost- deposit administration 23,839 15,133 23,839 15,133
Maintenance- deposit administration - 18,367 - 18,367
23,839 33,500 23,839 33,500
29(d) Guaranteed interest 40,236 15,101 40,236 15,101
30 Investment income
30(a) Investment income -Attributable to
policyholders fund Interest income 203,118 407,488 203,118 407,488 30(b) Investment income -Attributable to
Shareholders fund Dividend income 111,321 658,345 107,664 658,345 Interest income 429,033 121,717 100,274 121,717
540,354 780,062 207,938 780,062 30(c) Interest income - Investment contract liabilities 48,056 72,362 48,056 72,362 30d Fair value changes in financial assets-FVTPL
(note 6.2.1) (2,390,911) (656,266) (2,390,911) (656,266)
IAS 39 requires fair value changes for financial assets carried at fair value through profit or loss (FVTPL) to be recognised in the profit or loss account. Financial instrument designated as FVTPL by the Company relates to NGN2, 836 million (2015 NGN 3,511million) investment in MTN shares -see note 6a (ii) of the financial statements. Fair value changes for the year ended 31 December 2016 recognised in the profit or loss account amounted to N2, 390,911,000 while N656, 266,000 was recognised for year 2015. Fair values were determined by reference to market observable data under IFRS 13 Level 2 fair value hierarchy.
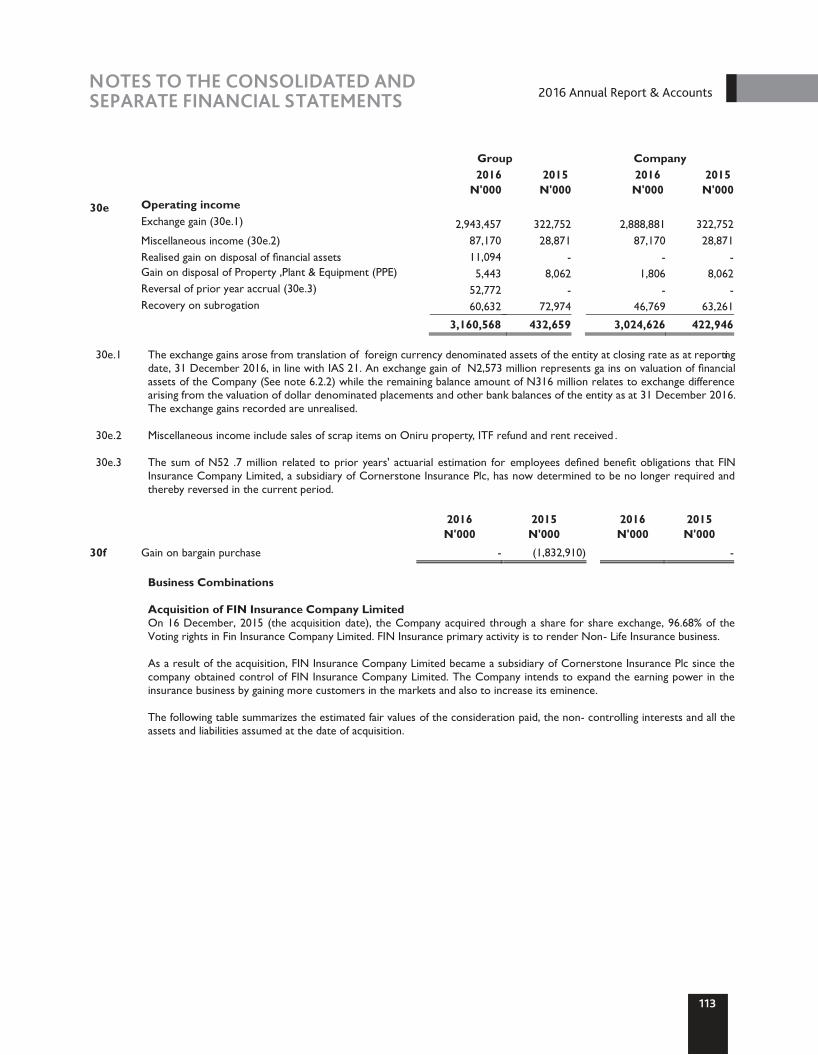
NOTES TO THE CONSOLIDATED AND SEPARATE FINANCIAL STATEMENTS
113
2016 Annual Report & Accounts
Group Company
2016N'000
2015N'000
2016N'000
2015N'000
30e Operating income Exchange gain (30e.1) 2,943,457 322,752 2,888,881 322,752 Miscellaneous income (30e.2) 87,170 28,871 87,170 28,871 Realised gain on disposal of financial assets 11,094 - - - Gain on disposal of Property ,Plant & Equipment (PPE) 5,443 8,062 1,806 8,062 Reversal of prior year accrual (30e.3) 52,772 - - - Recovery on subrogation 60,632 72,974 46,769 63,261
3,160,568 432,659 3,024,626 422,946 30e.1 The exchange gains arose from translation of foreign currency denominated assets of the entity at closing rate as at reporting
date, 31 December 2016, in line with IAS 21. An exchange gain of N2,573 million represents ga ins on valuation of financial assets of the Company (See note 6.2.2) while the remaining balance amount of N316 million relates to exchange difference arising from the valuation of dollar denominated placements and other bank balances of the entity as at 31 December 2016.The exchange gains recorded are unrealised.
30e.2
Miscellaneous income include sales of scrap items on Oniru property, ITF refund and rent received .
30e.3
The sum of N52 .7 million related to prior years' actuarial estimation for employees defined benefit obligations that FIN Insurance Company Limited, a subsidiary of Cornerstone Insurance Plc, has now determined to be no longer required and thereby reversed in the current period.
2016
2015
2016
2015
N'000
N'000
N'000
N'000 30f
Gain on bargain purchase
-
(1,832,910)
-
Business Combinations
Acquisition of FIN Insurance Company Limited
On 16 December, 2015 (the acquisition date), the Company acquired through a share for share exchange, 96.68% of the Voting rights in Fin Insurance Company Limited. FIN Insurance primary activity is to render Non-
Life Insurance business.
As a result of the acquisition, FIN Insurance Company Limited became a subsidiary of Cornerstone Insurance Plc since the company obtained control of FIN Insurance Company Limited. The Company intends to expand the earning power in the insurance business by gaining more customers in the markets and also to increase its eminence.
The following table summarizes the estimated fair values of the consideration paid, the non-
controlling interests and all the
assets and liabilities assumed at the date of acquisition.
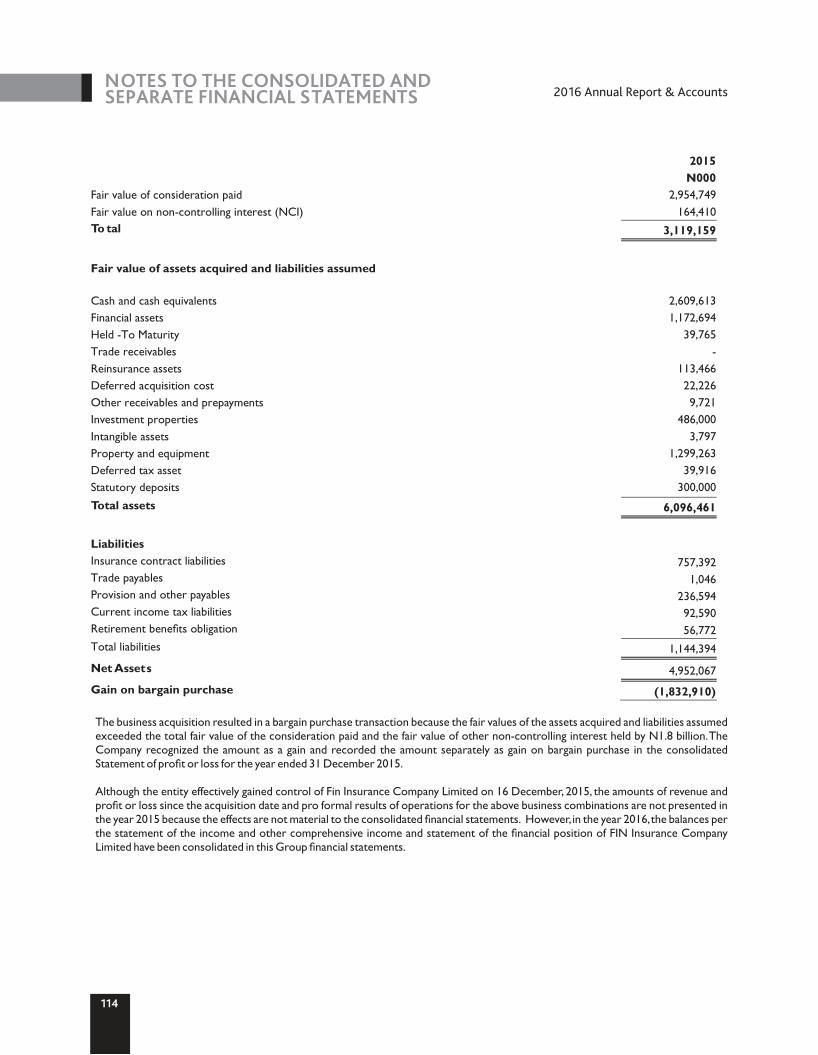
NOTES TO THE CONSOLIDATED AND SEPARATE FINANCIAL STATEMENTS
114
2016 Annual Report & Accounts
2015 N000 Fair value of consideration paid 2,954,749 Fair value on non-controlling interest (NCI) 164,410 To tal 3,119,159
Fair value of assets acquired and liabilities assumed Cash and cash equivalents 2,609,613 Financial assets 1,172,694 Held -To Maturity 39,765 Trade receivables - Reinsurance assets 113,466 Deferred acquisition cost 22,226 Other receivables and prepayments 9,721 Investment properties 486,000 Intangible assets 3,797 Property and equipment 1,299,263 Deferred tax asset 39,916 Statutory deposits 300,000
Total assets 6,096,461
Liabilities Insurance contract liabilities 757,392 Trade payables 1,046 Provision and other payables 236,594 Current income tax liabilities 92,590 Retirement benefits obligation 56,772 Total liabilities 1,144,394
Net Assets 4,952,067
Gain on bargain purchase (1,832,910)
The business acquisition resulted in a bargain purchase transaction because the fair values of the assets acquired and liabilities assumed exceeded the total fair value of the consideration paid and the fair value of other non-controlling interest held by N1.8 billion. The Company recognized the amount as a gain and recorded the amount separately as gain on bargain purchase in the consolidated Statement of profit or loss for the year ended 31 December 2015.
Although the entity effectively gained control of Fin Insurance Company Limited on 16 December, 2015, the amounts of revenue and profit or loss since the acquisition date and pro formal results of operations for the above business combinations are not presented in the year 2015 because the effects are not material to the consolidated financial statements. However, in the year 2016, the balances per the statement of the income and other comprehensive income and statement of the financial position of FIN Insurance Company Limited have been consolidated in this Group financial statements.
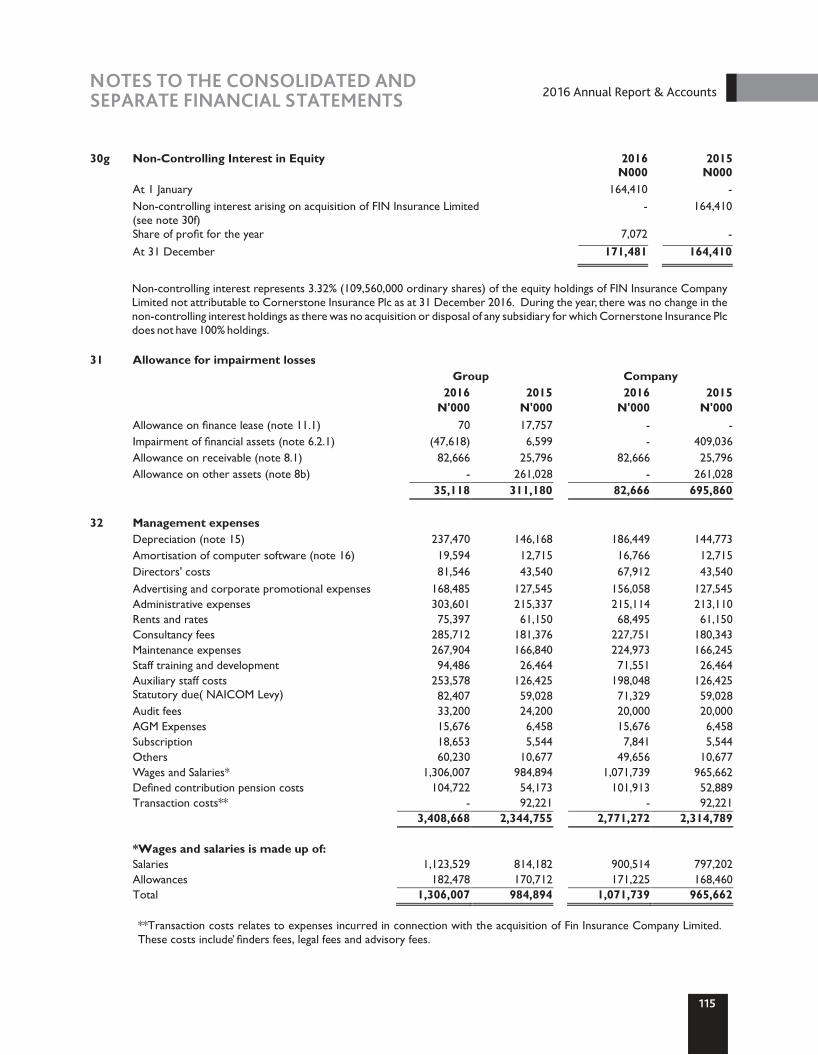
NOTES TO THE CONSOLIDATED AND SEPARATE FINANCIAL STATEMENTS
115
2016 Annual Report & Accounts
s fees, legal fees and advisory fees.
30g Non-Controlling Interest in Equity 2016 2015 N000 N000
At 1 January 164,410 -
Non- controlling interest arising on acquisition of FIN Insurance Limited (see note 30f)
- 164,410
Share of profit for the year 7,072 -
At 31 December 171,481 164,410
31 Allowance for impairment losses
Allowance on finance lease (note 11.1) Impairment of financial assets (note 6.2.1) Allowance on receivable (note 8.1) Allowance on other assets (note 8b)
32 Management expenses Depreciation (note 15) Amortisation of computer software (note 16) Directors' costs Advertising and corporate promotional expenses Administrative expenses Rents and rates Consultancy fees Maintenance expenses Staff training and development Auxiliary staff costs Statutory due( NAICOM Levy) Audit fees AGM Expenses Subscription Others Wages and Salaries* Defined contribution pension costs Transaction costs**
*Wages and salaries is made up of: Salaries Allowances Total
Group Company 2016 2015 2016 2015 N'000 N'000 N'000 N'000
70 17,757 - - (47,618) 6,599 - 409,036
82,666 25,796 82,666 25,796 - 261,028 - 261,028
35,118 311,180 82,666 695,860 237,470 146,168 186,449 144,773 19,594 12,715 16,766 12,715 81,546 43,540 67,912 43,540
168,485 127,545 156,058 127,545 303,601 215,337 215,114 213,110 75,397 61,150 68,495 61,150 285,712 181,376 227,751 180,343 267,904 166,840 224,973 166,245 94,486 26,464 71,551 26,464
253,578 126,425 198,048 126,425 82,407 59,028 71,329 59,028 33,200 24,200 20,000 20,000 15,676 6,458 15,676 6,458 18,653 5,544 7,841 5,544 60,230 10,677 49,656 10,677
1,306,007 984,894 1,071,739 965,662 104,722 54,173 101,913 52,889
- 92,221 - 92,221 3,408,668 2,344,755 2,771,272 2,314,789 1,123,529 814,182 900,514 797,202 182,478 170,712 171,225 168,460 1,306,007 984,894 1,071,739 965,662
**Transaction costs relates to expenses incurred in connection with the acquisition of Fin Insurance Company Limited. These costs include finder’
Non-controlling interest represents 3.32% (109,560,000 ordinary shares) of the equity holdings of FIN Insurance Company Limited not attributable to Cornerstone Insurance Plc as at 31 December 2016. During the year, there was no change in the non-controlling interest holdings as there was no acquisition or disposal of any subsidiary for which Cornerstone Insurance Plc does not have 100% holdings.
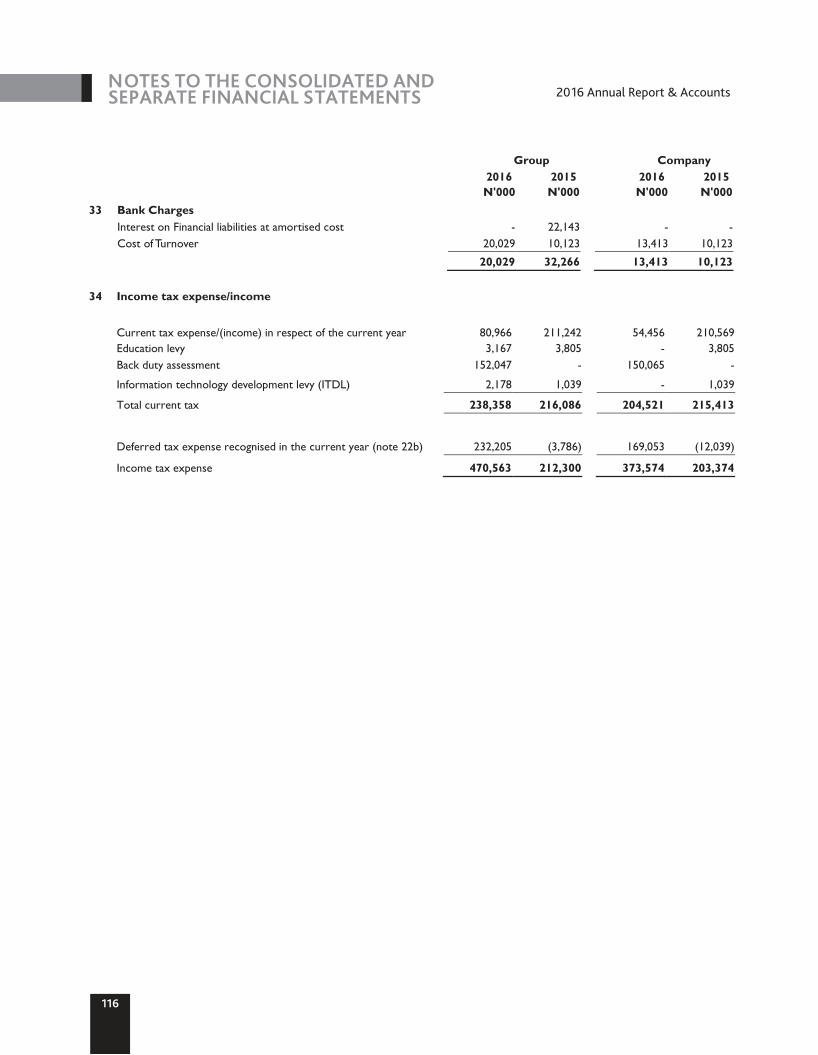
NOTES TO THE CONSOLIDATED AND SEPARATE FINANCIAL STATEMENTS
116
2016 Annual Report & Accounts
Group Company
2016N'000
2015N'000
2016N'000
2015N'000
33 Bank Charges Interest on Financial liabilities at amortised cost - 22,143 - -
Cost of Turnover 20,029 10,123 13,413 10,123
20,029 32,266 13,413 10,123
34 Income tax expense/income
Current tax expense/(income) in respect of the current year 80,966 211,242 54,456 210,569 Education levy 3,167 3,805 - 3,805 Back duty assessment 152,047 - 150,065 -
Information technology development levy (ITDL) 2,178 1,039 - 1,039
Total current tax 238,358 216,086 204,521 215,413
Deferred tax expense recognised in the current year (note 22b) 232,205 (3,786) 169,053 (12,039)
Income tax expense 470,563 212,300 373,574 203,374
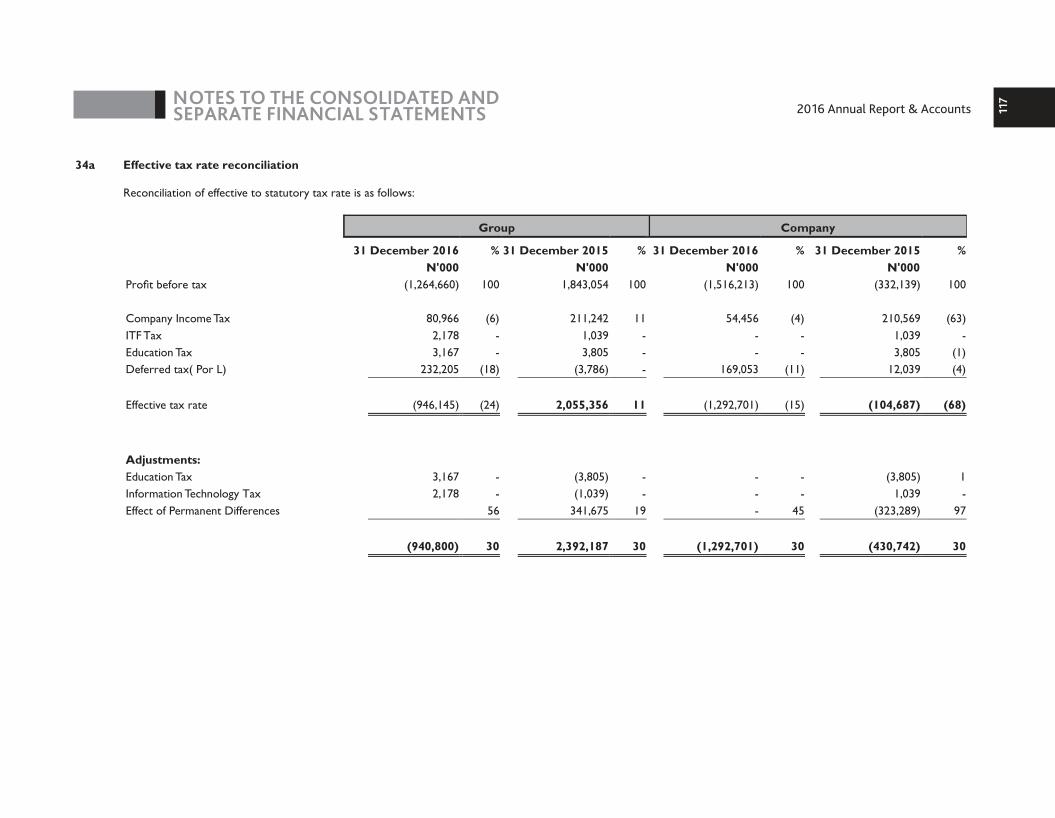
117NOTES TO THE CONSOLIDATED AND
SEPARATE FINANCIAL STATEMENTS
34a Effective tax rate reconciliation Reconciliation of effective to statutory tax rate is as follows: Group Company
31 December 2016 % 31 December 2015 % 31 December 2016 % 31 December 2015 %
N'000 N'000 N'000 N'000 Profit before tax (1,264,660) 100 1,843,054 100 (1,516,213) 100 (332,139) 100 Company Income Tax 80,966 (6) 211,242 11 54,456 (4) 210,569 (63) ITF Tax 2,178 - 1,039 - - - 1,039 - Education Tax 3,167 - 3,805 - - - 3,805 (1) Deferred tax( Por L) 232,205 (18) (3,786) - 169,053 (11) 12,039 (4) Effective tax rate (946,145) (24) 2,055,356 11 (1,292,701) (15) (104,687) (68)
Adjustments: Education Tax 3,167 - (3,805) - - - (3,805) 1
Information Technology Tax 2,178 - (1,039) - - - 1,039 - Effect of Permanent Differences 56 341,675 19 - 45 (323,289) 97
(940,800) 30 2,392,187 30 (1,292,701) 30 (430,742) 30
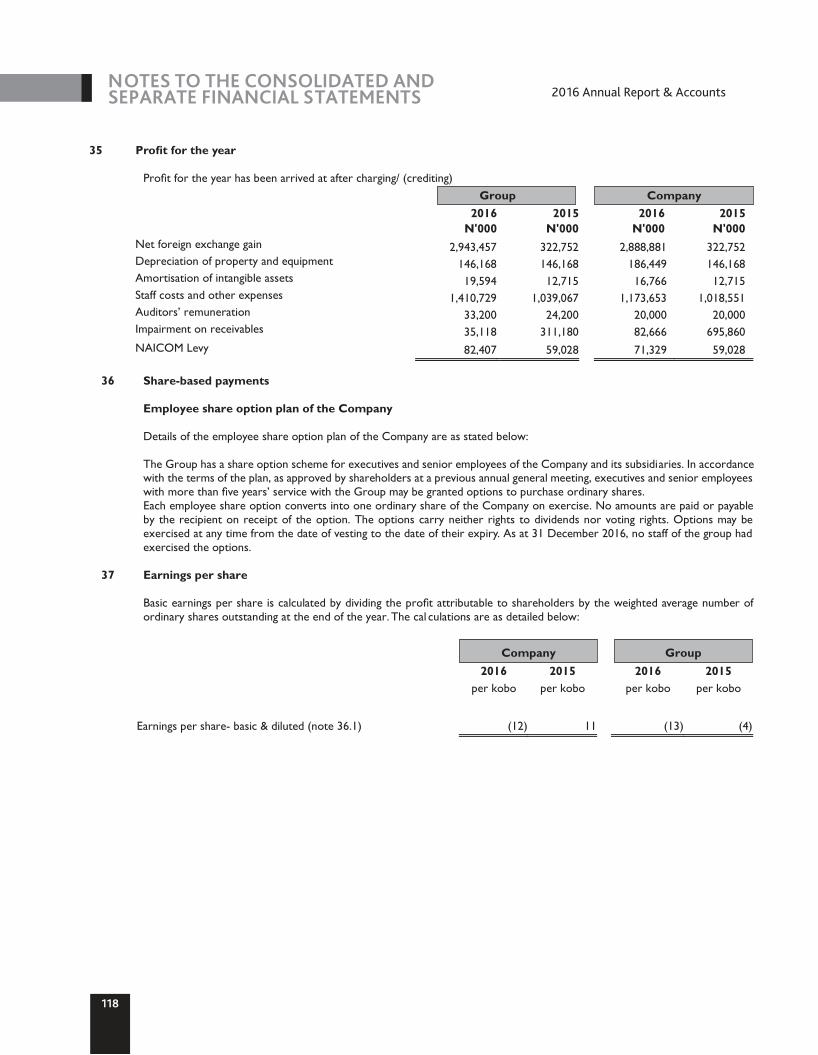
NOTES TO THE CONSOLIDATED AND SEPARATE FINANCIAL STATEMENTS
118
2016 Annual Report & Accounts
35 Profit for the year
Profit for the year has been arrived at after charging/ (crediting) Group Company 2016 2015 2016 2015 N'000 N'000 N'000 N'000 Net foreign exchange gain 2,943,457 322,752 2,888,881 322,752
Depreciation of property and equipment 146,168 146,168 186,449 146,168 Amortisation of intangible assets 19,594 12,715 16,766 12,715 Staff costs and other expenses 1,410,729 1,039,067 1,173,653 1,018,551 Auditors’ remuneration 33,200 24,200 20,000 20,000 Impairment on receivables 35,118 311,180 82,666 695,860
NAICOM Levy 82,407 59,028 71,329 59,028
36 Share-based payments
Employee share option plan of the Company
Details of the employee share option plan of the Company are as stated below:
The Group has a share option scheme for executives and senior employees of the Company and its subsidiaries. In accordance with the terms of the plan, as approved by shareholders at a previous annual general meeting, executives and senior employees with more than five years’ service with the Group may be granted options to purchase ordinary shares.
Each employee share option converts into one ordinary share of the Company on exercise. No amounts are paid or payable by the recipient on receipt of the option. The options carry neither rights to dividends nor voting rights. Options may be exercised at any time from the date of vesting to the date of their expiry. As at 31 December 2016, no staff of the group had exercised the options.
37 Earnings per share
Basic earnings per share is calculated by dividing the profit attributable to shareholders by the weighted average number of
ordinary shares outstanding at the end of the year. The cal culations are as detailed below:
Company Group 2016 2015 2016 2015 per kobo per kobo per kobo per kobo
Earnings per share- basic & diluted (note 36.1) (12) 11 (13) (4)
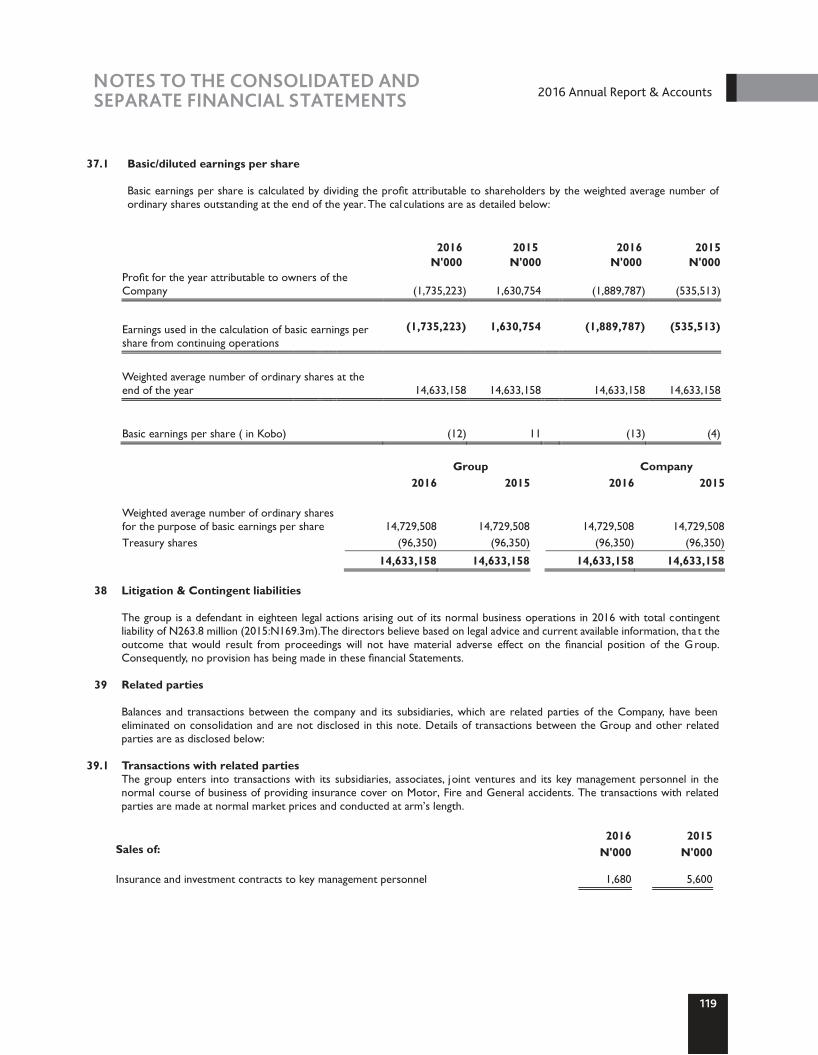
NOTES TO THE CONSOLIDATED AND SEPARATE FINANCIAL STATEMENTS
119
2016 Annual Report & Accounts
37.1 Basic/diluted earnings per share Basic earnings per share is calculated by dividing the profit attributable to shareholders by the weighted average number of
ordinary shares outstanding at the end of the year. The cal culations are as detailed below:
2015
2016
N'000 2015N'000
2016N'000 N'000
Profit for the year attributable to owners of the Company (1,735,223) 1,630,754 (1,889,787) (535,513)
Earnings used in the calculation of basic earnings per share from continuing operations
(1,735,223) 1,630,754 (1,889,787) (535,513)
Weighted average number of ordinary shares at the end of the year
14,633,158
14,633,158
14,633,158
14,633,158
Basic earnings per share ( in Kobo)
(12)
11
(13)
(4)
Group
Company
2016 2015
2016 2015
Weighted average number of ordinary shares for the purpose of basic earnings per share
14,729,508
14,729,508
14,729,508
14,729,508
Treasury shares
(96,350)
(96,350)
(96,350)
(96,350)
14,633,158
14,633,158
14,633,158
14,633,158
38
Litigation & Contingent liabilities
The group is a defendant in eighteen legal actions arising out of its normal business operations in 2016 with total contingent liability of N263.8 million (2015:N169.3m).The directors believe based on legal advice and current available information, that the outcome that would result from proceedings will not have material adverse effect on the financial position of the Group. Consequently, no provision has being made in these financial Statements.
39
Related parties
Balances and transactions between the company and its subsidiaries, which are related parties of the Company, have been eliminated on consolidation and are not disclosed in this note. Details of transactions between the Group and other related parties are as disclosed below:
39.1
Transactions with related parties
The group
enters into transactions with its subsidiaries, associates, joint ventures and its key management personnel in the normal course of business of providing insurance cover on Motor, Fire and General accidents. The transactions with related parties are made at normal market prices and conducted at arm’s length.
2016
2015
Sales of:
N'000
N'000
Insurance and investment contracts to key management personnel
1,680
5,600
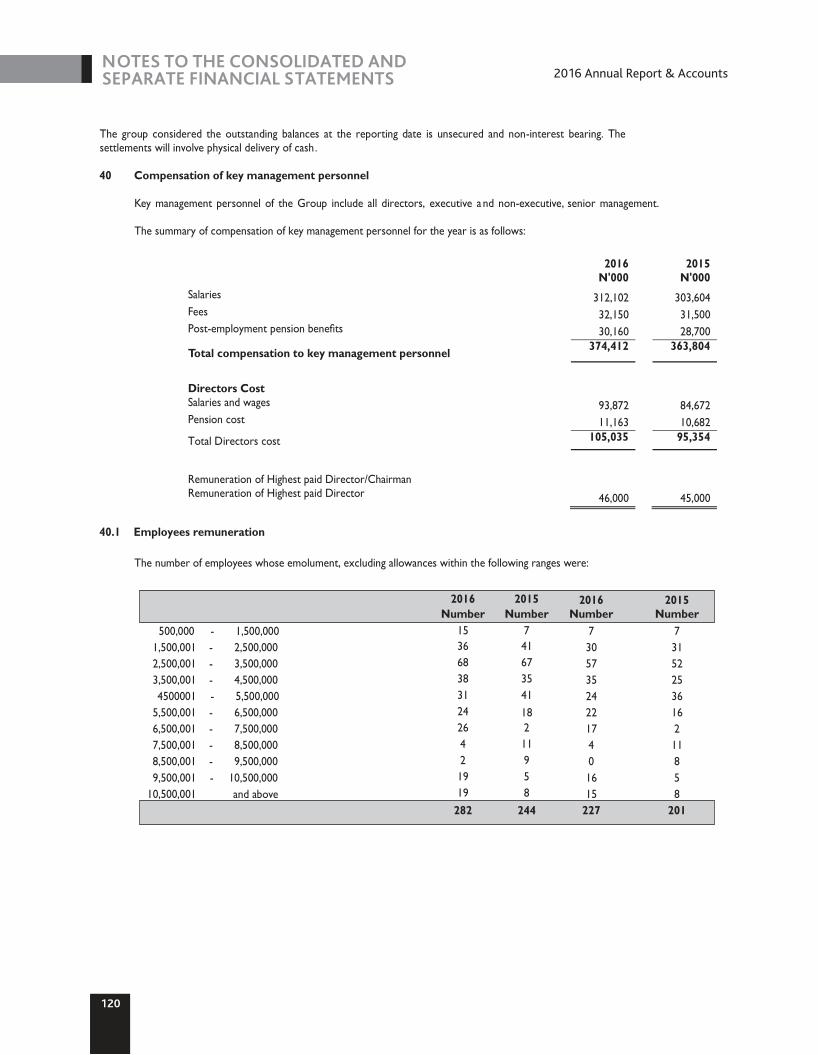
2
TABLE OF CONTENT
120
TABLE OF CONTENT 2016 Annual Report & Accounts
The group considered the outstanding balances at the reporting date is unsecured and non-interest bearing. The settlements will involve physical delivery of cash.
40 Compensation of key management personnel
Key management personnel of the Group include all directors, executive and non-executive, senior management.
The summary of compensation of key management personnel for the year is as follows:
2016
2015
N'000
N'000
Salaries 312,102 303,604
Fees 32,150 31,500
Post-employment pension benefits 30,160 28,700
Total compensation to key management personnel 374,412 363,804
Directors Cost
Salaries and wages 93,872 84,672
Pension cost 11,163 10,682
Total Directors cost
105,035
95,354
Remuneration of Highest paid Director/Chairman
Remuneration of Highest paid Director 46,000
45,000
40.1 Employees remuneration
The number of employees whose emolument, excluding allowances within the following ranges were:
2016 2015 2016 2015Number Number Number Number
- 1,500,000 15 7 7 7 - 2,500,000 36 41 30
31
- 3,500,000 68 67 57
52 - 4,500,000 38 35 35
25
- 5,500,000 31 41 24
36 - 6,500,000 24 18 22 16 - 7,500,000 26 2 17
2
- 8,500,000 4 11 4
11 - 9,500,000 2 9 0
8
-
500,000 1,500,001 2,500,001 3,500,001 4500001
5,500,001 6,500,001 7,500,001 8,500,001 9,500,001 10,500,000 19 5 16
5
10,500,001 and above 19 8 15 8282 244 227 201
NOTES TO THE CONSOLIDATED AND SEPARATE FINANCIAL STATEMENTS

121
2016 Annual Report & Accounts
41 Disclosure Contraventions
Nature of contraventions
Fines and Penalties
N'000
Late payment of Insurance Levy for year 2016
500,000
Penalty for late submission of board resolution on approved maximum exposure on aviation risk
250,000
Violation of s. 81 (1) of the insurance act
2002
100,000
Penalty for late response to the commissions letter of 29th august 2016 on report of 2015 AMLICF compliance examination
100,000
Late submission of aviation treaty for 2016
250,000
1,200,000
The details of the contravention
and penalty paid in year 2016 are as detailed above, however there were no penalty imposed on the company by NAICOM in the year 2015.
42
Events after reporting period
There are no event after the reporting period that could have had a material effect on the state of affair of the company as at 31 December 2016 which have not been adequately
provided for or disclosed.
43
Approval of financial statements
The financial statement were approved by the board of directors and authourised for issue on 9th
March, 2017.
44
Enterprise Risk Management
Overview
The Group’s enterprise risk management (ERM) programme comprises of an instituted structure designed to manage a myriad of uncertainties (threats) and equally explore opportunities in enhancing the Group’s performance standards. The Group’s ERM practice involves a cross-functional and multi-dimensional approach to corporate risk management. This characteristically involves a strong corporate governance structure that facilitates the establishment of a risk management unit, which has been charged with the function of identifying uncertainties (risks and opportunities) that may impact on corporate objectives (ISO : 31000), and assessing its impact using the RAG (Red, Amber and Green) rating
methodology. The overall oversight function of the risk management function remains critical to ensuring the Group attains its expected performance standards.
The Group’s risk context delineates the scope of the risk management process and sets the standards against which risks will be assessed in accordance with the group’s primary organizational objective of attaining to be the leading insurance based financial services group.
The Group clearly understand the uncertainties inherent in accepting insurance risks and how such risks potentially impact the achievement of business objectives if left undefined. It is to this end that the Group’s ethics, philosophy and risk culture are embodied in our integrated risk management and control function.
NOTES TO THE CONSOLIDATED AND SEPARATE FINANCIAL STATEMENTS
122
NOTES TO THE CONSOLIDATED AND SEPARATE FINANCIAL STATEMENTS 2016 Annual Report & Accounts
Risk Management Philosophy
The key elements of Group’s risk management philosophy are as follows:
• The Group considers sound risk management as the foundation of a long lasting financial institution.• The Group shall continue to adopt a holistic and integrated approach to risk management.• Risk officers shall be empowered to perform their duties professionally and independently without undue interference.• Risk management shall be governed by policies which are well defined and clearly communicated Group-wide.• Risk management represents a shared responsibility. Therefore, the Group aims to build a shared-perspective on risks that
is grounded on consensus;• Risk-related issues are taken into consideration in all business decisions. The Group shall strive to maintain a conservative
balance between risk and revenue considerations.
Risk Culture
• The Board and senior management set the tone-at-the-top, by promoting a responsible approach to risk in order to ensure that the long term survival and reputation of the Group is not jeopardized in a bid to achieve set objectives.
• The primary responsibility for risk management and control function is fully vested in the Board which in turn shall delegate such to Senior Management;
• The Group’s management shall promote risk awareness and risk management practice across the enterprise.• The Group advocates risk event reporting and whistle blowing, in the quest to gain greater insights into mistakes and near-
misses.• The Group maintains a firm obligation to ethical principles, which is replicated in the ethical profile of individuals and the
application of ethics and the significance of wider stakeholder stances in decision making.
Risk Management Oversight - Three Lines of Defence Model
The three (3) lines of defence approach to effective risk management function and control to promote an integrated culture of risk sensitivity and accountability of key risk owners across the Group. The model enables the Group’s risk management and control function to delegate and coordinate essential risk management functions across the designated lines of defence, within a systematic and integrated process.
The three (3) lines of defence are depicted in the diagram below:
The Three Lines of Defence
Risk Management and Internal Control Integrated Framework The ERM and internal control framework of the Group derives its functionality from the Committee of Sponsoring Organizations of the Treadway Commission (COSO) Enterprise Risk Management – Integrated Framework. The framework highlights the nucleus of the enterprise risk management process, the synergy of operations amongst the board of directors, management and other personnel across the enterprise.The Group’s ERM/internal control integrated framework primarily consists of the following five (5) constituents in accordance with best practices:
• Control environment • Risk assessment • Control activities• Information & communication • Monitoring
Control Environment
The Group’s control environment refers to established standards and structures that provide a foundation for the risk management /internal control functions to thrive across the Group. The board of directors and senior management institutes the tone at the top regarding the importance of internal control.
Furthermore, the control environment comprises our five (5) corporate values of integrity, empathy, professionalism, innovation and team spirit that exhibit the Group’s commitment to essential values.These values therefore, provide the necessary advantages that enable management establish the mode of business operation and
123
TABLE OF CONTENT
the board of directors effectively executes its independent oversight functions by setting the tone at the top. Similarly the operating and corporate governance structure, establishment of standards of conduct, enforcement of accountability through structures and authorities etc. represents critical success factors responsible for the thriving risk management culture within the Group thus far.
Risk Assessment
Risk assessment involves an iterative method of identifying and evaluating risks that could enhance opportunities and/or mitigate threats that emanates across the enterprise. e.g. from department, division inclusive of subsidiaries capable of impacting the Group’s objectives.
Designated risk champions are charged with the responsibility of risk identification/reporting, while the ERM unit conducts an evaluation and assessment of risk identified, with the intention of developing action plans for implementation and assess the effectiveness thereof. Risk assessment reports are presented at the quarterly board meetings of the Financial Performance and Enterprise Risk Management Committee. Similarly, matters within the remit of the Audit committee are assessed. These committees have the responsibility to assesses changes that significantly impact the system of risk management and internal control and develop responsive control measures that impact on the avoidance / mitigation of risks within the Group’s acceptable levels.
Control Activities
Control activities are actions instituted through internal practices that help safeguard the implementation of Group’s directives to mitigate risks exposures and/or promote business opportunities that may possibly influence the achievement of corporate strategic objectives. Control activities are entity-specific and are performed at all levels across of the Group at various stages within business processes and over the technology environment.
Information and Communication
The Group firmly appreciates that management of information is critical for the enterprise to proficiently implement internal control functions and as such Management judicious develop and utilize information having its origins from internal and/or external sources to underpin the current internal control system.
Monitoring
The current corporate governance structure necessitates the Group to evaluate the efficacies of; its policies and procedures, adherence to its internal control/risk management measures and communicates inherent/potential deficiencies in a timely manner to the authorities responsible for taking risk-based corrective actions, including senior management and board committees, as apt.
Reputational Risk Management
The Group maintains a zero tolerance policy against all unethical behaviors. Furthermore, the Group’s corporate values continually promote a responsible approach to avoiding/mitigating reputational risks and ensure that the long term survival and brand image of the Group is not jeopardized.
Operational Risk Management
Operational risks represent risk of losses that emanate from inadequate or failed internal processes, people and systems or from external events. The Group’s ERM framework recognizes external risks, legal and compliance risks and financial crime risks e.g. Anti-Money Laundry (AML) and Combating Financing of Terrorism (CFT) are inclusive in the Operational risk (OR) profile description.
The Group recognizes the pervasiveness of several types of operational risks in our business process, hence policies and tools have been instituted to ensure that resultant impact are kept as-low-as-reasonably-practicable (ALARP). Some of these processes are:
RCSA
The risk control self-assessment tool constitutes a potent operational risk management tool employed by the Group to manage operational risks on a monthly basis, using a combination probability and impact measurements. Risk officers (Cornerstone Risk Officers) working in designated departments are primarily responsible for risk identification- in line with our 1st line of defence model, assessment, proffering action plans for implement and determining the efficacies of these plans as deemed fit, in order to mitigate risk exposures.
Occupational Health and Safety Management System The Group reviewed its Occupational Health and Safety Management System (OHSAS) design, in order to meet the requirements
2016 Annual Report & AccountsNOTES TO THE CONSOLIDATED AND SEPARATE FINANCIAL STATEMENTS

124
TABLE OF CONTENT 2016 Annual Report & Accounts
of the international standard for OHSAS 1800:2007. This approach was in accordance with the Group’s policy on Zero tolerance against occupational health and safety risks. Examples of these Instituted policies include: emergency preparedness and response procedures, hazard identification, incident investigation and reporting of non-conformity standards, conduct of fire drills, record keeping on Loss Time Injury (LTI) and Loss Time Incident Frequency (LTIF). Furthermore, employees are adequately insured against occupational hazards. In addition, the Group provides medical facilities to its employees and their immediate families at its expense.
Outlook
The focal point of our future strategy of managing broad risk categories which include but may not be limited to: market, credit, liquidity, operational, insurance, reputational, legal and compliance risks; significantly rests with instituting a structured approach to embedding a robust risk management mechanism aimed at driving performance standards, day-to-day operations, corporate culture and decision making process in order to safeguard and engender values for all stakeholders in the ever dynamic insurance market space fraught with a principal concern- management of uncertainties.
45 Capital management
The Group objective with respect to capital management is to maintain a capital based that structured to exceed regulatory requirement and to best utilize capital allocations. Insurance industry regulation measure the financial strength of Non-Life using a solvency margin model. Generally NAICOM expect insurer to comply with capital adequacy requirement. The regulatory capital (as required under insurance Acts 2003 and NAICOM Guideline) within the Group have been maintained and preserved over the reporting periods. The Solvency Margin Requirement The regulatory capital (as required under Insurance Act 2003 and NAICOM Guideline) within the Group have been maintained and preserved over the reporting periods. The section defines solvency Margin of Non-life insurer as the difference between the admissible assets and liabilities and this shall not be less than 15% of Net premium income(Gross premium Income less reinsurance premium paid) or the minimum capital base (N3 billion) whichever is higher.
NOTES TO THE CONSOLIDATED AND SEPARATE FINANCIAL STATEMENTS

Minimum Capital requirement During the year, the company has consistently exceeded the minimum capital requirement. The table below show solvency margin computation for Composite business as at 31 December 2016.
SOLVENCY MARGIN COMPUTATION FOR COMPOSITE INSURANCE BUSINESS
125
TABLE OF CONTENT
2016 Annual Report & AccountsNOTES TO THE CONSOLIDATED AND SEPARATE FINANCIAL STATEMENTS
Total Assets
Admissible Assets Inadmissible Assets
N'000
Cash and cash Equivalent Financial Assets Trade receivables Other receivables and prepayments (391,309) Other assets - Reinsurance Assets Deferred acquisition cost Investment in Joint venture Investment in subsidiaries Investment properties Property, Plant & Intangible asset Deferred tax asset Statutory Deposit
Total Admissible Assets (a)
Investment contract liabilities Insurance Contract Liabilities Trade payables Other payables Retirement benefit obligation
Tax payable
Total Admissible Liabilities
8
N'000
2,557,1537,370,257
73,224391,309
-2,224,827
206,6291,188,6092,954,748
-806,08276,62018,790
500,000
18,368,24
2,353,7666,307,846
452,649634,631
7,750
302,091
10,058,733
(18,790)
(410,099)
-----
-
-
Solvency Margin for the year
Minimum Required Capital
Excess/(Shortfall) in Solvency Margin
34,631
N'000
2,557,1537,370,257
73,224--
2,224,827206,629
1,188,6092,954,748
-806,08276,620
-500,000
17,958,149
2,353,7666,307,846
452,6496
7,750
302,091
10,058,733
7,899,416
5,000,000
2,899,416

126
TABLE OF CONTENT 2016 Annual Report & AccountsNOTES TO THE CONSOLIDATED AND SEPARATE FINANCIAL STATEMENTS
Financial risk management
The Group monitors and manages the financial risks relating to the operations of the Group through internal risk reports which analyse exposures by degree and magnitude of risks. These risks include market risk (currency risk, interest rate risk and price risk), credit risk and liquidity risk. The Group may seek to minimise the effects of these risks by using derivative financial instruments to hedge risk exposures. The Group does not enter into or trade financial instruments, including derivative financial instruments, for speculative purposes.
46.a Valuation bases Fair value is the amount for which an asset could be exchanged or liability being settled between knowledgeable, willing parties in an arms-length transaction. Fair values are determined at prices quoted in active markets. In the current environment, such price information is typically not available for all instruments and the Group applies valuation techniques to measure such instruments. These valuation techniques make maximum use of market observable data but in some cases management estimate other than observable market inputs within the valuation model. There is no standard model and different assumptions would generate different results. Fair values are subject to a control framework designed to ensure that input variables and output are assessed independent of the risk taker. These inputs and outputs are reviewed and approved by a valuation committee. The Group has minimal exposure to financial assets which are valued at other than quoted prices in an active market. The table below shows financial assets carried at fair value through profit or loss by valuation method.
2016
2015
N N
Quoted prices in active markets (level 1) 2,836,108
4,330,746
Valuation technique:
Market observable data (level 2)
Other than observable market data (level 3)
2,836,108
4,330,746
Fair value measurements recognised in the consolidated statement of financial position. The following table provides an analysis of financial instruments that are measured subsequent to initial recognition at fair
value, grouped into Levels 1 to 3 based on the degree to which the fair value is observable.
Level 1 fair value measurements are those derived from quoted prices (unadjusted) in active markets for identical assets or liabilities.
Level 2 fair value measurements are those derived from inputs other than quoted prices included within Level 1 that are observable for the asset or liability, either directly (i.e. as prices) or indirectly (i.e. derived from prices).
Level 3 fair value measurements are those derived from valuation techniques that include inputs for the asset or liability that are not based on observable market data (unobservable inputs).
-
-
-
-
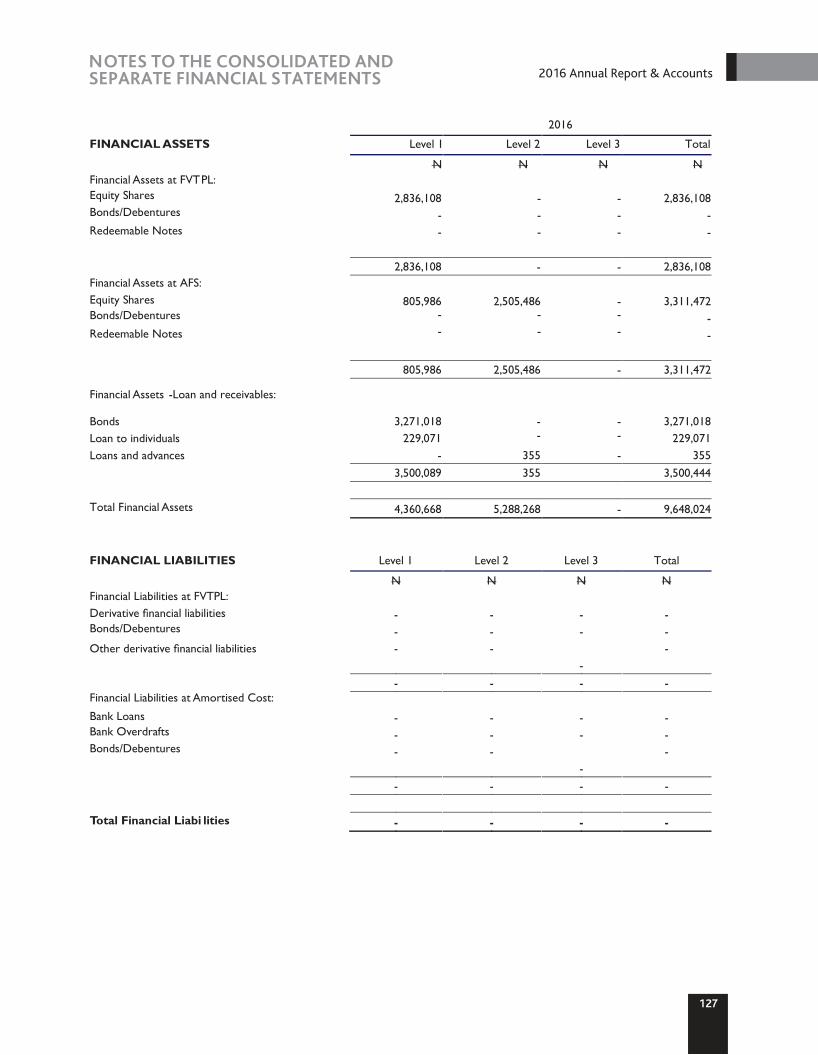
127
2016 Annual Report & AccountsNOTES TO THE CONSOLIDATED AND SEPARATE FINANCIAL STATEMENTS
2016
FINANCIAL ASSETS
N
Level 1 Level 2
N
Level 3
N
Total
N Financial Assets at FVTPL: Equity Shares 2,836,108 - - 2,836,108 Bonds/Debentures - Redeemable Notes - 2,836,108 - - 2,836,108 Financial Assets at AFS: Equity Shares 805,986 2,505,486 - 3,311,472 Bonds/Debentures - Redeemable Notes - 805,986 2,505,486 - 3,311,472
Financial Assets -Loan and receivables:
Bonds 3,271,018 - - 3,271,018 Loan to individuals 229,071 - - 229,071 Loans and advances - 355 - 355 3,500,089 355 3,500,444 Total Financial Assets 4,360,668 5,288,268 - 9,648,024
FINANCIAL LIABILITIES Level 1 Level 2 Level 3 Total
N N N N Financial Liabilities at FVTPL: Derivative financial liabilities - - - - Bonds/Debentures - - - - Other derivative financial liabilities - - - - - - - - Financial Liabilities at Amortised Cost: Bank Loans - - - - Bank Overdrafts - - - - Bonds/Debentures - - - - - - - - Total Financial Liabi lities - - - -
--
--
--
-- -
-- -
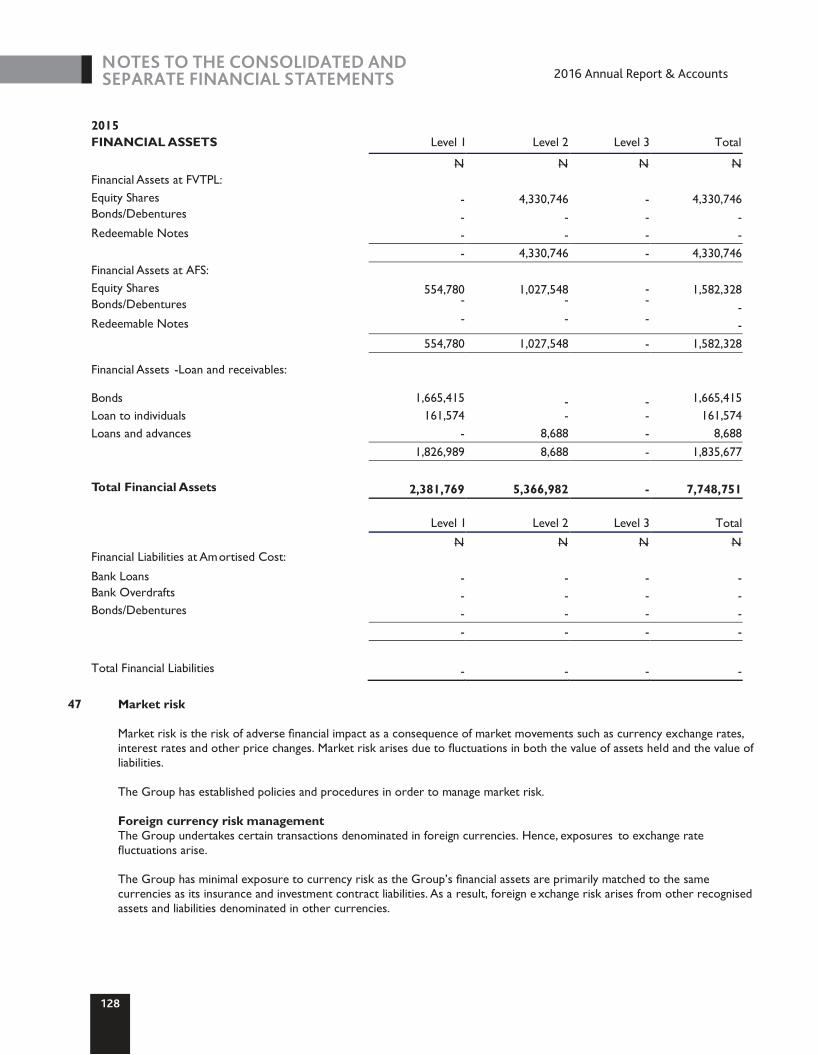
128
2016 Annual Report & AccountsNOTES TO THE CONSOLIDATED AND SEPARATE FINANCIAL STATEMENTS
47
Market risk
Market risk is the risk of adverse financial impact as a consequence of market movements such as currency exchange rates, interest rates and other price changes. Market risk arises due to fluctuations in both the value of assets held and the value of liabilities.
The Group has established policies and procedures in order to manage market risk.
Foreign currency risk management
The Group undertakes certain transactions denominated in foreign currencies. Hence, exposures
to exchange rate fluctuations arise.
The Group has minimal exposure to currency risk as the Group’s financial assets are primarily matched to the same currencies as its insurance and investment contract liabilities. As a result, foreign e xchange risk arises from other recognised assets and liabilities denominated in other currencies.
2015
FINANCIAL ASSETS Level 1 Level 2 Level 3 Total
N N N N
Financial Assets at FVTPL:
Equity Shares 4,330,746 - 4,330,746
Bonds/Debentures - - - -
Redeemable Notes - - - - - 4,330,746 - 4,330,746
Financial Assets at AFS:
Equity Shares
554,780
1,027,548
1,582,328
Bonds/Debentures
-
Redeemable Notes
-
554,780
1,027,548
-
1,582,328
Financial Assets -Loan and receivables:
Bonds
1,665,415
1,665,415
Loan to individuals
161,574
-
-
161,574
Loans and advances
-
8,688
-
8,688
1,826,989
8,688
-
1,835,677
Total Financial Assets
2,381,769
5,366,982
-
7,748,751
Level 1
Level 2
Level 3
Total
N
N
N
N
Financial Liabilities at Amortised Cost:
Bank Loans
-
-
-
-
Bank Overdrafts
-
-
-
-
Bonds/Debentures
-
-
-
-
-
-
-
-
Total Financial Liabilities
-
-
-
-
-
--
- -- -
-
- -

129
2016 Annual Report & AccountsNOTESTO THE CONSOLIDATED AND SEPARATE FINANCIAL STATEMENTS
Carrying amounts of the Group’s foreign currency denominated assets and liabilities:
Sterling N
Euro N
US dollars N
Others
N Total
N
Assets
5,981,190 - 5,981,190
Liabilities 2,015 7,805 -
9,820
2,015
7,805
5,981,190
-
5,991,010
2015
Sterling
Euro
US dollars
N
N
N Others
N Total
N
Assets
1,055
10,398
5,152,657
5,164,110
Liabilities
-
1,055
10,398
5,152,657
-
5,164,110
Foreign currency sensitivity analysis
The following table details the Group’s sensitivity to a 10% increase and decrease in the Sterling against the relevant foreign currencies. A 10% sensitivity rate is used when reporting foreign currency risk internally to key management personnel
and represents management’s assessment of the reasonably possible change in foreign exchange rates. For each sensitivity the impact of change in a single factor is shown, with other assumptions unchanged.
TotalN
10% increase Pre-tax profit Shareholders’ equity
Sterling N
2,217
Euro
N
8,586
US dollars N
6,579,309
6,590,111
10% decrease Pre-tax profit Shareholders’ equity
1,814 7,025
5,383,071
5,391,909
2015
Sterling
US dollars
Total
Euro N
N
N
10% increase Pre tax profit Shareholders’ equity
11,437
5,667,923
5,680,521
10% decrease Pre tax profit Shareholders’ equity
N
1,161950
9,358
4,637,391
4,647,699
The Group’s method for sensitivity to currency rate fluctuations has not changed significantly over the year.
Interest rate risk management
Interest rate risk is the risk that the value of future cash flows of a financial instrument will fluctuate because of changes in market interest rates.
The Group is exposed to interest rate risk as entities in the Group invest in long term debt at both fixed and floating interest rates. The risk is managed by the Group by maintaining an appropriate mix between fixed and floating rate borrowings and by limited use of interest rate swap contracts and forward interest rate contracts. Hedging activities are evaluated regularly to align with interest rate views and defined risk appetite.
--
---
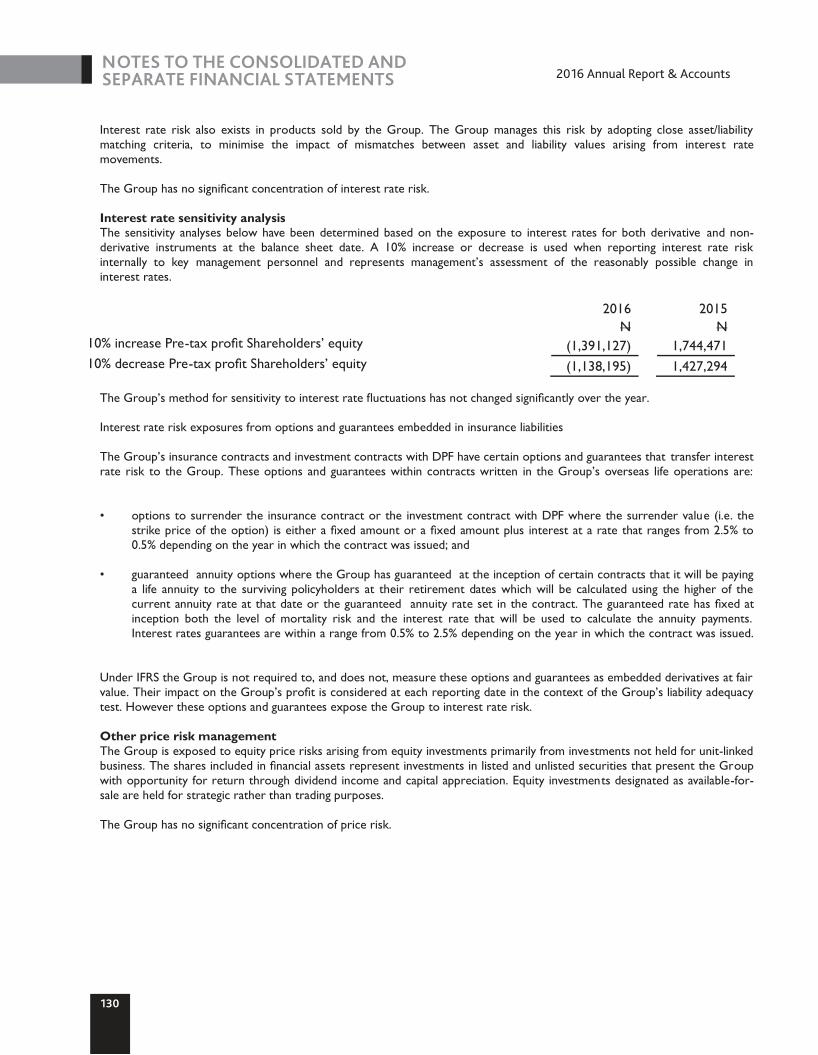
130
2016 Annual Report & Accounts
Interest rate risk also exists in products sold by the Group. The Group manages this risk by adopting close asset/liability matching criteria, to minimise the impact of mismatches between asset and liability values arising from interest rate movements. The Group has no significant concentration of interest rate risk.
Interest rate sensitivity analysis
The sensitivity analyses below have been determined based on the exposure to interest rates for both derivative and non-derivative instruments at the balance sheet date. A 10% increase or decrease is used when reporting interest rate risk internally to key management personnel
and represents management’s assessment of the reasonably possible change in
interest rates.
2016
2015
N
N
10% increase Pre-tax profit Shareholders’ equity
(1,391,127)
1,744,471
10% decrease Pre-tax profit Shareholders’ equity
(1,138,195)
1,427,294
The Group’s method for sensitivity to interest rate fluctuations has not changed significantly over the year.
Interest rate risk exposures from options and
guarantees embedded in insurance liabilities
The Group’s insurance contracts and investment contracts with DPF have certain options and guarantees that
transfer interest rate risk to the Group. These options and guarantees within contracts written in the Group’s overseas life operations are:
•
options to surrender the insurance contract or the investment contract with DPF where the surrender value (i.e. the strike price of the option) is either a fixed amount or a fixed amount plus interest at a rate that ranges from 2.5% to 0.5% depending on the year in which the contract was issued; and
•
guaranteed annuity options where the Group has guaranteed at the inception of certain contracts that it will be paying a life annuity to the surviving policyholders at their retirement dates which will be calculated using the higher of the current annuity rate at that date or the guaranteed annuity rate set in the contract. The guaranteed rate
has fixed at inception both the level of mortality risk and the interest rate that will be used to calculate the annuity payments. Interest rates guarantees are within a range from 0.5% to 2.5% depending on the year in which the contract was issued.
Under IFRS the Group is not required to, and does not, measure these options and guarantees as embedded derivatives at fair value. Their impact on the Group’s profit is considered at each reporting date in the context of the Group’s liability adequacy test. However these options and guarantees expose the Group to interest rate risk.
Other price risk management
The Group is exposed to equity price risks arising from equity investments primarily from investments not held for unit-linked business. The shares included in financial assets represent investments in listed and unlisted securities that present the Group with opportunity for return through dividend income and capital appreciation. Equity investments designated as available-for-
sale are held for strategic rather than trading purposes.
The Group has no significant concentration of price risk.
NOTES TO THE CONSOLIDATED AND SEPARATE FINANCIAL STATEMENTS
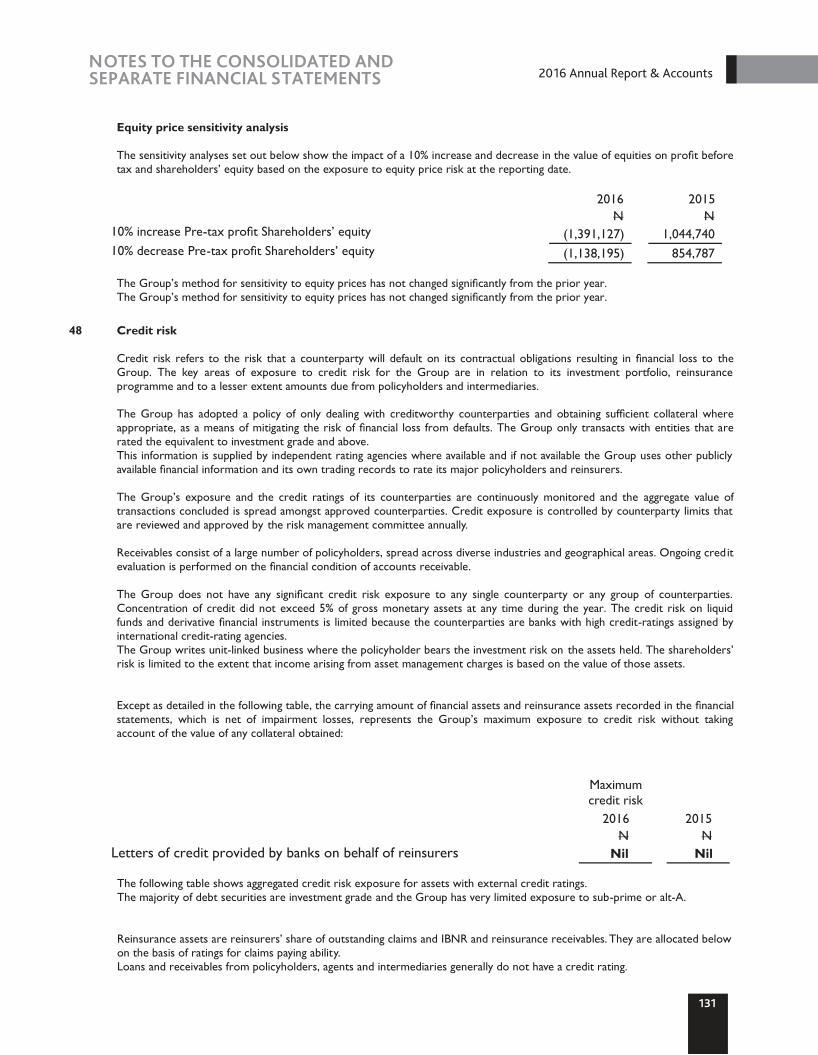
131
Equity price sensitivity analysis
The sensitivity analyses set out below show the impact of a 10% increase and decrease in the value of equities on profit before tax and shareholders’ equity based on the exposure to equity price risk at the reporting date.
2016
2015
N
N
10% increase Pre-tax profit Shareholders’ equity
(1,391,127)
1,044,740 10% decrease Pre-tax profit Shareholders’ equity
(1,138,195)
854,787
The Group’s method for sensitivity to equity prices has not changed significantly from the prior year.
The Group’s method for sensitivity to equity prices has not changed significantly from the prior year.
48 Credit risk Credit risk refers to the risk that a counterparty will default on its contractual obligations resulting in financial loss to the
Group. The key areas of exposure to credit risk for the Group are in relation to its investment portfolio, reinsurance programme and to a lesser extent amounts due from policyholders and intermediaries.
The Group has adopted a policy of only dealing with creditworthy counterparties and obtaining sufficient collateral where
appropriate, as a means of mitigating the risk of financial loss from defaults. The Group only transacts with entities that are rated the equivalent to investment grade and above.
This information is supplied by independent rating agencies where available and if not available the Group uses other publicly available financial information and its own trading records to rate its major policyholders and reinsurers.
The Group’s exposure and the credit ratings of its counterparties are continuously monitored and the aggregate value of
transactions concluded is spread amongst approved counterparties. Credit exposure is controlled by counterparty limits that are reviewed and approved by the risk management committee annually.
Receivables consist of a large number of policyholders, spread across diverse industries and geographical areas. Ongoing credit
evaluation is performed on the financial condition of accounts receivable. The Group does not have any significant credit risk exposure to any single counterparty or any group of counterparties.
Concentration of credit did not exceed 5% of gross monetary assets at any time during the year. The credit risk on liquid funds and derivative financial instruments is limited because the counterparties are banks with high credit-ratings assigned by international credit-rating agencies.
The Group writes unit-linked business where the policyholder bears the investment risk on the assets held. The shareholders’ risk is limited to the extent that income arising from asset management charges is based on the value of those assets.
Except as detailed in the following table, the carrying amount of financial assets and reinsurance assets recorded in the financial
statements, which is net of impairment losses, represents the Group’s maximum exposure to credit risk without taking account of the value of any collateral obtained:
Maximum credit risk
2016
2015
N
N
Letters of credit provided by banks on behalf of reinsurers Nil
Nil The following table shows aggregated credit risk exposure for assets with external credit ratings. The majority of debt securities are investment grade and the Group has very limited exposure to sub-prime or alt-A. Reinsurance assets are reinsurers’ share of outstanding claims and IBNR and reinsurance receivables. They are allocated below on the basis of ratings for claims paying ability. Loans and receivables from policyholders, agents and intermediaries generally do not have a credit rating.
2016 Annual Report & AccountsNOTES TO THE CONSOLIDATED AND SEPARATE FINANCIAL STATEMENTS
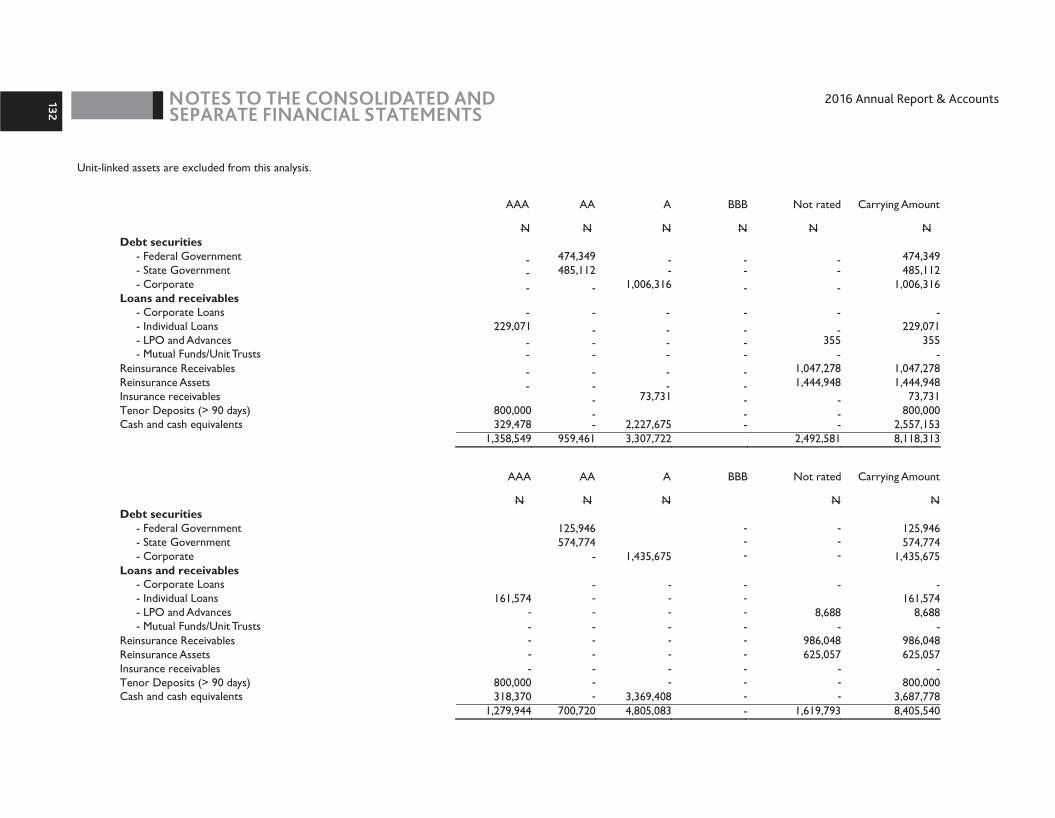
2016 Annual Report & AccountsNOTES TO THE CONSOLIDATED AND SEPARATE FINANCIAL STATEMENTS
132
Unit-linked assets are excluded from this analysis.
AAA
N
AA
N Debt securities
- Federal Government 474,349 - State Government 485,112 - Corporate 1,006,316
Loans and receivables - Corporate Loans - Individual Loans 229,071 - LPO and Advances - Mutual Funds/Unit Trusts Reinsurance Receivables Reinsurance Assets Insurance receivables Tenor Deposits (> 90 days) 800,000
Cash and cash equivalents
329,478
2,227,675
1,358,549
959,461
3,307,722
AAA
N
AA
N
Debt securities
- Federal Government
125,946
- State Government
574,774
- Corporate
1,435,675
Loans and receivables
- Corporate Loans
- Individual Loans
161,574
- LPO and Advances
- Mutual Funds/Unit Trusts
Reinsurance Receivables
Reinsurance Assets
Insurance receivables
Tenor Deposits (> 90 days)
800,000
Cash and cash equivalents
318,370
3,369,408
1,279,944
700,720
4,805,083
- -- -- -- -
-
---
--
----
-
--------
-----
-
Not rated Carrying AmountA
N N N
BBB
N
474,349--
485,112
1,006,316
-
229,071
355 355
-
1,047,278 1,047,278
1,444,948 1,444,94873,731 73,731
800,000
--------- -
2,557,153
2,492,581
8,118,313
A
BBB
Not rated
Carrying Amount
N
N
N
125,946
574,774
1,435,675
-
161,574
8,688
8,688
-
986,048
986,048
625,057
625,057
-
800,000
3,687,778
-
1,619,793
8,405,540
------
---
-
-
---
---
---------
---
-
---
-
---
--------

2016 Annual Report & AccountsNOTES TO THE CONSOLIDATED AND SEPARATE FINANCIAL STATEMENTS 13
3
The following table shows the carrying value of assets that are neither past due nor impaired, the ageing of assets that are past due but not impaired and assets that have been impaired.
Unit linked assets are excluded from this analysis.
Neither past due nor impaired
Past due less than 30 days
Past due 31 to 90 days
Past due more than 90 days
past due and impaired
Carrying Amount
N
N
N
N
N
N
Loans and receivables
-
Federal Government
474,349
474,349
-
State Government
485,112
485,112
-
Corporate
1,006,316
1,006,316 Loans and receivables
- Corporate Loans
-
- Individual Loans
229,071
229,071
229,071
- LPO and Advances
355
355
- Mutual Funds/Unit Trusts
-
Reinsurance Receivables
-
Reinsurance Assets
2,492,227
2,492,227
Insurance receivables 73,731 73,731 Tenor Deposits (> 90 days) 800,000 800,000 Cash and cash equivalents 2,557,153 2,557,153
5,552,001 73,731 2,492,227 229,071 355 8,118,314
--
------
-----
--
-----
---
--
---
--
--
-- --
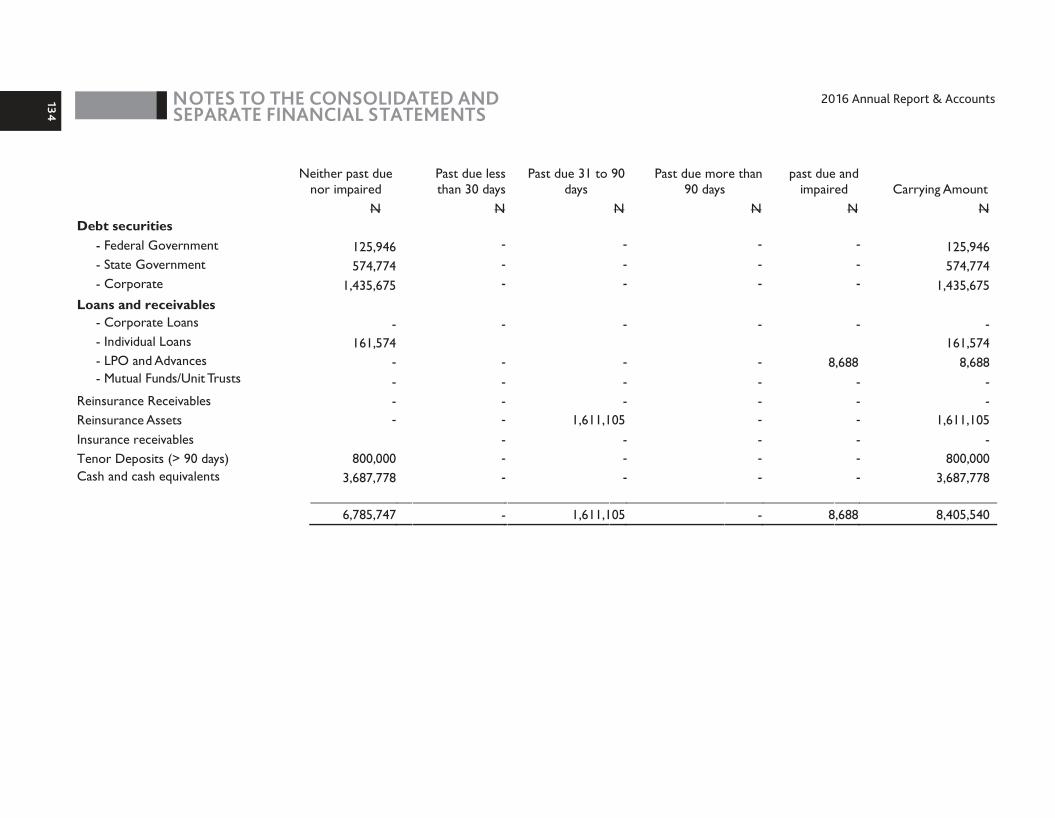
2016 Annual Report & AccountsNOTES TO THE CONSOLIDATED AND SEPARATE FINANCIAL STATEMENTS
134
Carrying Amount N
Debt securities
- Federal Government
125,946
- State Government
574,774
- Corporate
1,435,675
Loans and receivables
-
Corporate Loans
-
-
Individual Loans
161,574
-
LPO and Advances
8,688
-
Mutual Funds/Unit Trusts
-
Reinsurance Receivables
-
Reinsurance Assets
1,611,105
Insurance receivables
-
Tenor Deposits (> 90 days)
800,000
Cash and cash equivalents
3,687,778
8,405,540
Neither past due nor impaired
N
125,946
574,774
1,435,675
161,574
800,000
3,687,778
6,785,747
Past due less than 30 days
N
-
Past due 31 to 90 days
N
1,611,105
1,611,105
90 daysPast due more than
N
-
past due and impaired
N
8,688
8,688
-
----
---
--
-----
-----
--------
---
---
-
--
---
---
---
-
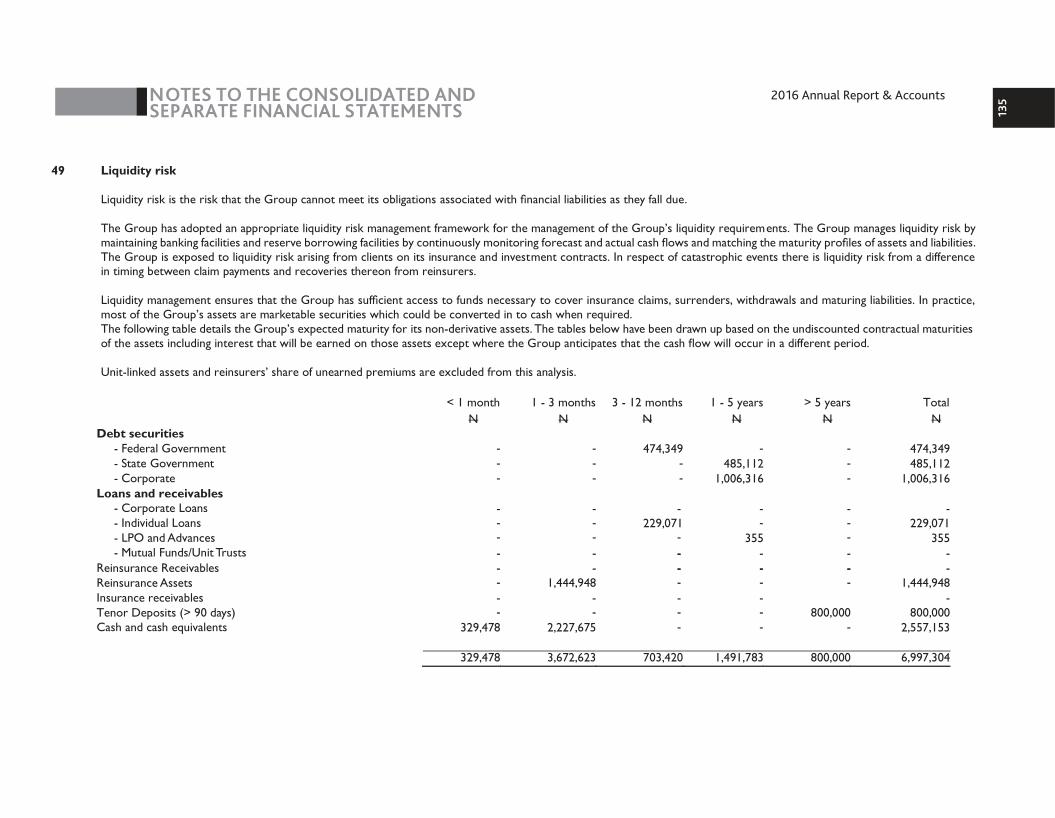
2016 Annual Report & AccountsNOTES TO THE CONSOLIDATED AND SEPARATE FINANCIAL STATEMENTS 13
5
49 Liquidity risk Liquidity risk is the risk that the Group cannot meet its obligations associated with financial liabilities as they fall due. The Group has adopted an appropriate liquidity risk management framework for the management of the Group’s liquidity requirements. The Group manages liquidity risk by
maintaining banking facilities and reserve borrowing facilities by continuously monitoring forecast and actual cash flows and matching the maturity profiles of assets and liabilities. The Group is exposed to liquidity risk arising from clients on its insurance and investment contracts. In respect of catastrophic events there is liquidity risk from a difference in timing between claim payments and recoveries thereon from reinsurers.
Liquidity management ensures that the Group has sufficient access to funds necessary to cover insurance claims, surrenders, withdrawals and maturing liabilities. In practice,
most of the Group’s assets are marketable securities which could be converted in to cash when required.
The following table details the Group’s expected maturity for its non-derivative assets. The tables below have been drawn up based on the undiscounted contractual maturities of the assets including interest that will be earned on those assets except where the Group anticipates that the cash flow will occur in a different period.
Unit-linked assets and reinsurers’ share of unearned premiums are excluded from this analysis.
< 1 month
N
1 -
3 months
N
3 -
12 months
N
1 -
5 years
N
> 5 yearsN
Total
N
Debt securities
- Federal Government
474,349
474,349
- State Government
485,112
485,112
- Corporate
1,006,316
1,006,316
Loans and receivables
- Corporate Loans
-
- Individual Loans
229,071
229,071
- LPO and Advances
355
355
- Mutual Funds/Unit Trusts
-
Reinsurance Receivables
-
Reinsurance Assets
1,444,948
1,444,948
Insurance receivables
-
Tenor Deposits (> 90 days)
800,000
800,000
Cash and cash equivalents
329,478
2,227,675
2,557,153
329,478
3,672,623
703,420
1,491,783
800,000
6,997,304
----
----
-- --
- - -- - -
- - -
---
---
---------
--
- - -
-
------
--
--
--

2016 Annual Report & AccountsNOTES TO THE CONSOLIDATED AND SEPARATE FINANCIAL STATEMENTS
136
N
318,370
318,370
N
625,057
-3,369,408
3,994,465
N 125,946
161,574
287,520
N
574,774734,955
8,688
1,318,417
N
500,000
500,000
< 1 month 1 - 3 months3 - 12
months 1 - 5 years > 5 years Total
N 125,946
574,774
734,955
-
161,574
8,688
-
-
625,057
-
500,000
3,687,778
6,418,772
Debt securities - Federal Government - State Government - Corporate
Loans and receivables - Corporate Loans - Individual Loans - LPO and Advances - Mutual Funds/Unit Trusts
Reinsurance Receivables Reinsurance Assets Insurance receivables Tenor Deposits (> 90 days) Cash and cash equivalents
Although the Group has access to financing facilities, the Group expects to meet its other obligations from operating cash flows and proceeds of maturing financial assets.
---
--
-
-
--
-
-
-
--
-
-
-
--
---
--
--
-
--
-
--
--
--
-------
------

2016 Annual Report & AccountsNOTES TO THE CONSOLIDATED AND SEPARATE FINANCIAL STATEMENTS 13
7
2016 < 1 month 1 - 3 months 3 - 12 months 1 - 5 years > 5 years Total
Liquidity Gap Analysis
N N N N N N Financial & Insurance Assets 329,478 3,672,623 1,491,783 800,000 6,293,884
Financial & Insurance Liabilities - (638,578) (1,230,704) (1,077,989) - (2,947,271)
329,478 3,034,045 (1,230,704) 413,794 800,000 3,346,613
2015
1 - 3 months 3 - 12 months 1 - 5 years > 5 years Total
< 1 month
N N N N N N
Financial & Insurance Assets 318,370 3,994,464 - 2,019,137 500,000 6,831,971
Financial & Insurance Liabilities (177,249) (464,429) (794,278) (860,889) (8,786) (2,305,631)
141,121 3,530,035 (794,278) 1,158,248 491,214 4,526,340
-

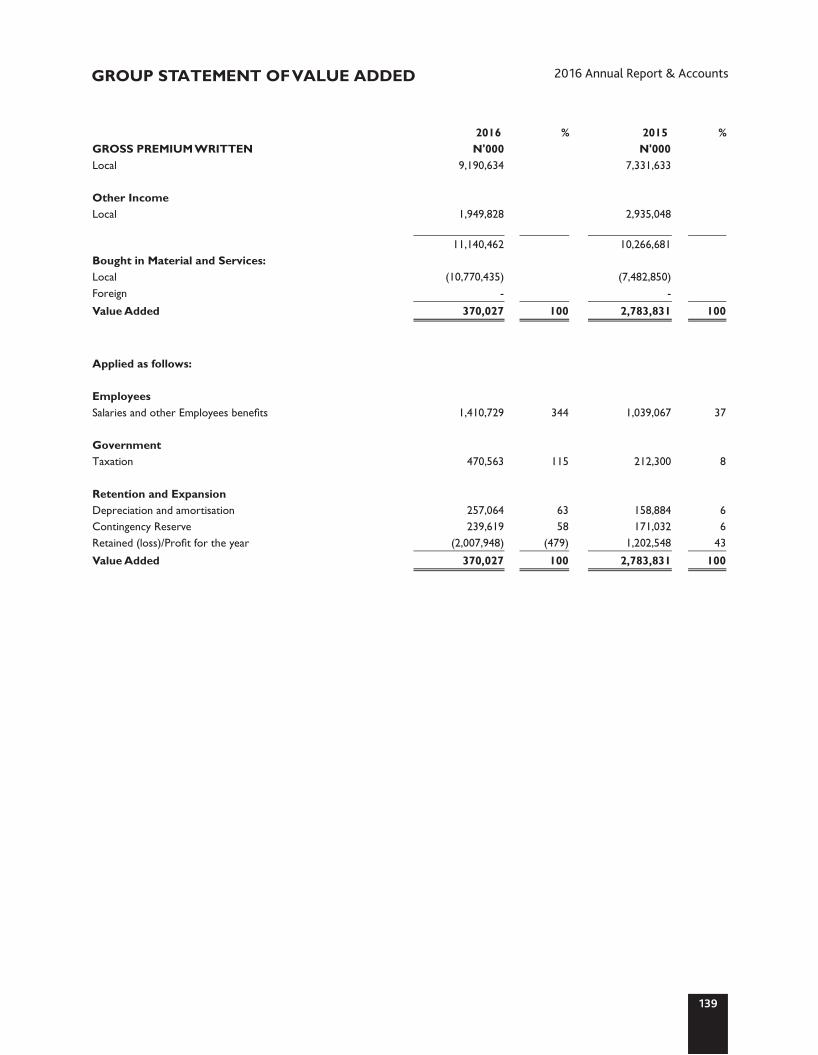
139
2016 Annual Report & Accounts
GROUP STATEMENT OF VALUE ADDED
% %
GROSS PREMIUM WRITTEN 2016N'000
2015N'000
Local 9,190,634 7,331,633
Other Income Local 1,949,828 2,935,048
11,140,462 10,266,681
Bought in Material and Services: Local
(10,770,435)
(7,482,850)
Foreign
-
-
Value Added
370,027
100
2,783,831
100
Applied as follows:
Employees
Salaries and other Employees benefits
1,410,729
344
1,039,067
37
Government Taxation
470,563
115
212,300
8
Retention and Expansion
Depreciation and amortisation
257,064
63
158,884
6 Contingency Reserve
239,619
58
171,032
6
Retained (loss)/Profit for the year
(2,007,948)
(479)
1,202,548
43
Value Added
370,027
100
2,783,831
100
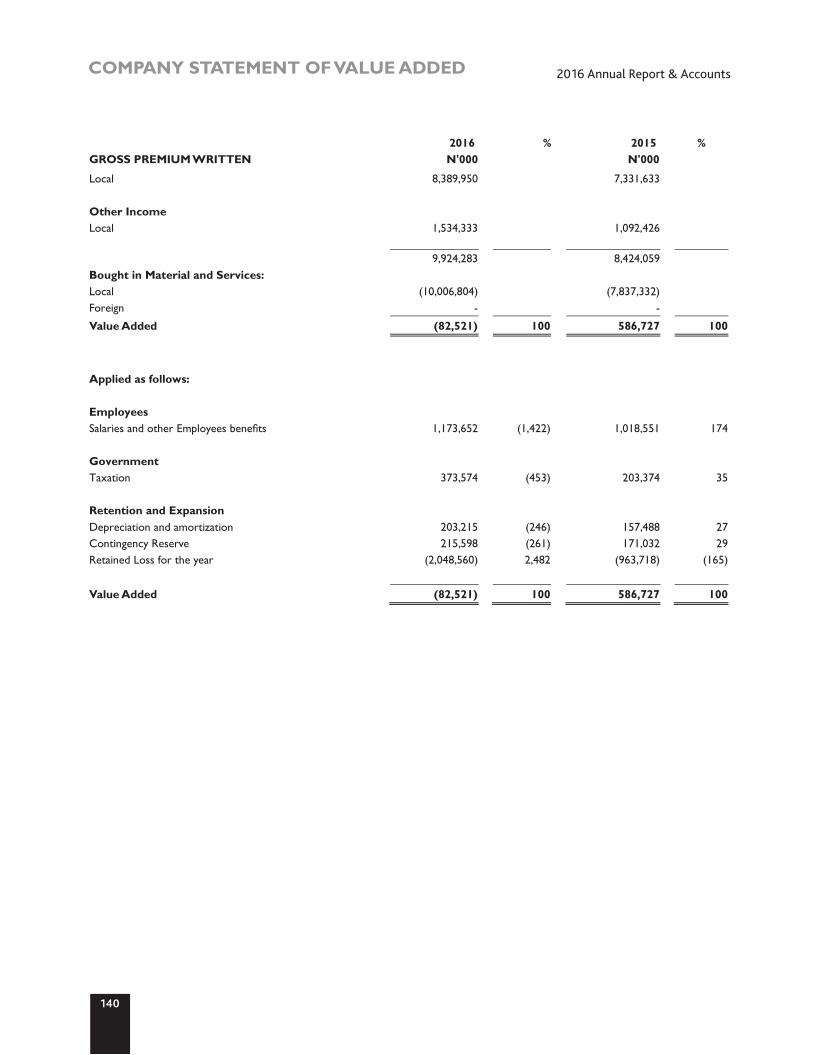
COMPANY STATEMENT OF VALUE ADDED
140
2016 Annual Report & Accounts
% GROSS PREMIUM WRITTEN
2016N'000
%
2015N'000
Local 8,389,950 7,331,633 Other Income Local 1,534,333 1,092,426 9,924,283 8,424,059 Bought in Material and Services: Local (10,006,804) (7,837,332) Foreign - - Value Added (82,521) 100 586,727 100
Applied as follows:
Employees
Salaries and other Employees benefits
1,173,652
(1,422)
1,018,551
174
Government
Taxation
373,574
(453)
203,374
35
Retention and Expansion Depreciation and amortization
203,215
(246)
157,488
27
Contingency Reserve
215,598
(261)
171,032
29 Retained Loss for the year
(2,048,560)
2,482
(963,718)
(165)
Value Added
(82,521)
100
586,727
100

141
2016 Annual Report & Accounts
- GROUP FIVE YEAR FINANCIAL SUMMARY
2015Group
2014Group
2016Group N'000
2013Group N'000
2012Group N'000
ASSETS
Cash and cash equivalents
3,093,080
6,297,836 3,077,531
3,558,740
2,747,322
Financial assets
9,648,024
7,748,751 6,519,589
5,071,987
3,796,078
Trade receivables
73,731
-
31,600 56,613
551,199
Receivables and prepayments 228,293 213,394 176,673 229,457 865,667Other receivables - 290,138 5,496 2,131
Reinsurance assets 2,492,227 1,611,105 1,701,296 2,221,541 1,475,611Deferred acquisition cost 258,101 219,308 227,131 245,488 132,208Finance lease receivables - 70 21,726 110,595 32,299Investment in Joint Venture 1,894,885 - - - Investment properties 494,000 1,302,994 1,303,680 1,288,680 1,275,780Property, plant and equipment
2,235,928
2,070,530
675,814
602,431
558,643
Intangible assets -
software
86,069
40,041
31,027 26,333
40,186
Deferred tax assets
-
242,583
260,336 236,562
201,769
Statutory deposits
800,000
800,000
500,000 500,000
500,000
Asset classified as held for sale
132,031
132,031
-
-
-
Total Assets
21,436,369
20,968,781
14,153,923
14,150,558
12,176,762
LIABILITIES
Investment contract liabilities
2,353,766
1,712,048
1,322,472
1,303,049
1,229,957Insurance contract liabilities
6,941,872
5,619,757
4,401,107
4,528,243
3,653,933Trade payables
456,521
384,017
319,482
518,337
176,670Other payables
807,455
826,647
632,389
577,614
590,815Trust and managed funds
-
-
-
199,749
348,135Finance lease obligations
-
-
-
-
758Income tax liabilities
414,398
340,539
88,471
110,887
110,508Deferred tax liabilities
144,335
-
-
-
-Employees retirement benefit obligations
8,102
7,523
11,565
10,251
38,521
Liability directly associated with assets classified as held-for sale.
5,497 5,497 - --
Total Liabilities 11,131,946 8,896,028 6,775,486 7,248,130 6,149,297
EQUITY
Share capital and reserves:
Ordinary share capital
7,364,754
7,364,754
4,410,005
4,410,005
4,410,005Share premium
1,947,166
1,947,166
1,947,166
1,947,166
1,947,166Treasury shares
(48,175)
(48,175)
(48,175)
(48,175)
(48,175)Contingency reserve
1,759,421
1,519,802
1,348,770
1,148,801
975,978Retained earnings (General reserve)
(890,224)
1,124,796
98,647
(555,369)
(1,257,509)Non-controlling interest 171,481 164,410 - - -
Total Equity 10,304,423 12,072,753 7,756,413 6,902,428 6,027,465
Total Equity & Liabilities 21,436,369 20,968,781 14,531,899 14,150,558 12,176,762
Statement of Profit or Loss & Other Comprehensive Income Gross premium written
9,190,634
7,331,633
5,211,966
5,313,223
4,619,959
Gross premium income 8,456,458 7,119,632 5,187,098 4,622,737 4,525,046
(1,264,660) (Loss)/profit before taxation 1,843,054 1,037,690 870,207 543,925
Taxation credit/(charge) (470,563) (212,300) (91,208) (9,844) (33,523) (Loss)/profit after taxation (1,735,223) 1,630,754 946,482 860,363 510,402
N'000 N'000
-
-
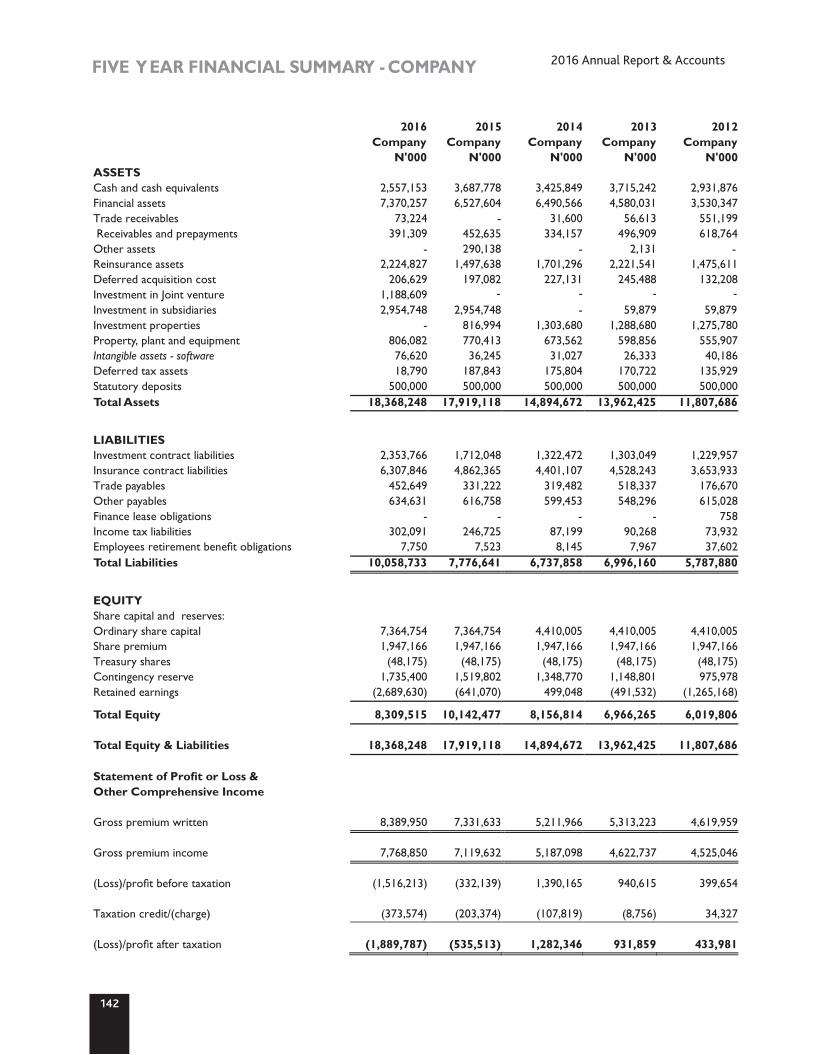
142
FIVE YEAR FINANCIAL SUMMARY - COMPANY
2016 Annual Report & Accounts
2016 2015 2014 2013 Company Company Company Company N'000 N'000 N'000 N'000
2012Company
N'000 ASSETS Cash and cash equivalents 2,557,153 3,687,778 3,425,849 3,715,242 2,931,876Financial assets 7,370,257 6,527,604 6,490,566 4,580,031 3,530,347Trade receivables 73,224 - 31,600 56,613 551,199 Receivables and prepayments 391,309 452,635 334,157 496,909 618,764Other assets - 290,138 2,131 Reinsurance assets 2,224,827 1,497,638 1,701,296 2,221,541 1,475,611Deferred acquisition cost 206,629 197,082 227,131 245,488 132,208Investment in Joint venture 1,188,609 Investment in subsidiaries 2,954,748 2,954,748 - 59,879 59,879Investment properties - 816,994 1,303,680 1,288,680 1,275,780Property, plant and equipment 806,082 770,413 673,562 598,856 555,907Intangible assets - software 76,620 36,245 31,027 26,333 40,186Deferred tax assets 18,790 187,843 175,804 170,722 135,929Statutory deposits 500,000 500,000 500,000 500,000 500,000Total Assets
18,368,248
17,919,118
14,894,672
13,962,425
11,807,686
LIABILITIES Investment contract liabilities 2,353,766 1,712,048 1,322,472 1,303,049 1,229,957Insurance contract liabilities 6,307,846 4,862,365 4,401,107 4,528,243 3,653,933Trade payables 452,649 331,222 319,482 518,337 176,670Other payables 634,631 616,758 599,453 548,296 615,028Finance lease obligations - - - 758Income tax liabilities 302,091 246,725 87,199 90,268 73,932Employees retirement benefit obligations 7,750 7,523 8,145 7,967 37,602Total Liabilities
10,058,733
7,776,641
6,737,858
6,996,160
5,787,880
EQUITY Share capital and reserves: Ordinary share capital 7,364,754 7,364,754 4,410,005 4,410,005 4,410,005Share premium 1,947,166 1,947,166 1,947,166 1,947,166 1,947,166Treasury shares (48,175) (48,175) (48,175) (48,175) (48,175)Contingency reserve 1,735,400 1,519,802 1,348,770 1,148,801 975,978Retained earnings (2,689,630) (641,070) 499,048 (491,532) (1,265,168)
Total Equity 8,309,515 10,142,477 8,156,814 6,966,265 6,019,806
Total Equity & Liabilities 18,368,248 17,919,118 14,894,672 13,962,425 11,807,686
Statement of Profit or Loss & Other Comprehensive Income Gross premium written 8,389,950 7,331,633 5,211,966 5,313,223 4,619,959 Gross premium income 7,768,850 7,119,632 5,187,098 4,622,737 4,525,046 (Loss)/profit before taxation (1,516,213) (332,139) 1,390,165 940,615 399,654 Taxation credit/(charge) (373,574) (203,374) (107,819) (8,756) 34,327
(Loss)/profit after taxation
(1,889,787)
(535,513)
1,282,346
931,859
433,981
- -
-- -
-
-
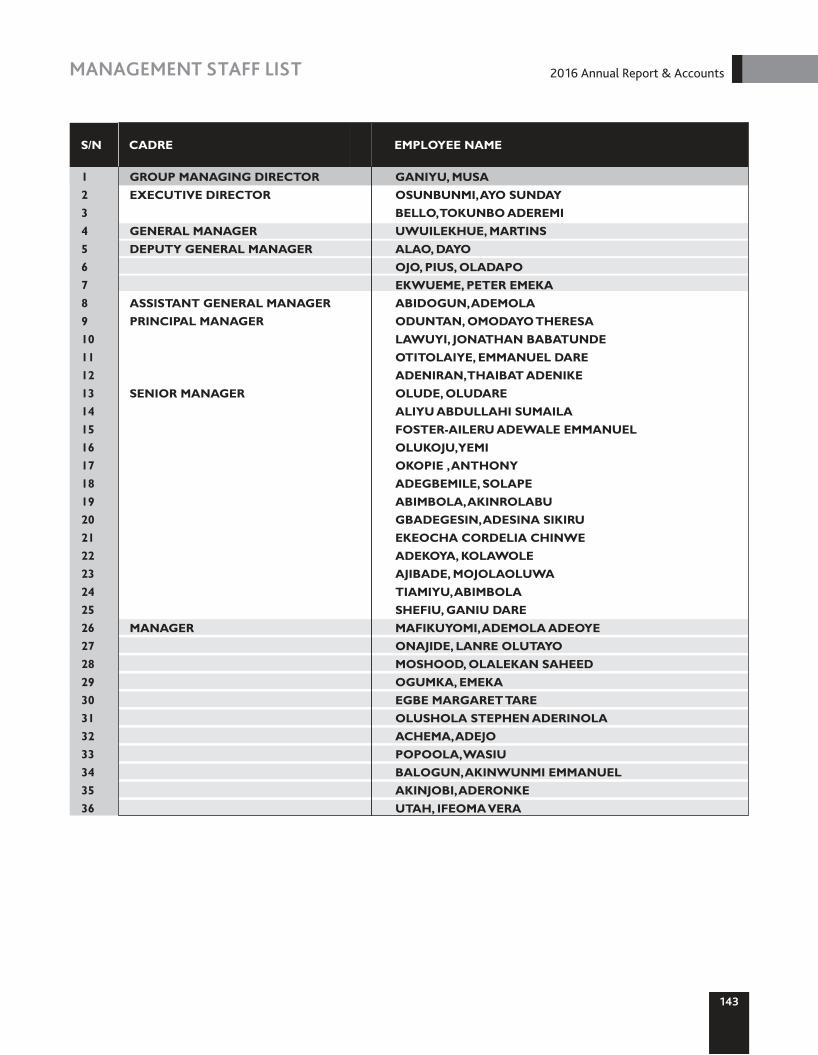
MANAGEMENT STAFF LIST 2016 Annual Report & Accounts
2143
123456789101112131415161718192021222324252627282930313233343536
GROUP MANAGING DIRECTOREXECUTIVE DIRECTOR
GENERAL MANAGERDEPUTY GENERAL MANAGER
ASSISTANT GENERAL MANAGERPRINCIPAL MANAGER
SENIOR MANAGER
MANAGER
GANIYU, MUSAOSUNBUNMI, AYO SUNDAYBELLO, TOKUNBO ADEREMIUWUILEKHUE, MARTINSALAO, DAYOOJO, PIUS, OLADAPOEKWUEME, PETER EMEKAABIDOGUN, ADEMOLAODUNTAN, OMODAYO THERESALAWUYI, JONATHAN BABATUNDEOTITOLAIYE, EMMANUEL DAREADENIRAN, THAIBAT ADENIKEOLUDE, OLUDAREALIYU ABDULLAHI SUMAILAFOSTER-AILERU ADEWALE EMMANUELOLUKOJU, YEMIOKOPIE , ANTHONYADEGBEMILE, SOLAPEABIMBOLA, AKINROLABUGBADEGESIN, ADESINA SIKIRUEKEOCHA CORDELIA CHINWEADEKOYA, KOLAWOLEAJIBADE, MOJOLAOLUWATIAMIYU, ABIMBOLASHEFIU, GANIU DAREMAFIKUYOMI, ADEMOLA ADEOYEONAJIDE, LANRE OLUTAYOMOSHOOD, OLALEKAN SAHEEDOGUMKA, EMEKAEGBE MARGARET TAREOLUSHOLA STEPHEN ADERINOLAACHEMA, ADEJOPOPOOLA, WASIUBALOGUN, AKINWUNMI EMMANUELAKINJOBI, ADERONKEUTAH, IFEOMA VERA
S/N CADRE EMPLOYEE NAME

144
TABLE OF CONTENT SHARE CAPITAL HISTORY 2016 Annual Report & Accounts
DateAuthorized Share Capital Value(N) Shares
Issued & Fully Paid Value (N) Shares Consideration
19911992199319941995199619971998199920002001200220032004200520062007200820092010201120122013201420152016
5,000,000 10,000,000 10,000,000 20,000,000 30,000,000 50,000,000
100,000,000 100,000,000 100,000,000 175,000,000 175,000,000 400,000,000 750,000,000 750,000,000
3,000,000,000 3,000,000,000 5,000,000,000 5,000,000,000 5,000,000,000 5,000,000,000 5,000,000,000 5,000,000,000 5,000,000,000 5,000,000,000 5,000,000,000 7,500,000,000
5,000,000 10,000,000 10,000,000 20,000,000 60,000,000
100,000,000 200,000,000 200,000,000 350,000,000 350,000,000 350,000,000 800,000,000
1,500,000,000 1,500,000,000 6,000,000,000 6,000,000,000
10,000,000,000 10,000,000,000 10,000,000,000 10,000,000,000 10,000,000,000 10,000,000,000 10,000,000,000 10,000,000,000 10,000,000,000 15,000,000,000
5,000,000 10,000,000 10,000,000 10,000,000 25,000,000 37,500,000 70,000,000 70,000,000
100,000,000 175,000,000 175,000,000 210,000,000 378,000,000 557,768,000 982,274,000
2,160,903,000 4,410,005,181.50 4,410,005,181.50 4,410,005,181.50 4,410,005,181.50 4,410,005,181.50 4,410,005,181.50 4,410,005,181.50 4,410,005,181.50 4,410,005,181.50 7,364,799,306.50
5,000,000 10,000,000 10,000,000 10,000,000 50,000,000 75,000,000
140,000,000 140,000,000 200,000,000 350,000,000 350,000,000 420,000,000 756,000,000
1,115,536,000 1,964,548,000 4,321,806,000 8,820,010,363 8,820,010,363 8,820,010,363 8,820,010,363 8,820,010,363 8,820,010,363 8,820,010,363 8,820,010,363 8,820,010,363 14,729,598,613
Private PlacementRights Issue -Rights IssueBonusBonusPrivate PlacementPrivate PlacementBonusRights Public Offer -BonusBonusRights OfferBonusPublic OfferPlacing---------
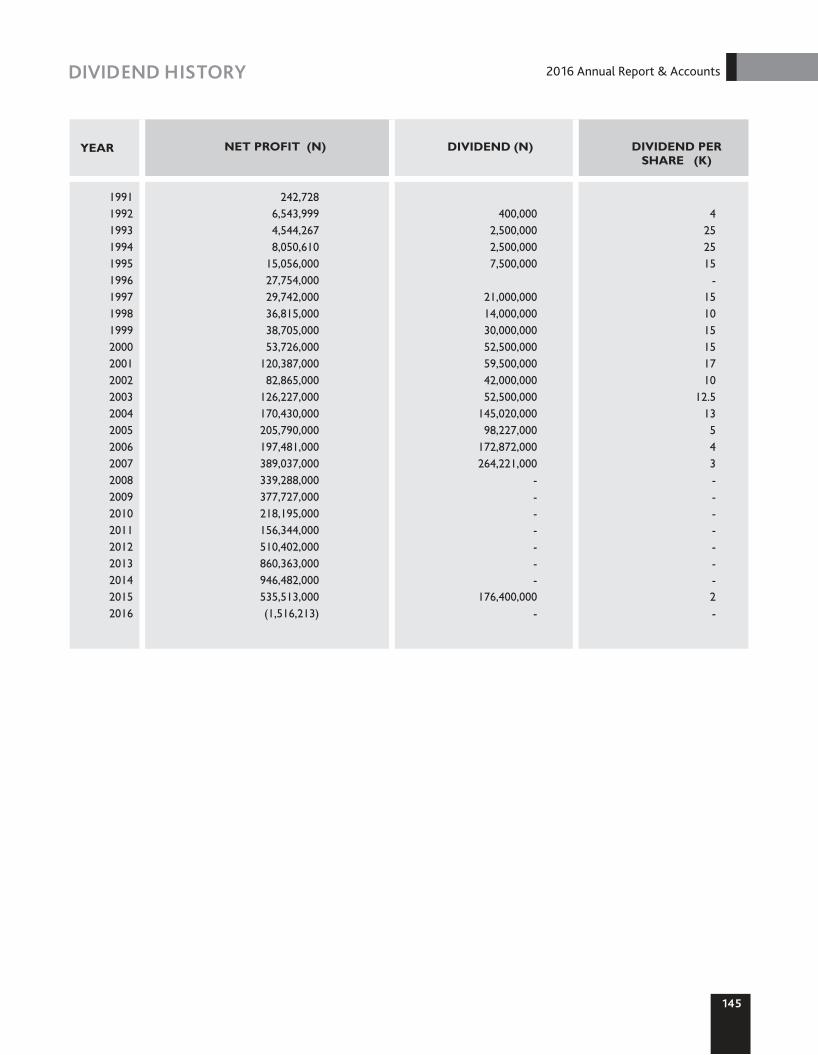
145
DIVIDEND HISTORY 2016 Annual Report & Accounts
YEAR NET PROFIT (N) DIVIDEND (N) DIVIDEND PER SHARE (K)
19911992199319941995199619971998199920002001200220032004200520062007200820092010201120122013201420152016
242,7286,543,9994,544,2678,050,610
15,056,00027,754,00029,742,00036,815,00038,705,00053,726,000
120,387,00082,865,000
126,227,000170,430,000205,790,000197,481,000389,037,000339,288,000377,727,000218,195,000156,344,000510,402,000860,363,000946,482,000535,513,000(1,516,213)
400,0002,500,0002,500,0007,500,000
21,000,00014,000,00030,000,00052,500,00059,500,00042,000,00052,500,000
145,020,00098,227,000
172,872,000264,221,000
-------
176,400,000-
4252515
-151015151710
12.513543-------2-

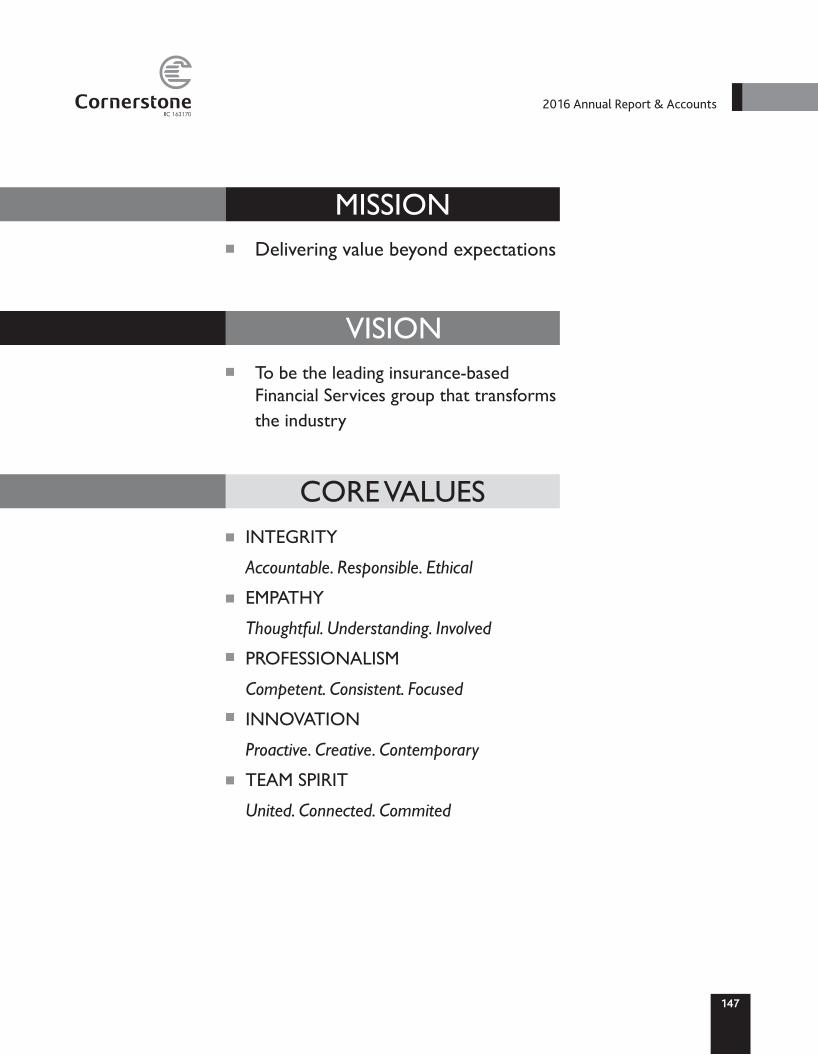
TABLE OF CONTENT
147
2016 Annual Report & AccountsRC 163170
CORE VALUES
VISION
Delivering value beyond expectations
To be the leading insurance-basedFinancial Services group that transformsthe industry
INTEGRITY
Accountable. Responsible. Ethical
EMPATHY
Thoughtful. Understanding. Involved
PROFESSIONALISM
Competent. Consistent. Focused
INNOVATION
Proactive. Creative. Contemporary
TEAM SPIRIT
United. Connected. Commited
MISSION
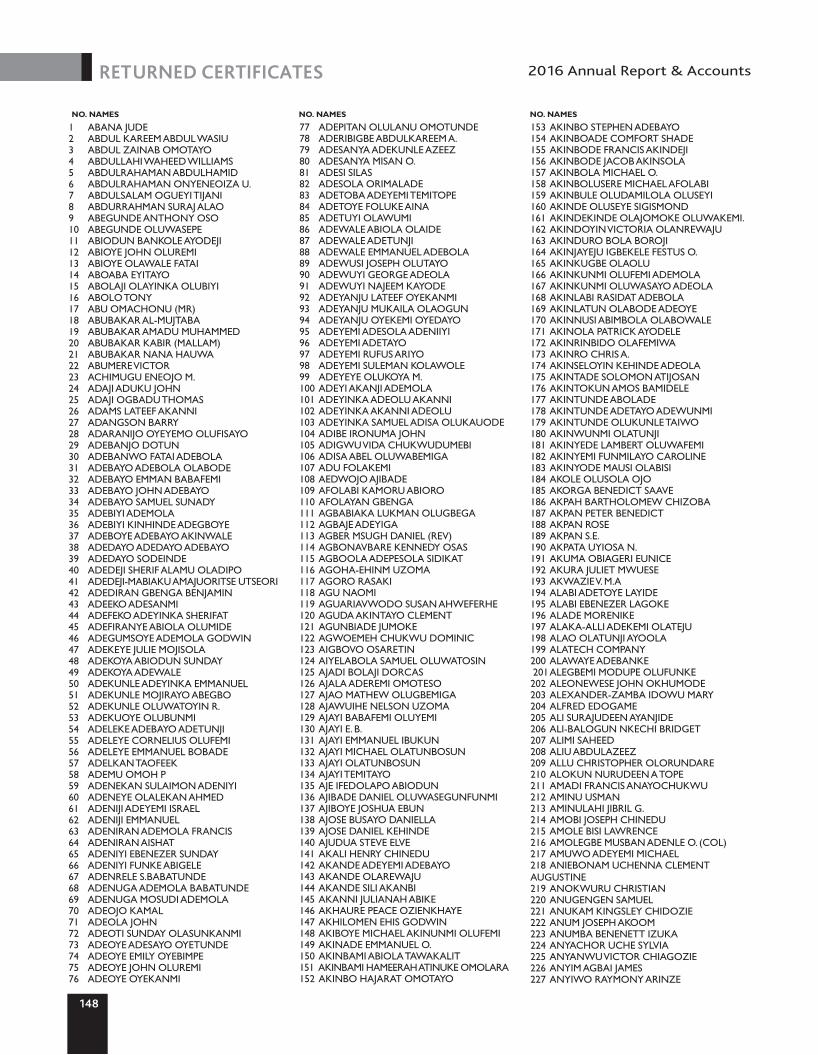
2148
RETURNED CERTIFICATES 2016 Annual Report & Accounts
1 ABANA JUDE2 ABDUL KAREEM ABDUL WASIU3 ABDUL ZAINAB OMOTAYO4 ABDULLAHI WAHEED WILLIAMS5 ABDULRAHAMAN ABDULHAMID6 ABDULRAHAMAN ONYENEOIZA U.7 ABDULSALAM OGUEYI TIJANI8 ABDURRAHMAN SURAJ ALAO9 ABEGUNDE ANTHONY OSO10 ABEGUNDE OLUWASEPE11 ABIODUN BANKOLE AYODEJI12 ABIOYE JOHN OLUREMI13 ABIOYE OLAWALE FATAI14 ABOABA EYITAYO15 ABOLAJI OLAYINKA OLUBIYI16 ABOLO TONY17 ABU OMACHONU (MR)18 ABUBAKAR AL-MUJTABA19 ABUBAKAR AMADU MUHAMMED20 ABUBAKAR KABIR (MALLAM)21 ABUBAKAR NANA HAUWA22 ABUMERE VICTOR23 ACHIMUGU ENEOJO M.24 ADAJI ADUKU JOHN25 ADAJI OGBADU THOMAS26 ADAMS LATEEF AKANNI27 ADANGSON BARRY28 ADARANIJO OYEYEMO OLUFISAYO29 ADEBANJO DOTUN30 ADEBANWO FATAI ADEBOLA31 ADEBAYO ADEBOLA OLABODE32 ADEBAYO EMMAN BABAFEMI33 ADEBAYO JOHN ADEBAYO34 ADEBAYO SAMUEL SUNADY35 ADEBIYI ADEMOLA36 ADEBIYI KINHINDE ADEGBOYE37 ADEBOYE ADEBAYO AKINWALE38 ADEDAYO ADEDAYO ADEBAYO39 ADEDAYO SODEINDE40 ADEDEJI SHERIF ALAMU OLADIPO41 ADEDEJI-MABIAKU AMAJUORITSE UTSEORI42 ADEDIRAN GBENGA BENJAMIN 43 ADEEKO ADESANMI44 ADEFEKO ADEYINKA SHERIFAT45 ADEFIRANYE ABIOLA OLUMIDE46 ADEGUMSOYE ADEMOLA GODWIN47 ADEKEYE JULIE MOJISOLA48 ADEKOYA ABIODUN SUNDAY49 ADEKOYA ADEWALE50 ADEKUNLE ADEYINKA EMMANUEL51 ADEKUNLE MOJIRAYO ABEGBO52 ADEKUNLE OLUWATOYIN R.53 ADEKUOYE OLUBUNMI54 ADELEKE ADEBAYO ADETUNJI55 ADELEYE CORNELIUS OLUFEMI56 ADELEYE EMMANUEL BOBADE57 ADELKAN TAOFEEK58 ADEMU OMOH P59 ADENEKAN SULAIMON ADENIYI60 ADENEYE OLALEKAN AHMED61 ADENIJI ADEYEMI ISRAEL62 ADENIJI EMMANUEL 63 ADENIRAN ADEMOLA FRANCIS64 ADENIRAN AISHAT65 ADENIYI EBENEZER SUNDAY66 ADENIYI FUNKE ABIGELE67 ADENRELE S.BABATUNDE68 ADENUGA ADEMOLA BABATUNDE69 ADENUGA MOSUDI ADEMOLA70 ADEOJO KAMAL71 ADEOLA JOHN72 ADEOTI SUNDAY OLASUNKANMI73 ADEOYE ADESAYO OYETUNDE74 ADEOYE EMILY OYEBIMPE75 ADEOYE JOHN OLUREMI76 ADEOYE OYEKANMI
77 ADEPITAN OLULANU OMOTUNDE78 ADERIBIGBE ABDULKAREEM A.79 ADESANYA ADEKUNLE AZEEZ80 ADESANYA MISAN O.81 ADESI SILAS82 ADESOLA ORIMALADE83 ADETOBA ADEYEMI TEMITOPE84 ADETOYE FOLUKE AINA85 ADETUYI OLAWUMI86 ADEWALE ABIOLA OLAIDE87 ADEWALE ADETUNJI88 ADEWALE EMMANUEL ADEBOLA89 ADEWUSI JOSEPH OLUTAYO90 ADEWUYI GEORGE ADEOLA91 ADEWUYI NAJEEM KAYODE92 ADEYANJU LATEEF OYEKANMI93 ADEYANJU MUKAILA OLAOGUN94 ADEYANJU OYEKEMI OYEDAYO95 ADEYEMI ADESOLA ADENIIYI96 ADEYEMI ADETAYO97 ADEYEMI RUFUS ARIYO98 ADEYEMI SULEMAN KOLAWOLE99 ADEYEYE OLUKOYA M.100 ADEYI AKANJI ADEMOLA101 ADEYINKA ADEOLU AKANNI102 ADEYINKA AKANNI ADEOLU103 ADEYINKA SAMUEL ADISA OLUKAUODE104 ADIBE IRONUMA JOHN105 ADIGWU VIDA CHUKWUDUMEBI106 ADISA ABEL OLUWABEMIGA107 ADU FOLAKEMI108 AEDWOJO AJIBADE109 AFOLABI KAMORU ABIORO110 AFOLAYAN GBENGA111 AGBABIAKA LUKMAN OLUGBEGA112 AGBAJE ADEYIGA113 AGBER MSUGH DANIEL (REV)114 AGBONAVBARE KENNEDY OSAS115 AGBOOLA ADEPESOLA SIDIKAT116 AGOHA-EHINM UZOMA117 AGORO RASAKI118 AGU NAOMI119 AGUARIAVWODO SUSAN AHWEFERHE120 AGUDA AKINTAYO CLEMENT121 AGUNBIADE JUMOKE122 AGWOEMEH CHUKWU DOMINIC123 AIGBOVO OSARETIN124 AIYELABOLA SAMUEL OLUWATOSIN125 AJADI BOLAJI DORCAS126 AJALA ADEREMI OMOTESO127 AJAO MATHEW OLUGBEMIGA128 AJAWUIHE NELSON UZOMA129 AJAYI BABAFEMI OLUYEMI130 AJAYI E. B.131 AJAYI EMMANUEL IBUKUN132 AJAYI MICHAEL OLATUNBOSUN133 AJAYI OLATUNBOSUN134 AJAYI TEMITAYO135 AJE IFEDOLAPO ABIODUN136 AJIBADE DANIEL OLUWASEGUNFUNMI137 AJIBOYE JOSHUA EBUN138 AJOSE BUSAYO DANIELLA139 AJOSE DANIEL KEHINDE140 AJUDUA STEVE ELVE141 AKALI HENRY CHINEDU142 AKANDE ADEYEMI ADEBAYO143 AKANDE OLAREWAJU144 AKANDE SILI AKANBI145 AKANNI JULIANAH ABIKE146 AKHAURE PEACE OZIENKHAYE147 AKHILOMEN EHIS GODWIN148 AKIBOYE MICHAEL AKINUNMI OLUFEMI149 AKINADE EMMANUEL O.150 AKINBAMI ABIOLA TAWAKALIT151 AKINBAMI HAMEERAH ATINUKE OMOLARA152 AKINBO HAJARAT OMOTAYO
153 AKINBO STEPHEN ADEBAYO154 AKINBOADE COMFORT SHADE155 AKINBODE FRANCIS AKINDEJI156 AKINBODE JACOB AKINSOLA157 AKINBOLA MICHAEL O.158 AKINBOLUSERE MICHAEL AFOLABI159 AKINBULE OLUDAMILOLA OLUSEYI160 AKINDE OLUSEYE SIGISMOND161 AKINDEKINDE OLAJOMOKE OLUWAKEMI.162 AKINDOYIN VICTORIA OLANREWAJU163 AKINDURO BOLA BOROJI164 AKINJAYEJU IGBEKELE FESTUS O.165 AKINKUGBE OLAOLU166 AKINKUNMI OLUFEMI ADEMOLA167 AKINKUNMI OLUWASAYO ADEOLA168 AKINLABI RASIDAT ADEBOLA169 AKINLATUN OLABODE ADEOYE170 AKINNUSI ABIMBOLA OLABOWALE171 AKINOLA PATRICK AYODELE172 AKINRINBIDO OLAFEMIWA173 AKINRO CHRIS A.174 AKINSELOYIN KEHINDE ADEOLA175 AKINTADE SOLOMON ATIJOSAN176 AKINTOKUN AMOS BAMIDELE177 AKINTUNDE ABOLADE178 AKINTUNDE ADETAYO ADEWUNMI179 AKINTUNDE OLUKUNLE TAIWO180 AKINWUNMI OLATUNJI181 AKINYEDE LAMBERT OLUWAFEMI182 AKINYEMI FUNMILAYO CAROLINE183 AKINYODE MAUSI OLABISI184 AKOLE OLUSOLA OJO185 AKORGA BENEDICT SAAVE186 AKPAH BARTHOLOMEW CHIZOBA187 AKPAN PETER BENEDICT188 AKPAN ROSE189 AKPAN S.E.190 AKPATA UYIOSA N.191 AKUMA OBIAGERI EUNICE192 AKURA JULIET MWUESE193 AKWAZIE V. M.A194 ALABI ADETOYE LAYIDE195 ALABI EBENEZER LAGOKE196 ALADE MORENIKE197 ALAKA-ALLI ADEKEMI OLATEJU198 ALAO OLATUNJI AYOOLA199 ALATECH COMPANY200 ALAWAYE ADEBANKE 201 ALEGBEMI MODUPE OLUFUNKE202 ALEONEWESE JOHN OKHUMODE203 ALEXANDER-ZAMBA IDOWU MARY204 ALFRED EDOGAME205 ALI SURAJUDEEN AYANJIDE206 ALI-BALOGUN NKECHI BRIDGET207 ALIMI SAHEED208 ALIU ABDULAZEEZ209 ALLU CHRISTOPHER OLORUNDARE210 ALOKUN NURUDEEN A TOPE211 AMADI FRANCIS ANAYOCHUKWU212 AMINU USMAN213 AMINULAHI JIBRIL G.214 AMOBI JOSEPH CHINEDU215 AMOLE BISI LAWRENCE216 AMOLEGBE MUSBAN ADENLE O. (COL)217 AMUWO ADEYEMI MICHAEL218 ANIEBONAM UCHENNA CLEMENT AUGUSTINE219 ANOKWURU CHRISTIAN220 ANUGENGEN SAMUEL221 ANUKAM KINGSLEY CHIDOZIE222 ANUM JOSEPH AKOOM223 ANUMBA BENENETT IZUKA224 ANYACHOR UCHE SYLVIA225 ANYANWU VICTOR CHIAGOZIE 226 ANYIM AGBAI JAMES227 ANYIWO RAYMONY ARINZE
NO. NAMES NO. NAMES NO. NAMES

2149
2016 Annual Report & AccountsRETURNED CERTIFICATES CONTD
228 ARE ADERONKE MODINAT229 ARE OLANIYI IFEOLUWA230 AREGBESOLA MOTUNRAYO A.231 AREMU JULIANA IKEOLU232 ARIBISALA SOLOMON OJO233 ARUNA SURAJ TEMITOPE234 ASABIA CONSTANT AKINFOLAYAN235 ASARE-BEDIAKON MIKE236 ASHOGBON JAMIU SHINA MR. & MRS237 ASUNI BAYO238 ATANE NICHOLAS239 ATEKOJA ADEFISAYO240 ATIEGOBA ANNE IFEANYI241 ATTAH EDEGBO DANIEL242 ATTAH IKO VICTOR243 ATU SUNDAY ATSON244 ATUKUN SAMUEL BITRUS245 AUDU AISHA GOD'S GIFT246 AUDU SALIU TIJANY247 AVANTE CAPITAL PARTNER248 AWA-OSAJE PHINA249 AWESU OLUKAYODE250 AWOBAJO MICHAEL OLAYIMIKA251 AWOKOYA OLUSEGUN OLAWALE252 AWOLU FRANZ SEGUN253 AWONIYI OLUFEMI ADEWALE254 AWONUGA AYODEJI OLU (MR&MRS)255 AWOSANYA OLUSEGUN OLASUPO256 AWOYOMI JOHNSON OLU257 AYENI JOSEPH ABIODUN258 AYIDU DONATUS259 AYOADE C. IDOWU ADEBUSOYI260 AYODELE EMMANUEL O.261 AYODELE OMOLARA262 AYODELE TALABI263 AYODELE WASIU OLALEKAN264 AYORINDE CAROLINE ABOSEDE265 AYORINDE DELE266 AYOTUNDE SALU267 AZEEZ FIMISOLA A.268 AZUBUIKE FELIX ONYEDIKACHI269 BABALOLA OLANREWAJU270 BABALOLA RAFIU SIYANBOLA271 BABARINDE OYEBAMIJI KEHINDE272 BABATUNDE ADEKUNLE M.273 BABATUNDE IBIRONKE274 BADARU EZE KEHINDE275 BADIRU BOLANLE276 BADMUS TEMITOPE MUINAT277 BADRU IBRAHIM ADEBAYO278 BAIYE EUNICE AYOKA MRS279 BAKARE ADEBISI OLUWAYEMISI280 BAKARE AISHA BUKOLA281 BAKARE LATEEF ABDUL282 BAKARE WASIU ADIO283 BAKO PATIENCE 284 BALOGUN AKINOLA 285 BALOGUN SARATA IYABO286 BALOGUN TAOFIQ OLAWALE287 BALOGUUN MOSHOOD ISHOLA288 BALUCHI BEHRAM SHERO289 BAMIDELE ALFRED AYOOLA290 BAMIDELE HAMBOLU291 BAMIDELE MORUF292 BAMIGBOJE ABRAHAM O293 BAMIGBOJE PHEBEAN ADEBUKUNOLA294 BAMIGBOJE V. ZACHEUS OYEWOLE295 BAMMEKE AYO296 BANJOKO OLADELE297 BAPETEL IBRAHAM298 BATIDO SYSTMS LIMITED299 BAYODE DAMOLA BOSEDE300 BEBETEIDOH ALEXANDRA T.301 BEBETEIDOH LAURYN OYIN302 BEBETEIDOH PAULA-YOUNG
303 BEBETEIDOH WISDOM304 BELADE JANET305 BELADE JANET OLUFUNKE306 BELLO ABDULAZEEZ OLUWAFEMI307 BELLO GBOLAHAN308 BELLO RASHIDAT MORENIKE309 BELLO SIKIRU ADETINKA310 BELLO TAWAKALIT OLAYINKA311 BENSON OLAYEMI312 BIRIYOK CASIMIR313 BISIRIYU MUTIU OLUWASEYI314 BLANKSON AMPIM GOGO315 BOLARINWA JACOB AYODEJI316 BOLARINWANRA SHEED RAJI317 BONIFACE A. DURU318 BROLBAK INTERNATIONAL LTD319 BUKOL NIGERIA LTD320 BUSARI TEMITOPE FAUSAT321 CANOGA ESTATE & PROPETY SERV. LTD.322 CAPIMS NIG. LTD323 CAPITAL PROVIDERS SEC. LTD.324 CAPITAL TRUST BRKS LTD TRADED A/C325 CASHCRAFT ASSET-DESPOSIT A/C326 CAVESCO INVESTMENT COY LTD327 CENTURY SECURITIES LTD328 CHALLSON NYIAM329 CHART INVESTMENTS LTD330 CHINRA PAUL CHUKWURAH331 CHINWOKWU VICTOR332 CHUKWU ANYAOGU AWARA333 CHUKWUKA NDULUE DOMINIC334 CHUKWUMA MEGAFU335 CLARION & MARK LTD336 COATLAND SECURITY CONSULT & SERVICE337 COKER TOPE MICHAEL338 CORE TRUST & INVEST339 COUNTERS TRUST SECURITIES LTD340 DADA ISHOLA ADELOYE341 DADA MOTUNDE342 DAHUNSI ARINOLA OLUWAYOMI343 DAMOLA ADENIRAN344 DARAMOLA ELIJAH OLUWASEUN345 DARE ADESOLA ADEBAYO346 DE BUSINESS NETWORK LTD347 DE-CANON INVESTMENT LTD348 DELE ADENIYI349 DIKE FRANKLIN IFEDINACHUKWU350 DIMKA ISAAC YILJI ZAKARI351 DIMOWO OLUWATOYIN352 DIVINE NOBLE FAITH VENTURES353 DOKPESI OLUWATOSIN ABIMBOLA354 DOKUN AFOLABI355 DOSUNMU ADENIKE S.356 DOSUNMU OLUWOLE ROGER357 DOSUNMU SIDIQUAT FOLASHADE358 DUOPAMA OBOMANU BOMA359 DUROSINMI-ETTI OLUFUNMILAYO TITI360 DURU CHIKA ANN361 DUYILEMI FEMI EDWARD362 DYITKUKA EIRENEH PWANMWAKAT363 EBENUWAH ANTHONY N.364 EDEKOBI NNAMDI PIUS365 EDOZIE JOHN U.366 EDUZOR OGUGUA367 EGIE EDAFE EMMANUEL368 EGOPIJA JULIANA AYUWU369 EGUBE EJIROGHENE THEODORE370 EGUBE GAB. EJIRO371 EGUNYOMI AKINLOLU S.372 EGWOBA CHRISTOPHER UZODINMA373 EHIGIEGBA ENORENSE PHILIP374 EHIY CHRISTOPHER OSEGHALE375 EJEMUTA ISAAC376 EKE ALOYSIUS ONYEMAUCHE377 EKE CHRISTIAN OBIAGERI
378 EKE IFEOMA JECENTA379 EKE MICHAEL NNAMDI380 EKEBOR SILAS C.381 EKEJIUBA UCHENNA EKEJIUBA S.382 EKEMODE JILIUS OLUTOPE383 EKEOBA ANTHONY OSAMHON384 EKERIN GANIYU ADEBISI385 EKHATOR AYGYSTINE OSAMUDIMEN386 EKONG ANDIKAN CHARLES387 EKONG IBIYE ASME388 EKONG UDEME MICHAEL389 EKPO USORO EKANEM390 EKUN PHILOMINA ILEYEMI TINUOLA391 EKWEALOR NORAH I.392 EKWEMALOR N. STELLA393 ELERI NICHOLAS394 ELETU OLASEIDE BABATUNDE (DR)395 ELIAS ADEPEJU RAMILAT396 ELUHAIWE PAUL NDUKA397 ELUJOBA AYOOLA OLABISI398 ELUYEFA PETER399 EMENIKE CHLOO G.400 EMENIKE CHUKWUEMEKA CHRISTIAN401 EMENIKE DONATUS402 EMERUWA PRISCILIA O.403 EMMANUEL MONDAY SAMSON404 EMOEFE DAFE ESERO405 EMORDI NKIRUKA VERONICA406 ENEH RICHARD O.407 ENEMANNA CHUKWUEMEKA .C.408 ENIKUOMEHIN CHRISTIAN OMOTEREM409 ENOEFE DAFE ESERO410 ERONMOMMOSELE VINCENT411 ESAN ADEWONULA OLUKEMI412 ESEGBA DEBORAH EGUONO413 ESEHA AUGUSTINE ENEJETA414 ESEHA OMAMIRO OLUWASEYI415 ESENE JOSEPH KELLY416 ESO ADEBAYO JOSEPH417 ESSIEN FRIDAY ENANG418 ETTA CLAUDIA IGUO419 EVBUOMWAN OMOREGIE JIMMY420 EWEJE JOHN AJIBOLA421 EWETO J. ONOBEREVU422 EWULO ORIYIMI FELIX423 EYA OLIVER AMA424 EYONG FRANCIS425 EZEALA GEORGE426 EZEGO N. I .H CLEMENT427 EZEH ANI JOHN428 EZEH CHIKA VICTOR429 F.N.C. IGWE ENTR NIG. LTD430 FADARE CHIOMA PRECIOUS431 FADE ANTHONY ADEMOLU432 FADINA OLUGBEGA433 FALADE MUDIRAT MORENIKE434 FALAEYE LATEEF FOLORUNSHO435 FALANO OLUEYMI436 FALUSI CALEB OJO437 FAM CAB NIG. LTD438 FAMAKINWA ADEDOYIN439 FAMILUGBA ADEBISI440 FAMORIYO SILIFAT MOSUNMOLA ADENEYE441 FARRI ENIOLA442 FASHETIRE FUNSHO443 FASOGBON ADEBISI444 FATAI B. OWODUNMI445 FATANMI COLSON OLADAPO446 FATGBE KOLAWOLE OLUFEMI447 FATINIKUN TUNDE448 FATOGUN B. O.449 FATUBARIN SAMUEL FOLORUNSO450 FOWLER ADEYINKA I.451 FRANCES O. AYEWOH452 FRANK AKPAN
NO. NAMES NO. NAMES NO. NAMES

2150
2016 Annual Report & AccountsRETURNED CERTIFICATES CONTD.
453 FUEL NOMINEE A/C454 FUTURE VIEW SECURITIES LTD455 GANIIYU AFOLABI MORUFU456 GANIYU IYABO457 GBARAB EMMANUEL LEGIA458 GBEYIDE OLUWOLE EMMANUEL459 GBOLAGUNTE ADEGBOYE AYINLA460 GBUN JOY NWUESE461 GEORGE SELEIPIRI IWURU462 GOERGE-HART CLADYS N.463 GOJE BLESSED SANI464 GOLD AMBROSE PHILIP465 GREEN LOUIS OLAKUNLE466 HABEEBAT AINOGBO467 HALIDU-GIWA ABDULMAIK468 HALLIBURTON P/HARCOURT CO-OP.469 HARIGOLD VENURES LTD470 HARRY AYIBO471 HARUNA ABUBAKAR472 HASSAN OLAREWAJU AFIS473 HOLLOWAY JOLASUN474 HUSSAINI HAMIDU475 HWAKAR HENRY GBAASOM476 IBE CHIBUZOR EMMANUEL477 IBE LOUIS EMEFU478 IBEGBULEM CHUKA ONOCHIE479 IBEKWE GODFREY NWABUEZE480 IBIDOJA KAROL IFEYINWA481 IBINE OLAYIWOLA JETHRO482 IBITOYE TOLU483 IBRAHEEM ABDUL-GAFAR O. 2 IBIK484 IBRAHEEM WAKEELAT O. 2 IBIK485 IBRAHIM ABDULKAREEM MAJID486 IBRAHIM MUHAMMED AUDU487 IBRAHIM SHAMSUDEEN SAEED488 IBTA TRUST & INVESTMENT LTD489 IDAKWO JOHN U.490 IDELE ROSEMARY OMOZEFE491 IDORNIGIE SUNDAY PIUS492 IDOWU FAOSAT OLAYINKA493 IDOWU JOHNSON ADEYI494 IDOWU PASCHAL ADELEKE495 IDOWU SAMUEL FOLORUNSHO496 IFATUJOSIN S. BABATOPE497 IFEBUEME JULIET OGECHUKWU498 IFEKWE IFEOMA MERCY499 IFEMADE OLUBUKOLA OMOLOLA500 IGBEN LESLIE DONOR501 IGBINOVIA NEWTON NOSA 502 IGBOKWE IWUEJINA AUGUSTINE503 IGIEBOR AMADIN WILFRED504 IHEAKA NKEIRUKA CHARITY505 IHEUKO STANLEY506 IKEAKANAM RAPHAEL507 IKEANEKE OBIAGELI508 IKEGWUANI ONOCHIE OBIESIE509 IKEM AUGUSTINE OGOEGBUNAM510 IKHELOA JOSEPHINE O.511 IKOGWE ADEBOLA OLUBUNMI512 IKOLO EZEKIEL OMAYAYERHWE513 IKPIRHIRHIN ONAEFE BLESSING514 IKPON SUNDAY E.515 IKUYIMINU OLANIY516 IKWEONYE A. IFEANYICHUKWU517 ILAVBARHE MUSAH ORIVBABEHI518 ILELEJI ERNEST519 ILOH EMMANUEL NNAEMEKA520 IMAM TAIYE ABDUL521 IMONA PETER OSEDEBIAMWEN522 INDEPENDENT SEC. LTD523 INIYEZO EMMANUEL OGHENEOVO524 INVESTS. STRATEGIE LTD.525 INYANG MORGAN JOHNSON526 INYANG REBECCA EFFIONG527 IRABOR HUMPHREY528 IREYOMI IYANIWURA ADERINOLA
529 ISAAC VICTOR IME530 ISHIORHOVOJA O. ANDREA531 ISIGUZO UGOCHUKWU532 ISTIFANUS MURINA533 ITANOLA NURAIN OMOTAYO534 ITF A. DAVID BOLUWA535 ITF A. DAVID BOLUWATIFE536 ITONYO VICTOR WILFRED537 IWAN VICTOR TERKIMBI538 IWERE TED539 IWUJI FRANCISCA AGATHA O.540 IYAMU OMORUYI C.541 IYIOLA A. & SONS542 IYORE EMMANUEL O.543 IZU LIVINGSTONE CLITON544 IZUKA IHEANYI AUGUSTINE O.545 J&P LAUNDRY AND DRYCL546 JABAR MOSHOOD OLAYIDE547 JACKSON-COLE FREDRICK E. O.548 JACOB BABATUNDE BOLAJI 549 JADOT ASSOCIATIES LTD.550 JAGA MICHAEL551 JAGA OLUBUKOLA BOSEDE552 JAGUN OMOFEHINTOLA553 JAIYEOLA CHARLES EKUNDAYO554 JAIYEOLA MOSES555 JAIYESIMI OLUFEMI556 JAJA-WACKUKU EMENUWA ANUGHA557 JALO Y OLGA558 JAMES KITWA559 JAMES OLUSEGUN MICHAEL560 JATAU EMMANUEL MONDAY561 JAWANDO OLUWAKEMI O.562 JAWO JOHNSON563 JAWO JOHNSON OLAKUNLE564 JEGEDE COMFORT SALAMAT565 JEGEDE RUFUS BABALOLA566 JEREMIAH AGBO567 JEROME JIMOH568 JIBARTO NIG. LTD569 JIMOH TAJUDEEN AKANNI570 JINADU FATAI ABOLORE571 JIYA ATTAI JIBRIN572 JOHN ADEWUMI O. OPADOKUN573 JOHN OMOSA ODUNTAN574 JOHNSON ABIMBOLA575 JOHNSON ABAYOMI (OEMA)576 JOHNSON ADEOLA577 JOHNSON BABATUNDE578 JOHNSON EDWARD579 JOHNSON MOBOLAGI O580 JOHNSON OLAWALE581 JOLADEM COMPANY582 KADRI KAMAL ADISA583 KASALI TAIWO584 KASSIM HADIZA585 KAYODE TIMOTHY OLUFEMI586 KENEDY AGBAEZE587 KENKU KEHINDE OMOLABI588 KENKU TAIWO AFOLABI589 KENNETH NWADIKE590 KERERE-EKUN SAIHEED RAHUF591 KESINRO JOS OLU592 KESSELLY YOUNGAH CECELIA593 KIPUPU NGAMUNONO AMIYOO594 KOLAJO JIMOH A595 KOLAPO ARINLADE ARIKE596 KOLARINWA REMI597 KOLE FUNSHO598 KOSOKO ZUBAIR ABIODUN599 KOVAME FRANCISCA ADEKUNBI600 KREUGER BRENT LTD.601 KUE YEGHENEE NNA602 KUFORIJI NATHANIEL OLANREWAJU603 KUTENHA DARLINGTON604 LADABOT NOMINEES LTD.
605 LAIZER JOSEPH DAVID O.606 LANIYAN SOLOMON OLA607 LASHORE BABATUNDE OLUWASEYI608 LASHORE CHRISTIE MOPELOLA609 LASHORE OLADIPUPO EBUN610 LASHORE OLAYEMI OLANIYI611 LASHORE OLOLADE OLABISI612 LASHORE OLUWABUKOLA613 LASHORE STEPHEN IBITAYO614 LAWAL ADETUNJI LUQMAN615 LAWAL DARASIWA ESTHER616 LAWAL IFEOLUWANI AYOMIDE617 LAWAL MODINAT ADEOLA618 LAWAL MUSTAW AKANO619 LAWAL O. AYOBAMIDELE620 LAWAL OLUTOBI ADEDIWURA621 LAWANSON T. A.622 LAWRENCE SAMUEL TEMIDAYO623 LEWIS ANDREW OLUFUNMILAYO624 LONGE PETER OHIAKHUEMI625 LOWO EMMANUEL A. ABAYOMI626 LUCKY MADEK LTD.627 M/S FOLLY & SONES AUTO ENG.628 MACAULAY AKIN629 MADUFOR JOSEPH SUNDAY630 MADUMERE ONYINYE IJEOMA N.631 MAJEKODUNMI FEYISOPE ADETUTU632 MALIZU CHINEMEREM BENDI633 MALOMO ABOSEDE GRACE634 MANUWA KUEWUMI635 MARRIOT SEC. & TRUST COY LTD.636 MARTINS THADDEUS OLUWASEYI637 MARVEL TRADES & SERVICES638 MBACHU SOLOMON ONWUAMAEZE 639 MBAMBA IJOMA SUNDAY & ANR 640 MBERU CEPHAS641 MBONU THERESA NKECHI642 MEADOWS ADEGBOYEGA643 MEGACREDITS LTD.644 MEMUD MUIBAT MEMUD645 METROPOLITAN MOTORS LIMITED.646 MGBAHURIKE SYLVESTER AHAMEFULE647 MILTON OGBONNAYA NWOSU648 MINTY BELTHA OMARI649 MINTY GABRIEL AKABOM TITO650 MINTY IVAN OSATOHAMWEN651 MINTY ZARA ISIUWA652 MOHAMMED IBRAHIM KABIR653 MOHAMMED IDRIS654 MOHAMMED JAMILU KIRU655 MOMAH IFEYINWA656 MOSES GIDEON AKINTOMIWA657 MOZIE ROPHINA CHINENYE658 MRS FOLLY & SONES AUTO ENGINEERING.659 MUHAMMAD ANWALU ABDU660 MUO IKE FERDINAND661 MUOGHALU CHRIS ALOYSIUS662 MURIANA KHALIL OPEYEMI663 MUSA SARAH664 MUSTAPHA IDOWU YAHAYA665 MUSTAPHER GANIYU ADEBAYO666 NAMEDU BENJAMIN AIGBOGHIE667 NAZEGBULAM CHRISTOPHER OLUMIDE668 NDUBUISI KISSINGER UGOCHUKWU669 NDULUE BENEDICT CHIKE670 NGADI CHIDERA671 NGELALE GODSPOWER OSILAOLLOR672 NKIRI FLORENCE NKONYE673 NLEMDIM UCHENNA OGADINMA674 NOAH MOHAMMED675 NSA CHRIS EKPEYONG676 NURUDEEN AKINOLA DAUDA677 NWABEZE ADAKU AKUDO678 NWABUSI ANTHONIA N679 NWABUSI ISRAEL680 NWANI OSITA EZEKIEL
NO. NAMES NO. NAMES NO. NAMES

151
2016 Annual Report & AccountsRETURNED CERTIFICATES CONTD
681 NWANKOR NNAMDI MIKE682 NWANKWO OGBONNA CHRISTIAN683 NWANZE JEFF CHIKEZIE JUDE684 NWATU MICHAEL NWAFOR685 NWEKE NKIRUKA JUDITH686 NWOKOCHA BENEDICT ONYEMAEC687 NWOSU IFEANYI EUGENE688 NZEKWE BLESSING CHISA689 OAMEN ANTHONY O.690 OBAFEMI OLUWASEYI ADETUNJI691 OBAJIMI J. OLUWAROTIMI692 OBAMI SOT OWUNDA693 OBAMONIRE OLADAPO SAMUEL694 OBASEKI EDWARD OSAZEE695 OBI AYOBAMCHUKWU A.696 OBI NWACHUKWU697 OBIANODO C. CHUKWUAGOZIE698 OBIENE THEOPHILUS DIENEYE699 OBIKE JOHNNY O.700 OBILANA OLUSOJI701 OBILEYE VICTOR OLAJIRE702 OBIOHA OLANMA703 OBIOHA RALPH A.704 OBISESAN AKINWALE TAIWO705 OBOMANU ISRAEL ABEREYANA706 OCHIAGHA CLEMENT707 ODEBIYI NURUDEEN BOLAJI708 ODEDEJI DAVID ADEOYE709 ODEDOKUN DEBORAH OLUWATOYIN710 ODEKUNLE TAIWO OLUDELE711 ODELE OLAKUNLE712 ODENIYI REBECCA OLAPEJU713 ODERINDE OLUFEMI SUNDAY714 ODETOYINBO SUSAN TOMI715 ODETUNDE OLAGOKE M. OBERTH716 ODII FREDS CHUKWUEMEKA717 ODIKAGBUE THOMAS718 ODOMA IBRAHIM ISA719 ODUFESI KEHINDE720 ODUGBESI ADEBAYO OLUSEGUN721 ODUNLAMI JOSEPH OLUYEMI722 ODUNTAN OLAJIDE723 ODUOLA MICHAEL OMOLADUN724 ODUWOLE OLASENI725 OFOGBA PATRICIA LAIRE726 OFOMATA CHINENYE JOY727 OFOYEJU MITCHELL JARIKRE728 OGBARA AKEEM MUSTAPHA729 OGBE OJONIMI JOHN730 OGBISE MIEBIDOU DAVID731 OGBODO SAMUEL732 OGBONMIDE CAROLINE OLAYINKA (MRS)733 OGBONNA GODWIN CHINWENDU734 OGBOYE SOLA COMFORT735 OGBU NNEDI (MRS)736 OGELE TONY ICHEBADU737 OGENYI AUDU EMMANUEL738 OGEYE BABATUNDE O.739 OGHOR GODWIN JAMES740 OGINNI BAKARE ADIO741 OGUDU FUNKE742 OGUFERE OWEN743 OGUINE SOLOMON UCHENNA744 OGUN THOMAS MAUTON745 OGUNAIKE OLAJIDE746 OGUNBAMIYO SOLAPE BOLAJI747 OGUNBIYI BABATUNDE JUBRIL A.748 OGUNDANA EMMANUEL OLANIYI749 OGUNDE VERONICA MODUPE750 OGUNDELE JAMES ONASANYA751 OGUNDIPE AKINFOLARIN752 OGUNDIPE DAVID753 OGUNDIRAN EZEKIEL754 OGUNFERE OWEN755 OGUNFOWODU OLAJUWON OMOPARIOLA
756 OGUNFOWORA ROTIMI A.757 OGUNJIMI OLUFEMI BABALOLA758 OGUNLEYE BOLAJI759 OGUNNAIKE OLAJIDE ADEKUNLE760 OGUNSUNLADE SUNDAY EMMANUEL761 OGUNTOMI AYODELE762 OGUNWALE KUNLE LAWRENCE763 OGUNYEMI OLUFEMI SEBASTINE764 OGUNYEMI WINIFRED KUNBI765 OHIOMAH EMMANUEL AHONKHAI766 OJELEKE OLABAYO A.R.767 OJEMEN COSMAS A.768 OJIDIRAN JAMES IYIOLA769 OJIGBO TOBECHUKWU I.770 OJO ALBERT OLUWOLE771 OJO EZEKIEL OLUWASEYI772 OJO ISAAC OLADEJO773 OJO JAMES AKINLOLU774 OJO SOLOMON OLUSEGUN775 OJOH DAVID776 OJUMOOLA OLUSEGUN AKANBI777 OKAFOR FRANCIS C. E.778 OKAFOR KENECHUKWU HILARY779 OKAFOR UZOCHUKWU SUNDAY780 OKANLAWON SAMUEL ADEGOKE781 OKANRENDE OLADOTUN OLAWALE782 OKARA LYNA IJEOMA783 OKE AYODEJI LAYIWOLA784 OKEKE ANTHONY785 OKEKE CLEMENT IKENNA786 OKEKE HEZEKIAH EMEKA787 OKERONBI ADEWALE A788 OKESOLA MASILIAT AYOKA789 OKETUNDE LANRE PETERS790 OKEWOLE RANTI FLORENCE791 OKHIRA LUCKY792 OKOJIE OSA JOSEPH793 OKOLO NGOZI CHRISTIANA794 OKON ANDREW ANIEFIOK795 OKONJE UMO GABRIEL796 OKONKWO KENECHUKWU JUDAH797 OKONKWO UCHE MERCY 798 OKONKWO VICTOR CHUKWUNONSO O.799 OKORO EMMANUEL OBINNA800 OKOSUN EDWARD EROMOSELE801 OKOYE AFAMEFUNA NNAMDI O.802 OKOYE MARTIN OLISA803 OKPALA CHUDE ONYEMAUCHE804 OKPALA JUDE UDECHUKWU805 OKPUNO LUKE UCHE806 OKUFOLAMI T. BRIGHT807 OKUGBENI ALFRED-BRORHIEN808 OKUMA AGHOGHO OGHOGO809 OKUNLADE OLUWAMUYIWA OLUKAYODE810 OKWARA KENNEDY STAN811 OLABANJI MICHAEL812 OLABISI JOHN KOLA813 OLABODE OLAREWAJU814 OLABODE OLAYINKA815 OLABODE SOLA816 OLABOPO HOLDINGS LTD817 OLABOSIPO OLUSEGUN MOSES818 OLADAPO AJIBOLA YEMISI819 OLADEJO820 OLADEJO ADEBAYO OLATUNDE821 OLADEJO MAJEMITE ADEREMI822 OLADELE DAVID OLANIYI823 OLADIPO MUFUTAU ADEKUNLE824 OLADIPO OLANREWAJU825 OLADIRAN ONAOLAPO826 OLADOKE AYINDE O. OLUSHOLA 827 OLADOYIN KEMI ADUNNI828 OLADUNNI EMMANUEL TAIWO829 OLAGUNDOYE OLUREMI ADE830 OLAGUNJU E. O831 OLAITAN MICHAEL OLUFEMI
832 OLAITAN NOAH TOYIN833 OLAITAN TAIWO FOLASHADE834 OLAIYA ISAAC ADEBISI835 OLAJIDE ADEBAYO BAMIDELE836 OLAJIDE DAVID BANKOLE837 OLAJIDE OLANREWAJU TAJUDEEN838 OLAJIDE TAJU OLANREWAJU839 OLAKANYE BENSON ABIODUN840 OLAKEMI VICTORIA841 OLANIYAN BANJI842 OLANIYAN BOLA MISS843 OLANIYAN GBOLADE CHARLES844 OLANIYAN OLUGBENGA845 OLANREWAJU AMBALI ALLI846 OLAOSEBIKAN TUNDE847 OLATUNDE OMON ANTHONY848 OLATUNDE SALISU GANIYU849 OLATUNJI ENOMA MERCY850 OLATUNJI ISHAQ OLALEKAN 851 OLATUNJI MATHIAS ROTIMI852 OLATUNJI O. OLALEKE853 OLATUNJI SAMUEL854 OLAWOYE J. D.855 OLAYANJU OLOLADE856 OLAYEMI EMMANUEL AYINLA857 OLAYINKA KEHINDE OLOLADE858 OLIMAH ELIZABETH I.859 OLIOBI CHRISTIAN DR.&MRS860 OLIVER AMAEYA861 OLOGBOSERE AUSTYNE IYERE OSA862 OLOKO BUSHURA OWOLABI863 OLONISAKIN AYOOLA864 OLORUNFUNMI OLUSEGUN ADELEYE865 OLORUNSOLA PETER IBUKUN866 OLOTU MICHAEL OLUWATOBI867 OLOWE OLATUNDE JOHNSON868 OLUBANIYI GRACE MORONMUBO869 OLUBOYEDE DEBROAH O.870 OLUBUNMI GA-OPADOKUN871 OLUDARE GBENGA ISAAC872 OLUFIDIPE ANTHONY OYE873 OLUFIDIPE TOLUWALASE874 OLUGBEMI OLUBUNMI ADREMI875 OLUKOYA TITILOPE876 OLUMEGBON RISIKAT ABIMBOLA877 OLUMESE DONALD EHINOR878 OLUMUYIWA IBIRONKE879 OLUOKUN AYOBAMI880 OLUSANYA OLUSEGUN881 OLUSEGUN O. ADEYEYE882 OLUTOBI ADEOGUN CHRISTOPHER883 OLUWADARE SUNDAY VICTOR884 OLUWAKOREDE NURUDEEN885 OLUYEDE TAJUDEEN BALOGUN886 OLUYEMI ADETUTU OLUKOREDE887 OMAGBEMI MILDRED SELAYI888 OMIDIRE FUNKE889 OMISANYA ABDUL WASPL ADENIYI890 OMO FARMS NIGERIA LIMITED891 OMODENI ADEGBOYEGA PHILIP OLADAPO892 OMOFAYE BOASON OLA893 OMOGOR LAZARUS E.894 OMOIFO BATHOLOMEW OKHAREDIA895 OMOKHAYE BAYO OJEMERI896 OMOLE JOSEPH ADEDEJO897 OMOLODUN OLUSEGUN898 OMOLOKUN OMOTOUN OMOTOPE899 OMONDIAGBE ALEX OMON900 OMONI OLUSOLA901 OMONIYI FOLASAYO BUKOLA902 OMONIYI OLUWATOSIN GIDEON903 OMOPARIOLA HENRY IBUKUN904 OMOREGBE CAROLINE (MRS)905 OMOREGHA ADEBOWALE CLAUDIUS906 OMORIBA BABATUNDE907 OMORUYI SANDRA
NO. NAMES NO. NAMES NO. NAMES
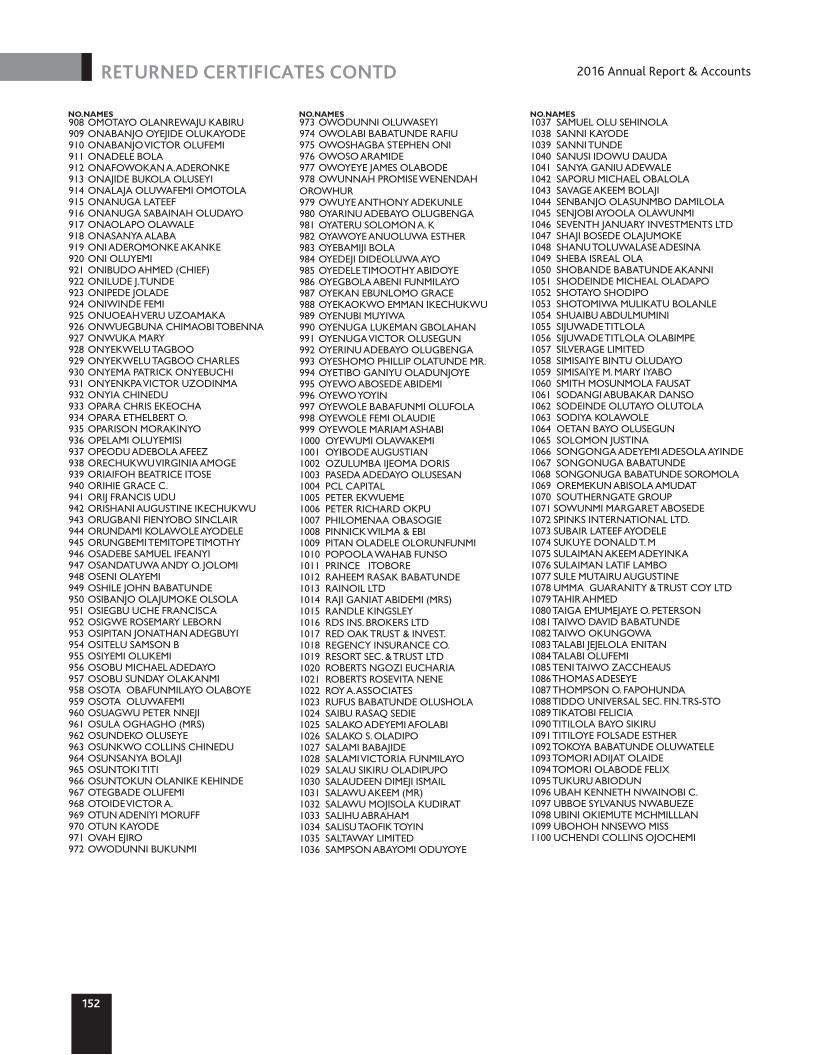
2152
908 OMOTAYO OLANREWAJU KABIRU909 ONABANJO OYEJIDE OLUKAYODE910 ONABANJO VICTOR OLUFEMI911 ONADELE BOLA912 ONAFOWOKAN A. ADERONKE913 ONAJIDE BUKOLA OLUSEYI914 ONALAJA OLUWAFEMI OMOTOLA915 ONANUGA LATEEF916 ONANUGA SABAINAH OLUDAYO917 ONAOLAPO OLAWALE918 ONASANYA ALABA919 ONI ADEROMONKE AKANKE920 ONI OLUYEMI921 ONIBUDO AHMED (CHIEF)922 ONILUDE J. TUNDE923 ONIPEDE JOLADE924 ONIWINDE FEMI925 ONUOEAH VERU UZOAMAKA926 ONWUEGBUNA CHIMAOBI TOBENNA927 ONWUKA MARY928 ONYEKWELU TAGBOO929 ONYEKWELU TAGBOO CHARLES930 ONYEMA PATRICK ONYEBUCHI931 ONYENKPA VICTOR UZODINMA932 ONYIA CHINEDU933 OPARA CHRIS EKEOCHA934 OPARA ETHELBERT O.935 OPARISON MORAKINYO936 OPELAMI OLUYEMISI937 OPEODU ADEBOLA AFEEZ938 ORECHUKWU VIRGINIA AMOGE939 ORIAIFOH BEATRICE ITOSE940 ORIHIE GRACE C.941 ORIJ FRANCIS UDU942 ORISHANI AUGUSTINE IKECHUKWU943 ORUGBANI FIENYOBO SINCLAIR944 ORUNDAMI KOLAWOLE AYODELE945 ORUNGBEMI TEMITOPE TIMOTHY946 OSADEBE SAMUEL IFEANYI947 OSANDATUWA ANDY O. JOLOMI948 OSENI OLAYEMI949 OSHILE JOHN BABATUNDE 950 OSIBANJO OLAJUMOKE OLSOLA951 OSIEGBU UCHE FRANCISCA952 OSIGWE ROSEMARY LEBORN953 OSIPITAN JONATHAN ADEGBUYI954 OSITELU SAMSON B955 OSIYEMI OLUKEMI956 OSOBU MICHAEL ADEDAYO957 OSOBU SUNDAY OLAKANMI958 OSOTA OBAFUNMILAYO OLABOYE959 OSOTA OLUWAFEMI960 OSUAGWU PETER NNEJI961 OSULA OGHAGHO (MRS)962 OSUNDEKO OLUSEYE963 OSUNKWO COLLINS CHINEDU964 OSUNSANYA BOLAJI965 OSUNTOKI TITI966 OSUNTOKUN OLANIKE KEHINDE967 OTEGBADE OLUFEMI968 OTOIDE VICTOR A.969 OTUN ADENIYI MORUFF970 OTUN KAYODE971 OVAH EJIRO972 OWODUNNI BUKUNMI
973 OWODUNNI OLUWASEYI974 OWOLABI BABATUNDE RAFIU975 OWOSHAGBA STEPHEN ONI976 OWOSO ARAMIDE977 OWOYEYE JAMES OLABODE978 OWUNNAH PROMISE WENENDAH OROWHUR979 OWUYE ANTHONY ADEKUNLE980 OYARINU ADEBAYO OLUGBENGA981 OYATERU SOLOMON A. K982 OYAWOYE ANUOLUWA ESTHER983 OYEBAMIJI BOLA984 OYEDEJI DIDEOLUWA AYO985 OYEDELE TIMOOTHY ABIDOYE986 OYEGBOLA ABENI FUNMILAYO987 OYEKAN EBUNLOMO GRACE988 OYEKAOKWO EMMAN IKECHUKWU989 OYENUBI MUYIWA990 OYENUGA LUKEMAN GBOLAHAN991 OYENUGA VICTOR OLUSEGUN 992 OYERINU ADEBAYO OLUGBENGA993 OYESHOMO PHILLIP OLATUNDE MR.994 OYETIBO GANIYU OLADUNJOYE995 OYEWO ABOSEDE ABIDEMI996 OYEWO YOYIN997 OYEWOLE BABAFUNMI OLUFOLA998 OYEWOLE FEMI OLAUDIE999 OYEWOLE MARIAM ASHABI1000 OYEWUMI OLAWAKEMI1001 OYIBODE AUGUSTIAN1002 OZULUMBA IJEOMA DORIS1003 PASEDA ADEDAYO OLUSESAN1004 PCL CAPITAL 1005 PETER EKWUEME1006 PETER RICHARD OKPU1007 PHILOMENAA OBASOGIE1008 PINNICK WILMA & EBI1009 PITAN OLADELE OLORUNFUNMI1010 POPOOLA WAHAB FUNSO1011 PRINCE ITOBORE1012 RAHEEM RASAK BABATUNDE1013 RAINOIL LTD1014 RAJI GANIAT ABIDEMI (MRS)1015 RANDLE KINGSLEY1016 RDS INS. BROKERS LTD1017 RED OAK TRUST & INVEST.1018 REGENCY INSURANCE CO.1019 RESORT SEC. & TRUST LTD1020 ROBERTS NGOZI EUCHARIA1021 ROBERTS ROSEVITA NENE1022 ROY A. ASSOCIATES1023 RUFUS BABATUNDE OLUSHOLA1024 SAIBU RASAQ SEDIE1025 SALAKO ADEYEMI AFOLABI1026 SALAKO S. OLADIPO1027 SALAMI BABAJIDE1028 SALAMI VICTORIA FUNMILAYO1029 SALAU SIKIRU OLADIPUPO1030 SALAUDEEN DIMEJI ISMAIL1031 SALAWU AKEEM (MR)1032 SALAWU MOJISOLA KUDIRAT1033 SALIHU ABRAHAM1034 SALISU TAOFIK TOYIN1035 SALTAWAY LIMITED1036 SAMPSON ABAYOMI ODUYOYE
1037 SAMUEL OLU SEHINOLA1038 SANNI KAYODE1039 SANNI TUNDE1040 SANUSI IDOWU DAUDA1041 SANYA GANIU ADEWALE1042 SAPORU MICHAEL OBALOLA1043 SAVAGE AKEEM BOLAJI1044 SENBANJO OLASUNMBO DAMILOLA1045 SENJOBI AYOOLA OLAWUNMI1046 SEVENTH JANUARY INVESTMENTS LTD1047 SHAJI BOSEDE OLAJUMOKE1048 SHANU TOLUWALASE ADESINA1049 SHEBA ISREAL OLA1050 SHOBANDE BABATUNDE AKANNI1051 SHODEINDE MICHEAL OLADAPO1052 SHOTAYO SHODIPO1053 SHOTOMIWA MULIKATU BOLANLE1054 SHUAIBU ABDULMUMINI1055 SIJUWADE TITLOLA1056 SIJUWADE TITLOLA OLABIMPE1057 SILVERAGE LIMITED1058 SIMISAIYE BINTU OLUDAYO1059 SIMISAIYE M. MARY IYABO1060 SMITH MOSUNMOLA FAUSAT1061 SODANGI ABUBAKAR DANSO1062 SODEINDE OLUTAYO OLUTOLA1063 SODIYA KOLAWOLE1064 OETAN BAYO OLUSEGUN1065 SOLOMON JUSTINA1066 SONGONGA ADEYEMI ADESOLA AYINDE1067 SONGONUGA BABATUNDE1068 SONGONUGA BABATUNDE SOROMOLA1069 OREMEKUN ABISOLA AMUDAT1070 SOUTHERNGATE GROUP1071 SOWUNMI MARGARET ABOSEDE1072 SPINKS INTERNATIONAL LTD.1073 SUBAIR LATEEF AYODELE1074 SUKUYE DONALD T. M1075 SULAIMAN AKEEM ADEYINKA1076 SULAIMAN LATIF LAMBO1077 SULE MUTAIRU AUGUSTINE1078 UMMA GUARANITY & TRUST COY LTD1079 TAHIR AHMED1080 TAIGA EMUMEJAYE O. PETERSON1081 TAIWO DAVID BABATUNDE1082 TAIWO OKUNGOWA1083 TALABI JEJELOLA ENITAN1084 TALABI OLUFEMI1085 TENI TAIWO ZACCHEAUS1086 THOMAS ADESEYE1087 THOMPSON O. FAPOHUNDA1088 TIDDO UNIVERSAL SEC. FIN. TRS-STO1089 TIKATOBI FELICIA1090 TITILOLA BAYO SIKIRU1091 TITILOYE FOLSADE ESTHER1092 TOKOYA BABATUNDE OLUWATELE1093 TOMORI ADIJAT OLAIDE1094 TOMORI OLABODE FELIX1095 TUKURU ABIODUN1096 UBAH KENNETH NWAINOBI C.1097 UBBOE SYLVANUS NWABUEZE1098 UBINI OKIEMUTE MCHMILLLAN1099 UBOHOH NNSEWO MISS1100 UCHENDI COLLINS OJOCHEMI
2016 Annual Report & AccountsRETURNED CERTIFICATES CONTD
NO. NAMES NO. NAMES NO. NAMES
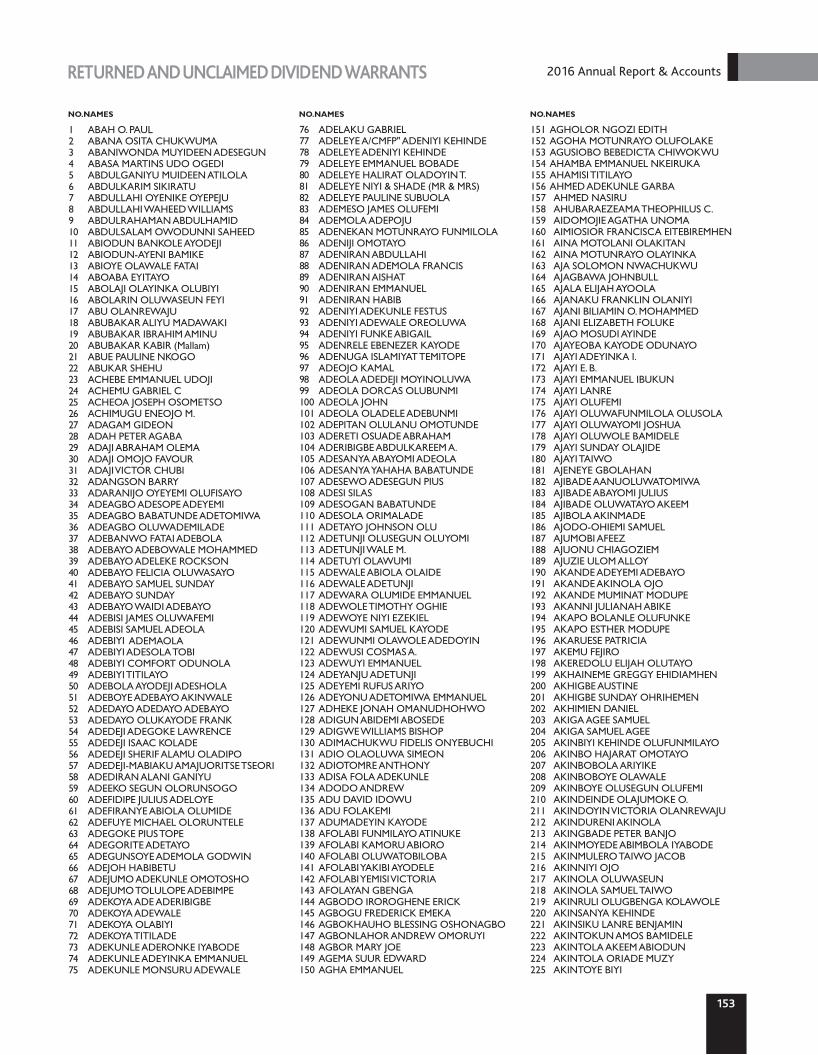
2
TABLE OF CONTENT
2016 Annual Report & Accounts
153
RETURNED AND UNCLAIMED DIVIDEND WARRANTS
TABLE OF CONTENT
1 ABAH O. PAUL2 ABANA OSITA CHUKWUMA3 ABANIWONDA MUYIDEEN ADESEGUN4 ABASA MARTINS UDO OGEDI5 ABDULGANIYU MUIDEEN ATILOLA6 ABDULKARIM SIKIRATU7 ABDULLAHI OYENIKE OYEPEJU8 ABDULLAHI WAHEED WILLIAMS9 ABDULRAHAMAN ABDULHAMID10 ABDULSALAM OWODUNNI SAHEED11 ABIODUN BANKOLE AYODEJI12 ABIODUN-AYENI BAMIKE13 ABIOYE OLAWALE FATAI14 ABOABA EYITAYO15 ABOLAJI OLAYINKA OLUBIYI16 ABOLARIN OLUWASEUN FEYI17 ABU OLANREWAJU18 ABUBAKAR ALIYU MADAWAKI19 ABUBAKAR IBRAHIM AMINU20 ABUBAKAR KABIR (Mallam)21 ABUE PAULINE NKOGO22 ABUKAR SHEHU23 ACHEBE EMMANUEL UDOJI24 ACHEMU GABRIEL C25 ACHEOA JOSEPH OSOMETSO26 ACHIMUGU ENEOJO M.27 ADAGAM GIDEON28 ADAH PETER AGABA29 ADAJI ABRAHAM OLEMA30 ADAJI OMOJO FAVOUR31 ADAJI VICTOR CHUBI32 ADANGSON BARRY33 ADARANIJO OYEYEMI OLUFISAYO34 ADEAGBO ADESOPE ADEYEMI35 ADEAGBO BABATUNDE ADETOMIWA36 ADEAGBO OLUWADEMILADE37 ADEBANWO FATAI ADEBOLA38 ADEBAYO ADEBOWALE MOHAMMED39 ADEBAYO ADELEKE ROCKSON40 ADEBAYO FELICIA OLUWASAYO41 ADEBAYO SAMUEL SUNDAY42 ADEBAYO SUNDAY43 ADEBAYO WAIDI ADEBAYO44 ADEBISI JAMES OLUWAFEMI45 ADEBISI SAMUEL ADEOLA46 ADEBIYI ADEMAOLA47 ADEBIYI ADESOLA TOBI48 ADEBIYI COMFORT ODUNOLA49 ADEBIYI TITILAYO50 ADEBOLA AYODEJI ADESHOLA51 ADEBOYE ADEBAYO AKINWALE52 ADEDAYO ADEDAYO ADEBAYO53 ADEDAYO OLUKAYODE FRANK54 ADEDEJI ADEGOKE LAWRENCE55 ADEDEJI ISAAC KOLADE56 ADEDEJI SHERIF ALAMU OLADIPO57 ADEDEJI-MABIAKU AMAJUORITSE TSEORI58 ADEDIRAN ALANI GANIYU59 ADEEKO SEGUN OLORUNSOGO60 ADEFIDIPE JULIUS ADELOYE61 ADEFIRANYE ABIOLA OLUMIDE62 ADEFUYE MICHAEL OLORUNTELE63 ADEGOKE PIUS TOPE64 ADEGORITE ADETAYO65 ADEGUNSOYE ADEMOLA GODWIN66 ADEJOH HABIBETU67 ADEJUMO ADEKUNLE OMOTOSHO68 ADEJUMO TOLULOPE ADEBIMPE69 ADEKOYA ADE ADERIBIGBE70 ADEKOYA ADEWALE71 ADEKOYA OLABIYI72 ADEKOYA TITILADE73 ADEKUNLE ADERONKE IYABODE74 ADEKUNLE ADEYINKA EMMANUEL75 ADEKUNLE MONSURU ADEWALE
76 ADELAKU GABRIEL77 ADELEYE A/CMFP" ADENIYI KEHINDE78 ADELEYE ADENIYI KEHINDE79 ADELEYE EMMANUEL BOBADE80 ADELEYE HALIRAT OLADOYIN T.81 ADELEYE NIYI & SHADE (MR & MRS)82 ADELEYE PAULINE SUBUOLA83 ADEMESO JAMES OLUFEMI84 ADEMOLA ADEPOJU85 ADENEKAN MOTUNRAYO FUNMILOLA86 ADENIJI OMOTAYO87 ADENIRAN ABDULLAHI88 ADENIRAN ADEMOLA FRANCIS89 ADENIRAN AISHAT90 ADENIRAN EMMANUEL91 ADENIRAN HABIB92 ADENIYI ADEKUNLE FESTUS93 ADENIYI ADEWALE OREOLUWA94 ADENIYI FUNKE ABIGAIL95 ADENRELE EBENEZER KAYODE96 ADENUGA ISLAMIYAT TEMITOPE97 ADEOJO KAMAL98 ADEOLA ADEDEJI MOYINOLUWA99 ADEOLA DORCAS OLUBUNMI100 ADEOLA JOHN101 ADEOLA OLADELE ADEBUNMI102 ADEPITAN OLULANU OMOTUNDE103 ADERETI OSUADE ABRAHAM104 ADERIBIGBE ABDULKAREEM A.105 ADESANYA ABAYOMI ADEOLA106 ADESANYA YAHAHA BABATUNDE107 ADESEWO ADESEGUN PIUS108 ADESI SILAS109 ADESOGAN BABATUNDE110 ADESOLA ORIMALADE111 ADETAYO JOHNSON OLU112 ADETUNJI OLUSEGUN OLUYOMI113 ADETUNJI WALE M.114 ADETUYI OLAWUMI115 ADEWALE ABIOLA OLAIDE116 ADEWALE ADETUNJI117 ADEWARA OLUMIDE EMMANUEL118 ADEWOLE TIMOTHY OGHIE119 ADEWOYE NIYI EZEKIEL120 ADEWUMI SAMUEL KAYODE121 ADEWUNMI OLAWOLE ADEDOYIN122 ADEWUSI COSMAS A.123 ADEWUYI EMMANUEL124 ADEYANJU ADETUNJI125 ADEYEMI RUFUS ARIYO126 ADEYONU ADETOMIWA EMMANUEL127 ADHEKE JONAH OMANUDHOHWO128 ADIGUN ABIDEMI ABOSEDE129 ADIGWE WILLIAMS BISHOP130 ADIMACHUKWU FIDELIS ONYEBUCHI131 ADIO OLAOLUWA SIMEON132 ADIOTOMRE ANTHONY133 ADISA FOLA ADEKUNLE134 ADODO ANDREW135 ADU DAVID IDOWU136 ADU FOLAKEMI137 ADUMADEYIN KAYODE138 AFOLABI FUNMILAYO ATINUKE139 AFOLABI KAMORU ABIORO140 AFOLABI OLUWATOBILOBA141 AFOLABI YAKIBI AYODELE142 AFOLABI YEMISI VICTORIA143 AFOLAYAN GBENGA144 AGBODO IROROGHENE ERICK145 AGBOGU FREDERICK EMEKA146 AGBOKHAUHO BLESSING OSHONAGBO147 AGBONLAHOR ANDREW OMORUYI148 AGBOR MARY JOE149 AGEMA SUUR EDWARD150 AGHA EMMANUEL
151 AGHOLOR NGOZI EDITH152 AGOHA MOTUNRAYO OLUFOLAKE153 AGUSIOBO BEBEDICTA CHIWOKWU154 AHAMBA EMMANUEL NKEIRUKA155 AHAMISI TITILAYO156 AHMED ADEKUNLE GARBA157 AHMED NASIRU158 AHUBARAEZEAMA THEOPHILUS C.159 AIDOMOJIE AGATHA UNOMA160 AIMIOSIOR FRANCISCA EITEBIREMHEN161 AINA MOTOLANI OLAKITAN162 AINA MOTUNRAYO OLAYINKA163 AJA SOLOMON NWACHUKWU164 AJAGBAWA JOHNBULL165 AJALA ELIJAH AYOOLA166 AJANAKU FRANKLIN OLANIYI167 AJANI BILIAMIN O. MOHAMMED168 AJANI ELIZABETH FOLUKE169 AJAO MOSUDI AYINDE170 AJAYEOBA KAYODE ODUNAYO171 AJAYI ADEYINKA I.172 AJAYI E. B.173 AJAYI EMMANUEL IBUKUN174 AJAYI LANRE175 AJAYI OLUFEMI176 AJAYI OLUWAFUNMILOLA OLUSOLA177 AJAYI OLUWAYOMI JOSHUA178 AJAYI OLUWOLE BAMIDELE179 AJAYI SUNDAY OLAJIDE180 AJAYI TAIWO181 AJENEYE GBOLAHAN182 AJIBADE AANUOLUWATOMIWA183 AJIBADE ABAYOMI JULIUS184 AJIBADE OLUWATAYO AKEEM185 AJIBOLA AKINMADE186 AJODO-OHIEMI SAMUEL187 AJUMOBI AFEEZ188 AJUONU CHIAGOZIEM189 AJUZIE ULOM ALLOY190 AKANDE ADEYEMI ADEBAYO191 AKANDE AKINOLA OJO192 AKANDE MUMINAT MODUPE193 AKANNI JULIANAH ABIKE194 AKAPO BOLANLE OLUFUNKE195 AKAPO ESTHER MODUPE196 AKARUESE PATRICIA197 AKEMU FEJIRO198 AKEREDOLU ELIJAH OLUTAYO 199 AKHAINEME GREGGY EHIDIAMHEN200 AKHIGBE AUSTINE201 AKHIGBE SUNDAY OHRIHEMEN202 AKHIMIEN DANIEL203 AKIGA AGEE SAMUEL204 AKIGA SAMUEL AGEE205 AKINBIYI KEHINDE OLUFUNMILAYO206 AKINBO HAJARAT OMOTAYO207 AKINBOBOLA ARIYIKE208 AKINBOBOYE OLAWALE209 AKINBOYE OLUSEGUN OLUFEMI210 AKINDEINDE OLAJUMOKE O.211 AKINDOYIN VICTORIA OLANREWAJU212 AKINDURENI AKINOLA213 AKINGBADE PETER BANJO214 AKINMOYEDE ABIMBOLA IYABODE215 AKINMULERO TAIWO JACOB216 AKINNIYI OJO217 AKINOLA OLUWASEUN218 AKINOLA SAMUEL TAIWO219 AKINRULI OLUGBENGA KOLAWOLE220 AKINSANYA KEHINDE221 AKINSIKU LANRE BENJAMIN222 AKINTOKUN AMOS BAMIDELE223 AKINTOLA AKEEM ABIODUN224 AKINTOLA ORIADE MUZY225 AKINTOYE BIYI
NO. NAMES NO. NAMES NO. NAMES

2
2016 Annual Report & Accounts
154
RETURNED AND UNCLAIMED DIVIDEND WARRANTS
226 AKINTOYE MODUPE227 AKINTUNDE OJO SUNDAY228 AKINWANDE YISA OLABODE229 AKINWUNTAN PATRICK AKIN230 AKINYEMI ANTHONY BABATUNDE231 AKINYEMI SOLOMON ADEDOLA232 AKINYOSOYE FRANKLYN233 AKIOLU FADEKE KUBURAT234 AKIOYA ESEOSA (DR)235 AKORGA BENEDICT SAAVE236 AKPABIO IGNATIUS ASUQUO237 AKPABIODE SHOLE DAVID238 AKPAH BARTHOLOMEW CHIZOBA239 AKPALA IFEANYI MAYOR240 AKPAN ROSE241 AKPAN S. E.242 AKPOWOWO BETTY ERHUVWU243 ALABI MICHAEL244 ALAMU TIMOTHY O.245 ALAO MARY BOLATITO246 ALAWAIYE W. KUNLE247 ALAWAYE ADEBANKE248 ALAYAKI ADESHINA RAFIU249 ALEBIOSU COMFORT OLUBUNMI250 ALEONEWESE JOHN OKHUMODE251 ALEXANDRA ULOGHOMAN SATURDAY252 ALIGBE PATRICIA AIROHU253 ALIGWEKWE CHUKWUDI CAIUS254 ALIU BASILIA OLURANTI255 ALLISON IBITOLA FOLASHADE256 ALLOH DORCAS OLUFUNMILAYO257 ALLOH OLAITAN JOSEPH258 ALOKUN NURUDEEN A. TOPE259 ALUKO OLAOLUWA ADEDAYO260 AMADI VIVIAN C.261 AMAKU TIMOTHY262 AMAO JACOB OLADELE263 AMEDU ABDULATEET AMANOSI264 AMEEN GBOLAHAN AZEEZ265 AMINOMA EBENEZER ORITSETEMIYIN266 AMINU ADELEKE AYOFE267 AMINU OLATUNJI AKEEM268 AMOBI JOSEPH CHINEDU269 AMODU TAIWO270 AMU ANDREW OHIEREIMEN271 AMU ANDREW OHIREIMEN272 AMUSAH LATEEF ISHOLA KOLA OWOLABI273 AMUSAN YETUNDE OLUBUNMI274 AMUWA ADEYEMI MICHAEL275 ANDU RASULULAI ABIODUN276 ANI BENEDICY OKWUDIKI277 ANIETOR JUDE278 ANIGBO EMMANUEL OKECHUKWU279 ANOZIE ANMBROSE NWORA DR.280 ANOZIE FLORENCE OGONNA281 ANTHONY MUHYIDIN OLAWALE282 ANUGENGEN SAMUEL283 ANUSHIEM MADONNA CHINASA284 ANYANWU THEODORE NNAJI285 AREMO FELIX286 AREWA ADEMOLA287 ARIBISALA MARGARET OLUSOLA288 ARIJE ABDULRASAQ289 ARIKANKI OLUTUNDE290 AROKO EGBE SAMUEL291 ARULEBA OLUWASEYI ADEREMI292 ARUNA SURAJ TEMITOPE293 ASAGWARA E. CHRISTOPHER294 ASAKOME ANI OMOSHALOWA295 ASANGA ENEFIOK AKPAN296 ASARE-BEDIAKON MIKE297 ASHAMU PATE298 ASHAOLU SUNDAY AYINDE299 ASHOGBON FESTUS OLABODE300 ATANE NICHOLAS
301 ATERE OLUWAFUNMILAYO302 ATIEGOBA ANNE IFEANYI303 ATOBATELE ADETOYESE FELA304 ATSENOGWA FRIDAY OGHENEWERUYI305 ATTAH AYOMIDE ELIZABETH ADUKE306 ATTAH SIMON ANENEUNA307 ATULOBI COMFORT NGOZI308 AUDU-DAMODU EBIKAY309 AUDU-DAMODU IMOTSEMHE310 AWE DANIEL B.311 AWE FEMI312 AWE OLADIMEJI MICHAEL313 AWHINANA LIMITED314 AWONUSI TEMIDAYO OMOYEMI315 AWOYELE IBUKUN OLUBUNMI316 AWUA SAMUEL317 AWUSE KESENYA B.318 AXER BUSINESS SOLUTIONS LIMITED319 AYANGOKE ELIZABETH OLURONKE320 AYENI JOSEPH ABIODUN321 AYENI MONISOLA VERONICA322 AYOADE CHRISTOPHER IDOWU ADEBUSOYE323 AYODELE MARTINS AYODEJI324 AYOOLA IFEYINWA CHIOMA325 AYOOLA ODUNAYO ABIOLA PETER326 AYO-OLUWA HENRY A.327 AYORINDE CAROLINE ABOSEDE328 AYORINDE DELE329 AYRVBUDMWAN O. FRANCIS330 AYUBA RONKE331 AZEEZ FIMISOLA A.332 AZEEZ MODUPEOLA VICTORIA333 AZEEZ SIKIRU ADETONA334 AZEGBA COSMOS OKECHUKWU335 AZUBUIKE CHIBUZOR C.336 BABALOLA OLATUNJI OLADAPO337 BABALOLA VICTORIA OLUYEMISI338 BABATUNDE ADEKUNLE339 BABATUNDE IBIRONKE340 BADEJO ADENIYI OLUKAYODE341 BADIRU BOLANLE342 BAFUNSO SUNDAY ADEMOLA343 BALOGUN ADENIYI SHAKIRU344 BALOGUN AKINOLA345 BALUCHI BEHRAM SHERO346 BAMGBOSE ADESOJI OMOTAYO347 BAMGBOSE OYINDAMOLA ITUNUOLUWA348 BAMIDELE COMFORT IFEJEOLA349 BAMISILE BOYEDE RUFUS350 BAMISILE SESAN (MR.)351 BANJOKO OLADELE352 BANKOLE OLUWATIMILEHIN DANIEL353 BASOENE IBIBA HARRY354 BASSEY OFEM EFFIONG355 BAYAGBON ODAFE BRIGHT356 BEGHO THELMA ANIRE357 BELLO LAWAN MOHAMMED358 BELLO OYESOLA JOSEPHINE359 BELLO YUSUFF AYINLA360 BISIRYU MUTIU OLUWASEYI361 BOJEN INVEST LTD362 BOJERENU M MAUTON363 BOLARINWA FEYISOLA OMOLARA364 BOLARINWA MORONKE YEMISI365 BOMAIPIRIMA NIGERIBARA366 BONIFACE A. DURU367 BOSAH CHIKE ANDREW368 BOSHORO OLUWAPELUMI ADENIYI369 BOSHORO OLUWASJIBOMI SHETEMI370 BRAIMAH VICTOR ADEJOH & HAUWA VICTOR371 BRIGGS NINAH NIMI372 BULUKU JULIETTE373 BUSAI YUSSUF OLAWUNMI
374 CALMDAY OMBO LUCKY375 CAPITAL PROVIDERS SEC. LTD.376 CHARAMS GLOBAL CONCEPT LTD.377 CHECERBU VENTURES LTD378 CHIDERA R. EZEJA379 CHIJIAKU CHIBUIKE380 CHIKWENDU CORNELIUS E. (EST. OF)381 CHINWEUBA AUGUSTINE382 CHIRA PAUL CHUKWURAH383 CHUKWUANI JUNIOR CLIFFORD384 CHUKWUNETA ELIAS CHISAROKWU385 COAST ONORIODE386 COLE HELEN KEHINDE387 COLLIER OLANREWAJU ASHEID388 CORNERSTONE C/O OLUKAYODE ARIYO389 CRAIG KEHINDE ABIMBOLA390 DADA ISHOLA ADELOYE391 DAHUNSI OYEWOLE LAWRENCE392 DAIYABU DAHIRU (ALH.)393 DAKPOKPO EMMANUEL ALASA394 DANIEL DARLINGTON395 DARIYA JEREMIAH VICTOR396 DAUDA AKEEM ABIODUN397 DAWODU KAYINSOLAMI VICTORIA398 DAWODU OLUWADAMILARE VICTOR399 DEDEGU BENEDICTA EMMALUNAGBE400 DIALI VICTOR401 DIBIA CHUKWUDI EMMANUEL402 DICK-IRUENABERE BASOENE403 DIMGBA EMMANUEL & CATHERINE404 DIMOWO PEMTOB405 DIPITA-WILLIAMS BABATUNDE O.406 DISEYE SILIKOWE I407 DOGO DAUDA408 DOGONYARO DANLAMI409 DOMINION-DAVID AHIACHI JOY410 DONNETTE LTD411 DOSUNMU OLUWOLE ROGER412 DOSUNMU SIDIQUAT FOLASHADE413 DUGBELE DESINY OGOCHUKWU414 DUROJAIYE OLADELE OLUWASEYI415 DUROWOJU ADEWUNMI MAHDINAT416 DURU GODSFREY ONYEKACHI417 DUSUNMU MUDASHIR ADEKUNLE418 DYITKUKA EIRENE PWANMWAKAT419 EBI UMA NNOCHIN420 EBIWANNO MOBOLAJI JOHNSON OMOTAYO421 EBIWANNO OLUWAYEMISI OLUKEMI422 EBODAGHE BARNABAS O.423 EBOETSE KETIMU 2424 EBOMWONYI PATRICK OSAZEE425 ECHALESHIKE DAVID426 ECHEBIRI C. CHRISTIAN427 ECHEGWO STANLEY UCHE428 ECHEGWO TOCHUKWU429 EDEIGBA OKOEGUALE ANTHONY430 EDET ELIJAH ESSIET431 EDO EDWIN JUDE432 EDOGAME ALFRED OSHOAKPEME433 EDOGAME ESTHER IKPEMOSI434 EDOGAME RITA SENUMA435 EDOZIE JOHN U.436 EFFIONG VIVIAN437 EFUGHI VICTOR CHUKWULENYE438 EGEKENZE PATRICK IKECHI439 EGEREGA EFE STEPHEN440 EGIE EDAFE EMMANUEL441 EGONE DANIEL EJODEPHIA442 EGOPIJA JULIANA ANYUWU443 EGUH CHRISTOPHER444 EGUME ONEME445 EGUZO STEVE IHEANACHO446 EHIGHALUA KINGSLEY447 EHIY CHRISTOPHER OSEGHALE
NO. NAMES NO. NAMES NO. NAMES
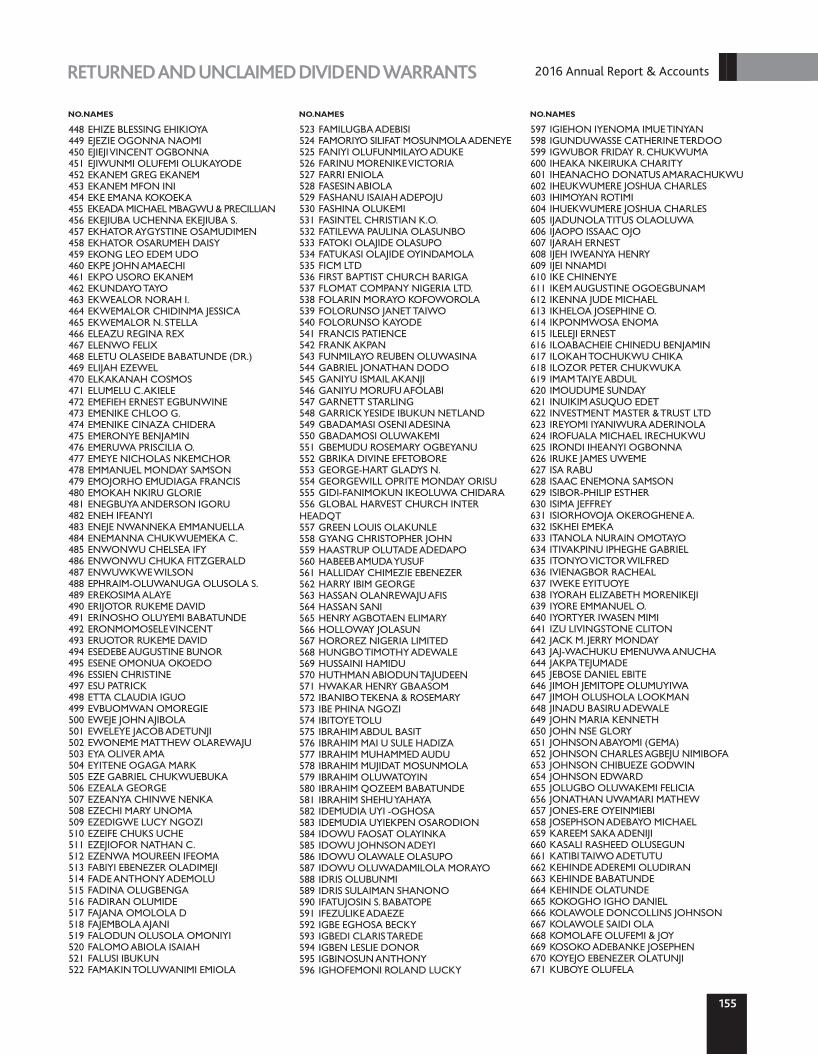
2155
2016 Annual Report & AccountsRETURNED AND UNCLAIMED DIVIDEND WARRANTS
448 EHIZE BLESSING EHIKIOYA449 EJEZIE OGONNA NAOMI450 EJIEJI VINCENT OGBONNA451 EJIWUNMI OLUFEMI OLUKAYODE452 EKANEM GREG EKANEM453 EKANEM MFON INI454 EKE EMANA KOKOEKA455 EKEADA MICHAEL MBAGWU & PRECILLIAN456 EKEJIUBA UCHENNA EKEJIUBA S.457 EKHATOR AYGYSTINE OSAMUDIMEN458 EKHATOR OSARUMEH DAISY459 EKONG LEO EDEM UDO460 EKPE JOHN AMAECHI461 EKPO USORO EKANEM462 EKUNDAYO TAYO463 EKWEALOR NORAH I.464 EKWEMALOR CHIDINMA JESSICA465 EKWEMALOR N. STELLA466 ELEAZU REGINA REX467 ELENWO FELIX468 ELETU OLASEIDE BABATUNDE (DR.)469 ELIJAH EZEWEL470 ELKAKANAH COSMOS471 ELUMELU C. AKIELE472 EMEFIEH ERNEST EGBUNWINE473 EMENIKE CHLOO G.474 EMENIKE CINAZA CHIDERA475 EMERONYE BENJAMIN476 EMERUWA PRISCILIA O.477 EMEYE NICHOLAS NKEMCHOR478 EMMANUEL MONDAY SAMSON479 EMOJORHO EMUDIAGA FRANCIS480 EMOKAH NKIRU GLORIE481 ENEGBUYA ANDERSON IGORU482 ENEH IFEANYI483 ENEJE NWANNEKA EMMANUELLA484 ENEMANNA CHUKWUEMEKA C.485 ENWONWU CHELSEA IFY486 ENWONWU CHUKA FITZGERALD487 ENWUWKWE WILSON488 EPHRAIM-OLUWANUGA OLUSOLA S.489 EREKOSIMA ALAYE490 ERIJOTOR RUKEME DAVID491 ERINOSHO OLUYEMI BABATUNDE492 ERONMOMOSELE VINCENT493 ERUOTOR RUKEME DAVID494 ESEDEBE AUGUSTINE BUNOR495 ESENE OMONUA OKOEDO496 ESSIEN CHRISTINE497 ESU PATRICK498 ETTA CLAUDIA IGUO499 EVBUOMWAN OMOREGIE500 EWEJE JOHN AJIBOLA501 EWELEYE JACOB ADETUNJI502 EWONEME MATTHEW OLAREWAJU503 EYA OLIVER AMA504 EYITENE OGAGA MARK505 EZE GABRIEL CHUKWUEBUKA506 EZEALA GEORGE507 EZEANYA CHINWE NENKA508 EZECHI MARY UNOMA509 EZEDIGWE LUCY NGOZI510 EZEIFE CHUKS UCHE511 EZEJIOFOR NATHAN C.512 EZENWA MOUREEN IFEOMA513 FABIYI EBENEZER OLADIMEJI514 FADE ANTHONY ADEMOLU515 FADINA OLUGBENGA516 FADIRAN OLUMIDE517 FAJANA OMOLOLA D518 FAJEMBOLA AJANI519 FALODUN OLUSOLA OMONIYI520 FALOMO ABIOLA ISAIAH521 FALUSI IBUKUN522 FAMAKIN TOLUWANIMI EMIOLA
523 FAMILUGBA ADEBISI524 FAMORIYO SILIFAT MOSUNMOLA ADENEYE525 FANIYI OLUFUNMILAYO ADUKE526 FARINU MORENIKE VICTORIA527 FARRI ENIOLA528 FASESIN ABIOLA529 FASHANU ISAIAH ADEPOJU530 FASHINA OLUKEMI531 FASINTEL CHRISTIAN K.O.532 FATILEWA PAULINA OLASUNBO533 FATOKI OLAJIDE OLASUPO534 FATUKASI OLAJIDE OYINDAMOLA535 FICM LTD536 FIRST BAPTIST CHURCH BARIGA537 FLOMAT COMPANY NIGERIA LTD.538 FOLARIN MORAYO KOFOWOROLA539 FOLORUNSO JANET TAIWO540 FOLORUNSO KAYODE541 FRANCIS PATIENCE542 FRANK AKPAN543 FUNMILAYO REUBEN OLUWASINA544 GABRIEL JONATHAN DODO545 GANIYU ISMAIL AKANJI546 GANIYU MORUFU AFOLABI547 GARNETT STARLING548 GARRICK YESIDE IBUKUN NETLAND549 GBADAMASI OSENI ADESINA550 GBADAMOSI OLUWAKEMI551 GBEMUDU ROSEMARY OGBEYANU552 GBRIKA DIVINE EFETOBORE553 GEORGE-HART GLADYS N.554 GEORGEWILL OPRITE MONDAY ORISU555 GIDI-FANIMOKUN IKEOLUWA CHIDARA556 GLOBAL HARVEST CHURCH INTER HEADQT557 GREEN LOUIS OLAKUNLE558 GYANG CHRISTOPHER JOHN559 HAASTRUP OLUTADE ADEDAPO560 HABEEB AMUDA YUSUF561 HALLIDAY CHIMEZIE EBENEZER562 HARRY IBIM GEORGE563 HASSAN OLANREWAJU AFIS564 HASSAN SANI565 HENRY AGBOTAEN ELIMARY566 HOLLOWAY JOLASUN567 HOROREZ NIGERIA LIMITED568 HUNGBO TIMOTHY ADEWALE569 HUSSAINI HAMIDU570 HUTHMAN ABIODUN TAJUDEEN571 HWAKAR HENRY GBAASOM572 IBANIBO TEKENA & ROSEMARY573 IBE PHINA NGOZI574 IBITOYE TOLU575 IBRAHIM ABDUL BASIT576 IBRAHIM MAI U SULE HADIZA577 IBRAHIM MUHAMMED AUDU578 IBRAHIM MUJIDAT MOSUNMOLA579 IBRAHIM OLUWATOYIN580 IBRAHIM QOZEEM BABATUNDE581 IBRAHIM SHEHU YAHAYA582 IDEMUDIA UYI -OGHOSA583 IDEMUDIA UYIEKPEN OSARODION584 IDOWU FAOSAT OLAYINKA585 IDOWU JOHNSON ADEYI586 IDOWU OLAWALE OLASUPO587 IDOWU OLUWADAMILOLA MORAYO588 IDRIS OLUBUNMI589 IDRIS SULAIMAN SHANONO590 IFATUJOSIN S. BABATOPE591 IFEZULIKE ADAEZE592 IGBE EGHOSA BECKY593 IGBEDI CLARIS TAREDE594 IGBEN LESLIE DONOR595 IGBINOSUN ANTHONY596 IGHOFEMONI ROLAND LUCKY
597 IGIEHON IYENOMA IMUE TINYAN598 IGUNDUWASSE CATHERINE TERDOO599 IGWUBOR FRIDAY R. CHUKWUMA600 IHEAKA NKEIRUKA CHARITY601 IHEANACHO DONATUS AMARACHUKWU 602 IHEUKWUMERE JOSHUA CHARLES 603 IHIMOYAN ROTIMI 604 IHUEKWUMERE JOSHUA CHARLES 605 IJADUNOLA TITUS OLAOLUWA 606 IJAOPO ISSAAC OJO 607 IJARAH ERNEST 608 IJEH IWEANYA HENRY 609 IJEI NNAMDI 610 IKE CHINENYE 611 IKEM AUGUSTINE OGOEGBUNAM 612 IKENNA JUDE MICHAEL 613 IKHELOA JOSEPHINE O. 614 IKPONMWOSA ENOMA 615 ILELEJI ERNEST 616 ILOABACHEIE CHINEDU BENJAMIN 617 ILOKAH TOCHUKWU CHIKA 618 ILOZOR PETER CHUKWUKA 619 IMAM TAIYE ABDUL 620 IMOUDUME SUNDAY 621 INUIKIM ASUQUO EDET 622 INVESTMENT MASTER & TRUST LTD 623 IREYOMI IYANIWURA ADERINOLA 624 IROFUALA MICHAEL IRECHUKWU 625 IRONDI IHEANYI OGBONNA 626 IRUKE JAMES UWEME 627 ISA RABU 628 ISAAC ENEMONA SAMSON 629 ISIBOR-PHILIP ESTHER 630 ISIMA JEFFREY 631 ISIORHOVOJA OKEROGHENE A. 632 ISKHEI EMEKA 633 ITANOLA NURAIN OMOTAYO 634 ITIVAKPINU IPHEGHE GABRIEL 635 ITONYO VICTOR WILFRED 636 IVIENAGBOR RACHEAL 637 IWEKE EYITUOYE 638 IYORAH ELIZABETH MORENIKEJI 639 IYORE EMMANUEL O. 640 IYORTYER IWASEN MIMI 641 IZU LIVINGSTONE CLITON 642 JACK M. JERRY MONDAY 643 JAJ-WACHUKU EMENUWA ANUCHA 644 JAKPA TEJUMADE 645 JEBOSE DANIEL EBITE 646 JIMOH JEMITOPE OLUMUYIWA 647 JIMOH OLUSHOLA LOOKMAN 648 JINADU BASIRU ADEWALE 649 JOHN MARIA KENNETH 650 JOHN NSE GLORY 651 JOHNSON ABAYOMI (GEMA) 652 JOHNSON CHARLES AGBEJU NIMIBOFA 653 JOHNSON CHIBUEZE GODWIN 654 JOHNSON EDWARD 655 JOLUGBO OLUWAKEMI FELICIA 656 JONATHAN UWAMARI MATHEW 657 JONES-ERE OYEINMIEBI 658 JOSEPHSON ADEBAYO MICHAEL 659 KAREEM SAKA ADENIJI 660 KASALI RASHEED OLUSEGUN 661 KATIBI TAIWO ADETUTU 662 KEHINDE ADEREMI OLUDIRAN 663 KEHINDE BABATUNDE 664 KEHINDE OLATUNDE 665 KOKOGHO IGHO DANIEL 666 KOLAWOLE DONCOLLINS JOHNSON 667 KOLAWOLE SAIDI OLA 668 KOMOLAFE OLUFEMI & JOY 669 KOSOKO ADEBANKE JOSEPHEN 670 KOYEJO EBENEZER OLATUNJI 671 KUBOYE OLUFELA
NO. NAMES NO. NAMES NO. NAMES

672 KUDLA FRANK SATUMARI 673 KUJE HOSEA AMOS 674 KUTENHA DARLINGTON 675 KUYINU OLUYINKA AKINKUNMI 676 LADIPO KOLAWOLE 677 LAGOKE OLUWAGBOLAHAN 678 LAIZER JOSEPH DAVID O. 679 LAJORIN OLUSINA EBENEZER 680 LALA ADEFOLAHAN OLANREWAJU 681 LANIYAN SOLOMON OLA 682 LANOSBERE KATHLEEN CLAIRE 683 LAOSHE AFOLAKE 684 LAW BOMA 685 LAWAL ABDUL-WAHAB 686 LAWAL KEHINDE 687 LAWAL KOLAWOLE 688 LAWAL KOLAWOLE ADEWALE 689 LAWAL SAIDAT MOSADOLUWA 690 LEVI DENEN ADAGA 691 LOOLO ISAELE TAMBARI 692 M/S FOLLY & SONS AUTO ENGINEERING 693 MACAULAY AKIN 694 MADUKA GEORGE EMEKA 695 MALIZU CHINERMEREM BENDI 696 MALIZU KOSIRISO CHUKWU 697 MALOMO ABOSEDE GRACE 698 MARVEL TRADES & SERVICES 699 MBERU CEPHAS 700 MEWOMO BABATUNDE AYORINDE 701 MGBOJIKWE DARLINGTON NDUKWE 702 MILTON OGBONNAYA NWOSU 703 MINAINYO TAMUNO-OPUBO TAMSY 704 MOHAMMED ABBAS FATIMA 705 MOHAMMED IBRAHIM KABIR 706 MOKWENYE EUSTACE AKA 707 MORDI CHIADIKA ESTHER EBELE 708 MSHELLIA ASURA MUAZU 709 MUHAMMAD HALILU BICHI 710 MURPHY UZOHUE OBIANUJU BERTHA 711 MUSA MUDASIRU 712 MUSTAPHER GANIYU ADEBAYO 713 NAZEGBULAM CHRISTOPHER OLUMIDE 714 NDEM ERIC UWEMEDIMOH 715 NDUBUISI ANTHONIA NGOZI 716 NDUBUISI KISSINGER UGOCHUKWU 717 NDUKWE UCHECHUKWU 718 NDULUE BENEDICT CHIKE 719 NDULUE CYRIL CHUKWUMA 720 NEWDEVCO FINANCE SERVICES COMPANY 721 NGBANWA OBI SUNDAY PAUL 722 NIMKWAM MANKAR NICHOLAS 723 NINGI ABDUL ADAMU 724 NJOKU EBERE CATHY 725 NKEZE ANTHONY SUNDAY 726 NKPOSONG ASUQUO EDET 727 NWABUEZE JUDE NZE 728 NWAIMO AUGUSTINE 729 NWAJEI FRIDAY 730 NWAJUO HYGINUS IHEANA EJERE 731 NWANI OSITA EZEKIEL 732 NWANKWO OGBONNA CHRISTIAN 733 NWANKWUDO PERPETUA UJU 734 NWANZE JEFF CHIKEZIE JUDE 735 NWAODU CHIGOZIRIM CHINAZO 736 NWAZUO FRANCIS CHINEDU 737 NWOGU JOSEPH (MR & MRS) 738 NWOKO EJIKE LEXIUS 739 NWOKORO NGOZI AMAKA 740 NWOSU MONDAY SAMPSON 741 NYONG ANTHONY EFFIONG 742 NZEREOGU VICTOR U. 743 OAKS INVESTMENT LIMITED 744 OAMEN ANTHONY O. 745 OARHE ADEKOLA 746 OARHE IZEBE CHRISTOPHER
747 OBASEKI OLUBANKE 748 OBASI CORNELIUS 749 OBEBE ADEKUNLE TOLULOPE 750 OBETTA CALLISTUS 751 OBI JULIET NKIRUKA 752 OBI OBAMCHUKWU A. 753 OBI OGOCHUKWU 754 OBICHUKWU MADUKA JOSHUA 755 OBISESAN BABATUNDE MUSTAPHA 756 OBRIMAH OGHENEVIE O. 757 OBUBA CHINEME 758 OCHOLI BLESSING 759 ODAMAH IKHIA OGBOR JOYCE 760 ODAUDU ABIMAJE DAVID 761 ODEBIYI NURUDEEN BOLAJI 762 ODEDIRAN TAIWO 763 ODEH OSAROBO HENDRIX 764 ODEKUNLE MICHAEL AJIBOLA 765 ODEKUNLE TAIWO OLUDELE 766 ODELEYE OLUWAKEMI767 ODERINDE ABAYOMI ALANI 768 ODERINDE IDOWU 769 ODETOYINBO SUSAN TOMI 770 ODHURA EMMANUEL EKEMENA 771 ODIH DAVID OGAGAOGHENE 772 ODII FREDS CHUKWUEMEKA 773 ODUBELA KATHERINE 774 ODULATE JOSEPH OLUSOLA 775 ODUNTAN OLAJIDE 776 ODUSANYA BOLANLE 777 ODUSOTE OLALERE 778 ODUYOYE MORENIKE & AYOTOMIWA 779 OFFIA GABRIEL CHIKA 780 OFODEME CHINEDU 781 OFOGBA PATRICIA LAIRE 782 OGBE JOHN OGBE 783 OGBEDE GEORGE EZENWA 784 OGBIMI ACHERE IBIFURO 785 OGBISE MIEBIDOU DAVID 786 OGBOMA OBI SUNDAY 787 OGBONNA FAVOUR EBERE 788 OGBUOKIRI AMARACHUKWU 789 OGBUOKIRI JOCELYN ANARIOCHI 790 OGENYI AUDU EMMANUEL 791 OGHAEGO IFECHUKWU 792 OGHOBASE DEBORAH 793 OGIUGO OSAMEDE TEMITOPE 794 OGUDU FUNKE 795 OGUNBAMIYO SOLAPE BOLAJI 796 OGUNDELE ADEBAYO SUNDAY 797 OGUNDELE OLABANJI JOEL 798 OGUNDIPE OLUBUNMI 799 OGUNFERE OWEN 800 OGUNFOWODU OLAJUWON OMOPARIOLA 801 OGUNGBEMI KAYODE IBUKUNOLUWA 802 OGUNGBESAN OYINDAMOLA KAYODE 803 OGUNJOBI OLAWALE OLUSEGUN 804 OGUNLEYE BOLAJI 805 OGUNLEYE CHRISTIANAH OLAYINKA 806 OGUNLEYE ROTIMI WILLIAMS 807 OGUNMADEJI JULIUS 808 OGUNNIRAN MICHAEL 809 OGUNNIRAN RUTH OLUSOLA 810 OGUNS AYORINDE OMOTAYO 811 OGUNSANYA RAPHAEL 812 OGUNSOLA GBENGA THOMAS 813 OGUNTADE MATHEW & OLUBUKOLA ODUNAYO 814 OGUNTUNDE OLALEKAN 815 OGUNYALE IBUKUN MICHAEL 816 OHA CHIBUEZE 817 OHINDASE SANUSI MOHAMMED A. 818 OJADI FELIX NDUBUISI 819 OJI CHINEDUM OKECHUKWU 820 OJIEGO BEATRICE 821 OJIKUTU OLUSEYI MORENIKE
822 OJINNI NDUBUISI 823 OJO ALBERT OLUWOLE 824 OJO EZEKIEL OLUWASEYI 825 OJO OLUFEMI EBENEZER 826 OJOBO FAVOUR 827 OKAFOR FRANCIS C. E. 828 OKAFOR KENECHUKWU HILARY 829 OKAFOR OKECHUKWU FRANCIS 830 OKANRENDE OLADOTUN OLAWALE 831 OKAREME RICHARD OMAMUZO 832 OKE BABATUNDE ADEYEMI 833 OKEKE AUSTIN OKWUDILI 834 OKEUGO EMEKA ONYEAGOZIRI 835 OKEWOLE RANTI FLORENCE 836 OKHIGBOCHIE E. DONATUS 837 OKOH ISRAEL CHUKWUYEMI 838 OKOJIE EDWARD 839 OKOJIE JOSEPH OSA 840 OKOLI CHUKWUDI CHARLES 841 OKOLO A. DAVID 842 OKOLO STELLA MARIS 843 OKONKWO OBINNA UZOMA 844 OKONKWO TOCHUKWU JOSHUA 845 OKORIE AGATHA IHUNNA 846 OKOROH ROSE ORITSEWEYINMI 847 OKOSUN PHILOMINA E. 848 OKOTIE VINCENT 849 OKOYE AFAMEFUNA NNAMDI O. 850 OKOYE CHIKE 851 OKOYE IFEANYI COLIN 852 OKOYE IJEOMA OLEMENTINA 853 OKOYE MARTIN OLISA 854 OKPALA EBELE PATRICK 855 OKPARA CHUKWUDALU SANTUS 856 OKUBENA IBRAHIM OLAWALE 857 OKUMA AGHOGHO OGHOGHO 858 OKWARA KENNEDY STAN 859 OLAAJE AJEBIYI A. 860 OLABISI ADEDAYO 861 OLABODE SOLA 862 OLADAPO AJIBOLA YEMISI 863 OLADEJI OLANREWAJU TOBA 864 OLADEJO 865 OLADEJO MAJEMITE ADEREMI 866 OLADEJO TUNDE BAMIDELE 867 OLADUJA ADEMOLA OJO 868 OLADUNJOYE GEORGE ABAYOMI 869 OLAFUSI ADEOLA OLAMIPOSI 870 OLAGBAJU PATRICIA ADEJOKE K. 871 OLAITAN MICHAEL OLUFEMI 872 OLAIYA ABIMBOLA BUKOLA 873 OLALERE JIMOH ALABA 874 OLALEYE OMOBOLANLE 875 OLAMIDE JOSEPH BAMIGBOLA 876 OLANIYAN ABDULRASAQ ALIYU 877 OLANIYAN BOLA MISS 878 OLANIYAN OLUGBENGA 879 OLANIYI RAPHAEL SOJI TAYE 880 OLANREWAJU OLAWOLE ISHOLA 881 OLANREWAJU OLUGBENGA SAMUEL 882 OLAOSEBIKAN TUNDE 883 OLATUNJI IDOWU 884 OLAWOYE JOHNSON DAPO 885 OLAYEMI EMMANUEL AYINLA 886 OLAYERA BUKOLA SAMSON 887 OLISA OBINNA MOSES 888 OLORUNFEMI MODUPE 889 OLORUNSOLA PETER IBUKUN 890 OLOWOKERE OLANIYI JULIUS 891 OLOWO-OKERE MOPELOLA OMOYENI 892 OLUBANIYI GRACE MORONUMUBO 893 OLUBOYO VINCENT & ABIMBOLA (MR & MRS) 894 OLUFIDIPE TOLUWALASE 895 OLUJEDE ALADE ANTHONY 896 OLUMEGBON RISIKAT ABIMBOLA
2
TABLE OF CONTENT2016 Annual Report & Accounts
156
RETURNED AND UNCLAIMED DIVIDEND WARRANTS
NO. NAMES NO. NAMES NO. NAMES

2
TABLE OF CONTENT
157
2016 Annual Report & AccountsRETURNED AND UNCLAIMED DIVIDEND WARRANTS
897 OLUMIDE OTOME 898 OLUREMI BOLANLE OLUDOTUN 899 OLUWADARE SUNDAY VICTOR 900 OLUWADUNMININU OGUNSOLA 901 OLUWAKOREDE NURUDEEN902 OLUWO FASHOLA OLADIPUPO903 OLUWOLE RICHARD OJO904 OMAGHOMI JULIET MARTHA905 OMALE JEREMIAH PAUL906 OMIDIORA VICTOR AKINWUNMI907 OMISANYA ABDUL WASI'L ADENIYI908 OMODIALE HELEN909 OMOFAYE BOASON OLA910 OMOLOKUN OMOTUN OMOTOPE911 OMOMOWO OMOLAFE OLANREWAJU912 OMON ANTHONY OHIOLE913 OMONIJE OPEYEMI OLUWASEUN O.914 OMONIYI FOLASAYO BUKOLA915 OMOPARIOLA AYODELE SOLOMON916 OMOTAYO OLANREWAJU KABIRU917 ONABANJO ALEXANDER918 ONABANJO KAYODE919 ONABANJO VICTOR OLUFEMI920 ONABIYI TAJUDEEN921 ONAFOWOKAN A. ADERONKE922 ONAFOWOKAN OLUWASEGUN923 ONALAJA OLUWAFEMI OMOTOLA924 ONANUGA LATEEF925 ONASANYA ALABA926 ONIFADE D.MOBOLADE927 ONIKOYI TUNDE OLANREWAJU AVIODUN928 ONOGHA GIFT ESE929 ONUEGBO NAPOLEON CHIJOKE930 ONUOHA SUSAN OBIAGERI931 ONUOHA UCHE SEBASTINE932 ONUORAH VERU UZOAMAKA933 ONWUACHU CHIMEZIE DARLINGTON934 ONWUEGBUNA CHIMAOBI TOBENNA935 ONWUEGBUNA OBIANUJU GERALDINE936 ONWUENWEOLOR FELICIA ADUJIE937 ONYEKA CHUKWUEMEKA938 ONYEKWELAONWU CHIGOZIRI939 OPARA WONUKWURU GODFREY940 OPARISON MORAKINYO941 ORIAFOH BEATRICE ITOSE942 ORIHIE GRACE C.943 ORIOYE MOSUNMOLA BUKOLA944 ORJI FRANCIS ODU945 ORUNGBEMI TEMITOPE TIMOTHY946 ORUPABO DANIEL I.947 OSAROBO OSAZEE PETERS948 OSHILE JOHN BABATUNDE CHIEF949 OSHODI ADIJAT OLUWAKEMI950 OSIGWE ROSEMARY LEBORN951 OSIPITAN JONATHAN ADEGBUYI952 OSULA OGHOGHO (MRS)953 OSUNDEKO OLUSEYE954 OSUNKWO COLLINS CHINEDU955 OTAIGBE MICHAEL IJEZELE956 OTUN KAYODE957 OVWIGHOWHARA OKIEMUTE VERA958 OWOEYE FISAYO ROSEMARY959 OWOLABI BABATUNDE RAFIU960 OYAWUSI FOLUSHO I.961 OYEBAMIJI BOLA962 OYEBAMIJI WALIU
963 OYEBANJO PROPERTY & INV. LTD.964 OYENIRAN MICHAEL OLUNISOLA965 OYERINU ADEBAYO OLUGBENGA966 OYEROGBA OYERINDE OWOLABI967 OYETOLA TITUS968 OYETOYAN SUKANMI969 OYEWOLE FEMI CLAUDIE970 OYEWOLE GEORGE971 OYEWOLE MARIAM ASHABI972 OYEWUMI OLWAKEMI973 OYIBO ONALO974 OZOR CHINEDU REMIGIUS975 PARA KINGDOM JUSTINA976 PASEDA ADEDAYO OLUSESAN977 PENSURE PFA LIMITED978 PETER RICHARD OKPU979 PROMINENT SECURITIES LTD980 PROSPERITY INVESTMENT CLUB981 RAJI GANIYU AJIBOYEDE982 RAZAK-ADAMS BOLADALE O. (MRS)983 RAZAK-ADAMS OLUWADAMILOLA O. O.984 REUBEN ADEBAYO OLUSEGUN985 ROSANWO GLORIA OMOBAMIDELE O.986 RUFAI BOSUN HAKEEM987 RUFUS BABATUNDE OLUSHOLA988 SADIQ ENEYAMIRE PRECIOUS989 SADU RUKAYAT OPEYEMI990 SAIBU RASAQ SEDIE991 SALIHU ABRAHAM992 SANUSI IDOWU DAUDA993 SELERE OLUWATOYIN OPEOLUWA994 SHOFOLA YISA BABATUNDE995 SHOTOMIWA MULIKATU BOLANLE996 SIMON LOHNAN DAVID997 SMITH BENJAMIN DENNIS EVANG.998 SMITH MOSUNMOLA FAUSAT999 SODANGI ABUBAKAR DANSO1000 SODOLA OLUFEMI JAMES1001 SOFOLA-ORUKOTAN ONAOPEMIPO PRECIOUS1002 SOKAN BABATUNDE ADETOKUNBO1003 SOLOMON IDONGESIT AND INEMESIT1004 SOLOMON NSIKAN PATRICK1005 SONGONUGA BABATUNDE1006 SORIBE IBEAWUCHI FESTUS1007 SOWANDE LEKAN1008 SPINKS INTERNATIONAL LIMITED1009 STARDILL LIMITED1010 SUBAIR LATEEF AYODELE1011 SUMMA GUARANTY & TRUST COY LTD.1012 SUNMOLA ADEYEMI M.1013 TANKO CLETUS1014 TARFA REBECCA1015 TAUPYEN SHALDAM1016 TEMILOLUWA ADEOLA OKUNSOLUBO1017 TEWE AYODEJI1018 THEODORE ALLEN NIGERIA LIMITED1019 THEOTON MEGA CONCEPT1020 THOMAS ADEBISI SARIYU1021 THOMSON O. FAPOHUNDA1022 TIAMIYU ISMAIL ADESHINA1023 TIDDO UNIVERSAL SEC FIN TRADED STO1024 TIJANI KAZEEM OYEWALE1025 TITUS OYETOLA1026 TOBRISE SAMUEL1027 TOKODE OLUSEGUN O
1028 TOMORI ADIJAT OLAIDE1029 TOMORI OLABODE FELIX1030 TOWADECON LIMITED1031 TUKURU ABIODUN1032 UCHENDU CHIBUZO BASIL1033 UDEMEZUE UCHE NJIDEKA1034 UDEZE JOSEPH SUNDAY1035 UDO IQUO OKON1036 UDO KENNETH T.1037 UDOH OLUTAYO1038 UDOH STEVE1039 UDUEHI ODION1040 UGBE JOHN UGBE1041 UGBOMA OBI SUNDAY1042 UKATU GEORGE UGONNA1043 UKO LORETTA AKUDO1044 UKO ONWUKA UCHE1045 UKO RUTH IKEME UKO1046 UKPEBOR THOMPSON OSALEN1047 UKPONG SAMUEL 1048 UKUTE JOSHUA LUCKY1049 UKWATAR KARI IYETOR1050 UMAR MOHAMMED SANNI1051 UMARU ABIMBOLA OLUWANDE1052 UMARU ALLI BABTUNDE1053 UMARU MICHAEL1054 UMEH OLIVER OKECHUKWU1055 UMEOZULU OGOCHUKWU FRANCIS1056 UMEUGOJI NNEKA CHINENYE1057 UMOH ENOBONG EMMANUEL1058 UMOH NSIKAN KINGSLEY1059 UMOH UBONG OKON1060 UMOH UNYIME LEONARD1061 UWAKWE JULIAN KINGSLEY1062 UWAYA JOSEPH1063 UWUILEKHUE MARTINS1064 UZOH OKWUDIRI JULIUS1065 WAFTA MOHAMMED HUSSEIN1066 WATTI EMMANUEL TEMITOPE1067 WILLIAMS JOSHUA OLAKUNLE1068 WILLIAMS MOBOLAJI OLUWASEUN1069 WILMA NWANZE TEEN1070 WILSON IROHAM ENYINNAYA1071 WODI ADAOBI CHIOMA1072 WUESE JOSEPHINE1073 YAHAYA AYOTUNDE1074 YAHAYA JOLAOLUWA1075 YAHAYA MUKHTAR UMAR1076 YAKUBU IBRAHIM1077 YAMIESEIFA OFEM UBI1078 YINUSA ADIGUN RASAK1079 YINUSA KAZEEM ADEKUNLE1080 YUNANA YAHAYA YILA1081 YUSSUF SODIQ OLANREWAJU1082 YUSUF ABDULKADIR ALHAJI1083 YUSUF OPEMI RAKIYA1084 ZIMEST INVEST & MGT. COMPANY
NO. NAMES NO. NAMES NO. NAMES


REGISTRATION/ADMISSIONFORMS


Notes

Notes

REGISTRARS:Lighthouse Registrars Limited,
2/4 Davis Street, Kingsway Building, Marina, Lagos.
AFFIX PIXHERE PLS
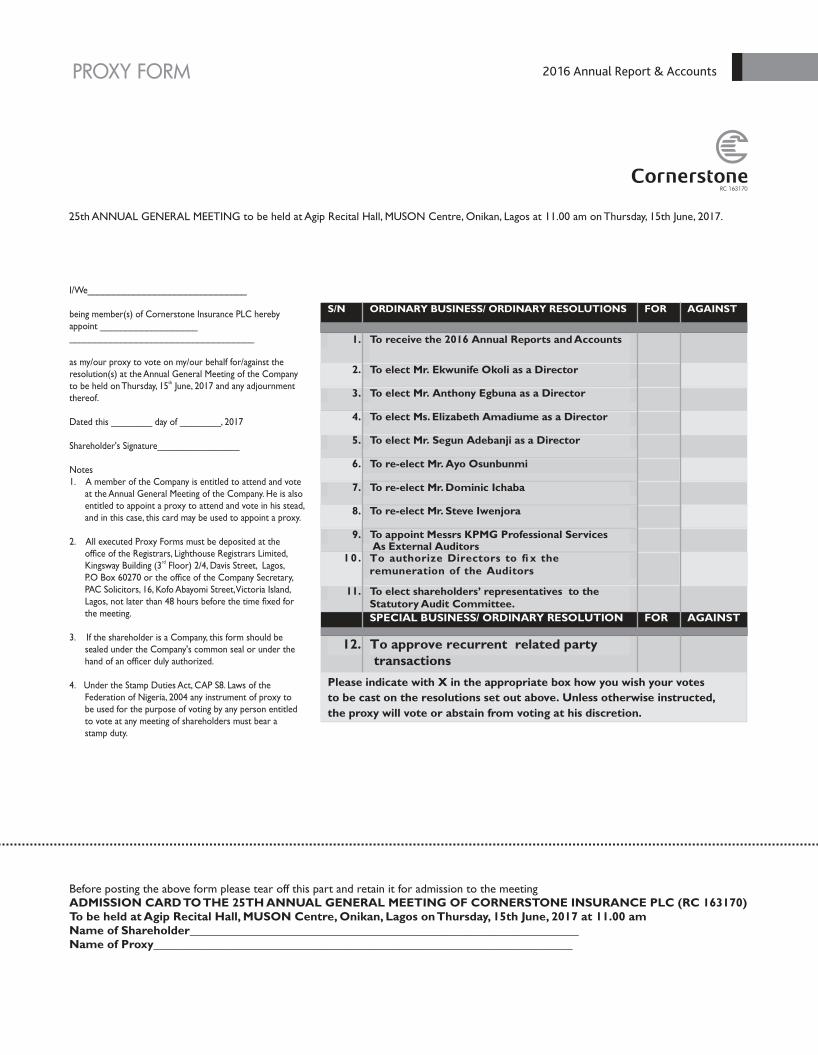
25th ANNUAL GENERAL MEETING to be held at Agip Recital Hall, MUSON Centre, Onikan, Lagos at 11.00 am on Thursday, 15th June, 2017.
RC 163170
I/We_______________________________
being member(s) of Cornerstone Insurance PLC hereby appoint _______________________________________________________
as my/our proxy to vote on my/our behalf for/against the resolution(s) at the Annual General Meeting of the Company
thto be held on Thursday, 15 June, 2017 and any adjournmentthereof.
Dated this ________ day of ________, 2017
Shareholder's Signature________________
Notes1. A member of the Company is entitled to attend and vote at the Annual General Meeting of the Company. He is also entitled to appoint a proxy to attend and vote in his stead, and in this case, this card may be used to appoint a proxy.
2. All executed Proxy Forms must be deposited at the office of the Registrars, Lighthouse Registrars Limited,
rd Kingsway Building (3 Floor) 2/4, Davis Street, Lagos, P.O Box 60270 or the office of the Company Secretary, PAC Solicitors, 16, Kofo Abayomi Street, Victoria Island, Lagos, not later than 48 hours before the time fixed for the meeting.
3. If the shareholder is a Company, this form should be sealed under the Company's common seal or under the hand of an officer duly authorized.
4. Under the Stamp Duties Act, CAP S8. Laws of the Federation of Nigeria, 2004 any instrument of proxy to be used for the purpose of voting by any person entitled to vote at any meeting of shareholders must bear a stamp duty.
Before posting the above form please tear off this part and retain it for admission to the meeting ADMISSION CARD TO THE 25TH ANNUAL GENERAL MEETING OF CORNERSTONE INSURANCE PLC (RC 163170)To be held at Agip Recital Hall, MUSON Centre, Onikan, Lagos on Thursday, 15th June, 2017 at 11.00 amName of Shareholder_________________________________________________________________Name of Proxy______________________________________________________________________
PROXY FORM 2016 Annual Report & Accounts
1. To receive the 2016 Annual Reports and Accounts
2. To elect Mr. Ekwunife Okoli as a Director
3. To elect Mr. Anthony Egbuna as a Director
4. To elect Ms. Elizabeth Amadiume as a Director
5. To elect Mr. Segun Adebanji as a Director
9.
11. To elect shareholders’ representatives to theStatutory Audit Committee.
12. To approve recurrent related partytransactions
AGAINSTORDINARY BUSINESS/ ORDINARY RESOLUTIONS FORS/N
SPECIAL BUSINESS/ ORDINARY RESOLUTION FOR AGAINST
to be cast on the resolutions set out above. Unless otherwise instructed,the proxy will vote or abstain from voting at his discretion.
Please indicate with X in the appropriate box how you wish your votes
2.
4.
6.
7. To re-elect Mr. Dominic Ichaba
To re-elect Mr. Ayo Osunbunmi
8. To re-elect Mr. Steve Iwenjora
10. To authorize Directors to fi x theremuneration of the Auditors
To appoint Messrs KPMG Professional Services As External Auditors
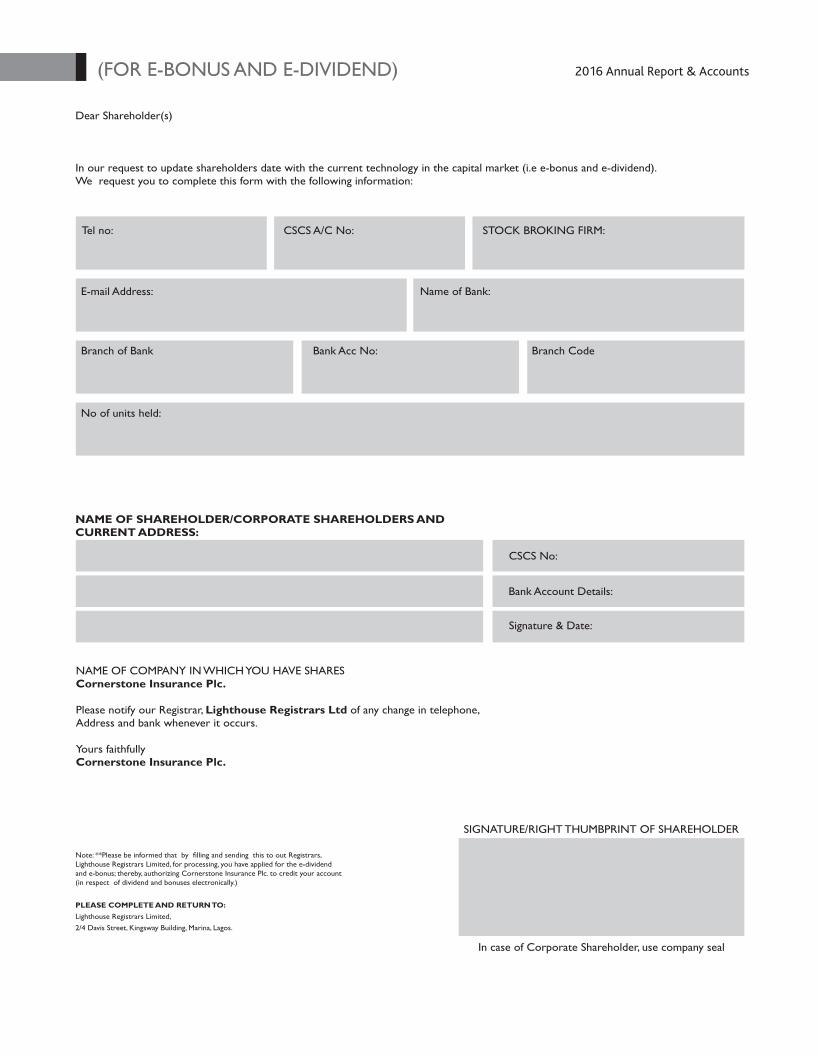
Dear Shareholder(s)
In our request to update shareholders date with the current technology in the capital market (i.e e-bonus and e-dividend).We request you to complete this form with the following information:
Tel no: CSCS A/C No: STOCK BROKING FIRM:
E-mail Address: Name of Bank:
Branch of Bank Bank Acc No: Branch Code
No of units held:
NAME OF SHAREHOLDER/CORPORATE SHAREHOLDERS AND CURRENT ADDRESS:
CSCS No:
Bank Account Details:
Signature & Date:
NAME OF COMPANY IN WHICH YOU HAVE SHARESCornerstone Insurance Plc.
Please notify our Registrar, Lighthouse Registrars Ltd of any change in telephone,Address and bank whenever it occurs.
Yours faithfullyCornerstone Insurance Plc.
SIGNATURE/RIGHT THUMBPRINT OF SHAREHOLDER
In case of Corporate Shareholder, use company seal
Note: **Please be informed that by filling and sending this to out Registrars,Lighthouse Registrars Limited, for processing, you have applied for the e-dividendand e-bonus; thereby, authorizing Cornerstone Insurance Plc. to credit your account (in respect of dividend and bonuses electronically.)
PLEASE COMPLETE AND RETURN TO:Lighthouse Registrars Limited,
2/4 Davis Street, Kingsway Building, Marina, Lagos.
(FOR E-BONUS AND E-DIVIDEND) 2016 Annual Report & Accounts

TABLE OF CONTENT
AFFIX PIXHERE PLS
REGISTRARS:Lighthouse Registrars Limited,
2/4 Davis Street, Kingsway Building, Marina, Lagos.
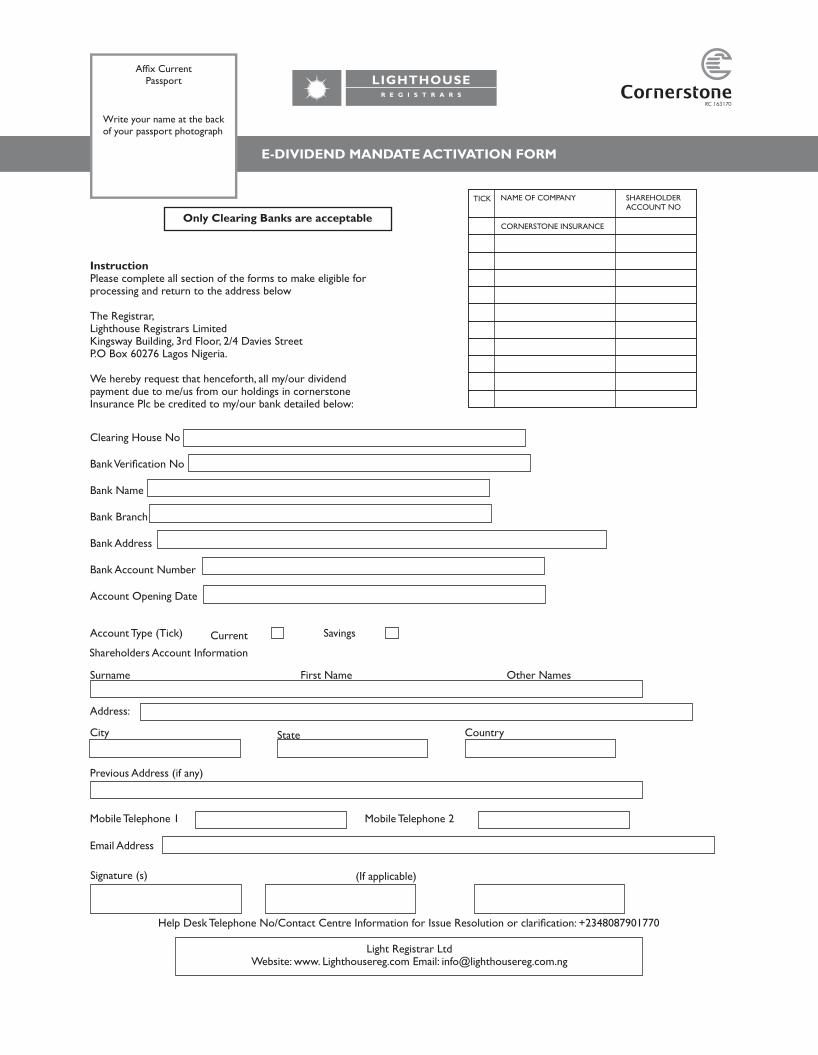
RC 163170
Write your name at the back of your passport photograph
Affix Current Passport
E-DIVIDEND MANDATE ACTIVATION FORM
TICK NAME OF COMPANY SHAREHOLDER ACCOUNT NO
CORNERSTONE INSURANCE
LIGHTHOUSER E G I S T R A R S
Only Clearing Banks are acceptable
InstructionPlease complete all section of the forms to make eligible forprocessing and return to the address below
The Registrar,Lighthouse Registrars LimitedKingsway Building, 3rd Floor, 2/4 Davies StreetP.O Box 60276 Lagos Nigeria.
We hereby request that henceforth, all my/our dividend payment due to me/us from our holdings in cornerstoneInsurance Plc be credited to my/our bank detailed below:
Clearing House No
Bank Verification No
Bank Name
Bank Branch
Bank Address
Bank Account Number
Account Opening Date
Account Type (Tick) Current Savings
Shareholders Account Information
Address:
City State Country
Previous Address (if any)
Mobile Telephone 1 Mobile Telephone 2
Email Address
Signature (s) (If applicable)
Surname First Name Other Names
Light Registrar LtdWebsite: www. Lighthousereg.com Email: [email protected]
Help Desk Telephone No/Contact Centre Information for Issue Resolution or clarification: +2348087901770

nnual Report & Accounts
2016 Annual Report & Accounts
REGISTRARS:Lighthouse Registrars Limited,
2/4 Davis Street, Kingsway Building, Marina, Lagos.
AFFIX PIXHERE PLS


21, Water Corporation Drive, Off Ligali Ayorinde Street, Victoria Island, Lagos.
Tel: 012806500 Web: www.cornerstone.com.ng
Email: [email protected]
RC 163170
2016ANNUAL REPORT & ACCOUNTS
PROFESSIONALISM