raymond james canada research zodiac … · raymond james® canada research ... place (piip) on a...
TRANSCRIPT
RAYMOND JAMES® Canada Research Published by Raymond James Ltd
Please read domestic and foreign disclosure/risk information beginning on page 38 and Analyst Certification on page 39. Raymond James Ltd. | 2200 – 925 West Georgia Street | Vancouver BC Canada V6C 3L2
Zodiac Exploration Inc. May 11, 2011
ZEX-TSXV Company Report - Initiation of CoverageJustin Bouchard P.Eng., CFA | 403.509.0523 | [email protected]
Christopher Cox (Associate) | 403.509.0562 | [email protected]
Junior Oil & Gas Producers
ZEX: Initiating Coverage - Let’s Talk About ZEX, Baby!
Event We are initiating coverage on Zodiac Exploration Inc. with a $2.00 target price and an Outperform rating.
Action Zodiac has amassed a sizeable land position in the San Joaquin basin in California with a number of high impact oil prospects. We believe the company offers a compelling – yet speculative – investment opportunity with massive resource potential.
Analysis Zodiac Exploration is an emerging junior E&P company with a focus on exploiting light oil resource plays in the San Joaquin Basin in California, specifically within the Kings County region. The company is working in a challenging geological environment and is applying techniques thus far unproven within its target formations. Despite these concerns, we believe the potential payoff more than justifies the current share price.
This is an early stage resource play – not unlike the Viewfield Bakken in 2006 or the Eagle Ford in 2008, the oil is there; the key is in leveraging technology to unlock the resource potential;
The company has amassed a large contiguous land base in the San Joaquin Basin of ~85,000 net acres;
A number of companies have announced capital programs targeting unconventional oil opportunities in the San Joaquin Basin – most notably, Occidental has announced plans to spend upwards of $6.0 bln over the next four years predominantly targeting the ‘California Shales’;
Sproule has identified ~4.1 bln bbls of Best Estimate Petroleum Initially in Place (PIIP) on a portion of the Jaguar area. To put this into better context, that is roughly as much oil in place as exists in the entire Viewfield Bakken formation in Saskatchewan;
The company has drilled its first well into its Jaguar prospect area and initial test results are expected in the next several weeks.
Valuation Our $2.00 target price is based on our Risk Adjusted Net Asset Value of $2.02 (see Valuation and Recommendation sections for more details).
Cash 1Q 2Q 3Q 4Q Full Revenues NAV Flow/Share Dec Mar Jun Sep Year (mln)
2010A nm nm nm nm C$(0.01) C$0
2011E nm nm nm nm (0.01) 0 2.02
2012E nm nm nm nm (0.01) 0 na
Source: Raymond James Ltd., Thomson One
Rating & Target Outperform 2Target Price (6-12 mos): C$2.00Current Price ( May-09-11 ) C$1.02Total Return to Target 96%52-Week Range C$1.18 - C$0.35Market Data Market Capitalization (mln) C$431Current Net Debt (mln) -C$51Enterprise Value (mln) C$379Shares Outstanding (mln, f.d.) 422.2Average Daily Volume (000s) 587Dividend/Yield C$0.00/0.0% Key Financial Metrics 2010A 2011E 2012E
P/CFPS nm nm nm
P/NAV 0.5x na
WTI (US$/bbl) US$79.40 US$102.30 US$117.50
HHub (US$/mmbtu) US$4.41 US$3.80 US$4.25
Production: Conv. Oil & NGL (bbl/d) 0 0 0
Production: Natural Gas (mmdf/d) 0 0 0
Production: Total (boe/d) 0 0 0
EBITDA (mln) C$(3) C$(4) C$(3)
Net Debt/ Trailing Cash Flow nm nm nm Company Description Zodiac is an emerging junior E&P company with a focus on exploiting light oil resource plays within the San Joaquin Basin of California.

Canada Research | Page 2 of 44 Zodiac Exploration Inc.
Raymond James Ltd. | 2200 – 925 West Georgia Street | Vancouver BC Canada V6C 3L2
Table of Contents
Investment Overview.......................................................................................................................... 3
Company Overview............................................................................................................................. 3
Asset Overview ................................................................................................................................... 4
Financial Summary.............................................................................................................................. 18
Valuation............................................................................................................................................. 20
Recommendation ............................................................................................................................... 31
Risks .................................................................................................................................................... 32
Appendix A: Management & Board of Directors ................................................................................ 33
Appendix B: Financial Statements ...................................................................................................... 35

Zodiac Exploration Inc. Canada Research | Page 3 of 44
Raymond James Ltd. | 2200 – 925 West Georgia Street | Vancouver BC Canada V6C 3L2
Investment Overview
We are initiating coverage on Zodiac Exploration Inc. with an Outperform rating and a $2.00 target price, based on our Risk Adjusted Net Asset Value of $2.02 per share. Our recommendation is that investors consider an investment in Zodiac predicated on the following points:
1. Zodiac is an attractive and highly leveraged play on the emerging unconventional resource wave in California. While we believe there is potentially a big prize, it is worthwhile noting that there is still considerable risk. As a result, we view the story as a speculative opportunity;
2. Given the upside potential, balanced with what we believe are the risks inherent in proving up the light oil resource play, we are of the opinion that Zodiac is attractively priced at current levels;
3. This is an early stage resource play – not unlike the Viewfield Bakken in 2006 or the Eagle Ford in 2008, the oil is there; the key is in leveraging technology to unlock the resource potential;
4. The company has amassed a large contiguous land base (~85,000 net acres) in the San Joaquin Basin where activity levels have accelerated dramatically since 2009 when Occidental announced a ~200 mmboe discovery at Kern River;
5. A number of companies have announced capital programs targeting unconventional oil opportunities in the San Joaquin Basin – most notably, Occidental has announced plans to spend upwards of $6.0 bln over the next four years predominantly targeting the ‘California Shales’;
6. Sproule has identified ~4.1 bln bbls of Best Estimate Petroleum Initially in Place (PIIP) on one of the numerous prospects in the Jaguar area. To put this into better context, that is roughly as much oil in place as exists in the Viewfield Bakken formation;
7. The company has completed an extensive amount of geoscience work and is in the early stages of a multi-well drilling program to prove up its assets which should provide for a catalyst rich 2011 and 2012;
8. The company has successfully drilled its first well at Jaguar targeting multiple stacked formations; initial test results are expected in the next several weeks.
Company Overview
Zodiac Exploration is an emerging junior E&P company with a focus on exploiting light oil resource plays in the San Joaquin Basin in California, specifically within the Kings County region. The company was initially incorporated as a private company in June 2008 and on September 28, 2010 became a publicly traded company through its reverse takeover of Peninsula Resources Ltd.
The company has taken the approach to exploit early stage resource plays, where it has amassed large, strategic land positions at attractive prices. To this end, the company has managed to build a sizeable position (~85,000 net acres of largely contiguous lands) in the highly prolific San Joaquin Basin in California through a series of farm-in arrangements and other acquisitions. The company and its partners have the option to exploit a number of potential formations which have significant hydrocarbons in place.
Sproule has identified ~4.1 bln bbls of Best Estimate Petroleum Initially in Place (PIIP)
Zodiac has built a sizeable land position (~85,000 net acres) of largely contiguous lands within the highly prolific San Joaquin Basin
Canada Research | Page 4 of 44 Zodiac Exploration Inc.
Raymond James Ltd. | 2200 – 925 West Georgia Street | Vancouver BC Canada V6C 3L2
Asset Overview
Zodiac is targeting light oil resource plays in the San Joaquin Basin of California where the company has amassed a sizeable and contiguous land position. Zodiac plans to target areas of stacked resource potential with over-pressured zones in the heart of the oil generating window. To be clear, we believe the focus here is more about exploitation, as opposed to exploration. We know the oil is there, the key question is whether or not it can be produced at economic rates. The company is targeting areas of known hydrocarbon accumulations within one of the most productive regions of North America. There is analogous production within the basin, and the targets Zodiac is chasing share many characteristics with other resource plays in North America.
The company has identified two key prospect areas (Jaguar and Panther) within its 85,000 net acre land position in California. Within each area, there is stacked resource potential offering a number of target formations and prospects. Jaguar is the initial focus area; the company has recently completed a vertical well (4-9) and is in the process of evaluating the results.
Before outlining the company’s prospect areas, an overview of the California oil & gas industry and the San Joaquin Basin is provided.
Overview of the California Oil and Gas Industry
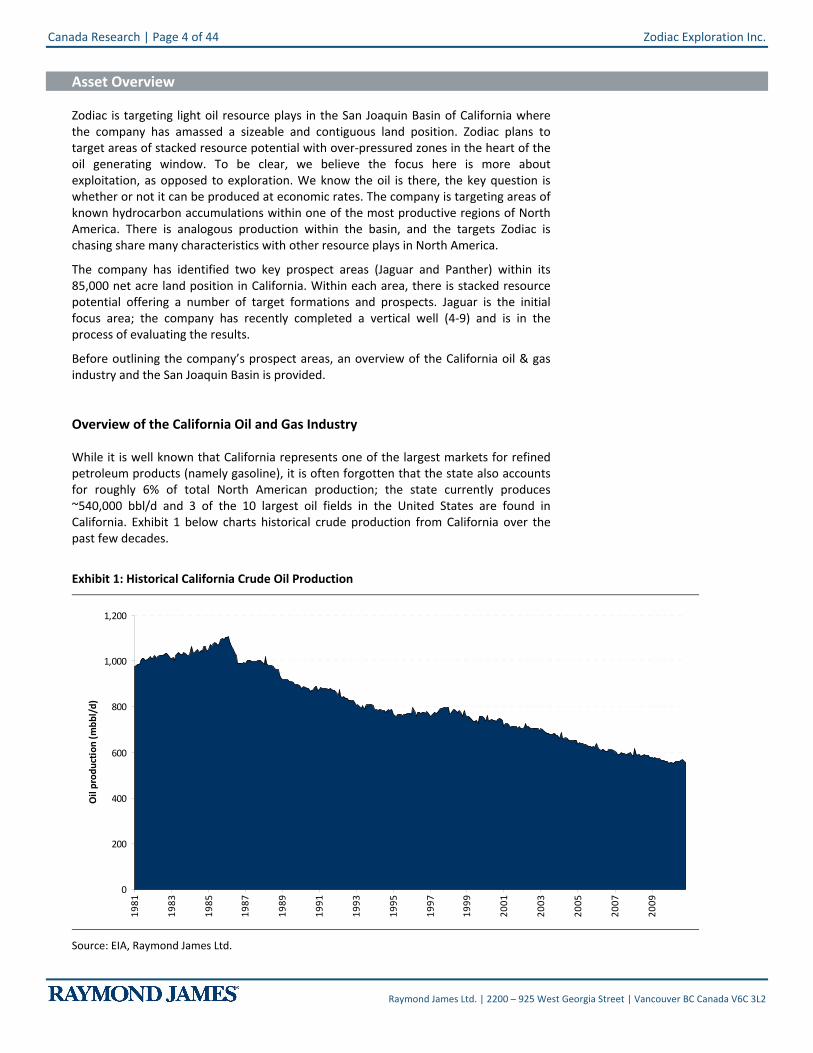
While it is well known that California represents one of the largest markets for refined petroleum products (namely gasoline), it is often forgotten that the state also accounts for roughly 6% of total North American production; the state currently produces ~540,000 bbl/d and 3 of the 10 largest oil fields in the United States are found in California. Exhibit 1 below charts historical crude production from California over the past few decades.
Exhibit 1: Historical California Crude Oil Production
0
200
400
600
800
1,000
1,200
1981
1983
1985
1987
1989
1991
1993
1995
1997
1999
2001
2003
2005
2007
2009
Oil
prod
ucti
on (m
bbl/
d)
Source: EIA, Raymond James Ltd.
Zodiac Exploration Inc. Canada Research | Page 5 of 44
Raymond James Ltd. | 2200 – 925 West Georgia Street | Vancouver BC Canada V6C 3L2
Somewhat concentrated industry; exploration has not been a focus until recently For being a relatively large oil and gas market, the industry is highly concentrated among a small group of producers. The top 5 producers in the state make up more than 75% of total production, with Chevron and Aera Energy (JV between Shell and ExxonMobil) making up more than 50% of total production. Until recently, the vast majority of the activity in the state has focused on developing the numerous giant oil fields, particularly within the San Joaquin Basin. This is starting to change following Occidental’s Kern County discovery in 2009. Since Occidental’s discovery, there has been a significant uptick in activity as a number of players have scrambled to acquire prospective acreage for shale plays in California. Exhibit 2 below highlights the top 10 producers in California.
Exhibit 2: Top 10 Producers in California
Operator Oil Production Gas Production Total % of statebbl/d Mcf/d boe/d Production
Chevron USA Inc. 160,186 29,388 165,084 27%Aera Energy LLC. 148,974 51,233 157,513 25%Occidental of Elk Hil ls, Inc. 42,396 325,424 96,633 16%Plains Expl. & Prod. Co. 32,817 16,015 35,486 6%Thums Long Beach Co. 27,405 10,141 29,095 5%Vintage Production California LLC (Occidental) 21,602 14,834 24,074 4%Berry Petroleum Co. 17,575 19 17,578 3%Seneca Resources Corp. 6,919 11,992 8,918 1%Macpherson Oil Corp. 8,311 0 8,311 1%Tidelands Oil Production Co. (Occidental) 6,408 1,544 6,665 1%Total Top 10 Operators 472,593 460,590 549,358 88%
Toatal California 539,366 492,521 621,453 100%
Source: California Department of Conservation, Division of Oil, Gas and Geothermal Resources, Raymond James Ltd.
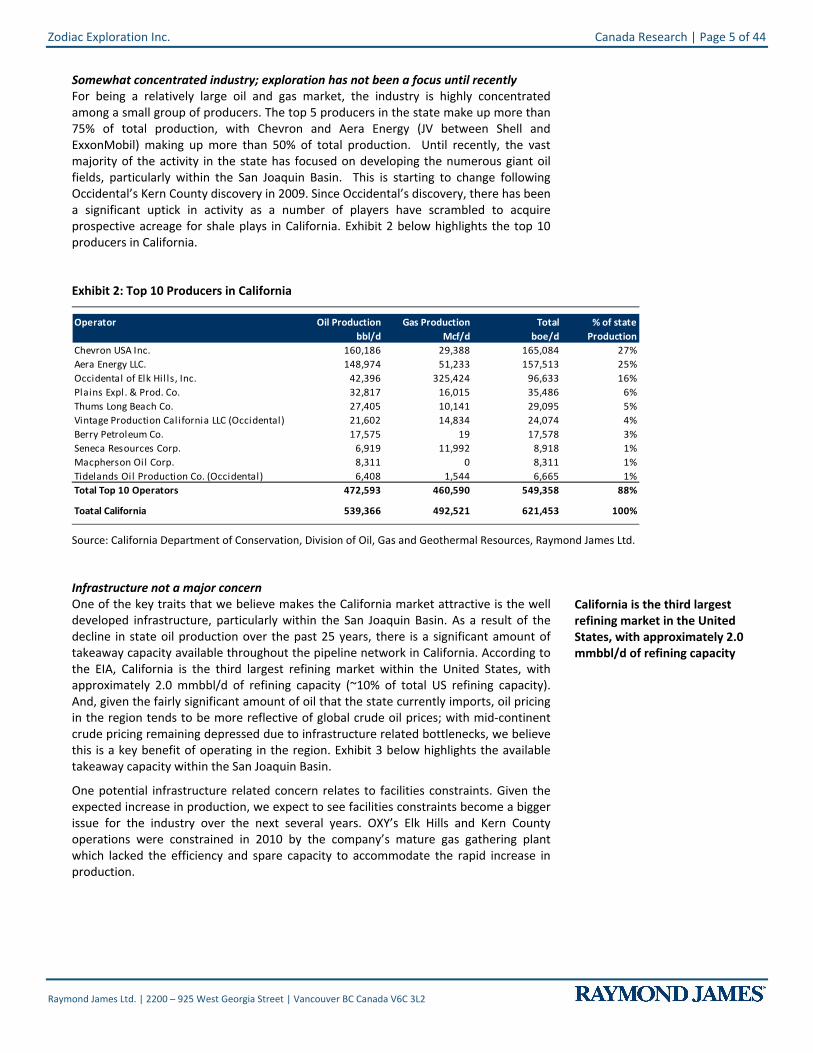
Infrastructure not a major concern One of the key traits that we believe makes the California market attractive is the well developed infrastructure, particularly within the San Joaquin Basin. As a result of the decline in state oil production over the past 25 years, there is a significant amount of takeaway capacity available throughout the pipeline network in California. According to the EIA, California is the third largest refining market within the United States, with approximately 2.0 mmbbl/d of refining capacity (~10% of total US refining capacity). And, given the fairly significant amount of oil that the state currently imports, oil pricing in the region tends to be more reflective of global crude oil prices; with mid-continent crude pricing remaining depressed due to infrastructure related bottlenecks, we believe this is a key benefit of operating in the region. Exhibit 3 below highlights the available takeaway capacity within the San Joaquin Basin.
One potential infrastructure related concern relates to facilities constraints. Given the expected increase in production, we expect to see facilities constraints become a bigger issue for the industry over the next several years. OXY’s Elk Hills and Kern County operations were constrained in 2010 by the company’s mature gas gathering plant which lacked the efficiency and spare capacity to accommodate the rapid increase in production.
California is the third largest refining market in the United States, with approximately 2.0 mmbbl/d of refining capacity
Canada Research | Page 6 of 44 Zodiac Exploration Inc.
Raymond James Ltd. | 2200 – 925 West Georgia Street | Vancouver BC Canada V6C 3L2
Exhibit 3: Key infrastructure within San Joaquin Basin
Source: Zodiac Exploration Inc.
Fiscal terms are fair We believe the State of California has a relatively balanced fiscal regime. The vast majority of land is fee simple, meaning that the land owner owns both the surface and subsurface rights. As such, California is the only state with significant oil and gas production not to have a state-level royalty rate. However, this is largely offset by property taxes administered within each county (property taxes are typically levied at ~1% of proven reserves).
Permitting process one of the bigger deterrents to investment When it comes to permitting oil and gas in California, one of the concerns is the length of time required to receive approval; for new fields, we estimate that the average time to receive approvals is approximately 6 months, but can be over a year in some cases; the good news is that once a field is established, the permitting process is often less than 1 month. Despite these concerns, it is worthwhile noting that location plays a significant role in the permitting process. From our perspective, we see less of a concern in gaining permits in the San Joaquin Basin, given the large level of development that has already taken place in the region. In addition, it simply means that companies need to plan ahead – more so than in other jurisdictions.
Once a field is established, the permitting process is often less than one month
Zodiac Exploration Inc. Canada Research | Page 7 of 44
Raymond James Ltd. | 2200 – 925 West Georgia Street | Vancouver BC Canada V6C 3L2
Overview of San Joaquin Basin
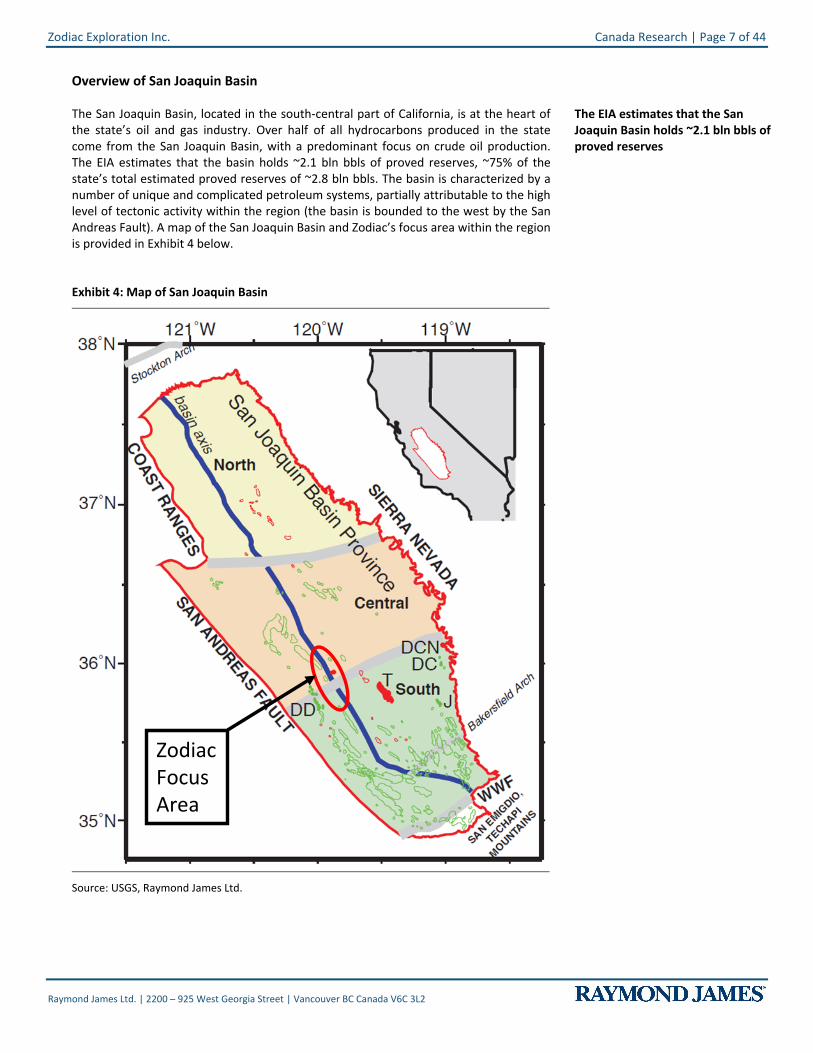
The San Joaquin Basin, located in the south-central part of California, is at the heart of the state’s oil and gas industry. Over half of all hydrocarbons produced in the state come from the San Joaquin Basin, with a predominant focus on crude oil production. The EIA estimates that the basin holds ~2.1 bln bbls of proved reserves, ~75% of the state’s total estimated proved reserves of ~2.8 bln bbls. The basin is characterized by a number of unique and complicated petroleum systems, partially attributable to the high level of tectonic activity within the region (the basin is bounded to the west by the San Andreas Fault). A map of the San Joaquin Basin and Zodiac’s focus area within the region is provided in Exhibit 4 below.
Exhibit 4: Map of San Joaquin Basin
Zodiac Focus Area
Zodiac Focus Area
Zodiac Focus Area
Source: USGS, Raymond James Ltd.
The EIA estimates that the San Joaquin Basin holds ~2.1 bln bbls of proved reserves

Canada Research | Page 8 of 44 Zodiac Exploration Inc.
Raymond James Ltd. | 2200 – 925 West Georgia Street | Vancouver BC Canada V6C 3L2
What makes the San Joaquin Basin an attractive target? Well for one, the San Joaquin Basin is one of the most prolific basins in North America; the USGS estimates that over 160 bln bbls have been generated from source rocks in the area. Despite having produced some of the largest oil fields in North America, a large portion of this basin has not been exposed to modern geologic concepts, nor have modern drilling and completion techniques been applied, particularly in Zodiac’s focus area. Exhibit 5 below adequately demonstrates this; all of the 20 largest oil fields discovered to-date were discovered before 1950. Furthermore, the 20 oil fields with the largest amount of current production (as of October 2010) were all discovered prior to 1950. This suggests to us that activity in the region has been largely focused on maximizing recovery from existing oil fields, as opposed to finding new ones or exploiting formations that previously were deemed uneconomic or unrecoverable.
Exhibit 5: California’s Largest Oil Fields
Year of discovery
Cum. production (mmbbls)
Field Year of discovery
Current production (bbl/d)
1894 3,008 Midway Sunset 1894 86,3421932 2,713 Kern River 1899 74,2141899 2,087 Belridge South 1911 71,5251911 1,586 Elk Hills 1911 38,5911911 1,342 Wilmington 1932 36,1461920 1,134 Cymric 1909 34,4421919 1,002 Lost Hills 1910 31,4841921 945 San Ardo 1947 16,6301890 934 Coalinga 1890 16,4111909 670 Ventura 1919 12,8101919 629 Round Mountain 1927 8,2951909 534 Belridge North 1912 7,9871938 504 Kern Front 1912 7,5721947 503 Inglewood 1924 7,0791928 459 Poso Creek 1926 7,0371880 414 McKittrick 1896 5,0621910 413 Huntington Beach 1920 4,7481924 401 Long Beach 1921 4,0631896 313 Brea-Olinda 1880 3,3201908 304 Orcutt 1901 3,058
signifies field in the San Joaquin Basin
Cat CanyonMcKittrickInglewoodLost HillsBrea-OlindaKettleman North DomeSan ArdoCoalinga East ExtensionCymricSanta Fe SpringsBuena VistaCoalingaLong BeachVenturaHuntington BeachElk Hills
Field
Belridge SouthKern RiverWilmingtonMidway-Sunset
Source: California Department of Conservation, Division of Oil, Gas and Geothermal Resources, Raymond James Ltd.
While the petroleum systems in the basin are quite complex (partly owing to the high level of tectonic activity), there are a number of them across the basin and in many regions there can be a number of separate petroleum systems occurring at once (such as Zodiac’s focus area), allowing for a stacked resource play offering a number of targets, both conventional and unconventional. Finally, there is adequate infrastructure across much of the basin, including available takeaway and refining capacity.
The San Joaquin Basin is one of the most prolific basins in North America
Cumulative production from the 20 largest oil fields is nearly 20 billion barrels

Zodiac Exploration Inc. Canada Research | Page 9 of 44
Raymond James Ltd. | 2200 – 925 West Georgia Street | Vancouver BC Canada V6C 3L2
Zodiac’s Strategy in the San Joaquin Basin
Overview of Zodiac focus area in the San Joaquin Basin Zodiac has focused its activities in the Kings country of southern California, positioning the company well within the “oil window” of the San Joaquin Basin – one of the most prolific basins in North America. The basin has produced a number of giant fields (>100 mmboe) and four super giant fields (>1 bln boe). The core of Zodiac’s acreage is positioned just east of the Kettleman North Dome field – a giant field currently operated by Chevron. Exhibit 6 below provides an outline of Zodiac’s focus area in this region, in relation to a number of currently producing fields.
Exhibit 6: Overview of Zodiac’s Focus Area in California
Source: Zodiac Exploration Inc.
At the core of Zodiac’s strategy – go where the oil was generated As is typically the case with resource plays, the key to a “winning” approach is acquiring acreage at the heart of the play, where results are expected to be strongest. In the case of the ‘California Shales’ (the term that Occidental is using to refer to the emerging trend of unconventional targets in California), the focus is on targeting over-pressured formations. In Zodiac’s case the predominant source rock for most of its target formations will be the Kreyenhagen formation, particularly at the company’s Jaguar Prospect area – the initial focus for the company.
Canada Research | Page 10 of 44 Zodiac Exploration Inc.
Raymond James Ltd. | 2200 – 925 West Georgia Street | Vancouver BC Canada V6C 3L2
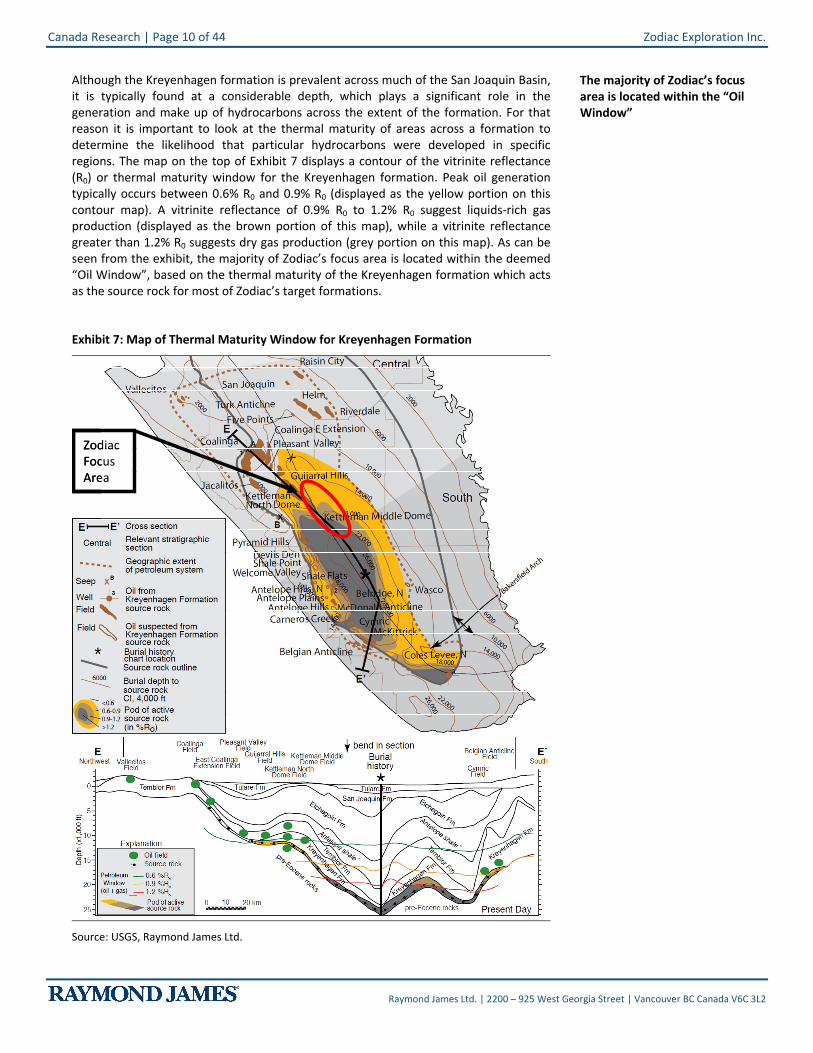
Although the Kreyenhagen formation is prevalent across much of the San Joaquin Basin, it is typically found at a considerable depth, which plays a significant role in the generation and make up of hydrocarbons across the extent of the formation. For that reason it is important to look at the thermal maturity of areas across a formation to determine the likelihood that particular hydrocarbons were developed in specific regions. The map on the top of Exhibit 7 displays a contour of the vitrinite reflectance (R0) or thermal maturity window for the Kreyenhagen formation. Peak oil generation typically occurs between 0.6% R0 and 0.9% R0 (displayed as the yellow portion on this contour map). A vitrinite reflectance of 0.9% R0 to 1.2% R0 suggest liquids-rich gas production (displayed as the brown portion of this map), while a vitrinite reflectance greater than 1.2% R0 suggests dry gas production (grey portion on this map). As can be seen from the exhibit, the majority of Zodiac’s focus area is located within the deemed “Oil Window”, based on the thermal maturity of the Kreyenhagen formation which acts as the source rock for most of Zodiac’s target formations.
Exhibit 7: Map of Thermal Maturity Window for Kreyenhagen Formation
Zodiac Focus Area
Zodiac Focus Area
Source: USGS, Raymond James Ltd.
The majority of Zodiac’s focus area is located within the “Oil Window”
Zodiac Exploration Inc. Canada Research | Page 11 of 44
Raymond James Ltd. | 2200 – 925 West Georgia Street | Vancouver BC Canada V6C 3L2
Overview of target formations
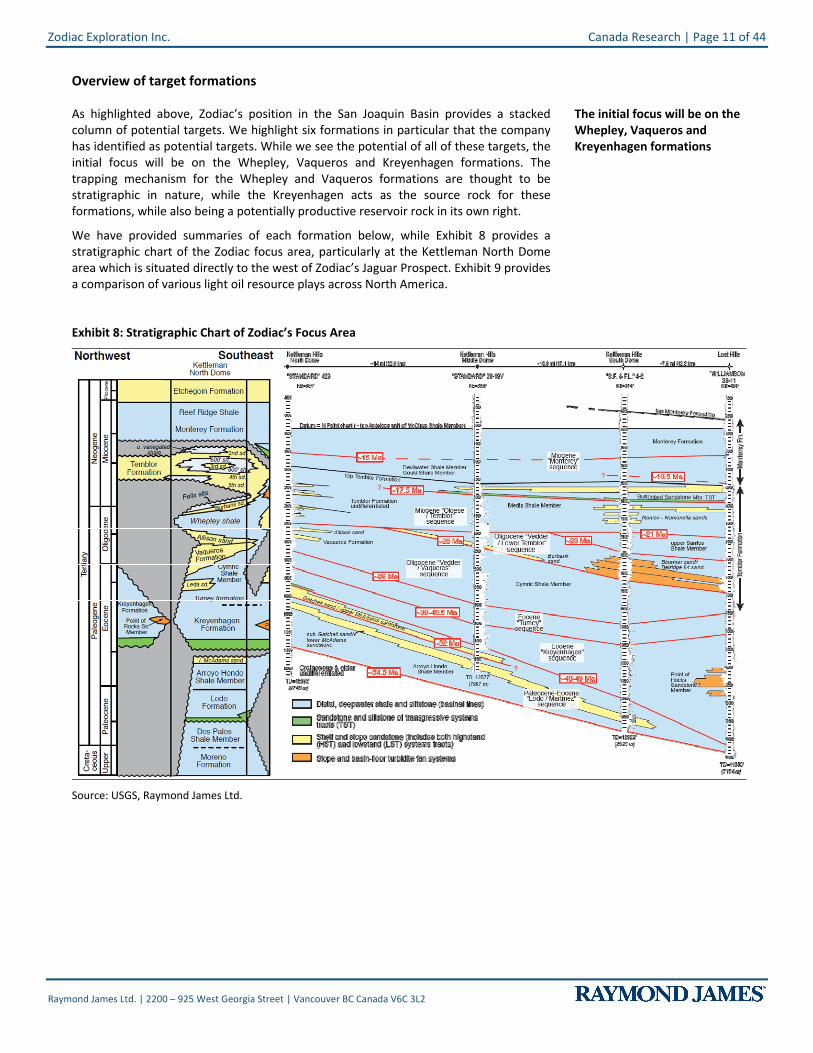
As highlighted above, Zodiac’s position in the San Joaquin Basin provides a stacked column of potential targets. We highlight six formations in particular that the company has identified as potential targets. While we see the potential of all of these targets, the initial focus will be on the Whepley, Vaqueros and Kreyenhagen formations. The trapping mechanism for the Whepley and Vaqueros formations are thought to be stratigraphic in nature, while the Kreyenhagen acts as the source rock for these formations, while also being a potentially productive reservoir rock in its own right.
We have provided summaries of each formation below, while Exhibit 8 provides a stratigraphic chart of the Zodiac focus area, particularly at the Kettleman North Dome area which is situated directly to the west of Zodiac’s Jaguar Prospect. Exhibit 9 provides a comparison of various light oil resource plays across North America.
Exhibit 8: Stratigraphic Chart of Zodiac’s Focus Area
Source: USGS, Raymond James Ltd.
The initial focus will be on the Whepley, Vaqueros and Kreyenhagen formations
Canada Research | Page 12 of 44 Zodiac Exploration Inc.
Raymond James Ltd. | 2200 – 925 West Georgia Street | Vancouver BC Canada V6C 3L2
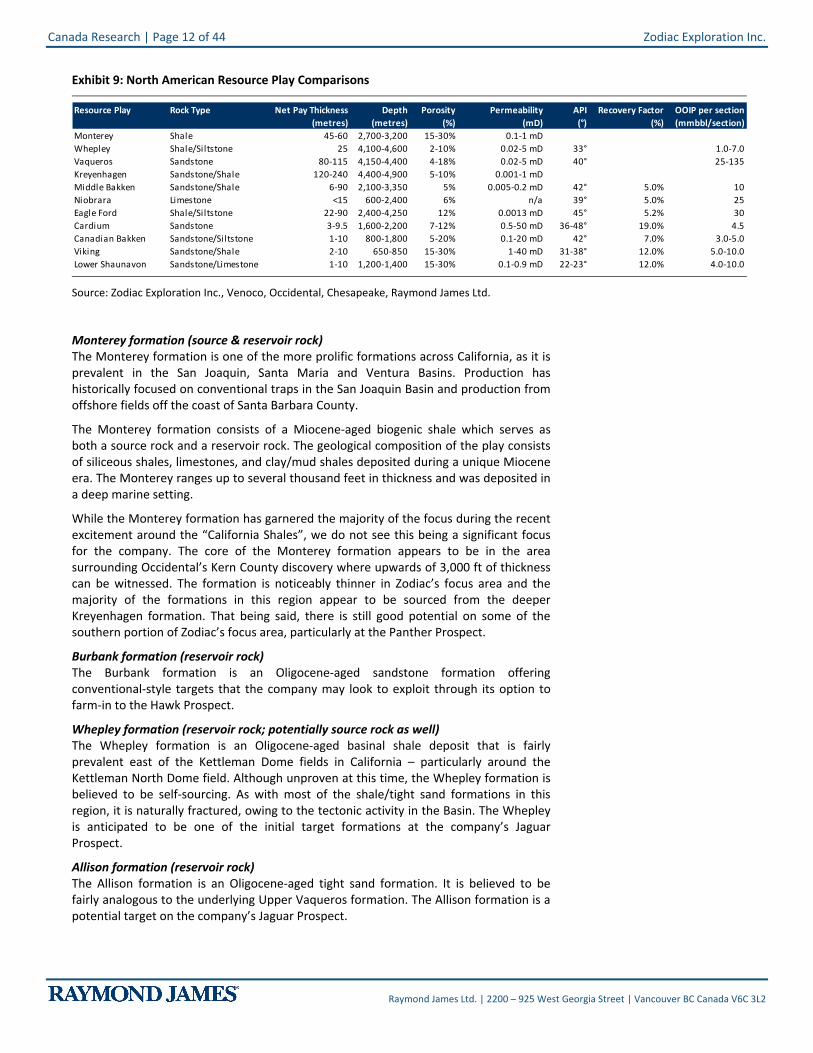
Exhibit 9: North American Resource Play Comparisons
Resource Play Rock Type Net Pay Thickness Depth Porosity Permeability API Recovery Factor OOIP per section(metres) (metres) (%) (mD) (°) (%) (mmbbl/section)
Monterey Shale 45-60 2,700-3,200 15-30% 0.1-1 mDWhepley Shale/Siltstone 25 4,100-4,600 2-10% 0.02-5 mD 33° 1.0-7.0Vaqueros Sandstone 80-115 4,150-4,400 4-18% 0.02-5 mD 40° 25-135Kreyenhagen Sandstone/Shale 120-240 4,400-4,900 5-10% 0.001-1 mDMiddle Bakken Sandstone/Shale 6-90 2,100-3,350 5% 0.005-0.2 mD 42° 5.0% 10Niobrara Limestone <15 600-2,400 6% n/a 39° 5.0% 25Eagle Ford Shale/Siltstone 22-90 2,400-4,250 12% 0.0013 mD 45° 5.2% 30Cardium Sandstone 3-9.5 1,600-2,200 7-12% 0.5-50 mD 36-48° 19.0% 4.5Canadian Bakken Sandstone/Siltstone 1-10 800-1,800 5-20% 0.1-20 mD 42° 7.0% 3.0-5.0Viking Sandstone/Shale 2-10 650-850 15-30% 1-40 mD 31-38° 12.0% 5.0-10.0Lower Shaunavon Sandstone/Limestone 1-10 1,200-1,400 15-30% 0.1-0.9 mD 22-23° 12.0% 4.0-10.0
Source: Zodiac Exploration Inc., Venoco, Occidental, Chesapeake, Raymond James Ltd.
Monterey formation (source & reservoir rock) The Monterey formation is one of the more prolific formations across California, as it is prevalent in the San Joaquin, Santa Maria and Ventura Basins. Production has historically focused on conventional traps in the San Joaquin Basin and production from offshore fields off the coast of Santa Barbara County.
The Monterey formation consists of a Miocene-aged biogenic shale which serves as both a source rock and a reservoir rock. The geological composition of the play consists of siliceous shales, limestones, and clay/mud shales deposited during a unique Miocene era. The Monterey ranges up to several thousand feet in thickness and was deposited in a deep marine setting.
While the Monterey formation has garnered the majority of the focus during the recent excitement around the “California Shales”, we do not see this being a significant focus for the company. The core of the Monterey formation appears to be in the area surrounding Occidental’s Kern County discovery where upwards of 3,000 ft of thickness can be witnessed. The formation is noticeably thinner in Zodiac’s focus area and the majority of the formations in this region appear to be sourced from the deeper Kreyenhagen formation. That being said, there is still good potential on some of the southern portion of Zodiac’s focus area, particularly at the Panther Prospect.
Burbank formation (reservoir rock) The Burbank formation is an Oligocene-aged sandstone formation offering conventional-style targets that the company may look to exploit through its option to farm-in to the Hawk Prospect.
Whepley formation (reservoir rock; potentially source rock as well) The Whepley formation is an Oligocene-aged basinal shale deposit that is fairly prevalent east of the Kettleman Dome fields in California – particularly around the Kettleman North Dome field. Although unproven at this time, the Whepley formation is believed to be self-sourcing. As with most of the shale/tight sand formations in this region, it is naturally fractured, owing to the tectonic activity in the Basin. The Whepley is anticipated to be one of the initial target formations at the company’s Jaguar Prospect.
Allison formation (reservoir rock) The Allison formation is an Oligocene-aged tight sand formation. It is believed to be fairly analogous to the underlying Upper Vaqueros formation. The Allison formation is a potential target on the company’s Jaguar Prospect.

Zodiac Exploration Inc. Canada Research | Page 13 of 44
Raymond James Ltd. | 2200 – 925 West Georgia Street | Vancouver BC Canada V6C 3L2
Vaqueros formation (reservoir rock) The Vaqueros formation is a medium grained sandstone deposited in a shallow marine environment and is prevalent across the coastal and central valley regions of California. The oil-bearing portions of the formation are typically configured into structural or stratigraphic traps by folding and faulting. Reservoir targets have been identified in the Vaqueros and it is through that internal seals within the Vaqueros may help create effective traps. We anticipate the Vaqueros formation will garner the bulk of the company’s initial focus at the Jaguar Prospect. The formation exists as a tight (yet potentially fractured) sandstone deposit in the area in which Zodiac plans on exploiting the formation.
Kreyenhagen formation (source & reservoir rock) The Kreyenhagen formation is one of the more prolific source rocks in California; the USGS estimates that the formation has generated over 100 bln bbls to-date, with a significant amount still ‘left in the system’. The formation is mostly shale, with some sandstone deposits at its base. The Kreyenhagen is a key formation for Zodiac as it acts as a source rock for most of the other target formations, while also acting as a potential target across much of its acreage. The Kreyenhagen formation has produced approximately 1 mmbbls to-date from 10 wells on the Kettleman North Dome field – all 10 wells were located to the west of Zodiac’s focus area. The Kreyenhagen is not expected to be an initial target of the company at Jaguar, but this could change depending on results from the 4-9 well.
The Jaguar prospect area
Overview The core asset within Zodiac’s portfolio is the Jaguar prospect area, located to the east of the giant Kettleman North Dome Field (currently operated by Chevron; produced ~450 mmbbls to-date). Zodiac initially acquired the land through a farm-in agreement with Bayswater E&P, a private company. The company now holds ~29,000 net acres at Jaguar.
In Jaguar, the opportunity is compelling because of the stacked resource potential and the very large oil in place estimate. The company is targeting the Whepley, Upper Vaqueros, Lower Vaqueros and Kreyenhagen formations; all of which we believe could prove to be highly prospective.
The company is currently planning on using horizontal wells (and may need to fracture stimulate the reservoir), an approach that has yet to be tested in these formations. However, there is legacy production, albeit small, in close proximity. Back in the 1970s and 1980s there were seven vertical wells drilled on Zodiac’s lands which had initial production rates of 20-140 bbl/d with cumulative production from the seven wells of ~500,000 bbls from the Whepley and Vaqueros formations. There have also been a total of ten vertical wells drilled into the Kreyenhagen formation on the Kettleman North Dome Field with cumulative production of ~1.0 mmbbls to-date. Given that these were un-stimulated vertical wells, we expect that a successful horizontal well – like the wells planned by Zodiac – could exhibit much better results.
Zodiac’s approach to the prospects on Jaguar is new; the company is using modern drilling and completion technologies to target a deep and complex reservoir. The company believes that the application of these new techniques can lead to significant performance improvements relative to the legacy vertical wells. The next step is to test and analyze the 4-9 vertical well which was spud on Dec-25-2010 and reached TD on Mar-21-2011.
The Jaguar opportunity is compelling due to its stacked resource potential and large oil in place estimate
Canada Research | Page 14 of 44 Zodiac Exploration Inc.
Raymond James Ltd. | 2200 – 925 West Georgia Street | Vancouver BC Canada V6C 3L2
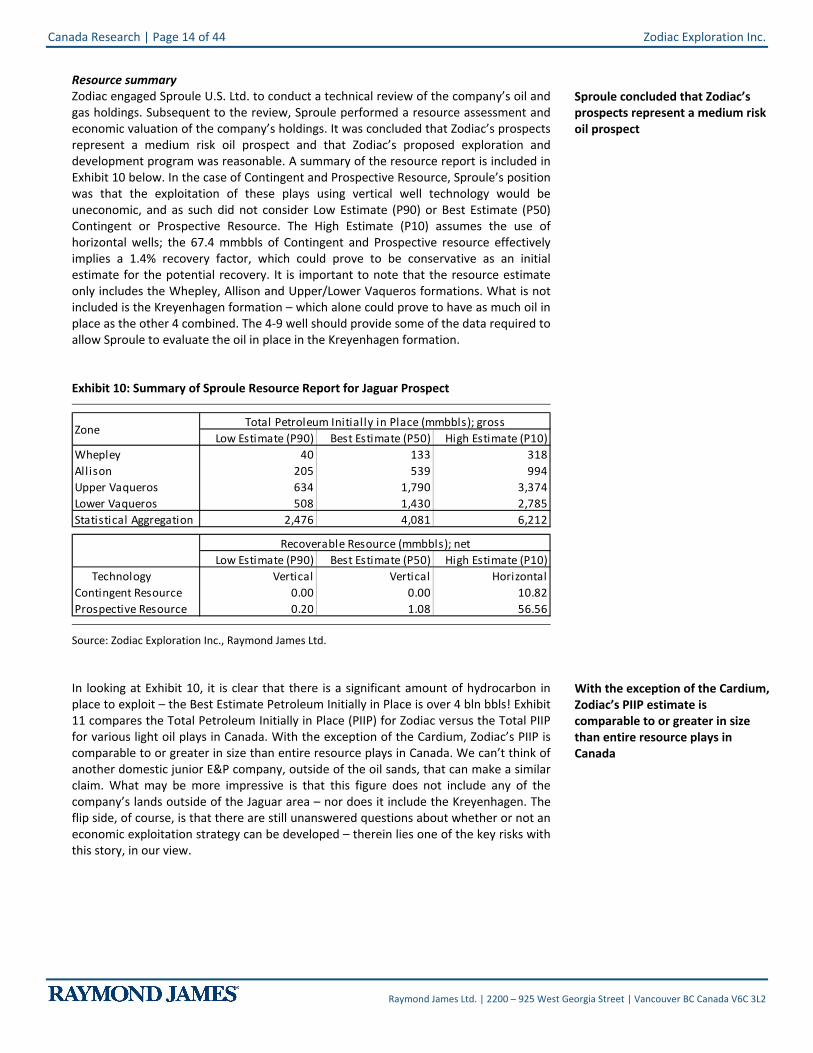
Resource summary Zodiac engaged Sproule U.S. Ltd. to conduct a technical review of the company’s oil and gas holdings. Subsequent to the review, Sproule performed a resource assessment and economic valuation of the company’s holdings. It was concluded that Zodiac’s prospects represent a medium risk oil prospect and that Zodiac’s proposed exploration and development program was reasonable. A summary of the resource report is included in Exhibit 10 below. In the case of Contingent and Prospective Resource, Sproule’s position was that the exploitation of these plays using vertical well technology would be uneconomic, and as such did not consider Low Estimate (P90) or Best Estimate (P50) Contingent or Prospective Resource. The High Estimate (P10) assumes the use of horizontal wells; the 67.4 mmbbls of Contingent and Prospective resource effectively implies a 1.4% recovery factor, which could prove to be conservative as an initial estimate for the potential recovery. It is important to note that the resource estimate only includes the Whepley, Allison and Upper/Lower Vaqueros formations. What is not included is the Kreyenhagen formation – which alone could prove to have as much oil in place as the other 4 combined. The 4-9 well should provide some of the data required to allow Sproule to evaluate the oil in place in the Kreyenhagen formation.
Exhibit 10: Summary of Sproule Resource Report for Jaguar Prospect
Low Estimate (P90) Best Estimate (P50) High Estimate (P10)Whepley 40 133 318Allison 205 539 994Upper Vaqueros 634 1,790 3,374Lower Vaqueros 508 1,430 2,785Statistical Aggregation 2,476 4,081 6,212
Low Estimate (P90) Best Estimate (P50) High Estimate (P10)Technology Vertical Vertical Horizontal
Contingent Resource 0.00 0.00 10.82Prospective Resource 0.20 1.08 56.56
Total Petroleum Initially in Place (mmbbls); grossZone
Recoverable Resource (mmbbls); net
Source: Zodiac Exploration Inc., Raymond James Ltd.
In looking at Exhibit 10, it is clear that there is a significant amount of hydrocarbon in place to exploit – the Best Estimate Petroleum Initially in Place is over 4 bln bbls! Exhibit 11 compares the Total Petroleum Initially in Place (PIIP) for Zodiac versus the Total PIIP for various light oil plays in Canada. With the exception of the Cardium, Zodiac’s PIIP is comparable to or greater in size than entire resource plays in Canada. We can’t think of another domestic junior E&P company, outside of the oil sands, that can make a similar claim. What may be more impressive is that this figure does not include any of the company’s lands outside of the Jaguar area – nor does it include the Kreyenhagen. The flip side, of course, is that there are still unanswered questions about whether or not an economic exploitation strategy can be developed – therein lies one of the key risks with this story, in our view.
Sproule concluded that Zodiac’s prospects represent a medium risk oil prospect
With the exception of the Cardium, Zodiac’s PIIP estimate is comparable to or greater in size than entire resource plays in Canada

Zodiac Exploration Inc. Canada Research | Page 15 of 44
Raymond James Ltd. | 2200 – 925 West Georgia Street | Vancouver BC Canada V6C 3L2
Exhibit 11: Jaguar Total PIIP vs. Total PIIP of Various Light Oil Plays in Canada
Source: Zodiac Exploration Inc.
Initial results from the 4-9 well look promising As part of the Bayswater agreement cited above, the company had to complete the drilling of an initial evaluation well to test the upper and lower Vaqueros formations, in addition to other possible targets within the area. The 4-9 vertical well was spud on Dec-25-2010; on Mar-21-2011 the company announced that the well had reached a total depth of 14,961 feet at a total cost of ~$15 mln. A total of 417.1 feet of core were recovered over six geological horizons and over 1,000 feet of potential pay (gross) was logged. The company is currently conducting specialized core analysis and working to flow test up to four zones. While results will be important, the company is primarily testing these zones in order to establish reservoir parameters, so we will be cautious to extrapolate these first test results in the context of the company’s overall prospects. The data gathered from this well will be used to rank the most prospective zones as the company moves ahead with the remainder of its drilling program for this year and into 2012.
Additional plans for 2011 Following the data gathered from the 4-9 well, the company is expected to proceed with the ‘1-10 well’ – the first horizontal well drilled into this region (located approximately 1 mile east of the existing 4-9 well); we anticipate that this well will be spud within the next month. In addition to the 1-10 well, the company had originally planned to drill two additional horizontal wells in fiscal 2011, but given the delays that occurred with the vertical 4-9 well we expect the third horizontal well will now be spud in F1Q12 (calendar 4Q11). We believe results from these wells will be catalysts for the company over the balance of the year as additional wells, along with production results, provide a good indication of the potential over the initial prospect area.
The 4-9 well recovered core over six geological horizons and over 1,000 feet of potential pay (gross) was logged
Zodiac is expected to proceed with the ‘1-10’ well – the first horizontal well into this region

Canada Research | Page 16 of 44 Zodiac Exploration Inc.
Raymond James Ltd. | 2200 – 925 West Georgia Street | Vancouver BC Canada V6C 3L2
Panther Prospect
While the Jaguar area is the near-term focus of the company, the Panther area has also been identified – located southeast of the Kettleman Middle Dome. As with Jaguar, the company’s position in Panther comes by way of a farm-in agreement with Bayswater.
A portion of Panther is significantly more structural/faulted in nature than Jaguar, potentially adding another layer of risk. The primary targets at Panther are the Monterey and Kreyenhagen – both prolific source rocks which have yielded hydrocarbons in vertical wells both within and adjacent to the prospect. The company believes the prospects at Panther are on trend with Occidental’s Elk Hills discovery which is claimed to be >200 mmboe in size.
Terms of the Bayswater Agreements
Jaguar Under the terms of agreement, Zodiac initially acquired an 80% interest in 19,689 gross acres by paying 100% of the cost to acquire, process and interpret 3D seismic data and drill one well to test the Upper and Lower Vaqueros formations.
Panther Under the terms of the agreement, Zodiac acquired a 74.5% interest in 21,500 gross acres. Financial consideration totaled $8.4 mln for the assets ($5.6 mln in cash, $1.9 mln in Zodiac shares & $0.9 mln in credit). Additionally, Zodiac is required to pay 92% of the costs to drill 2 wells on the prospect land in order to test the Monterey and Kreyenhagen formations. Each well will allow the company to earn-in on 50% of the land, with the requirement that the first well be drilled by January 1, 2013 and the second well drilled by January 1, 2014.
Hawk prospect area Included in the Jaguar agreement with Bayswater, Zodiac has an option to earn-in on a portion of lands located adjacent to the northern boundary of Jaguar – an area known as Hawk. To earn-in on the lands, the company must drill a well to test the Burbank formation, covering 100% of the costs to earn an 80% working interest on 4,800 gross acres. Zodiac has until May 2013 to exercise its option.
Pooling agreement In addition to the agreement at Panther, the two companies have established an area of mutual interest (50 townships) whereby the companies have agreed to jointly pursue land acquisitions on a 75:25 basis (Zodiac:Bayswater).
Windsor Block – Nova Scotia
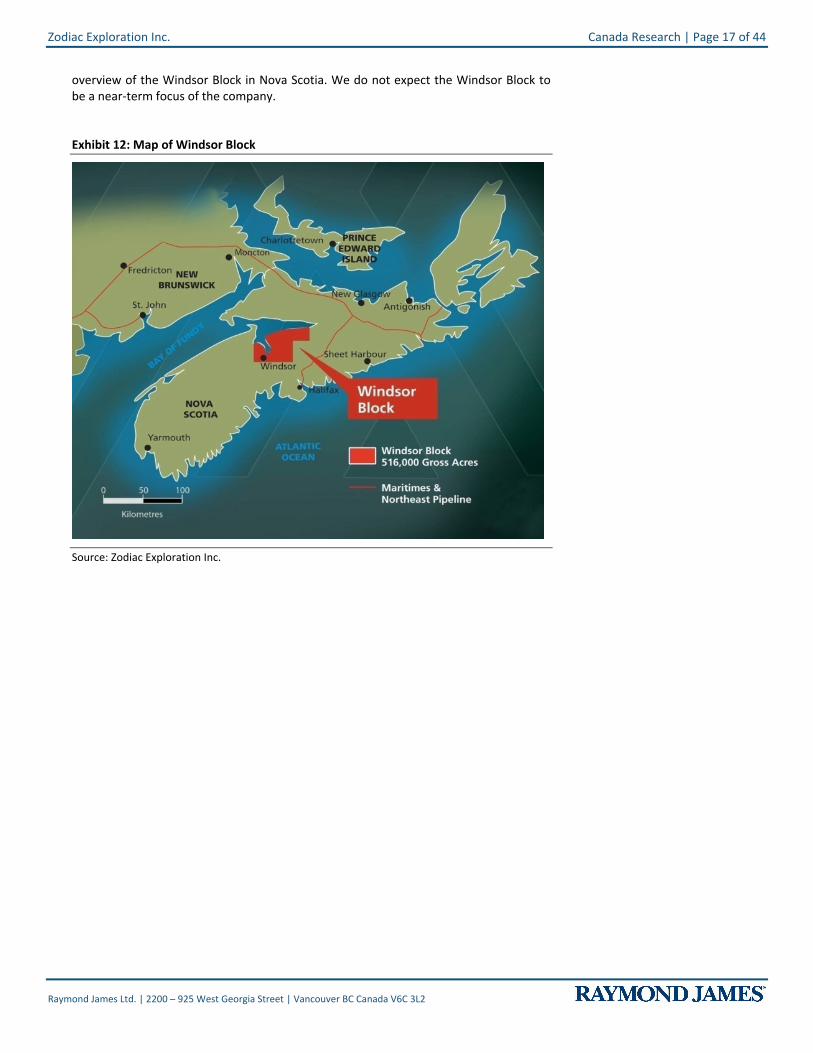
Zodiac has a 13% non-operated interest in the Windsor Block – a ~516,000 gross acre position on the western coast of Nova Scotia. The company has partnered with Triangle Petroleum which is the operator of the block and an 87% working interest holder. The partners are targeting several prospective zones, including shallow conventional targets and deeper shale resource play potential; the primary focus is anticipated to be the gas shales of the Horton Group.
Triangle and Zodiac are currently seeking a partner to drill the B-4D exploration well, targeting the Horton Glass sand horizon. There have been a total of 3 exploration wells drilled to-date on the play, while a total of 7 wells have to be drilled by April 15, 2014 in order for the partners to retain the rights to the block. Exhibit 12 below provides an
The company believes the prospects at Panther are on trend with Occidental’s Elk Hills discovery which is claimed to be >200 mmboe in size
Zodiac Exploration Inc. Canada Research | Page 17 of 44
Raymond James Ltd. | 2200 – 925 West Georgia Street | Vancouver BC Canada V6C 3L2
overview of the Windsor Block in Nova Scotia. We do not expect the Windsor Block to be a near-term focus of the company.
Exhibit 12: Map of Windsor Block
Source: Zodiac Exploration Inc.
Canada Research | Page 18 of 44 Zodiac Exploration Inc.
Raymond James Ltd. | 2200 – 925 West Georgia Street | Vancouver BC Canada V6C 3L2
Financial Summary
Appendix B provides a summary of historical and forecast financial statements. At this point in time, our forecasts assume no revenue from the sale of oil and natural gas production over the next two years.
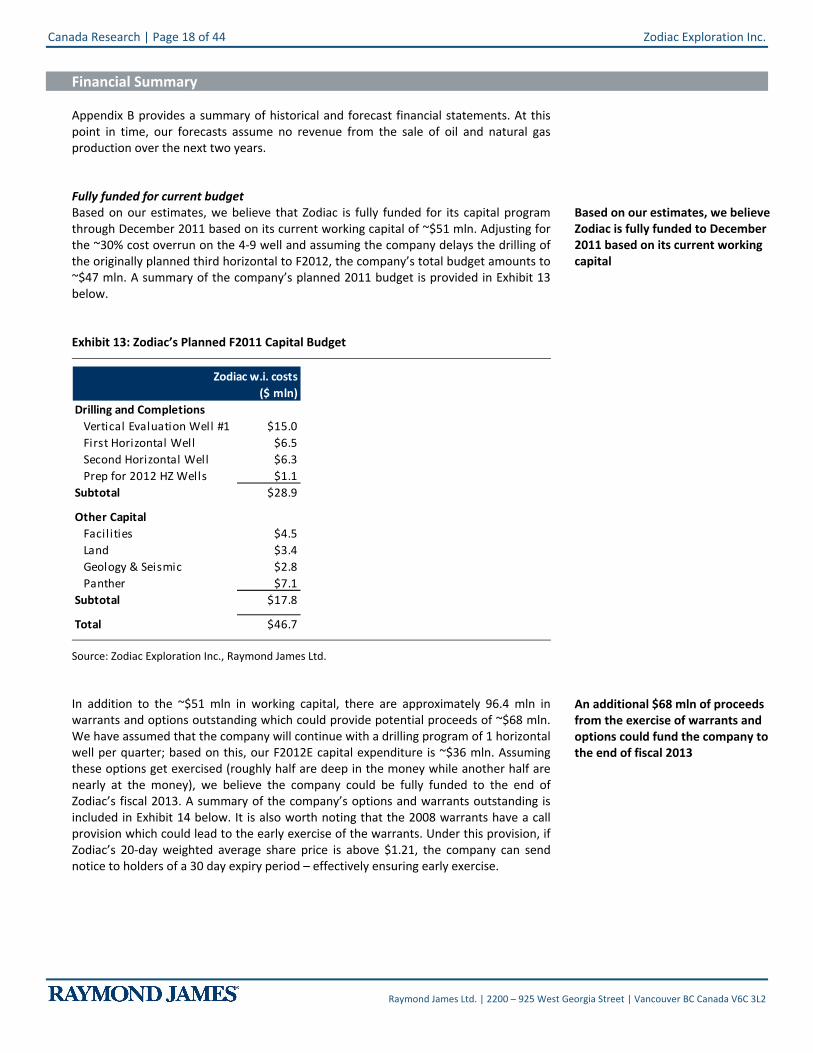
Fully funded for current budget Based on our estimates, we believe that Zodiac is fully funded for its capital program through December 2011 based on its current working capital of ~$51 mln. Adjusting for the ~30% cost overrun on the 4-9 well and assuming the company delays the drilling of the originally planned third horizontal to F2012, the company’s total budget amounts to ~$47 mln. A summary of the company’s planned 2011 budget is provided in Exhibit 13 below.
Exhibit 13: Zodiac’s Planned F2011 Capital Budget
Zodiac w.i. costs($ mln)
Drilling and CompletionsVertical Evaluation Well #1 $15.0First Horizontal Well $6.5Second Horizontal Well $6.3Prep for 2012 HZ Wells $1.1
Subtotal $28.9
Other CapitalFacil ities $4.5Land $3.4Geology & Seismic $2.8Panther $7.1
Subtotal $17.8
Total $46.7
Source: Zodiac Exploration Inc., Raymond James Ltd.
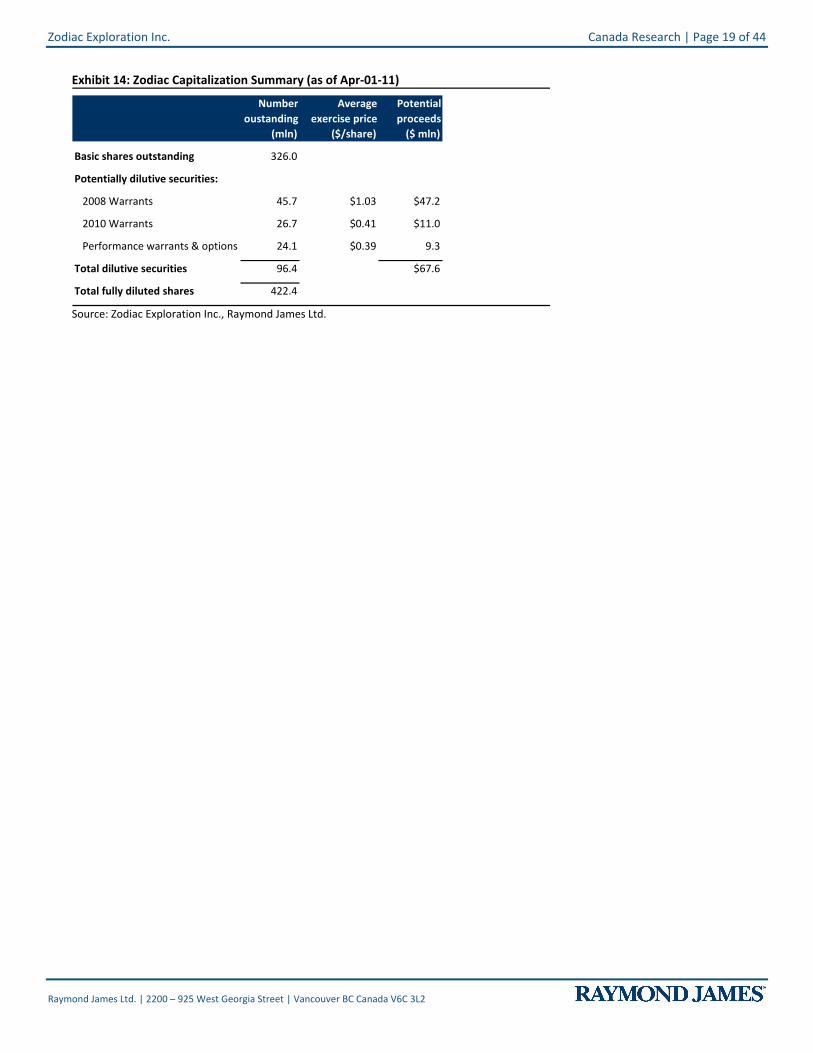
In addition to the ~$51 mln in working capital, there are approximately 96.4 mln in warrants and options outstanding which could provide potential proceeds of ~$68 mln. We have assumed that the company will continue with a drilling program of 1 horizontal well per quarter; based on this, our F2012E capital expenditure is ~$36 mln. Assuming these options get exercised (roughly half are deep in the money while another half are nearly at the money), we believe the company could be fully funded to the end of Zodiac’s fiscal 2013. A summary of the company’s options and warrants outstanding is included in Exhibit 14 below. It is also worth noting that the 2008 warrants have a call provision which could lead to the early exercise of the warrants. Under this provision, if Zodiac’s 20-day weighted average share price is above $1.21, the company can send notice to holders of a 30 day expiry period – effectively ensuring early exercise.
Based on our estimates, we believe Zodiac is fully funded to December 2011 based on its current working capital
An additional $68 mln of proceeds from the exercise of warrants and options could fund the company to the end of fiscal 2013
Zodiac Exploration Inc. Canada Research | Page 19 of 44
Raymond James Ltd. | 2200 – 925 West Georgia Street | Vancouver BC Canada V6C 3L2
Exhibit 14: Zodiac Capitalization Summary (as of Apr-01-11)
(mln) ($/share) ($ mln)
Basic shares outstanding 326.0
Potentially dilutive securities:
2008 Warrants 45.7 $1.03 $47.2
2010 Warrants 26.7 $0.41 $11.0
Performance warrants & options 24.1 $0.39 9.3
Total dilutive securities 96.4 $67.6
Total fully diluted shares 422.4
Potential proceeds
Average exercise price
Number oustanding
Source: Zodiac Exploration Inc., Raymond James Ltd.
Canada Research | Page 20 of 44 Zodiac Exploration Inc.
Raymond James Ltd. | 2200 – 925 West Georgia Street | Vancouver BC Canada V6C 3L2
Valuation
In our opinion, the biggest difficulty investors face when looking at Zodiac is determining how to value the stock. From a fundamental perspective, the stock exhibits higher risk than a vast majority of traditional E&P companies. The company is working in a challenging geological environment and is applying a technique thus far unproven within its target formations. Despite these noteworthy concerns, we believe the potential payoff more than justifies the current share price. That being said, we still view the stock as speculative in nature.
When valuing a company like Zodiac, there are a number of typical approaches that could be used. Some of the various typical approaches are:
EV/Acre
EV/Boe (either of Petroleum-Initially-in-Place (PIIP) or of Contingent & Prospective Resources)
Net Asset Value (NAV) approach
While each of these methods has its merits, we believe they all have their own limitations. Nevertheless, we believe a comparison of Zodiac under each approach can yield valuable insights.
EV/Acre approach
There has been a marked increase in the use of the EV/Acre valuation approach in recent years as emerging resource plays have gained prominence. Clearly, this method is typically applied to very early stage opportunities where little data is available. And, as you would expect, this method’s shortcoming is that it effectively ignores all risks – like whether the oil is recoverable, and details like timing, regulatory, pricing, environmental and financing to name a few. While this approach has more merit in the context of a resource play than, say, a collection of conventional oil and gas leases, we use this approach with caution and are mindful of a few points.
First, investors should consider the strategic nature of the land. Generally speaking – and particularly for investments in resource plays – larger, more contiguous land positions will trade at a premium to smaller, disconnected land packages. This is an important consideration in the case of Zodiac as the company possesses a sizeable 85,000 net acre position that is largely contiguous. With very little in the way of available land in the San Joaquin Basin, it is becoming increasingly difficult to build large, contiguous positions – if at all.
Secondly, the EV/Acre approach will inherently undervalue areas with stacked resource potential (or high resource density, as is the case in Zodiac’s focus area). As a result, we argue that San Joaquin Basin assets deserve a higher valuation than do other regions at a similar stage of development.
In the case of Zodiac, the other problem – in addition to the ones highlighted above – is the lack of a comparable group of companies. This is largely due to the highly concentrated ownership structure within California; most of the land is held by large, diversified E&P companies, making an EV/Acre approach even more difficult.
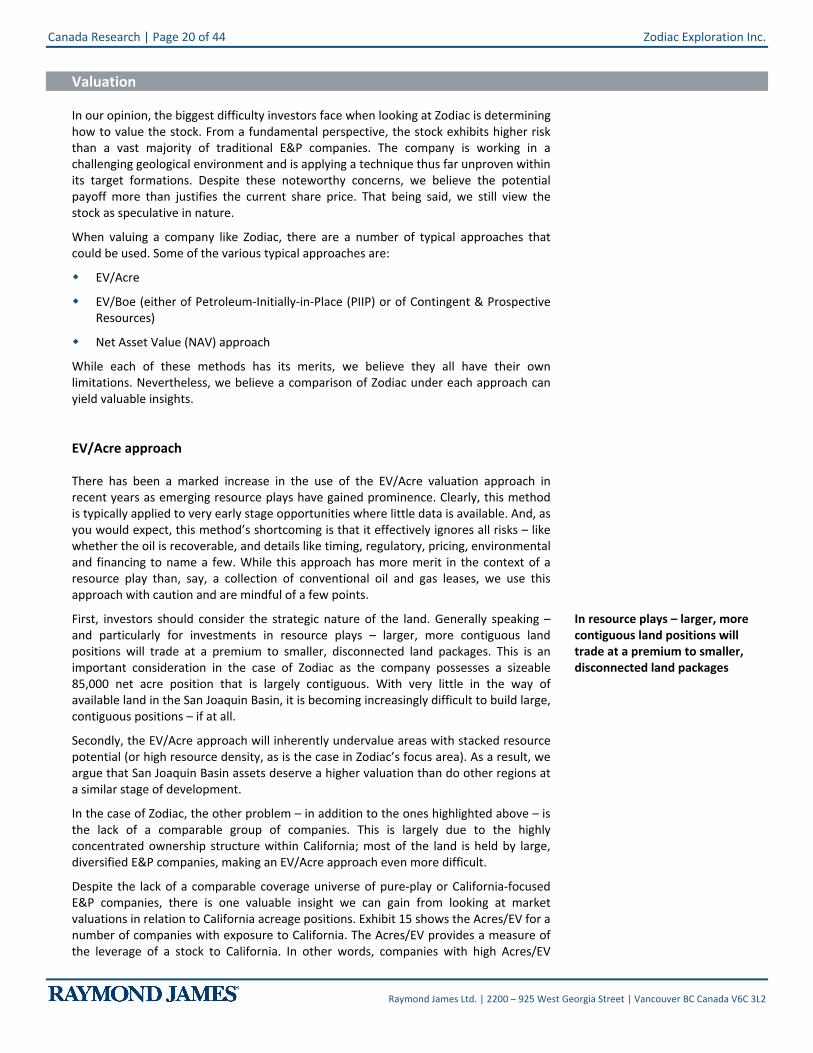
Despite the lack of a comparable coverage universe of pure-play or California-focused E&P companies, there is one valuable insight we can gain from looking at market valuations in relation to California acreage positions. Exhibit 15 shows the Acres/EV for a number of companies with exposure to California. The Acres/EV provides a measure of the leverage of a stock to California. In other words, companies with high Acres/EV
In resource plays – larger, more contiguous land positions will trade at a premium to smaller, disconnected land packages
Zodiac Exploration Inc. Canada Research | Page 21 of 44
Raymond James Ltd. | 2200 – 925 West Georgia Street | Vancouver BC Canada V6C 3L2
ratios are more exposed to California and as can be seen in Exhibit 15, Zodiac has excellent leverage to California.
Exhibit 15: Acres/EV comparables
Ticker Price Market Cap EV California Land Acres/EV EV/Acre($ mln) ($ mln) (Acres) (acres/$ mln) ($ mln)
SGY $0.10 $29.5 $26.3 20,000 760.2ZEX $1.02 $423.3 $372.0 85,000 228.5 $4,376UHO $0.15 $10.6 $5.8 1,350 232.0VQ $19.19 $1,159.1 $1,817.5 383,000 210.7GSX $0.41 $51.4 $77.6 10,700 137.9PXP $37.61 $5,269.2 $8,631.3 116,400 13.5OXY $115.36 $93,764.6 $96,891.0 1,300,000 13.4TNP $2.45 $823.9 $899.0 9,100 10.1WRES $4.49 $320.4 $334.8 2,460 7.3NFG $72.19 $5,941.2 $6,904.7 23,100 3.3BRY $52.21 $2,777.6 $3,895.8 6,500 1.7BBEP $22.21 $1,311.3 $1,926.6 2,513 1.3
Source: Raymond James Ltd., Company Reports
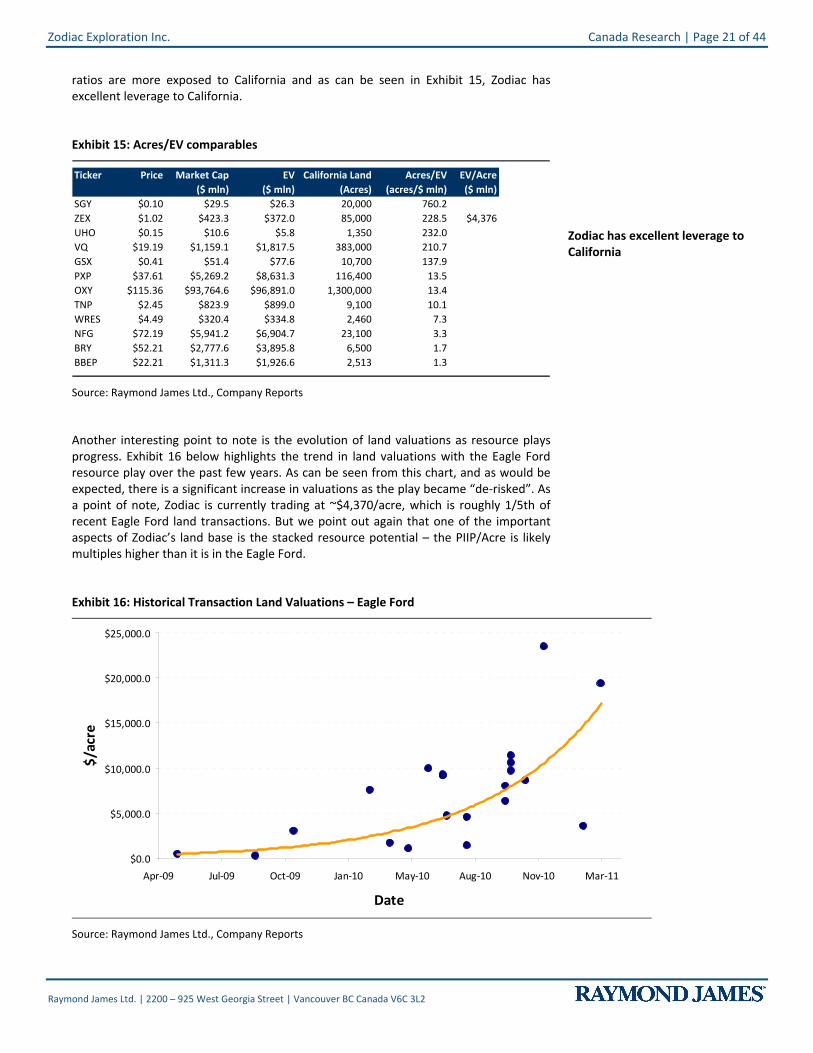
Another interesting point to note is the evolution of land valuations as resource plays progress. Exhibit 16 below highlights the trend in land valuations with the Eagle Ford resource play over the past few years. As can be seen from this chart, and as would be expected, there is a significant increase in valuations as the play became “de-risked”. As a point of note, Zodiac is currently trading at ~$4,370/acre, which is roughly 1/5th of recent Eagle Ford land transactions. But we point out again that one of the important aspects of Zodiac’s land base is the stacked resource potential – the PIIP/Acre is likely multiples higher than it is in the Eagle Ford.
Exhibit 16: Historical Transaction Land Valuations – Eagle Ford
$0.0
$5,000.0
$10,000.0
$15,000.0
$20,000.0
$25,000.0
Apr-09 Jul-09 Oct-09 Jan-10 May-10 Aug-10 Nov-10 Mar-11
Date
$/ac
re
Source: Raymond James Ltd., Company Reports
Zodiac has excellent leverage to California

Canada Research | Page 22 of 44 Zodiac Exploration Inc.
Raymond James Ltd. | 2200 – 925 West Georgia Street | Vancouver BC Canada V6C 3L2
EV/Boe approach
We are not big fans of the EV/Boe approach for a few reasons. When looking at EV/PIIP (as would be the case for Zodiac), this valuation metric ignores recovery rates, which is obviously an important consideration in addition to a number of important factors including:
Resource risk
Netbacks
F&D costs
Differing levels of risk between companies and assets
Differences in development timelines between companies
Keeping the shortcomings highlighted above in mind, the EV/Boe metric can be used to position companies on a value spectrum relative to others. In Exhibit 17, we have provided a comparison universe of companies offering similar resource potential, relative to Zodiac. This chart compares the EV/Boe of discovered and undiscovered PIIP for each of the companies. We have adjusted the enterprise value to account for companies with production by assuming a valuation of $100,000/bbl/d for oil production and $40,000/boe/d for gas production. In the case of Zodiac, we have also included our risked estimated of PIIP for the company’s other formations not included in the Sproule resource report.
Exhibit 17: Adjusted EV/PIIP Comparables
$0.00
$0.02
$0.04
$0.06
$0.08
$0.10
$0.12
$0.14
$0.16
$0.18
$0.20
ROZ PFC ACG PMI TAO ZEX CDH TGA BNK SNM UHO PEA
EV/b
oe (P
IIP)
Source: Raymond James Ltd., Company Reports
From our perspective, the key takeaway from this chart is that it highlights the upside potential for the company. From this respect, we view Zodiac as a very attractive name due to its significant upside potential. The company is the sixth lowest company on an EV/boe basis, among a group of companies deemed to have significant resource potential for their size. We believe the reason it is trading at the low end of the range is due to resource risk – but if Zodiac can unlock this play, Exhibit 17 shows just how much potential upside there could be.
Zodiac Exploration Inc. Canada Research | Page 23 of 44
Raymond James Ltd. | 2200 – 925 West Georgia Street | Vancouver BC Canada V6C 3L2
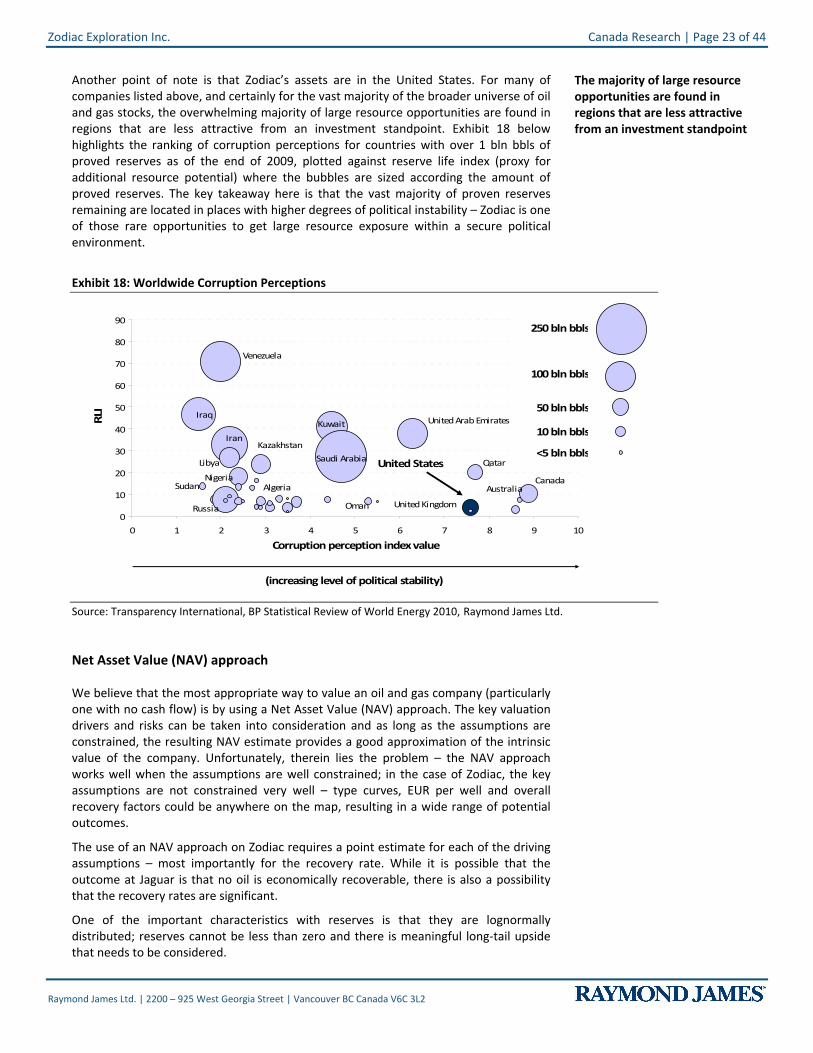
Another point of note is that Zodiac’s assets are in the United States. For many of companies listed above, and certainly for the vast majority of the broader universe of oil and gas stocks, the overwhelming majority of large resource opportunities are found in regions that are less attractive from an investment standpoint. Exhibit 18 below highlights the ranking of corruption perceptions for countries with over 1 bln bbls of proved reserves as of the end of 2009, plotted against reserve life index (proxy for additional resource potential) where the bubbles are sized according the amount of proved reserves. The key takeaway here is that the vast majority of proven reserves remaining are located in places with higher degrees of political instability – Zodiac is one of those rare opportunities to get large resource exposure within a secure political environment.
Exhibit 18: Worldwide Corruption Perceptions
Iraq
Sudan
Venezuela
Russia
Iran
Libya
Nigeria
Kazakhstan
Algeria
Kuwait
Saudi Arabia
Oman
United Arab Emirates
United Kingdom
Qatar
AustraliaCanada
0
10
20
30
40
50
60
70
80
90
0 1 2 3 4 5 6 7 8 9 10
Corruption perception index value
RLI
United States
(increasing level of political stability)
100 bln bbls
50 bln bbls
10 bln bbls
<5 bln bbls
250 bln bbls
Source: Transparency International, BP Statistical Review of World Energy 2010, Raymond James Ltd.
Net Asset Value (NAV) approach
We believe that the most appropriate way to value an oil and gas company (particularly one with no cash flow) is by using a Net Asset Value (NAV) approach. The key valuation drivers and risks can be taken into consideration and as long as the assumptions are constrained, the resulting NAV estimate provides a good approximation of the intrinsic value of the company. Unfortunately, therein lies the problem – the NAV approach works well when the assumptions are well constrained; in the case of Zodiac, the key assumptions are not constrained very well – type curves, EUR per well and overall recovery factors could be anywhere on the map, resulting in a wide range of potential outcomes.
The use of an NAV approach on Zodiac requires a point estimate for each of the driving assumptions – most importantly for the recovery rate. While it is possible that the outcome at Jaguar is that no oil is economically recoverable, there is also a possibility that the recovery rates are significant.
One of the important characteristics with reserves is that they are lognormally distributed; reserves cannot be less than zero and there is meaningful long-tail upside that needs to be considered.
The majority of large resource opportunities are found in regions that are less attractive from an investment standpoint
Canada Research | Page 24 of 44 Zodiac Exploration Inc.
Raymond James Ltd. | 2200 – 925 West Georgia Street | Vancouver BC Canada V6C 3L2
Outlining our NAV approach to valuing Zodiac
At the core of our valuation approach is the assumption on the recovery factor & EUR – we don’t have one! Rather, we have assumed a distribution of potential recovery factors under a lognormal distribution using the available data. We’ve done this specifically to address the long tail potential upside associated with a play of this type. We have also made certain assumptions with regards to operating costs, royalty rates and capital costs, but these model inputs take a back seat to the well type curves and the EUR. Our Risk Adjusted NAV is weighted based on the lognormally distributed probabilities.
Valuing the prospects at Jaguar
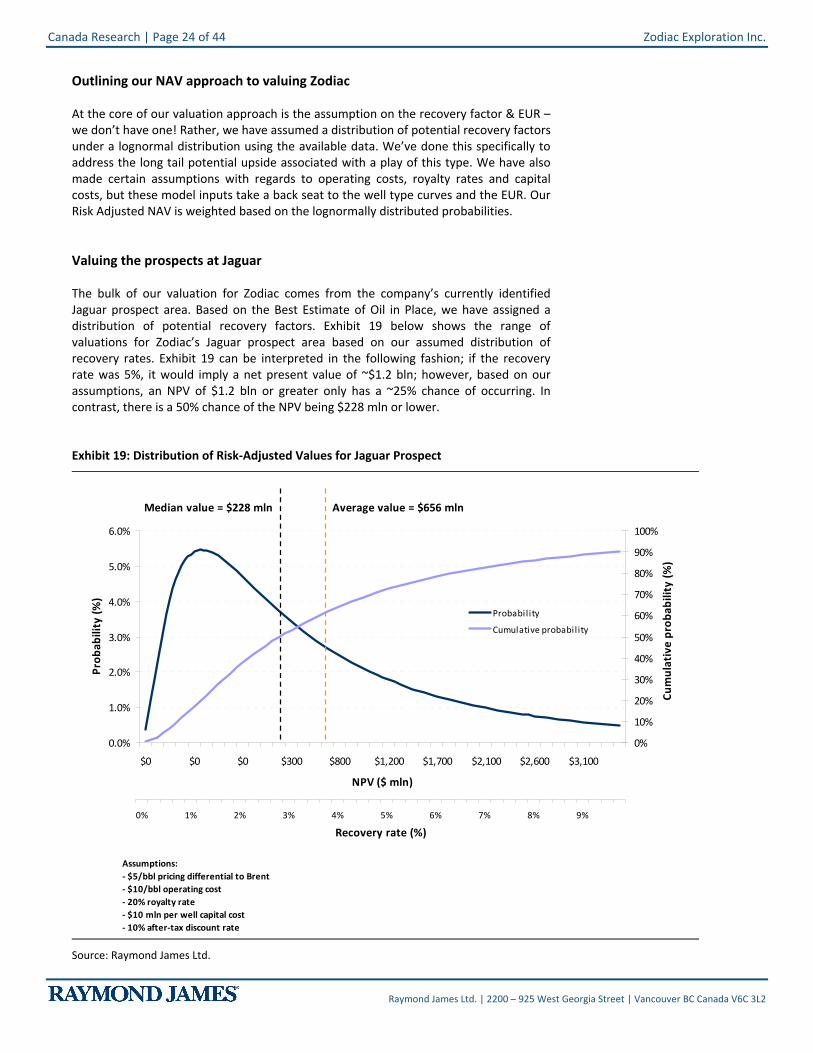
The bulk of our valuation for Zodiac comes from the company’s currently identified Jaguar prospect area. Based on the Best Estimate of Oil in Place, we have assigned a distribution of potential recovery factors. Exhibit 19 below shows the range of valuations for Zodiac’s Jaguar prospect area based on our assumed distribution of recovery rates. Exhibit 19 can be interpreted in the following fashion; if the recovery rate was 5%, it would imply a net present value of ~$1.2 bln; however, based on our assumptions, an NPV of $1.2 bln or greater only has a ~25% chance of occurring. In contrast, there is a 50% chance of the NPV being $228 mln or lower.
Exhibit 19: Distribution of Risk-Adjusted Values for Jaguar Prospect
Assumptions:- $5/bbl pricing differential to Brent- $10/bbl operating cost- 20% royalty rate- $10 mln per well capital cost- 10% after-tax discount rate
0% 1% 2% 3% 4% 5% 6% 7% 8% 9%
Recovery rate (%)
0.0%
1.0%
2.0%
3.0%
4.0%
5.0%
6.0%
$0 $0 $0 $300 $800 $1,200 $1,700 $2,100 $2,600 $3,100
NPV ($ mln)
Prob
abili
ty (%
)
0%
10%
20%
30%
40%
50%
60%
70%
80%
90%
100%
Cum
ulat
ive
prob
abili
ty (%
)
Probability
Cumulative probabil ity
Median value = $228 mln Average value = $656 mln
Source: Raymond James Ltd.

Zodiac Exploration Inc. Canada Research | Page 25 of 44
Raymond James Ltd. | 2200 – 925 West Georgia Street | Vancouver BC Canada V6C 3L2
In our model, the assumption for recovery factor drives many of the other assumptions. Based on an assumed well spacing (in this case, 4 wells per section) we have derived a type curve based on the assumed EUR. This sets a theoretical production profile which can then be valued based on our netback assumptions. Our weighted average value for the Allison, Whepley and Vaqueros formations at Jaguar is $656 mln.
Valuing the Company’s Assets Outside of the Jaguar Prospect
Our approach to valuing the company’s other assets differs only slightly from the approach highlighted at Jaguar. The difference is a function of not having an estimate of PIIP for these assets. As a result, there are two additional assumptions made to assign value to these assets:
1. Amount of land that is prospective for different formations
2. Amount of oil in place on these potentially prospective lands
Our assumption on the first point is based largely on our discussions with management and our own assumptions based on the geological deposition of certain formations on Zodiac’s lands. However, in the case of the second point, we have used a similar approach as previously described with the recovery rates. This provides another lognormal distribution estimate of PIIP for each of the company’s different target formations, resulting in a range of values for the different formations.
Our weighted average value for the Allison, Whepley and Vaqueros formations at Jaguar is $656 mln

Canada Research | Page 26 of 44 Zodiac Exploration Inc.
Raymond James Ltd. | 2200 – 925 West Georgia Street | Vancouver BC Canada V6C 3L2
Exhibit 20: Distribution of Risk-Adjusted Values for the Kreyenhagen Assets
Assumptions:- $5/bbl pricing differential to Brent- $12/bbl operating cost- 20% royalty rate- $12.5 mln per well capital cost- 10% after-tax discount rate
0.0%
1.0%
2.0%
3.0%
4.0%
5.0%
6.0%
$0 $0 $25 $75 $150 $200 $275 $325
NPV ($ mln)
Prob
abili
ty (%
)
0%
10%
20%
30%
40%
50%
60%
70%
80%
90%
100%
Cum
ulat
ive
Prob
abili
ty (%
)
Probabi l i ty
Cumulative probabi l i ty
Median value = $32 mln Average value = $72 mln
0.0%
1.0%
2.0%
3.0%
4.0%
5.0%
6.0%
0% 1% 2% 3% 4% 5% 6% 7% 8% 9%
Recovery rate (%)
Prob
abili
ty (%
)
0.0%
1.0%
2.0%
3.0%
4.0%
40 60 80 100 120 140OOIP per section (mmbbls)
Prob
abili
ty (%
)
Source: Raymond James Ltd.
Among all of the prospects in the Zodiac portfolio, we believe the company’s Kreyenhagen exposure is very interesting. This formation effectively extends across Zodiac’s entire acreage; it is very thick – potentially rivaling some of the thickest parts of the Monterey formation. As such, the formation provides significant resource potential which is the primary driver of the higher valuation relative to the other formations. However, we have assumed higher costs to account for the deeper location of the formation.
Our value for the Kreyenhagen is $72 mln
Zodiac Exploration Inc. Canada Research | Page 27 of 44
Raymond James Ltd. | 2200 – 925 West Georgia Street | Vancouver BC Canada V6C 3L2
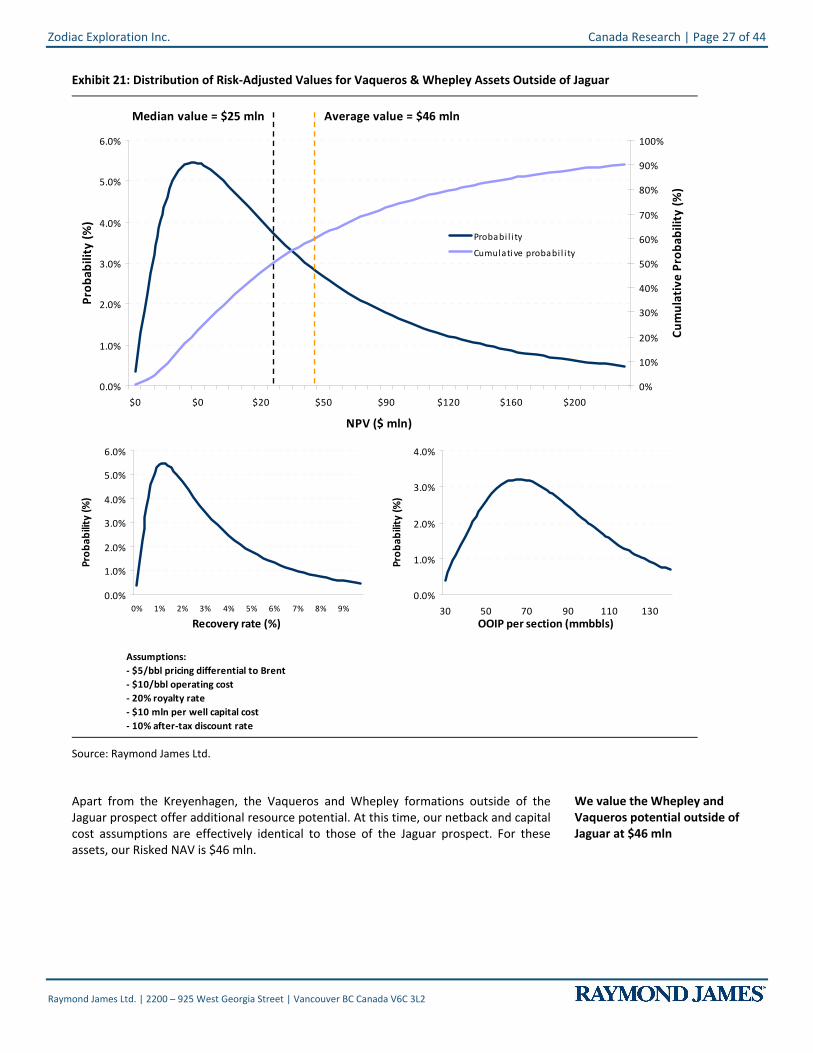
Exhibit 21: Distribution of Risk-Adjusted Values for Vaqueros & Whepley Assets Outside of Jaguar
Assumptions:- $5/bbl pricing differential to Brent- $10/bbl operating cost- 20% royalty rate- $10 mln per well capital cost- 10% after-tax discount rate
0.0%
1.0%
2.0%
3.0%
4.0%
5.0%
6.0%
$0 $0 $20 $50 $90 $120 $160 $200
NPV ($ mln)
Prob
abili
ty (%
)
0%
10%
20%
30%
40%
50%
60%
70%
80%
90%
100%
Cum
ulat
ive
Prob
abili
ty (%
)
Probabi l i ty
Cumulative probabi l i ty
Median value = $25 mln Average value = $46 mln
0.0%
1.0%
2.0%
3.0%
4.0%
5.0%
6.0%
0% 1% 2% 3% 4% 5% 6% 7% 8% 9%
Recovery rate (%)
Pro
babi
lity
(%)
0.0%
1.0%
2.0%
3.0%
4.0%
30 50 70 90 110 130OOIP per section (mmbbls)
Pro
babi
lity
(%)
Source: Raymond James Ltd.
Apart from the Kreyenhagen, the Vaqueros and Whepley formations outside of the Jaguar prospect offer additional resource potential. At this time, our netback and capital cost assumptions are effectively identical to those of the Jaguar prospect. For these assets, our Risked NAV is $46 mln.
We value the Whepley and Vaqueros potential outside of Jaguar at $46 mln
Canada Research | Page 28 of 44 Zodiac Exploration Inc.
Raymond James Ltd. | 2200 – 925 West Georgia Street | Vancouver BC Canada V6C 3L2
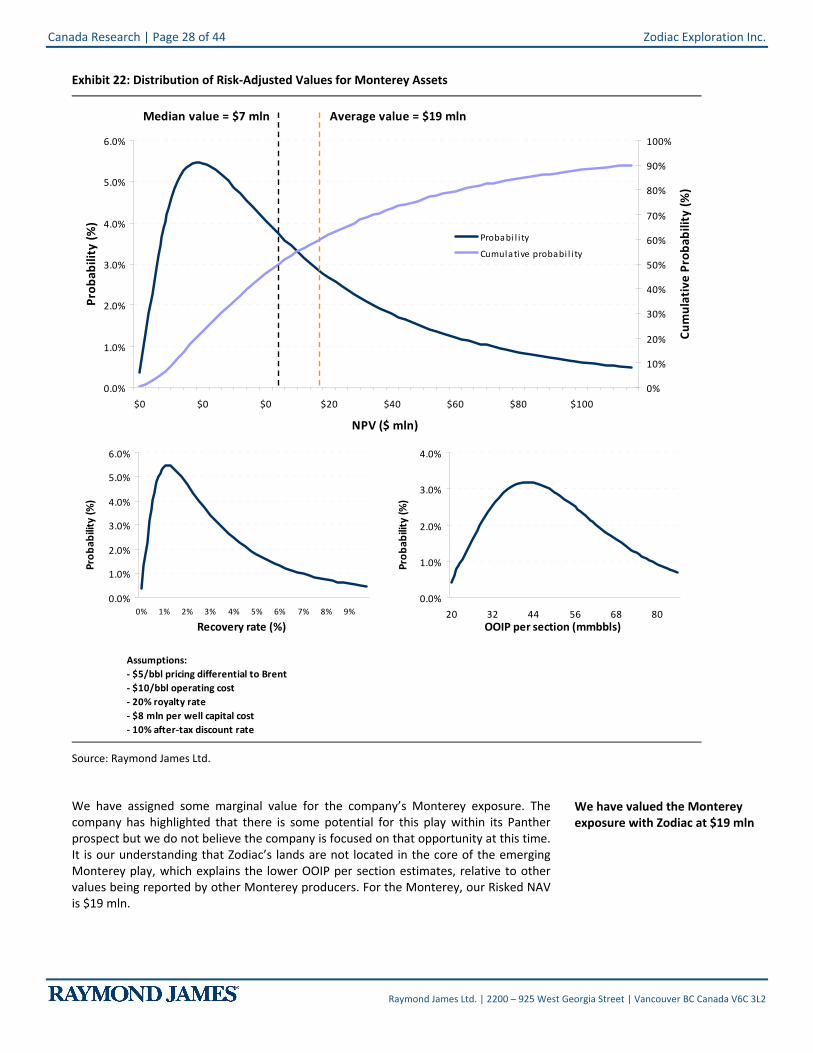
Exhibit 22: Distribution of Risk-Adjusted Values for Monterey Assets
Assumptions:- $5/bbl pricing differential to Brent- $10/bbl operating cost- 20% royalty rate- $8 mln per well capital cost- 10% after-tax discount rate
0.0%
1.0%
2.0%
3.0%
4.0%
5.0%
6.0%
$0 $0 $0 $20 $40 $60 $80 $100
NPV ($ mln)
Prob
abili
ty (%
)
0%
10%
20%
30%
40%
50%
60%
70%
80%
90%
100%
Cum
ulat
ive
Prob
abili
ty (%
)
Probabi l i ty
Cumulative probabi l i ty
Median value = $7 mln Average value = $19 mln
0.0%
1.0%
2.0%
3.0%
4.0%
5.0%
6.0%
0% 1% 2% 3% 4% 5% 6% 7% 8% 9%
Recovery rate (%)
Prob
abili
ty (%
)
0.0%
1.0%
2.0%
3.0%
4.0%
20 32 44 56 68 80OOIP per section (mmbbls)
Prob
abili
ty (%
)
Source: Raymond James Ltd.
We have assigned some marginal value for the company’s Monterey exposure. The company has highlighted that there is some potential for this play within its Panther prospect but we do not believe the company is focused on that opportunity at this time. It is our understanding that Zodiac’s lands are not located in the core of the emerging Monterey play, which explains the lower OOIP per section estimates, relative to other values being reported by other Monterey producers. For the Monterey, our Risked NAV is $19 mln.
We have valued the Monterey exposure with Zodiac at $19 mln
Zodiac Exploration Inc. Canada Research | Page 29 of 44
Raymond James Ltd. | 2200 – 925 West Georgia Street | Vancouver BC Canada V6C 3L2
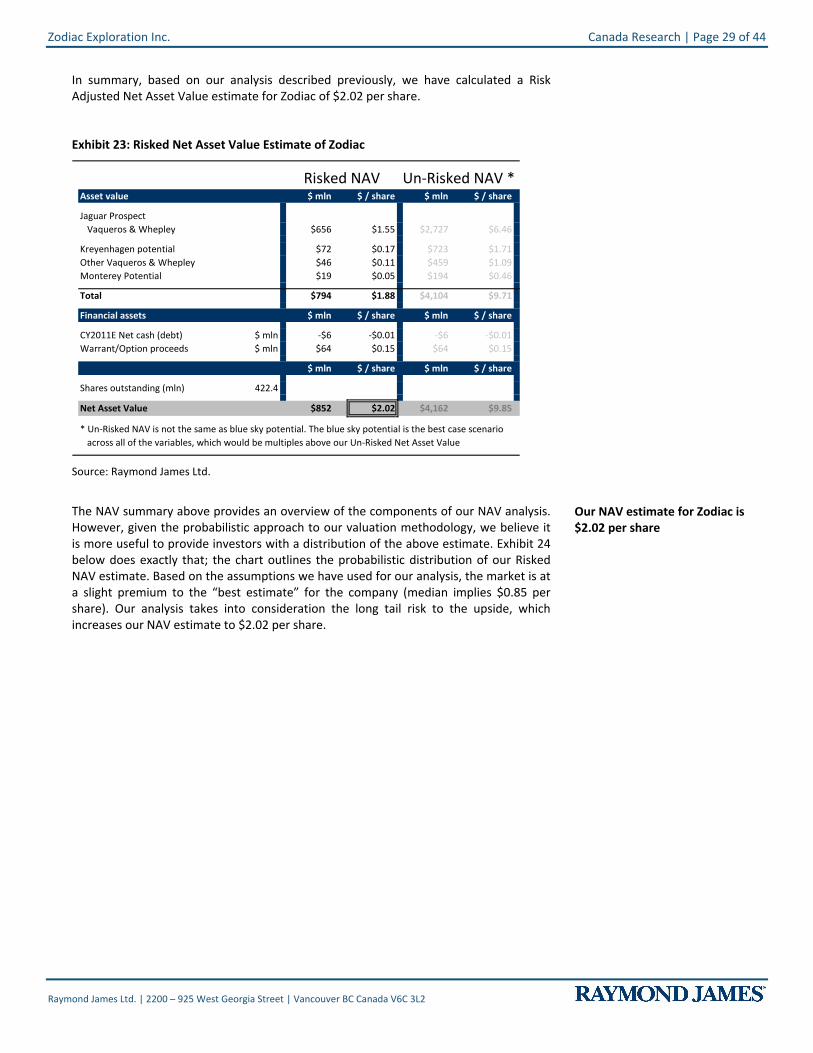
In summary, based on our analysis described previously, we have calculated a Risk Adjusted Net Asset Value estimate for Zodiac of $2.02 per share.
Exhibit 23: Risked Net Asset Value Estimate of Zodiac
Asset value $ mln $ / share $ mln $ / share
Jaguar ProspectVaqueros & Whepley 25% $656 $1.55 $2,727 $6.46
Kreyenhagen potential 10% $72 $0.17 $723 $1.71Other Vaqueros & Whepley 10% $46 $0.11 $459 $1.09Monterey Potential 10% $19 $0.05 $194 $0.46
Total $794 $1.88 $4,104 $9.71
Financial assets $ mln $ / share $ mln $ / share
CY2011E Net cash (debt) $ mln -$6 -$0.01 -$6 -$0.01Warrant/Option proceeds $ mln $64 $0.15 $64 $0.15
$ mln $ / share $ mln $ / share
Shares outstanding (mln) 422.4
Net Asset Value $852 $2.02 $4,162 $9.85
* Un-Risked NAV is not the same as blue sky potential. The blue sky potential is the best case scenario across all of the variables, which would be multiples above our Un-Risked Net Asset Value
Un-Risked NAV *Risked NAV
Source: Raymond James Ltd.
The NAV summary above provides an overview of the components of our NAV analysis. However, given the probabilistic approach to our valuation methodology, we believe it is more useful to provide investors with a distribution of the above estimate. Exhibit 24 below does exactly that; the chart outlines the probabilistic distribution of our Risked NAV estimate. Based on the assumptions we have used for our analysis, the market is at a slight premium to the “best estimate” for the company (median implies $0.85 per share). Our analysis takes into consideration the long tail risk to the upside, which increases our NAV estimate to $2.02 per share.
Our NAV estimate for Zodiac is $2.02 per share

Canada Research | Page 30 of 44 Zodiac Exploration Inc.
Raymond James Ltd. | 2200 – 925 West Georgia Street | Vancouver BC Canada V6C 3L2
Exhibit 24: Distribution of Risked Net Asset Value
0.0%
1.0%
2.0%
3.0%
4.0%
5.0%
6.0%
7.0%
8.0%
$0.00 $0.00 $0.50 $2.50 $4.50 $6.50 $8.50 $10.50
Valuation ($ per share)
Prob
abili
ty (
%)
0%
13%
25%
38%
50%
63%
75%
88%
100%
Cum
ulat
ive
Prob
abili
ty (
%)
Average value = $2.02Median value = $0.85
Source: Raymond James Ltd.
Zodiac Exploration Inc. Canada Research | Page 31 of 44
Raymond James Ltd. | 2200 – 925 West Georgia Street | Vancouver BC Canada V6C 3L2
Recommendation
We are initiating coverage on Zodiac with an Outperform rating and $2.00 target price. We believe that Zodiac offers investors a compelling vehicle to play the emerging unconventional resource wave in California. Zodiac has spent a considerable amount of time and money on understanding the resource and is about to embark on a significant drilling program to further prove up this massive resource potential. We believe the current share price offers investors an attractive entry point for shares in a company with significant upside potential.
Summary of Near-Term Potential Catalysts
In addition to its attractive valuation, we believe the significant number of catalysts over the next several months make Zodiac a compelling story. The most significant catalyst at this point in time will be the upcoming core analysis and test results from the 4-9 well, which we expect within the next several weeks. As we highlighted in the asset overview, the importance of these results will be in prioritizing the various target formations, which in turn will determine the plans for subsequent wells. Following these test results, the company will look to spud its first horizontal well; we expect the company will drill an average of 1 horizontal well per quarter for the remainder of 2011 and 2012. We believe results from these wells will be a significant catalyst for the stock. Other potential catalysts outside of these results include:
Potential listing of ZEX on US exchange
Updated reserve report in early 2012
Additional activity updates from other players in the San Joaquin Basin
What if Zodiac can’t make this work?
Given our outlook that positive drill results will lead to a significant appreciation in share price, an obvious question on the part of investors is “What would happen if the company posts disappointing drill results?” While there is no denying that disappointing drill results would be negative for the stock, we believe there are a couple of points that investors should consider.
1. This is a complex reservoir with a new exploitation approach – we fully expect there will be a number of revisions to the drilling techniques as the company continues to learn about the reservoir. Results will likely get better over time and poor initial results are not necessarily indicative of an inability to economically exploit this resource;
2. Interest continues to heat up for unconventional resource targets in the San Joaquin Basin – as the use of horizontal drilling and fracking technology continue to advance, producers are continuing to look for new targets to exploit. Activity in California has been heating up for a number of quarters now and we believe the San Joaquin Basin will continue to peak the interest of companies looking for large resource potential. If Zodiac can’t economically produce from these targets, maybe someone else can. Given the potential prize, other industry players might be willing to pay up for the opportunity.
The most significant catalyst at this point in time will be the upcoming core analysis and test results from the 4-9 well, which we expect within the next several weeks
Canada Research | Page 32 of 44 Zodiac Exploration Inc.
Raymond James Ltd. | 2200 – 925 West Georgia Street | Vancouver BC Canada V6C 3L2
Risks
Zodiac has considerable upside potential, but the reality is that there are still meaningful risks to the downside. In the case of Zodiac, the most significant risks relate to the uncertainty with regards to the recovery potential and the difficult drilling environment in which the company will be operating.
Earlier in this report we expressed our opinion that the initial recovery factor (1.6%) used by the reserve evaluators could be conservative as an initial estimate on the company’s Jaguar prospect. Although we believe the reserve evaluator’s estimate could be conservative, we also acknowledge that this is a prudent measure, given the uncertainties and risks related to the reservoir. Zodiac is targeting formations at a considerable depth (upwards of 15,000 feet in some cases) with very complex geological systems, partly owing to the high level of tectonic activity throughout the San Joaquin Basin. Bottom line, at this point in time we simply don’t know whether the reservoir will “give up” the oil, or whether rates will be at economic levels.
While we know that the company will be employing horizontal drilling to exploit the resource, we do not know whether fracture stimulation will be required, and if so, what type of program it would be. Bottom line, the application of horizontal drilling (and potentially fracture stimulation) to a deep and geologically complex reservoir is not easy; we fully expect a number of issues to be encountered along the way. For what its worth, the company’s management also appears to agree with us in this regards; Zodiac is assuming a 20% failure rate for its horizontal well drilling program at Jaguar.
In addition to the geological and operating risks highlighted above, the company is exposed to an array of other industry specific risks, including but not limited to:
Commodity prices
Regulatory and political
Environmental
Competition
Financing
The most significant risks relate to the uncertainty with regards to the recovery potential and the difficult drilling environment for the company

Zodiac Exploration Inc. Canada Research | Page 33 of 44
Raymond James Ltd. | 2200 – 925 West Georgia Street | Vancouver BC Canada V6C 3L2
Appendix A: Management & Board of Directors
Company Management:
Murray Rodgers, P.Geol., President & CEO, Director Mr. Rodgers has over 30 years of domestic and international oil and gas experience. Prior to starting Zodiac, he was the first technical staff member, and eventually rose to President and CEO, with Trident Exploration. Over the course of approximately six years Trident Exploration grew from concept to being the leading coalbed methane producer in Canada with over 200 mmcf/d of operated production. Mr. Rodgers worked for 10 years with OMV-AG (Vienna), during which time he was the co-discoverer of a multi TCF gas field in Pakistan (Miano/Sawan). He is also the creator and co-author of a comprehensive analysis of play types in the WCSB, known today as “THE EDGE”, and for several years he authored the “In-Depth Reporter” for the Ross Smith Energy Group.
Louisa DeCarlo, P.Eng., Chief Operating Officer Ms. DeCarlo has over 18 years of diverse oil and gas experience including reservoir engineering, facilities engineering, exploitation, acquisitions and asset rationalization. Prior to joining Zodiac, she was Manager of Reservoir Engineering at Trident Exploration where she was directly involved in the development and characterization of several resource plays including the Mannville and Horseshoe Canyon coalbed methane plays, and the Montney and Colorado shale gas plays. Ms. DeCarlo began her career with Exxon/Mobil and has worked with some of Canada’s leading oil and gas exploration companies including Talisman, Paramount and Canadian Hunter.
Randy Neely, CA, CFA, Chief Financial Officer Mr. Neely has over 18 years of experience in executive financial positions, including the former CFO of Pearl (Blackpearl) Exploration and Production and CFO of Trident Exploration. Prior to working directly in the oil and gas industry Mr. Neely had worked with TD Securities investment banking and had obtained his CA designation at KPMG.
Board of Directors:
Clay Robinson, Chairman Mr. Robinson has over 30 years of worldwide exploration experience including 20 years in senior technical and management roles with Exxon where he had direct involvement in over 1 billion Bbls of discoveries. After leaving Exxon, Mr. Robinson worked as VP Exploration and Company Officer for the International division of Pogo Producing Co. and then as a technical advisor to the Red Willow Production Company. Mr. Robinson is now an independent oil and gas consultant.
Gary Guidry, P.Eng., Director Mr. Guidry is an accomplished oil and gas executive with extensive "on the ground" international experience. It was his vision for an international oil and gas company focused upon the identification and exploitation of underdeveloped assets, and underpinned by a strong Canadian asset value position, that led to the creation of Orion. Immediately before taking on this challenge, Mr. Guidry was the President and Chief Executive Officer of Tanganyika Oil Company Ltd. from May 2005 through December 2008, at which time Tanganyika was sold to Sinopec International Petroleum Exploration and Production Corporation. During this short time, Mr. Guidry built and led the team which increased the company's production of heavy oil in Syria from entry levels to over
Canada Research | Page 34 of 44 Zodiac Exploration Inc.
Raymond James Ltd. | 2200 – 925 West Georgia Street | Vancouver BC Canada V6C 3L2
25,000 barrels per day, and increased share value from $6.50 to $31.50. During Mr. Guidry's thirty-year tenure in the industry, he has worked all over the world executing large and complex development projects – Syria, Oman, Nigeria, Angola, Venezuela, Ecuador, and Argentina to name several. He is a Petroleum Engineer, and his emphasis is upon application of "best in class" technology to achieve exceptional outcomes. He has served as President and Chief Executive Officer of Calpine Natural Gas Trust, President of AEC International, and in senior management positions at Canadian Occidental Petroleum and Occidental Petroleum Ltd.
Douglas Allen, Director Mr. Allen's most recent sojourn in the corporate world was as the Senior Vice President and Chief Financial Officer of North American Oil Sands Corporation. North American was sold to StatoilHydro in July of 2007 for 2.2 billion dollars. Since that time, Mr. Allen has been the principal of his own consulting firm, Crux Financial Ltd., and has advised corporate and financial institutional clients on strategic issues, corporate finance, and financial risk management. Mr. Allen has a long history in energy industry finance, in both the corporate and financial institutional sectors. Among the highlights, for a number of years, he was Managing Director of Citibank's energy finance practice in Canada. He also worked for periods of time with both TD Securities and The Royal Bank of Canada, having led RBC's energy infrastructure advisory practice in Australia.
Robert Cross, Director Mr. Cross has more than 20 years of experience as a financier in the mining and oil & gas sectors. He is a co-founder and Non-Executive Chairman of Bankers Petroleum Ltd., Non-Executive Chairman of B2Gold Corp., co-founder and Chairman of Petrodorado Energy Ltd., and until October 2007, was the Non-Executive Chairman of Northern Orion Resources Inc. Between 1996 and 1998, Mr. Cross was Chairman and Chief Executive Officer of Yorkton Securities Inc. From 1987 to 1994, he was a Partner, Investment Banking with Gordon Capital Corporation in Toronto. He has an Engineering Degree from the University of Waterloo, and received his MBA from Harvard Business School in 1987.
Zodiac Exploration Inc. Canada Research | Page 35 of 44
Raymond James Ltd. | 2200 – 925 West Georgia Street | Vancouver BC Canada V6C 3L2
Appendix B: Financial Statements
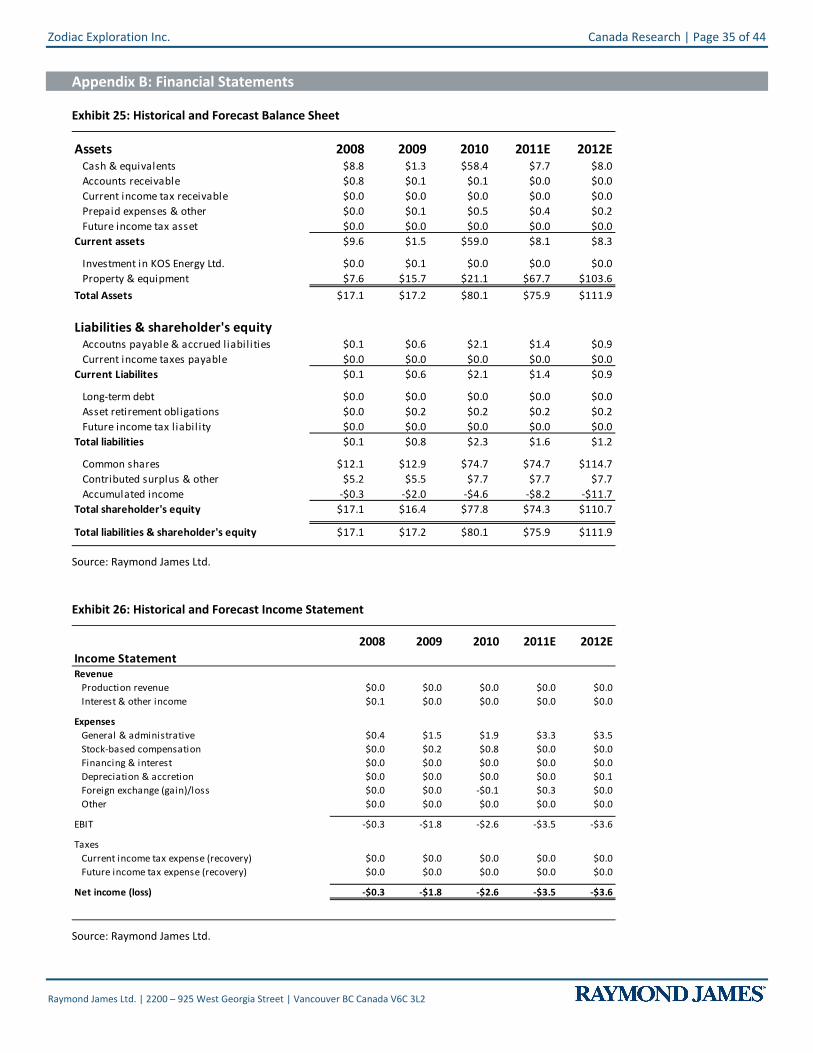
Exhibit 25: Historical and Forecast Balance Sheet
Assets 2008 2009 2010 2011E 2012ECash & equivalents $8.8 $1.3 $58.4 $7.7 $8.0Accounts receivable $0.8 $0.1 $0.1 $0.0 $0.0Current income tax receivable $0.0 $0.0 $0.0 $0.0 $0.0Prepaid expenses & other $0.0 $0.1 $0.5 $0.4 $0.2Future income tax asset $0.0 $0.0 $0.0 $0.0 $0.0
Current assets $9.6 $1.5 $59.0 $8.1 $8.3
Investment in KOS Energy Ltd. $0.0 $0.1 $0.0 $0.0 $0.0Property & equipment $7.6 $15.7 $21.1 $67.7 $103.6
Total Assets $17.1 $17.2 $80.1 $75.9 $111.9
Liabilities & shareholder's equityAccoutns payable & accrued liabilities $0.1 $0.6 $2.1 $1.4 $0.9Current income taxes payable $0.0 $0.0 $0.0 $0.0 $0.0
Current Liabilites $0.1 $0.6 $2.1 $1.4 $0.9
Long-term debt $0.0 $0.0 $0.0 $0.0 $0.0Asset retirement obligations $0.0 $0.2 $0.2 $0.2 $0.2Future income tax liabil ity $0.0 $0.0 $0.0 $0.0 $0.0
Total liabilities $0.1 $0.8 $2.3 $1.6 $1.2
Common shares $12.1 $12.9 $74.7 $74.7 $114.7Contributed surplus & other $5.2 $5.5 $7.7 $7.7 $7.7Accumulated income -$0.3 -$2.0 -$4.6 -$8.2 -$11.7
Total shareholder's equity $17.1 $16.4 $77.8 $74.3 $110.7
Total liabilities & shareholder's equity $17.1 $17.2 $80.1 $75.9 $111.9
Source: Raymond James Ltd.
Exhibit 26: Historical and Forecast Income Statement
2008 2009 2010 2011E 2012EIncome StatementRevenue
Production revenue $0.0 $0.0 $0.0 $0.0 $0.0Interest & other income $0.1 $0.0 $0.0 $0.0 $0.0
ExpensesGeneral & administrative $0.4 $1.5 $1.9 $3.3 $3.5Stock-based compensation $0.0 $0.2 $0.8 $0.0 $0.0Financing & interest $0.0 $0.0 $0.0 $0.0 $0.0Depreciation & accretion $0.0 $0.0 $0.0 $0.0 $0.1Foreign exchange (gain)/loss $0.0 $0.0 -$0.1 $0.3 $0.0Other $0.0 $0.0 $0.0 $0.0 $0.0
EBIT -$0.3 -$1.8 -$2.6 -$3.5 -$3.6
TaxesCurrent income tax expense (recovery) $0.0 $0.0 $0.0 $0.0 $0.0Future income tax expense (recovery) $0.0 $0.0 $0.0 $0.0 $0.0
Net income (loss) -$0.3 -$1.8 -$2.6 -$3.5 -$3.6
Source: Raymond James Ltd.
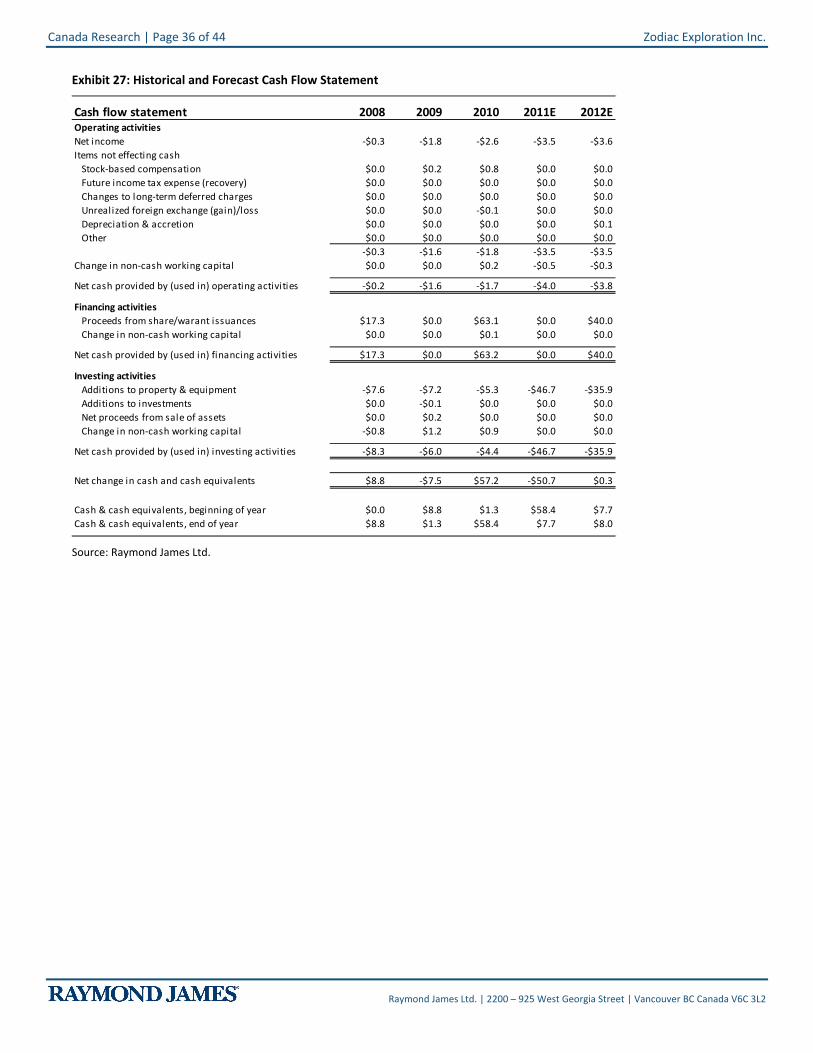
Canada Research | Page 36 of 44 Zodiac Exploration Inc.
Raymond James Ltd. | 2200 – 925 West Georgia Street | Vancouver BC Canada V6C 3L2
Exhibit 27: Historical and Forecast Cash Flow Statement
Cash flow statement 2008 2009 2010 2011E 2012EOperating activitiesNet income -$0.3 -$1.8 -$2.6 -$3.5 -$3.6Items not effecting cash
Stock-based compensation $0.0 $0.2 $0.8 $0.0 $0.0Future income tax expense (recovery) $0.0 $0.0 $0.0 $0.0 $0.0Changes to long-term deferred charges $0.0 $0.0 $0.0 $0.0 $0.0Unrealized foreign exchange (gain)/loss $0.0 $0.0 -$0.1 $0.0 $0.0Depreciation & accretion $0.0 $0.0 $0.0 $0.0 $0.1Other $0.0 $0.0 $0.0 $0.0 $0.0
-$0.3 -$1.6 -$1.8 -$3.5 -$3.5Change in non-cash working capital $0.0 $0.0 $0.2 -$0.5 -$0.3
Net cash provided by (used in) operating activities -$0.2 -$1.6 -$1.7 -$4.0 -$3.8
Financing activitiesProceeds from share/warant issuances $17.3 $0.0 $63.1 $0.0 $40.0Change in non-cash working capital $0.0 $0.0 $0.1 $0.0 $0.0
Net cash provided by (used in) financing activities $17.3 $0.0 $63.2 $0.0 $40.0
Investing activitiesAdditions to property & equipment -$7.6 -$7.2 -$5.3 -$46.7 -$35.9Additions to investments $0.0 -$0.1 $0.0 $0.0 $0.0Net proceeds from sale of assets $0.0 $0.2 $0.0 $0.0 $0.0Change in non-cash working capital -$0.8 $1.2 $0.9 $0.0 $0.0
Net cash provided by (used in) investing activities -$8.3 -$6.0 -$4.4 -$46.7 -$35.9
Net change in cash and cash equivalents $8.8 -$7.5 $57.2 -$50.7 $0.3
Cash & cash equivalents, beginning of year $0.0 $8.8 $1.3 $58.4 $7.7Cash & cash equivalents, end of year $8.8 $1.3 $58.4 $7.7 $8.0
Source: Raymond James Ltd.
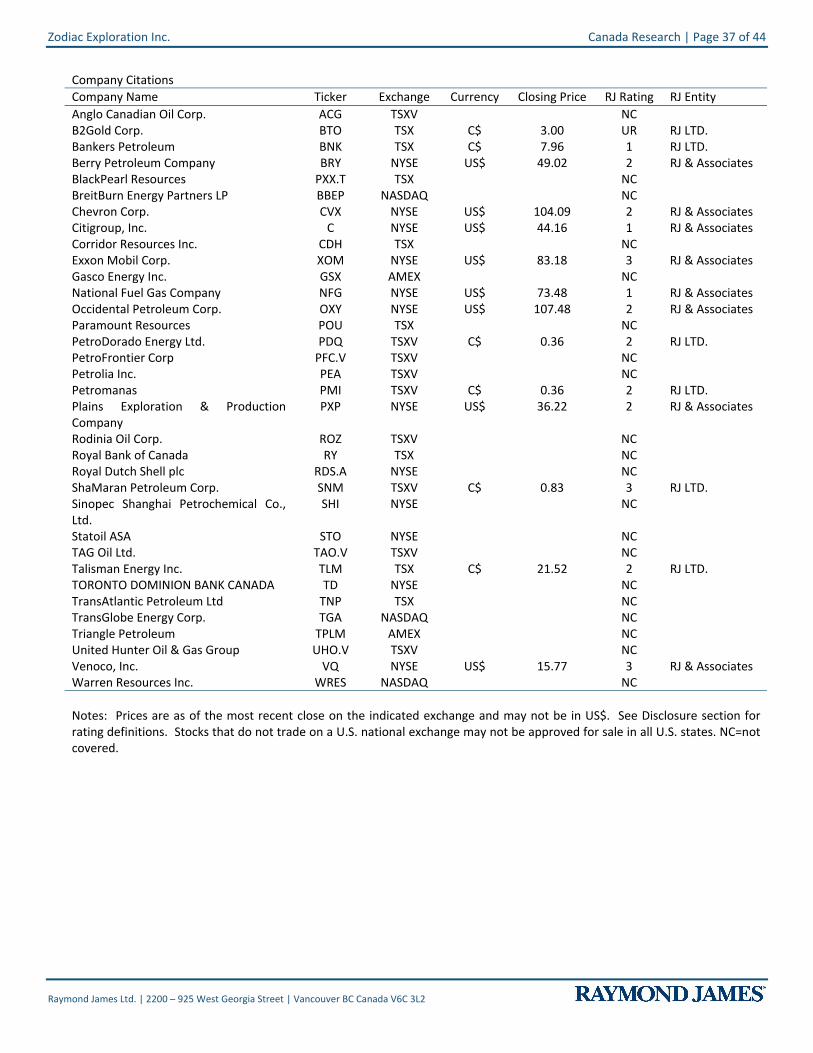
Zodiac Exploration Inc. Canada Research | Page 37 of 44
Raymond James Ltd. | 2200 – 925 West Georgia Street | Vancouver BC Canada V6C 3L2
Company Citations Company Name Ticker Exchange Currency Closing Price RJ Rating RJ Entity Anglo Canadian Oil Corp. ACG TSXV NC B2Gold Corp. BTO TSX C$ 3.00 UR RJ LTD. Bankers Petroleum BNK TSX C$ 7.96 1 RJ LTD. Berry Petroleum Company BRY NYSE US$ 49.02 2 RJ & Associates BlackPearl Resources PXX.T TSX NC BreitBurn Energy Partners LP BBEP NASDAQ NC Chevron Corp. CVX NYSE US$ 104.09 2 RJ & Associates Citigroup, Inc. C NYSE US$ 44.16 1 RJ & Associates Corridor Resources Inc. CDH TSX NC Exxon Mobil Corp. XOM NYSE US$ 83.18 3 RJ & Associates Gasco Energy Inc. GSX AMEX NC National Fuel Gas Company NFG NYSE US$ 73.48 1 RJ & Associates Occidental Petroleum Corp. OXY NYSE US$ 107.48 2 RJ & Associates Paramount Resources POU TSX NC PetroDorado Energy Ltd. PDQ TSXV C$ 0.36 2 RJ LTD. PetroFrontier Corp PFC.V TSXV NC Petrolia Inc. PEA TSXV NC Petromanas PMI TSXV C$ 0.36 2 RJ LTD. Plains Exploration & Production Company
PXP NYSE US$ 36.22 2 RJ & Associates
Rodinia Oil Corp. ROZ TSXV NC Royal Bank of Canada RY TSX NC Royal Dutch Shell plc RDS.A NYSE NC ShaMaran Petroleum Corp. SNM TSXV C$ 0.83 3 RJ LTD. Sinopec Shanghai Petrochemical Co., Ltd.
SHI NYSE NC
Statoil ASA STO NYSE NC TAG Oil Ltd. TAO.V TSXV NC Talisman Energy Inc. TLM TSX C$ 21.52 2 RJ LTD. TORONTO DOMINION BANK CANADA TD NYSE NC TransAtlantic Petroleum Ltd TNP TSX NC TransGlobe Energy Corp. TGA NASDAQ NC Triangle Petroleum TPLM AMEX NC United Hunter Oil & Gas Group UHO.V TSXV NC Venoco, Inc. VQ NYSE US$ 15.77 3 RJ & Associates Warren Resources Inc. WRES NASDAQ NC Notes: Prices are as of the most recent close on the indicated exchange and may not be in US$. See Disclosure section for rating definitions. Stocks that do not trade on a U.S. national exchange may not be approved for sale in all U.S. states. NC=not covered.
Canada Research | Page 38 of 44 Zodiac Exploration Inc.
Raymond James Ltd. | 2200 – 925 West Georgia Street | Vancouver BC Canada V6C 3L2
Important Investor Disclosures Raymond James is the global brand name for Raymond James & Associates (RJA) and its non-US affiliates worldwide. Raymond James & Associates is located at The Raymond James Financial Center, 880 Carillon Parkway, St. Petersburg, FL 33716, (727) 567-1000. Affiliates include the following entities, which are responsible for the distribution of research in their respective areas. In Canada, Raymond James Ltd., Suite 2200, 925 West Georgia Street, Vancouver, BC V6C 3L2, (604) 659-8200. In Latin America, Raymond James Latin America, Ruta 8, km 17, 500, 91600 Montevideo, Uruguay, 00598 2 518 2033. In Europe, Raymond James European Equities, 40, rue La Boetie, 75008, Paris, France, +33 1 45 61 64 90.
This document is not directed to, or intended for distribution to or use by, any person or entity that is a citizen or resident of or located in any locality, state, country, or other jurisdiction where such distribution, publication, availability or use would be contrary to law or regulation. The securities discussed in this document may not be eligible for sale in some jurisdictions. This research is not an offer to sell or the solicitation of an offer to buy any security in any jurisdiction where such an offer or solicitation would be illegal. It does not constitute a personal recommendation nor does it take into account the particular investment objectives, financial situations, or needs of individual clients. Information in this report should not be construed as advice designed to meet the individual objectives of any particular investor. Investors should consider this report as only a single factor in making their investment decision. Consultation with your investment advisor is recommended. Past performance is not a guide to future performance, future returns are not guaranteed, and a loss of original capital may occur.
The information provided is as of the date above and subject to change, and it should not be deemed a recommendation to buy or sell any security. Certain information has been obtained from third-party sources we consider reliable, but we do not guarantee that such information is accurate or complete. Persons within the Raymond James family of companies may have information that is not available to the contributors of the information contained in this publication. Raymond James, including affiliates and employees, may execute transactions in the securities listed in this publication that may not be consistent with the ratings appearing in this publication.
With respect to materials prepared by Raymond James Ltd. (“RJL”), all expressions of opinion reflect the judgment of the Research Department of RJL, or its affiliates, at this date and are subject to change. RJL may perform investment banking or other services for, or solicit investment banking business from, any company mentioned in this document.
All Raymond James Ltd. research reports are distributed electronically and are available to clients at the same time via the firm’s website (http://www.raymondjames.ca). Immediately upon being posted to the firm’s website, the research reports are then distributed electronically to clients via email upon request and to clients with access to Bloomberg (home page: RJLC), First Call Research Direct and Reuters. Selected research reports are also printed and mailed at the same time to clients upon request. Requests for Raymond James Ltd. research may be made by contacting the Raymond James Product Group during market hours at (604) 659-8000.
In the event that this is a compendium report (i.e., covers 6 or more subject companies), Raymond James Ltd. may choose to provide specific disclosures for the subject companies by reference. To access these disclosures, clients should refer to: http://www.raymondjames.ca (click on Equity Capital Markets / Equity Research / Research Disclosures) or call toll-free at 1-800-667-2899.
Analyst Information
Analyst Compensation: Equity research analysts and associates at Raymond James are compensated on a salary and bonus system. Several factors enter into the compensation determination for an analyst, including i) research quality and overall productivity, including success in rating stocks on an absolute basis and relative to the local exchange composite Index and/or a sector index, ii) recognition from institutional investors, iii) support effectiveness to the institutional and retail sales forces and traders, iv) commissions generated in stocks under coverage that are attributable to the analyst’s efforts, v) net revenues of the overall Equity Capital Markets Group, and vi) compensation levels for analysts at competing investment dealers.
Analyst Stock Holdings: Effective September 2002, Raymond James equity research analysts and associates or members of their households are forbidden from investing in securities of companies covered by them. Analysts and associates are permitted to hold long positions in the securities of companies they cover which were in place prior to September 2002 but are only permitted to sell those positions five days after the rating has been lowered to Underperform. The covering
Zodiac Exploration Inc. Canada Research | Page 39 of 44
Raymond James Ltd. | 2200 – 925 West Georgia Street | Vancouver BC Canada V6C 3L2
analyst and/or research associate owns shares of the common stock of Chevron Corp., B2Gold Corp., B2Gold Corp., B2Gold Corp., B2Gold Corp., Bankers Petroleum, Bankers Petroleum, Bankers Petroleum, Bankers Petroleum, Bankers Petroleum, BRY, Berry Petroleum Company, C, OXY, PetroDorado Energy Ltd., PetroDorado Energy Ltd., PetroDorado Energy Ltd., Petromanas, Petromanas, Petromanas, PXP, ShaMaran Petroleum Corp., VQ, WRES, Zodiac Exploration Inc., Zodiac Exploration Inc., and Zodiac Exploration Inc.
The views expressed in this report accurately reflect the personal views of the analyst(s) covering the subject securities. No part of said person's compensation was, is, or will be directly or indirectly related to the specific recommendations or views contained in this research report. In addition, said analyst has not received compensation from any subject company in the last 12 months.
Ratings and Definitions
Raymond James Ltd. (Canada) definitions
Strong Buy (SB1) The stock is expected to appreciate and produce a total return of at least 15% and outperform the S&P/TSX Composite Index over the next six months. Outperform (MO2) The stock is expected to appreciate and outperform the S&P/TSX Composite Index over the next twelve months. Market Perform (MP3) The stock is expected to perform generally in line with the S&P/TSX Composite Index over the next twelve months and is potentially a source of funds for more highly rated securities. Underperform (MU4) The stock is expected to underperform the S&P/TSX Composite Index or its sector over the next six to twelve months and should be sold.
Raymond James & Associates (U.S.) definitions
Strong Buy (SB1) Expected to appreciate, produce a total return of at least 15%, and outperform the S&P 500 over the next six to 12 months. For higher yielding and more conservative equities, such as REITs and certain MLPs, a total return of at least 15% is expected to be realized over the next 12 months. Outperform (MO2) Expected to appreciate and outperform the S&P 500 over the next 12-18 months. For higher yielding and more conservative equities, such as REITs and certain MLPs, an Outperform rating is used for securities where we are comfortable with the relative safety of the dividend and expect a total return modestly exceeding the dividend yield over the next 12-18 months. Market Perform (MP3) Expected to perform generally in line with the S&P 500 over the next 12 months. Underperform (MU4) Expected to underperform the S&P 500 or its sector over the next six to 12 months and should be sold. Suspended (S) The rating and price target have been suspended temporarily. This action may be due to market events that made coverage impracticable, or to comply with applicable regulations or firm policies in certain circumstances, including when Raymond James may be providing investment banking services to the company. The previous rating and price target are no longer in effect for this security and should not be relied upon.
Raymond James Latin American rating definitions
Strong Buy (SB1) Expected to appreciate and produce a total return of at least 25.0% over the next twelve months. Outperform (MO2) Expected to appreciate and produce a total return of between 15.0% and 25.0% over the next twelve months. Market Perform (MP3) Expected to perform in line with the underlying country index. Underperform (MU4) Expected to underperform the underlying country index.
Raymond James European Equities rating definitions
Strong Buy (1) Absolute return expected to be at least 10% over the next 12 months and perceived best performer in the sector universe. Buy (2) Absolute return expected to be at least 10% over the next 12 months. Fair Value (3) Stock currently trades around its fair price and should perform in the range of -10% to +10% over the next 12 months. Sell (4) Expected absolute drop in the share price of more than 10% in next 12 months.
Suitability Categories (SR)
For stocks rated by Raymond James & Associates only, the following Suitability Categories provide an assessment of potential risk factors for investors. Suitability ratings are not assigned to stocks rated Underperform (Sell). Projected 12-month price targets are assigned only to stocks rated Strong Buy or Outperform.
Total Return (TR) Lower risk equities possessing dividend yields above that of the S&P 500 and greater stability of principal.
Growth (G) Low to average risk equities with sound financials, more consistent earnings growth, possibly a small dividend, and the potential for long-term price appreciation.
Canada Research | Page 40 of 44 Zodiac Exploration Inc.
Raymond James Ltd. | 2200 – 925 West Georgia Street | Vancouver BC Canada V6C 3L2
Aggressive Growth (AG) Medium or higher risk equities of companies in fast growing and competitive industries, with less predictable earnings and acceptable, but possibly more leveraged balance sheets.
High Risk (HR) Companies with less predictable earnings (or losses), rapidly changing market dynamics, financial and competitive issues, higher price volatility (beta), and risk of principal.
Venture Risk (VR) Companies with a short or unprofitable operating history, limited or less predictable revenues, very high risk associated with success, and a substantial risk of principal.
Rating Distributions
Coverage Universe Rating Distribution Investment Banking Distribution
RJL RJA RJL RJA
Strong Buy and Outperform (Buy) 70% 53% 60% 24%
Market Perform (Hold) 28% 41% 34% 10%
Underperform (Sell) 1% 6% 0% 8%
Raymond James Relationship Disclosures
Raymond James Ltd. or its affiliates expects to receive or intends to seek compensation for investment banking services from all companies under research coverage within the next three months.
Company Name Disclosure
B2Gold Corp. Within the last 12 months, B2Gold Corp. has paid for all or a material portion of the travel costs associated with a site visit by the Analyst and/or Associate.
Raymond James Ltd. has provided non-investment banking securities-related services within the last 12 months with respect to B2Gold Corp.
Raymond James Ltd. has received compensation for investment banking services within the last 12 months with respect to B2Gold Corp.
Raymond James Ltd. has received compensation for services other than investment banking within the last 12 months with respect to B2Gold Corp.
Bankers Petroleum Raymond James Ltd. has managed or co-managed a public offering of securities within the last 12 months with respect to Bankers Petroleum.
Raymond James Ltd. has provided investment banking services within the last 12 months with respect to Bankers Petroleum.
Raymond James Ltd. has provided non-investment banking securities-related services within the last 12 months with respect to Bankers Petroleum.
Raymond James Ltd. has received compensation for investment banking services within the last 12 months with respect to Bankers Petroleum.
Raymond James Ltd. has received compensation for services other than investment banking within the last 12 months with respect to Bankers Petroleum.
Berry Petroleum Company Raymond James & Associates or one of its affiliates owns more than 1% of the outstanding shares of BRY.
Raymond James & Associates co-managed a public debt offering for Berry Petroleum Company in May 2009.
Citigroup, Inc. Raymond James & Associates received non-investment banking securities-related compensation from C within the past 12 months.
Occidental Petroleum Corp. Raymond James & Associates received non-investment banking securities-related compensation from OXY within the past 12 months.
Zodiac Exploration Inc. Canada Research | Page 41 of 44
Raymond James Ltd. | 2200 – 925 West Georgia Street | Vancouver BC Canada V6C 3L2
Company Name Disclosure
PetroDorado Energy Ltd. Raymond James Ltd. has managed or co-managed a public offering of securities within the last 12 months with respect to PetroDorado Energy Ltd.
Raymond James Ltd. has provided investment banking services within the last 12 months with respect to PetroDorado Energy Ltd.
Raymond James Ltd. has received compensation for investment banking services within the last 12 months with respect to PetroDorado Energy Ltd.
Petromanas Raymond James Ltd. has managed or co-managed a public offering of securities within the last 12 months with respect to Petromanas.
Raymond James Ltd. has provided investment banking services within the last 12 months with respect to Petromanas.
Raymond James Ltd. has received compensation for investment banking services within the last 12 months with respect to Petromanas.
Plains Exploration & Production Company
Raymond James & Associates co-managed a follow-on offering of PXP shares in August 2009.
ShaMaran Petroleum Corp. Raymond James Ltd. has received compensation for investment banking services within the last 12 months with respect to ShaMaran Petroleum Corp.
Venoco, Inc. Raymond James & Associates or one of its affiliates owns more than 1% of the outstanding shares of VQ.
Warren Resources Inc. Raymond James & Associates makes a NASDAQ market in shares of WRES.
Zodiac Exploration Inc. Raymond James Ltd. has managed or co-managed a public offering of securities within the last 12 months with respect to Zodiac Exploration Inc.
Raymond James Ltd. has provided investment banking services within the last 12 months with respect to Zodiac Exploration Inc.
Raymond James Ltd. has received compensation for investment banking services within the last 12 months with respect to Zodiac Exploration Inc.
Stock Charts, Target Prices, and Valuation Methodologies
Valuation Methodology: The Raymond James methodology for assigning ratings and target prices includes a number of qualitative and quantitative factors including an assessment of industry size, structure, business trends and overall attractiveness; management effectiveness; competition; visibility; financial condition, and expected total return, among other factors. These factors are subject to change depending on overall economic conditions or industry- or company-specific occurrences.
Target Prices: The information below indicates our target price and rating changes for ZEX stock over the past three years.

Canada Research | Page 42 of 44 Zodiac Exploration Inc.
Raymond James Ltd. | 2200 – 925 West Georgia Street | Vancouver BC Canada V6C 3L2
Price Rating Change Target Price ChangeCoverage Suspended Target Price and Rating Change Split Adjustment
$0.00
$0.20
$0.40
$0.60
$0.80
$1.00
$1.20
$1.40
$1.60
$1.80
$2.00
$2.20
May
-12-
08
Jun-
09-0
8
Jul-07
-08
Aug
-04-
08
Sep
-01-
08
Sep
-29-
08
Oct
-27-
08
Nov
-24-
08
Dec
-22-
08
Jan-
19-0
9
Feb
-16-
09
Mar
-16-
09
Apr
-13-
09
May
-11-
09
Jun-
08-0
9
Jul-06
-09
Aug
-03-
09
Aug
-31-
09
Sep
-28-
09
Oct
-26-
09
Nov
-23-
09
Dec
-21-
09
Jan-
18-1
0
Feb
-15-
10
Mar
-15-
10
Apr
-12-
10
May
-10-
10
Jun-
07-1
0
Jul-05
-10
Aug
-02-
10
Aug
-30-
10
Sep
-27-
10
Oct
-25-
10
Nov
-20-
10
Dec
-18-
10
Jan-
14-1
1
Feb
-11-
11
Mar
-11-
11
Apr
-07-
11
May
-06-
11
Secu
rity
Pric
e (C
$)Zodiac Exploration Inc. (ZEX) 3 yr. Stock PerformanceZodiac Exploration Inc. (ZEX) 3 yr. Stock Performance
Date: May 09 2011
Analyst Recommendations & 12 Month Price ObjectiveSB1: Strong Buy MO2: Outperform MP3: Market Perform MU4: Underperform NR : Not Rated R: Restricted
Upd
ate
Dat
e
Clos
ing
Pric
e
Targ
et
Pric
e
Rati
ng
Valuation Methodology: We value Zodiac Exploration on a Net Asset Value approach.
Risk Factors
General Risk Factors: Following are some general risk factors that pertain to the projected target prices included on Raymond James research: (1) Industry fundamentals with respect to customer demand or product / service pricing could change and adversely impact expected revenues and earnings; (2) Issues relating to major competitors or market shares or new product expectations could change investor attitudes toward the sector or this stock; (3) Unforeseen developments with respect to the management, financial condition or accounting policies or practices could alter the prospective valuation; or (4) External factors that affect the U.S. economy, interest rates, the U.S. dollar or major segments of the economy could alter investor confidence and investment prospects. International investments involve additional risks such as currency fluctuations, differing financial accounting standards, and possible political and economic instability.
Risks - Zodiac Exploration Inc. 1) The factors that can influence oil and gas commodity prices including economic growth, political developments, OPEC compliance to production quotas and weather; 2) environmental risks associated with the production of oil and gas; 3) competition within the oil and gas sector for limited resources; 4) interest rate risk for levered companies and 5) risks related to recovery potential and the difficult drilling environment that the company will be operating in.
Additional Risk and Disclosure information, as well as more information on the Raymond James rating system and suitability categories, is available at www.raymondjames.ca/researchdisclosures. Copies of research or Raymond James’ summary policies relating to research analyst independence can be obtained by contacting any Raymond James & Associates or Raymond James Financial Services office (please see raymondjames.com for office locations) or by calling 727-567-1000, toll free 800-237-5643 or sending a written request to the Equity Research Library, Raymond James & Associates, Inc., Tower 3, 6th Floor, 880 Carillon Parkway, St. Petersburg, FL 33716.
International Disclosures
For clients in the United States:
Investing in securities of issuers organized outside of the U.S., including ADRs, may entail certain risks. The securities of non-U.S. issuers may not be registered with, nor be subject to the reporting requirements of, the U.S. Securities and Exchange Commission. There may be limited information available on such securities. Investors who have received this report may be prohibited in certain states or other jurisdictions from purchasing the securities mentioned in this report. Please ask your Financial Advisor for additional details.
Zodiac Exploration Inc. Canada Research | Page 43 of 44
Raymond James Ltd. | 2200 – 925 West Georgia Street | Vancouver BC Canada V6C 3L2
Raymond James Ltd. is not a U.S. broker-dealer and therefore is not governed by U.S. laws, rules or regulations applicable to U.S. broker-dealers. Consequently, the persons responsible for the content of this publication are not licensed in the U.S. as research analysts in accordance with applicable rules promulgated by the U.S. Self Regulatory Organizations.
Any U.S. Institutional Investor wishing to effect trades in any security should contact Raymond James (USA) Ltd., a U.S. broker-dealer affiliate of Raymond James Ltd.
For clients in the United Kingdom:
For clients of Raymond James & Associates (RJA) and Raymond James Financial International, Ltd. (RJFI): This report is for distribution only to persons who fall within Articles 19 or Article 49(2) of the Financial Services and Markets Act (Financial Promotion) Order 2000 as investment professionals and may not be distributed to, or relied upon, by any other person.
For clients of Raymond James Investment Services, Ltd.: This report is intended only for clients in receipt of Raymond James Investment Services, Ltd.’s Terms of Business or others to whom it may be lawfully submitted.
For purposes of the Financial Services Authority requirements, this research report is classified as objective with respect to conflict of interest management. RJA, Raymond James Financial International, Ltd., and Raymond James Investment Services, Ltd. are authorized and regulated in the U.K. by the Financial Services Authority.
For institutional clients in the European Economic Area (EEA) outside of the United Kingdom:
This document (and any attachments or exhibits hereto) is intended only for EEA institutional clients or others to whom it may lawfully be submitted.
Proprietary Rights Notice: By accepting a copy of this report, you acknowledge and agree as follows:Valuation Methodology: We value Zodiac Exploration on a Net Asset Value approach.
This report is provided to clients of Raymond James only for your personal, noncommercial use. Except as expressly authorized by Raymond James, you may not copy, reproduce, transmit, sell, display, distribute, publish, broadcast, circulate, modify, disseminate or commercially exploit the information contained in this report, in printed, electronic or any other form, in any manner, without the prior express written consent of Raymond James. You also agree not to use the information provided in this report for any unlawful purpose. This is RJA client releasable research
This report and its contents are the property of Raymond James and are protected by applicable copyright, trade secret or other intellectual property laws (of the United States and other countries). United States law, 17 U.S.C. Sec.501 et seq, provides for civil and criminal penalties for copyright infringement.
Additional information is available upon request. This document may not be reprinted without permission.
RJL is a member of CIPF. ©2011 Raymond James Ltd.
Canada Research | Page 44 of 44 Zodiac Exploration Inc.
Raymond James Ltd. | 2200 – 925 West Georgia Street | Vancouver BC Canada V6C 3L2
RAYMOND JAMES LTD. CANADIAN INSTITUTIONAL EQUITY TEAM WWW.RAYMONDJAMES.CA
INSTITUTIONAL EQUITY SALES HEAD OF SALES
MIKE WESTCOTT 416.777.4935 MICHELLE BALDRY (MARKETING COORDINATOR) 416.777.4951
TORONTO (CAN 1.888.601.6105 | USA 1.800.290.4847)
LAURA ARRELL (U.S. EQUITIES) 416.777.4920 SEAN BOYLE 416.777.4927 JEFF CARRUTHERS, CFA 416.777.4929 JON DE VOS (LONDON) 0.207.426.5632 RICHARD EAKINS 416.777.4926 JONATHAN GREER 416.777.4930 AMAN JAIN 416.777.4949 DAVE MACLENNAN 416.777.4934 ROBERT MILLS, CFA 416.777.4945 DOUG OWEN 416.777.4925 NICOLE SVEC-GRIFFIS, CFA (U.S. EQUITIES) 416.777.4942 LAKSHMI THURAI (LONDON) 0.207.426.5632 NEIL WEBER 416.777.4931 CARMELA AVELLA (ASSISTANT) 416.777.4915 ORNELLA BURNS (ASSISTANT) 416.777.4928
VANCOUVER (1.800.667.2899)
SCOT ATKINSON, CFA 604.659.8225 DOUG BELL 604.659.8220 TERRI MCEWAN (ASSISTANT) 604.659.8228
MONTREAL (514.350.4450 | 1.866.350.4455)
JOHN HART 514.350.4462 DAVID MAISLIN, CFA 514.350.4460 ELLIOTT SOIFER 514.350.4472 TANYA HATCHER (ASSISTANT) 514.350.4458
INSTITUTIONAL EQUITY TRADING CO-HEAD OF TRADING
BOB MCDONALD, CFA 604.659.8222 ANDREW FOOTE, CFA 416.777.4924
TORONTO (CANADA 1.888.601.6105 | USA 1.800.290.4847) PAM BANKS 416.777.4923 ANTHONY COX 416.777.4922 ROSS DAVIDSON 416.777.4981 OLIVER HERBST 416.777.4947 ANDY HERRMANN 416.777.4937 ERIC MUNRO, CFA 416.777.4983 JAMES SHIELDS 416.777.4941 BOB STANDING 416.777.4921 Peter MASON (Assistant) 416.777.7195
VANCOUVER (1.800.667.2899) NAV CHEEMA 604.659.8224 FRASER JEFFERSON 604.659.8218 DEREK ORAM 604.659.8223
MONTREAL (514.350.4450 | 1.866.350.4455) SEBASTIEN BENOIT 514.350.4466 JOE CLEMENT 514.350.4470
RETAIL RESEARCH & DISTRIBUTION
SAMANTHA BARRETT, CFA 604.659.8235 LAUREN CORSCADDEN (ASSISTANT) 604.659.8233
INSTITUTIONAL EQUITY OFFICES Calgary Suite 2500 707 8th Avenue SW Calgary, AB T2P 1H5 403.509.0500
Montreal Suite 1420 1002 Sherbrooke St W Montreal, PQ H3A 3L6 514.350.4450 Toll Free: 1.866.350.4455
Vancouver Suite 2200 925 West Georgia Street Vancouver, BC V6C 3L2 604.659.8200 Toll Free: 1.800.667.2899
EQUITY RESEARCH HEAD OF EQUITY RESEARCH
DARYL SWETLISHOFF, CFA 604.659.8246 DEB CHEETHAM (RESEARCH ASSISTANT) 604.659.8200
CONSUMER PRODUCTS & RETAIL CONSUMER PRODUCTS & RETAIL
KENRIC TYGHE, MBA 416.777.7188 SARA KOHBODI (ASSOCIATE) 416.777.4916
ENERGY OIL & GAS ENERGY SERVICES, HEAD OF ENERGY RESEARCH
ANDREW BRADFORD, CFA 403.509.0503 NICK HEFFERNAN (ASSOCIATE) 403.509.0511 BEN NOSAL (ASSOCIATE) 403.509.0534 BRANDI BUGERA (RESEARCH ASSISTANT) 403.509.0537
INTERNATIONAL OIL & GAS RAFI KHOURI, B.SC, MBA 403.509.0560 CYNTHIA YEE (ASSOCIATE) 416.777.7175
OIL & GAS TRUSTS | OIL & GAS PRODUCERS KRISTOPHER ZACK, CA, CFA 403.221.0414 GORDON STEPPAN (ASSOCIATE) 403.221.0411
OIL SANDS | OIL & GAS PRODUCERS JUSTIN BOUCHARD, P.ENG. 403.509.0523 CHRISTOPHER COX (ASSOCIATE) 403.509.0562
OIL & GAS PRODUCERS LUC MAGEAU, CFA 403.509.0505 MATTHEW STEVENSON (ASSOCIATE) 403.509.0518
INDUSTRIAL INDUSTRIAL | AEROSPACE & AVIATION, HEAD OF INDUSTRIAL RESEARCH
BEN CHERNIAVSKY 604.659.8244 THEONI PILARINOS, CFA (ASSOCIATE) 604.659.8234 GREG JACKSON (ASSOCIATE) 604.659.8262
INFRASTRUCTURE & CONSTRUCTION FREDERIC BASTIEN, CFA 604.659.8232 JAMIL MURJI, CFA (ASSOCIATE) 604.659.8261
TRANSPORTATION | AGRIBUSINESS & FOOD PRODUCTS STEVE HANSEN, CMA, CFA 604.659.8208 ARASH YAZDANI, MBA (ASSOCIATE) 604.659.8280
MINING BASE METALS & MINERALS
ADAM LOW, CFA 416.777.4943 PRECIOUS METALS
BRAD HUMPHREY 416.777.4917 GARY BASCHUK 416.777.7098 GRAHAM MORRISON (ASSOCIATE) 416.777.7189 PHIL RUSSO (ASSOCIATE) 416.777.7084
URANIUM & JUNIOR EXPLORATION BART JAWORSKI, P.GEO. 604.659.8282 DAVID SADOWSKI (ASSOCIATE) 604.659.8255
FORESTRY FORESTRY
DARYL SWETLISHOFF, CFA 604.659.8246 DAVID QUEZADA, CFA (ASSOCIATE) 604.659.8257
REAL ESTATE REAL ESTATE & REITS
TRACY REYNOLDS (ASSOCIATE) 416.777.7042
TECHNOLOGY TECHNOLOGY, ALTERNATIVE ENERGY & CLEAN TECH
STEVEN LI, CFA 416.777.4918 ANTHONY JIN, MBA, P.ENG (ASSOCIATE) 416.777.6414
EQUITY RESEARCH PUBLISHING SENIOR SUPERVISORY ANALYST
HEATHER HERRON 403.509.0509 HEAD OF PUBLISHING
CYNTHIA LUI 604.659.8210
STEPHANIE CURAPOV (SUPERVISORY ANALYST | EDITOR) 416.777.4948 INDER GILL (RESEARCH EDITOR) 604.659.8202 KEVIN LAROSE (SUPERVISORY ANALYST | EDITOR) 416.777.7172 CHRISTINE MARTE (PUBLISHING ASSISTANT) 604.659.8200 ASHLEY RAMSAY (RESEARCH EDITOR) 604.659.8226
Toronto Suite 5400, Scotia Plaza 40 King Street West Toronto, ON M5H 3Y2 416.777.4900 Toll Free Canada: .888.601.6105 Toll Free USA: 1.800.290.4847
International Headquarters The Raymond James Financial Center 880 Carillon Parkway St.Petersburg, FL USA 33716 727.567.1000