rationale of consumer behavior in organized retail...
TRANSCRIPT

Chapter 5
Rationale of Consumer Behavior in Organized
Retail Outlets
5.1 Introduction
5.2 Factors Affecting Consumer Decision Making
5.3 Indian Retail Sector and Changing Consumer Behavior
5.4 Retail Consumer Behavior and Role of Services in Retailing
5.5 Theories of Consumer Behavior
5.6 Primary Data Analysis of Dimension of Consumer Behavior
5.7 Summary of the Observation
5.8 Testing of the Hypotheses
5.9 Conclusion


219
Chapter 5
Rationale of Consumer Behavior in Organized
Retail Outlets
5.1 Introduction
The retail sector in India is witnessing a huge revamping exercise as traditional
markets make way for new formats such as departmental stores, hypermarkets,
supermarkets and specialty stores. Western-style malls have begun appearing in
metros and second-rung cities alike introducing the Indian consumer to a shopping
experience like never before. The sector is at an inflexion point where the growth of
organized retailing and growth in the consumption by the Indian population is going
to take a higher growth trajectory. The Indian population is witnessing a significant
change in its demographics. Organized retail is on all time high in India. The growth
is boosted by various factors such as availability of professional practices, media
proliferation, various brands which are gaining value thereby enhancing industry
growth, availability of various funding options, regulations like VAT implementation
to make processes simple, sea change in demographics of country and international
exposure.
The retail sector is one of the fastest growing ones in India, catering to the world's
second largest consumer market. The Indian consumer market is estimated to grow at
13 percent annually from $322 billion in 2006-07 to $590 billion in 2011-12.
Organized retail, which constituted a low 4 percent of total retail in 2006-07, is

220
estimated to grow at 45-50 percent per annum and attain a 16 percent share of the
total retail market by 2011-12302
.
Consumer behavior is defined as “The dynamic interaction of affect and cognition,
behavior and the environment into which human beings conduct the exchange aspects
of lives”. IT means that the buying habits of the consumer are greatly affected by their
thought process and their feelings experienced. Human beings are greatly influenced
in their buying actions by various factors like opinion of others, marketing stimuli like
product, advertising, packaging and product appearance.
Consumer buying behavior refers to the buying behavior of the ultimate consumer.
Consumer behavior is the understanding of how consumers make decision to use their
resources such as time money and effort for buying using and disposing goods and
services .the behavior of humans as consumers is complex. Marketers understanding
of the drivers of consumers buying behavior will help them to service their customer
effectively and efficiently and attract new customers. It is very important and required
to understand customers shopping behavior with regards to retailing this includes
decision variables regarding brand selection shopping timing and choice of retail
format and store.
Traditional demographic variables cannot clearly identify the complete characteristics
of an evolutionary retail market, as consumers in the same demographic group have
diverse psychographic makeup. Therefore, psychographic factors influencing
consumer behavior have to be understood more closely by organized retailers.
Further, organized retailing itself has a tremendous influence on consumer behavior.
Thus, consumer behavior and organized retailing have reciprocal influences on each
other.
So far, the prominent organized retail sector players have been largely restricted to
urban areas. In fact, their emergence and growth has been phenomenal in metropolitan
cities and in other large cities. However, of late, organized retail has started making
302
Ghosh Dastidar Surajit and Datta Biplab., Demographic Differences in Consumer Exploratory
Tendencies: An Empirical Examination, IIMB Management Review, Vol. 21, No.4, pp. 297-312
2009.

221
inroads even into smaller cities. Infrastructure constraints, huge distribution costs
owing to large geographical area, fragmented market, and absence of national
distribution nodes and networks, are the main limitations faced by organized retailers
today in India.
5.1.1 Indian Consumer Behavior
The Indian consumer has undergone a remarkable transformation. Just a decade or
two ago, the Indian consumer saved most of his income, purchased the bare
necessities and rarely indulged himself. Today, armed with a higher income, credit
cards, exposure to the shopping culture of the west and a desire to improve his
standard of living, the Indian consumer is spending like never before. Organized retail
with its variety of products and multitude of malls and supermarkets is fueling his
addiction. His new mentality, in turn, is fueling the growth of organized retail in
India.
Some of the features characteristic of these consumers is their tendency to borrow
money in order to buy the upscale items – contrary to the traditional line of thought
that Indian consumers are indisposed to credit. But these consumers not only have
price and quality on their minds but also the fact that their brands effectively reflect
their local environment and are consonant with their life style. And this is where the
foreign multinationals coming into the Indian consumer market has to pay attention.
Selling global brands in India at global prices is a road to perdition. Companies who
have tailored their products to the Indian environment and customer have reaped high
rewards.
At the same time, Indians will find it hard to give up their old habits of shopping at
the local corner-store or buying goods from the street-vendor. The next section
describes the unorganized and organized retail sectors in detail. It is critical to
understand these sectors individually to speculate about possible the nature of
interaction between them. While the traditional form of retail in India is sure to suffer
a setback from the entry of large organized retailers, it is possible for both forms to

222
co-exist serving the new personality and old-habits of the Indian consumer
simultaneously.
The retailer in order to stay in the market and face the competition he should
understand consumer shopping behavior. This is possible by analyzing the factors that
affect behavior. These factors could be demographic, psychological, environmental or
related to the lifestyle of the customer. The retailer also needs to identify the various
stages in the customer decision making process and the major influence stage. To
understand the concept from the 1950s to 1980 Indian shoppers were used to shop at
Haat, Mandis, Melas and at small family run stores kirana shops. After liberalization,
privatization and globalization Indian government lifted the restrictions from private
companies and Indian economy slowly progressed from being state-led to market
friendly. This was the beginning of modern India. The growth of middle and higher
middle class, growing trend of call centers and BPO, increasing number o dual
income nuclear families, convenience of shopping from one place to another,
reasonable pricing and a good place to pass the time fuelled the growth of
supermarket, hypermarkets and concepts of organized retailing in India.

223
Figure 5.1
Consumer Behavior Model in Changing Retail Scenario
5.1.2 The Need for Studying Consumer Behavior
The key challenge faced by the retailer is creating products and services which would
be successful in the market. An accurate understanding of consumer need helps the
retailer create product that is likely to be successful in the market. Understanding
consumer buying behavior is the starting point of strategy creation. The understanding
helps in determining the channels of communication, proving consumer knowledge
which can help a firm assess how well it has achieved its product positioning goals.
The firm with the help of studying consumer behavior tries to see how its products are
perceived, whether there is a good match or not and then to consider the positioning
strategy deemed a success.

224
The retailer should know the consumers, because it is imported to know how, when
and where the customers use the product or service that the retailers sell. When the
retailer understands consumer behavior he is able to make an objective analysis of
internal strengths and weakness. This analysis may reveal certain startling facts and
provide direction for future differentiation strategies.
5.2 Factors Influencing the Behavior of the Consumer
The behavior of retail consumer is a subject of study across the world.
In India retailers and retail formats are evolving on a great extent. Understanding the
reasons for consumer‟s behavior is very important for retailer. Following are the
factors which influence the customer‟s decision making process.
1. Range of Merchandise: The range of merchandise is perhaps the most important
reason for customers to patronize a particular outlet. The initial curiosity of the
store may draw a consumer to a retail store, but converting him into a buyer and
retailing him over a period of time is largely dependent on the quality and the
range of merchandise offered by the store. The range of merchandise offered
plays an important role in case of categories like devalues, books and music.
2. Convenience of Shopping at a particular outlet: The element of convenience is a
fast gaining promises in the world of organized retail. This is especially true in
case of items like grocery/fruits and chemists. For example, while buying
medicines, most patients would prefer the buy from the chemist near the doctor
clinic or near the hospital.
3. Time to travel: The time required to reach a particular retail location is again
fast becoming critical. This is very much relevant in cities or metros like
Mumbai, where travel time is high. This has resulted in many local areas
developing in terms of shopping to facilitate buying.
4. Socio economic factors: Socio economic factors are seen as a fundamental to
development. India is a nation which has a large middle class a youth population

225
which is happy spending and a steady rate of growth of G.D.P. The Socio-
economic background of the consumer largely determines his lifestyle.
Consumer buying behavior varies from market to market and is largely
influenced by the culture of the region. This can be explained with the help of an
example. That is a culture of Asia is different than Western Culture, therefore
accordingly consumer behavior also shifts. The retailer needs to understand that
the need hierarchy is different for each market.
It is important for the retailer to consider socio economic change in a geographic
region over a period of time as it is indicator of the facilities available at various
levels and the quality of life of the population this would indirectly be related to the
spread of organized retail. The primary indication of socio economic change is the
increase in life expectancy from 58 years in the year 1991-92, to an average of 66
years in 2006-07. India aims to achieve 100 percent literacy (within the age group of
15-35) by the year 2006-07, there also likely hood that the basic amenities like
drinking water and electricity will be available and this will result in the improvement
in the basic quality of life of an average Indian citizens and when basic necessities are
being taken care there is good change that the demand for other products and services
may increase.
The researcher in order to understand whether the developments of organized retail
outlets have changed the consumer behavior conducted a primary research of 723
consumers in Mumbai and categorized them into different age group. The results are
put up in the table 5.1 and also the graphical representation in Graph 5.1.
Table 5.1
Organized Retail outlets and change in consumer behavior
Sr.No Age
Total 15-25 25-35 35-45 45-55 > 55
1 Yes, very much 188 74 23 10 5 300
2 Yes, to some extent 155 111 65 34 5 370
3 No not at all 25 8 5 13 2 53
Total 368 193 93 57 12 723
Source: Compiled from Primary data.

226
Graph 5.1
Organized Retail outlets and change in consumer behavior
Table 5.1 and Graph 5.1 give a clear indication that the development of organized
retail outlets in Mumbai has changed the behavior to a great extent. Major impact
could be seen in the age group of 15-25 with 188 respondent having a feel of very
much and 155 feeling that the impact has been to some extent, further it has been seen
that respondents between the age group of 25-35 also feel the same but the number
differing 74 respondent feel the impact is very much and 111 respondent feel the
impact is to some extent. The analysis states that the young and middle a consumers
are greatly influenced by the growth of organized outlets.
5.2.1 Stage of the Family Life Cycle
The stage of the family life cycle that customer belongs to and also it largely
influences his needs. For example, the needs of a young bachelor will be different
from the needs of an elderly retired couple. Therefore the retailers need to be clear
about the market that he is catering to as he cannot be everything to everybody.
Demographic factors
Demographic factors are unique to a person. It involves identification of who is
responsible for the decision making or buying and who is the ultimate consumer. All
stores have focused themselves on respective segments based on factors such as age,
income, family, size, gender, occupation, etc.

227
Psychological factors
Psychological factors refer to the inner aspects of an individual. An understanding of
consumer‟s psychology guides the retailers segmentation strategy consumers respond
differently towards the same retail marketing due to their respective motives,
personality, level of involvement and attitude.
Motives : motivation is prerequisite for any action which includes buying .it
stimulates the need
Perception: perception is the process by which consumers attach meaning to
incoming stimulate by forming mental pictures of persons, place and objects.
Stimulates reception is accomplished though the fire senses that is sight,
sound, taste, touch and smell. The consumer feels that what he/she sees hear,
feel , taste and small is what they get
Learning: learning is the process of acquiring knowledge through past
experience. When a consumer visits a store and the treatment he receives will
be criteria for repeat visits to the store. if the experience with the sales team
was good then the consumer may visit the store even if the goods are slightly
expensive.
Tree sampling/ treats are also ways of making the consumer learn about a
product and its attributes. A retailer must encourage a consumer to touch and
feel the product so that his visit could turn in to a buying experience. It‟s been
seen that most new format retailers have benefited on touch, feel, and
experience concept which results in real learning process.
Environmental factors: Environmental factors are both physical and social
factors. This includes physical objects (goods and outlets) spatial relationship
(location of shopping center and merchandising stores) and social factors
(reference groups and opinion leaders). The environmental factors influence
consumer attitude learning motives etc. which in turn influence affective and
cognitive responses and therefore shopping behavior and the individual.

228
Social class: social class is referred to as the classification of members of
society into a hurrah of distinct status and class. Social class is measured by
variables such as education occupation, wealth and ownership of assets.
Market research has established a link between social class and consumer
attitudes concerning shopping behavior. Middle class and higher sections of
society prefer to shop for grocery items once a month from a particular shop.
They usually prefer stores offering variety and range of choice perplex sectors
of society usually purchase on a daily bases. Social statues of an individual
play an important role even in determining the frequency of purchase. It‟s
been seen that majority of the middle class consumers prefer to buy vegetables
in the morning for their freshness despite the prices being on the higher side
on the contrary the louder end sections of the society prefer to buy at late
evening to get benefits of low prices
Lifestyle: lifestyle refers to an individual‟s way/style of living as determined
by his/her activities, interests and opinions. Lifestyle is considered to be
highly correlated with consumer‟s values and personality traits. An
individual‟s lifestyles is influenced by the social group be belongs to and his
occupation.
5.2.2 The Customer Decision Making Process
The need for a product or services starts generally at the time when the need for the
particular product or service is recognized. The need may be psychological or
fictional. Psychological needs are associated with personal satisfaction that the
customer may get from purchasing or using the product. The functional need is
directly related to the function of product. The functional need is directly related to
the function of product. Then comes a stage where consumers seek information about
the product and the place where he can make the purchase.
Therefore it is seen that in the world of relating consumer passes through five distinct
stages to complete his buying process which are as follows.

229
Figure 5.2
Customer’s decision making process
Depending on the criteria important to consumer he evaluates the various options
available and narrows down the choice to a few stores where he may make the
purchase. He also to make sure his buying decision may visit couple of stores
Stage: I Identification of need for the product or service
The buying process begins when the consumer becomes aware or realizes that
they have some unsatisfied needs. The unsatisfied need arises when the customers
desired level of satisfaction. The consumer through his previous life‟s experience
knows how well he can satisfy these unmet needs like hunger, thirst and shortage of
clothing.
Need recognition in most cases is straight forward when individuals find shortage of
something or goods required are of daily use. For example, there is no wheat/milk in
the kitchen. A need may be aroused by an external. Stimulus such as deserve to visit a
part of a store while purchasing other usual items.

230
Stage: II Information search
The 2nd
stage is gathering information on how to solve the problem is the consumer
look for the possible options to resolve the need in consideration. Information search
is a process where the prospective buyers examine their environment for appropriate
information to make a sound decision .this search may be external (from memory) or
external (through friends, family, published sources salespersons, and the internet) an
individual usually drives or acquires information from the sources namely internal
and external. Persons past experience accompanied with shopping exposure might
provide him with substantial guidelines to make the correct decision with the help of
his or her internal memory. Consumers invest time in information search in
preparation to the perceived risk associated with the particular purchase and
importance of purchase.
Stage: III Evaluation of alternatives
After information search for the required product the consumer is expected to take a
final decision on one of the choices. The search also helps the consumer to acquire
knowledge about the criterion to be used to evaluate the various alternatives involved
at the information stage. To justify this point in gurgoan some management students
in order tie find out best option enlisted the following restaurants for entering friends
a) Haldi ram
b) Nirulas
c) Mc Donald‟s
d) Pizza hut.
The alternatives which are actively considered during the consumer decision making
process constitute the individual‟s evoked set. The evoked set comprised retail outlets
already in the memory and distinctly added from the retail environment (i.e. mass
media, friend) with respect to a particular product purchase.
It is essential for all the retailers or marketers to ensure that their brand finds place in
the consideration set of the target segment retailers require an effective marketing

231
programme, especially in terms of their communication strategy in order to informed
position the store as per the needs of the target segment. At the same time retailers
need to revise its offering and attributes as per the changing preferences of their target
segment. After evaluating or rating various alternatives or importance attributes an
individual can shortlist the best possible retail outlet (an eating joint for taking his
friends out for a treat).
Stage: IV Purchase decision
After evaluating various alternatives an individual is in a position to focus on the
preferred product category, good retail outlet or brand. This followed by a purchase
decision by the consumer final choice from multiple alternatives leads to the purchase
stage or decision. This involves an exchange of cash or credit note for the ownership
or usage of offering. It is this purchase stage that generates revenue for the retailers
and the marketers in the value chain.
In the retailing content the purchase stage plays the most important role in consumer
decision making with regard to place of shopping. in the Indian context one can
obtain many products from multiple retail outlets or formats.
Stage V: Post Purchase Dissonance
After purchasing a particular good or service or visiting outlet consumers evaluate its
performance against their expected level of satisfaction on account of important
attributes.
Example: When a consumer visits a multiplex theatre he/she is expected to examine
the experience on account of sound effect, air conditioning efficiency, other consumer
behavior, etc.
This kind of evaluation is likely to lead to three possible outcomes:
1. Actual performance meets expectations leading to a neutral response. Hence
the individual may like to evaluate it further.

232
2. Performance exceeds expected levels, resulting in satisfaction. This may lead
to repeated purchase and positive word-of-mouth publicity.
3. Performance may fall short of the expectations, resulting in dissatisfaction.
This may lead to discontinuation of purchase of the particular good or from
the retail outlet.
Therefore in case of Post Purchase evaluation, the basic concern of the consumer is to
reassure himself that he or she has opted for the best available option from amongst
various alternatives. This helps the consumer to minimize the Post Purchase cognitive
dissonance.
5.2.3 Emerging Patterns in Organized Retailing in Relation to Consumer
Behavior
The patterns of organized retailing in India and their consequential reciprocal
relationship with consumer behavior can be observed through a deeper insight into the
Indian market there exists two type of shopping which analyses the consumer
behavior as mentioned below:
1. The hedonic shopping value differs across product categories and also in case
of consumables and durables.
2. Utilitarian shopping has started giving way to hedonic shopping'! With the
emergence of organized retailing. Yet, the majority still prefers utilitarian
shopping.
3. Add-on features in modem retail stores have an insignificant impact on actual
sales conversion, as majority of the consumers still prefer 'value for money'
while shopping.
4. Retail service quality has assumed the central role in shaping the consumers'
perception, sales conversion rate, and repeat sales and overall shopping
satisfaction.

233
5. Socio-cultural differences, coupled with other demographic and psychographic
factors, are influencing buying behavior and choice of the store even after the
emergence of egalitarian shopping malls.
5.3 Indian Retail Sector and Changing Consumer Behavior
The Indian retail sector is still predominantly unorganized. However, organized retail
units are fast emerging and becoming the preferred choice of consumers, especially in
urban areas. This development is attributed to a number of factors. Firstly, economic
liberalization has facilitated the entry of multinationals into the cash-and-carry
business and single brand retailing.
Multinational companies are also taking advantage of India's low-cost labor and raw
materials to make India a sourcing hub, as well as a market for their products.
Secondly, increasing income levels and a growing sense of brand consciousness
among India's middle and higher income groups have led to increased popularity of
organized retail units.
The changing consumer behavior is increasingly shaping organized retailing and is, in
turn, evolving with new found options and opportunities. On the socio-cultural side,
the growing number of nuclear families, general improvement in education levels and,
most importantly, continuous rise in women's economic independence through jobs,
as well as entrepreneurship, has made women play a more proactive role in shopping
for the family. This has led to an increasing number of customers availing of
convenience options such as super markets, where most of the shopping for daily
necessities can be done under one roof.
Changing income levels and occupation have resulted in a change in the consumer‟s
buying behavior. More urban women are seeking employment resulting in dual
income families. This results in more disposable income that in turn spawns
consumerism. Moreover, in households with working women there is greater work
pressure and increased commuting time resulting in adjustments being made to the
food habits (cooking vs. ready to eat) as well as clothing. The focus shifts to

234
convenience and comfort. The size and composition of the shopping basket has
changed over time. Today‟s consumers are looking for shopping convenience and
want to have all their requirements under one roof, coupled with speed in the retail
store operations. Due to time constraints, families are now looking for
„shoppertainment‟ – combining shopping with entertainment. This is one of the causes
of increased footfalls at malls with multiplexes.
As India moves into modern retailing with several changes with regard to its markets,
bands and consumers there are unique challenges that a multinational company
entering India has to cope up with, whether it is a fast moving consumer goods
(FMCG) company or a multinational retail chain like Tesco or Wal-Mart. There are
unique retailing aspects that need to be studied in detail by these companies. While
the world over the retail density (number of shops per 1000 consumers) is on the
decline, the retail density in India is on the increase. This is because of the fact that
small neighborhood shops called kirana shops about eleven million in India.
They have been a part of the Indian shopping culture for several decades and even
toady organized retailing (modern retail outlets) contribute just 2-3 percent of the
total retail sale in the country. Point of Purchase (POP) materials are used both by
kirana shops and by organized supermarket retail outlets. This study investigates the
impact of POP materials on kirana shop purchases and the purchases of consumers
from supermarkets. Given the importance of POP material on the purchase of FMCG
purchases, the authors feel that this study will be useful to bridge the gap between
theory and practice and will provide valuable insights to managers involved in
retailing.
Reciprocal Influence of Organized Retailing on Consumer Behavior
Consumer choices and preferences and overall consumer behavior have always played
an important role in shaping market trends and have thus influenced the evolution of
organized retailing in India. However, after reaching a specific stage of development,
organized retailing has also started influencing the way the consumers look at the
market, not only in terms of choice of products and services, but also in terms of the

235
overall shopping experience. Enhanced shopping experience, better packaging,
hygienic environment and value added services rendered by organized retail stores
have raised the expectations of even those consumers who frequent traditional kirana
stores. In response, many of the traditional stores in the unorganized sector have
reinvented themselves and adopted better practices in product packaging, visual
merchandizing and display, etc. In turn, many organized retailers are resorting to
selling below the maximum retail price, providing home delivery and implementing
loyalty programs, as strategies for survival.
While unorganized retailers have started reinventing themselves due to the inroads
made by organized retailers, the organized retailers on their part have realized the
importance of the personal touch provided by traditional kirana merchants and have
begun offering personalized services, trying to strike a lasting relationship with their
customers through membership cards, and intimation regarding bargain offers through
SMS, etc.
The dramatic changes in consumer behavior have necessitated made it imperative for
marketers to have in-depth knowledge about various dimensions which link retailing
and consumer behavior. For instance, McDonald's found that a sizeable percentage of
its customers decide about eating and the choice of restaurant at the last moment. It is,
therefore, opening small outlets in popular shopping areas and malls, in places with
high traffic density and at airports. It is also providing play areas to ensure that
families visit its outlets along with children.
McKinsey Global Institute, in association with the Indian Council for Research on
International Economic Relations (ICRIER), brought out a study report titled, "The
Bird of Gold, The Rise of India's Consumer Market". This study attempted to analyze
the rise of the Indian consumer market and its influence on consumer spending, their
buying behavior and the overall economic development of the country. ICRIER also
conducted a comprehensive study titled, "Impact of Organized Retailing on the
Unorganized Sector". This study brought out the emerging patterns of organized
retailing and identified the possible impact on consumers, intermediaries and
manufacturers. It also made some policy prescriptions in this regard. It can be

236
summarized that a precise understanding of consumer's choices and preferences is the
key to success in the changing milieu.
Redefining Retailing and Consumer Behavior
During recent years, the entire concept of retailing has been redefined in terms of both
its structure and also the fundamental changes in consumer behavior on account of
demographic, psychographic and socioeconomic factors. The changing pattern of
consumer behavior is influencing retailing in India, especially organized retailing. As
a matter of fact, personal and social factors such as needs, perceptions, attitudes,
interests, opinions, activities and lifestyles mostly influence consumer behavior in a
rapidly changing retail environment. Traditional demographic variables cannot
identify the complete characteristics of an evolutionary retail market, as consumers in
the same demographic group have diverse psychographic makeup. Therefore,
psychographic factors influencing consumer behavior have to be understood more
closely by organized retailers.
Today, retailing is much more than mere merchandising. It is about reflecting
customer desires and aspirations, and forging long-lasting relationships with them. As
the Indian consumers evolve, they expect much more each time they step into a store.
The concept of shopping has undergone a change in terms of format and consumer
buying behavior, ushering in a revolution in shopping. Retailing is going through a
transition, not only in India, but the world over. For a long time, the comer grocery
store was the only choice available to the consumer.
This has given way to international formats of retailing. The traditional food and
grocery segment has seen the emergence of supermarkets and grocery chains. The
non-food segment in organized retailing has extended itself into various formats and
categories where it has been largely successful.
The research showed that today‟s savvy consumers demand increasingly creative and
more importantly interactive strategies, to entice them into stores. Discovering what
makes consumers tick and buy from certain stores can perhaps be achieved by
returning to more traditional retail methods that allow the consumer to participate or

237
interactive with the seller on a more personal level or implement new technology that
streamlines the purchasing process as smooth and painless as possible.
Staffing is also an area that can make or break consumers‟ retail experiences.
Obtaining the right balance between being overbearing and non-existent staff is
difficult but vital to creating a good store image and something that consumers
believe is still not being got right. Personal service and not being held in a queue is
something that we have gotten used to on the internet. Self-service options, which are
becoming standard in many of the major supermarkets, go somewhere toward
achieving this.
Influence of situational variables on shopping behavior
A shopping situation is a particular act of Buying Behaviour occurring at a specific
point in space and time. This can be explained with the help of following examples:
A customer seeking service at the Lakme beauty parlours – these parlours are open to
customers on all the seven days of a week, from 10 am to around 7 pm, in the midst of
soft lights while the strains of sarange and sarod soothe the customers frayed nerves
which is simply a behavior setting. The situation serves as an interface between the
person (salon consumer) and the stimulates object (beauty treatment such as facial
pedicure etc) and all those factors defining that interface constituting situational
variables.
Situational variables refers to all those factors particular to a time and place of
observation which do not follow from a knowledge of personal (intra-individual) and
stimulus (choice alternatives) attributes.
These attributes range from store location and layout to time of day and the presence
or absence of others.
These are classified into four distinct dimensions of situational influence.

238
Figure 5.3
Dimensions of Situational Influence
1. Physical Setting: The physical setting covers geographical location of the retail
but might equally be seen in terms of the environment in which the consumer
reads a catalogue or access a shopping centre and a particular store.
Shoppers are categorized in the following manner:
1. The shoppers who travel for half an hour or more are considered – Far
shoppers.
2. The shoppers who travel for less than half an hour are considered – near
shoppers.
3. The shoppers who usually shop before 3 pm are designated as – early
shoppers.
4. The shoppers who usually shop after 3 pm are designated as – late shoppers.
It is also seen that there is influences on consumer behavior resulting from
environmental conditions such as weather or climate, placement of merchandise,
access to information in a store and background music or color scheme.
2. Social Setting: The social setting describes the presence or absence of others
together with their social role attributes and opportunities for interaction.
Therefore it encapsulates everything – security staff in the shopping centre or

239
store, opportunities for interaction with sales staff, friends or relatives
accompanying the consumer on the shopping trip and even to proximity of other
customer present in the store or service scope. The shoppers who are accompanied
by other people are considerate to be social shoppers; those who are
unaccompanied are designated solitary shoppers.
3. Temporal Aspects: Temporal aspects are very important elements that affect the
situational variables. Time of day and constraints upon time available for
shopping are variables with very obvious effects on buyer behavior.
For example: Milk is purchased from vendor or retail outlets by most of the
people in India in morning hours or evening hours.
Women prefer shopping in post lunch hours after attending to their children and
returning before the rest of the family reaches home.
They‟re taking into consideration the above factors, the retailers open their shops
in accordance to shopping hours of their target segments. Shoppers who spent
hours less than an hour was considered were considered to be “quick shoppers”
and those who spent more than one hour or more were designated as “slow
shoppers”.
4. Task Definition: Task definition is more individual specific and encompasses
cognitive and motivational indications of the shopping situation, effectively
capturing situational influences on the task definition, information search and
evaluation stages depicted in traditional consumer decision making models. The
difference in the degree of information processing behavior varies for practical or
hedonistic products, products for self consumption versus gift purchases for others
etc.
Therefore the sound understanding and importance that is given to the influence of
situational variables in devising the retail marketing mix will ensure the effective and
profitable output to the retailers. It is also seen that the consumer image of a retail
outlet plays an important role in determining the nature of shopping behavior, it is

240
also important to understand the factors that affect the image formation of retail store
along with the process of its formation.
5.4 Retail Customer Behavior and Role of Services in Retailing
In marketing there exists both the customer and the shopper. Customer is someone
who buys from the retailers and the shoppers are the ones who buy from the retailer.
Example: Window shoppers who spend time in the retail outlets just looking at the
products but with or without any real intention for buying.
It‟s a belief that consumer has time constraints and therefore wants everything at his
disposal and in spite of internal making inroads in the shift of shopping behavior but
majority of the consumers still prefers to purchase through stores.
Stores remain popular because of the following basic reasons:
1. Need to touch and feel the product prior to buying
2. It allows social interaction and the opportunity to compare brands at one place.
3. It initiates impulse buying by the look and physical feel of the product such as
chocolates snacks and
4. Consumers also look for ambience and convenience in shopping.
5. Customer‟s money drives the economy and retail is where consumers spend
their money such as in boutiques, restaurants discounts stores and e tailors.
6. Consumer shopping behavior can be understood analyzing factors such as
demographic, psychological or the lifestyle of the consumer.
Retailers are required to have better understanding of consumer benefits their
perceptions and attitudes and how they influence the development of successful retail
marketing strategies. Effective retailing requires an appreciation of the buying
behavior of consumer.

241
It‟s important that retailers must understand their consumers better so that they can
both respond to and anticipate their needs proactively.
The following are some major criteria for the right approach to a customer‟s
requirements:
1. Creating the right environment.
2. Listening to customers
3. Providing rewards to frequent buyers.
4. Realizing the lifetime value of a customer and ensuring loyalty. The concept
of life time value customers is employed in relationship building and
marketing.
5.5 Theories of Consumer Behavior
The most fruitful approach to an understanding of retail demand is to identify and
evaluate the broader theories of consumer behavior linked to purchase behavior. The
discipline of consumer behavior has borrowed a range of concepts from the
quantitative and behavioural sciences in order to generate integrated models of action.
Theories can only be assessed on the contribution they make to our understanding of
the purchase process.
Models of behavior are useful means of organizing dispatch bodies of knowledge
regarding social action on somewhat arbitrary yet plausible process of intervening
psychological, social economic and behavioral variables. The early models were;
1. The Engel-Kollat Blackwell (EKB) model (1986)
2. Howlard and Sheth (1969)
3. Nicosia (1966)
These models can be found to share several commonalities:

242
1. They all exhibit consumer behavior as a decision process.
2. They provide a comprehensive model for focusing mainly on the behavior of
the individual consumer.
3. They share the belief that behavior is rational and hence can in principle be
explained.
4. They view buying behavior as purposive, with the consumer as an active
information seeker- both of information stored internally and of information
available in the external environment. Thus the search and evaluation of
information is a key component of the decision process.
5. They believe that consumers limit the amount of information taken in and
more over time from general notions to more specific criteria and preference
for alternatives.
6. They all include a notion of feedback that is outcomes from purchases will
affect future purchases.
I. The Engel-Kollat-Blackwell (EKB) model
The Engel-Kollat-Blackwell (EKB) model has been widely referenced and is
acknowledged as one of the most comprehensive explanations of consumer behavior.
The original model has undergone three major revisions since 1968 and the current
model. While retaining some of the fundamentals has become more sophisticated in
definitional and explanatory aspects and therefore varies from the original version.
The EKB model takes a broad view, incorporating inputs such as perception and
learning. A key feature of the EKB model is its incorporation of the differences
between high and low involvement as part of the buying process.
High involvement is normally present in the decision making process when the
perceived risk in the purchase is high. This element of risk is higher when the
consumer is unsure about the outcome of his or her purchase decision. This arises
when:

243
a. Information is limited
b. The buyer has low confidence.
c. The price relative to income is high
This has obvious connections to demand Engel, Blackwell and Miniard (EBM) in
1986 stated that limited problem solving (LPS) activity takes place when there is little
perceived risk that a wrong decision will be made.
The EKB model has the decision process as pathways of convergence passing through
various stages of processing prior to any choice being made.
II. Sheth’s family model of behavior
The Purchase decision process quite often is investigated in terms of the individual. It
is clear that for the purchase of high price items the decision process involves a high
level of risk that the decision may be a poor one. It also often involves the preference
resolution of more than one individual. This creates a complex situation whereby,
more often than not, the purchase has to satisfy the divergent needs of the group.
Within the theory of family buying behavior there is a concept of role structure, that is
among individual members of the family takes on roles such that collecting
information, deciding on the available budget etc. the family can make any ways its
final decision but it has to be realized that the dealing is with a homogenous unit, but
with a collection of individuals with different roles, needs modules and interest.
The Sheth model of the family decision process provides one of the few examples of
an attempt to replicate the behavior of group decision making. There exists a problem
with Sheth model and that is every aspect of search modules, believes and
prepositions occurs in tandem with each member of the group prior to their being a
resolution of the group to a final decision and thereby a joint or autonomous outcomes
occur.

244
5.6 Primary Survey of Consumer Behavior
Indian consumer markets are becoming increasingly complex and competitive. The
internationally known brands, modern retail outlets, and increasingly discerning
consumers have made the markets very sophisticated. Demands for goods and
services are changing very rapidly these days. The higher income, socio-economic
changes, and the growing national population are the most important trends that will
affecting the market in this decade. Also, consumer life styles and preferences are
changing, which have created a wide diversity of consumer demand. With these
changes, retailers will have to redefine their marketing strategies in order to compete
and preserve market share. Consumers are now exposed not only to higher levels of
information about the offerings of competing supermarkets, but they are also faced
with a larger number of choices from which to pick out their “best buy”. Therefore, it
is necessary for the retailers of supermarkets to know about consumers‟ choice
processes and to understand the major determinants of store patronage. The primary
question before the retailer is: How do consumers make store choice decisions? A
retailer‟s success is said to be tied to his focus in customers. Retailers need to
understand which factors influence the customers to purchase in their stores. They
must give these customers a legitimate reason to shop in one particular store over
another, and one of the ways to do this is to look at the customer‟s needs and wants.
Retailers need to examine such basics as what they offer the customers in the way of
time, service, selection, quality, value and confidence. A deluge of research reports
and diverse data appearing on the changing consumer behavior in globalised India in
newspaper, magazines, journals and also the views of various academicians have been
expressed in various seminars and conferences. This raised a curiosity in the mind of
the researcher to study the volatile consumer behavior. The researcher selected
Mumbai region because of the rapidly changing face of the urban market,
mushrooming of malls in this metropolitan city, the researcher also understood the
fact that changes take place first in Mumbai being a commercial capital of India.
Retail executives are increasingly aware of the diversity in the patterns of shopping
behavior among consumers. This diversity has been accompanied by a shift in the
channel power relationships in the distribution of goods and services. Both the

245
diversity in the pattern of shopping behavior and the power shift has encouraged
researchers to focus more attention on patronage behavior in an effort to understand
the consumer better.
The study basically focuses on the organized retail outlets and its impact on the
consumer behavior. The term consumer behavior has wide connotations and the study
covered broad areas related to consumer‟s perception, consumer‟s preference their
buying behavior etc. The researcher in order to find out this targeted few categories
such as age status, marital status, employment status and gender. The main objective
was to find out the changing consumer behavior their familiarity with regards to
organized retail outlets and the impact of these outlets on their budget and on the
unorganized retail outlets. Since Mumbai metropolitan city has a huge population
therefore the researcher took limited sample size of the population. The researcher in
spite of taking limited sample size tried to show the necessary impact on consumer
behavior in the near future.
Profile of the respondents
The total number of respondents selected was seven hundred twenty three for the
entire Mumbai region. The detail of the sample is as below which is distributed age
wise.
Employment status of the respondents
The researcher made an attempt to ascertain the employment status of the respondents
first. A total of four categories were made, namely, business, service, self
employment (which included people associated with professions like health and
beauty parlors classes) none employed, this category mainly included housewives and
students. Since the researcher selected the sample on random basis, it became
essential to ascertain the employment status and on the basis of which the responses
of the respondents could be categorized.

246
Table 5.2
Employment Status of the respondents
Sr.No. Categories Respondents Percent
1 Self Employed 62 8.6
2 Service 331 45.8
3 Business 64 8.9
4 Retired 51 7.1
5 Not Employed Currently 169 23.4
6 Housewife 46 6.4
Source: Compiled from Primary data.
Graph 5.2
Employment Status of the respondents
Table 5.2 and Graph 5.2 give a clear indication of the category of population residing
in Mumbai. Out of the 723 respondents it‟s been found that maximum population
belongs to the service class, sixty two belongs to the self employed group sixty four
belongs to the business class and further there has been evoked a category who are not
employed currently with forty six respondents . This category mainly consisted
children and housewives. Therefore it could be seen that it is service class employees
with regular monthly income who gets influential with organized retail outlets.

247
Profile according to the Annual Income of the respondents
Another area that was keen to study by the researcher was that annual family income
of the people. This was divided in the ranges, from Rs. one lakh to Rs. ten lakh and
above as given in the table. The researcher conducted this study to understand the
category of people visiting the organized outlets in Mumbai.
Table 5.3
Annual Income of the respondents
Source: Compiled from Primary data.
Sr.No. Categories Respondents Percent
1 1-3 Lakh 289 40.0
2 3-5 178 24.6
3 5-7 74 10.2
4 7-9 49 6.8
5 10 & above 133 18.4
Total 723 100.0

248
Graph 5.3
Annual Income of the respondents
Table 5.3 and Graph 5.3 project information about annual income of the respondent.
Since maximum population belong to salaried class and followed by a combination of
self employed and business class it has been seen that there is a tilt between one and
five lakh there also has been an increase in the income range from ten lakh and above
with one hundred thirty three respondents falling into the category.
Visit to Organized Retail Outlets
The researcher in order to understand the shift in consumer behavior was keen in
knowing their visit to the organized retail outlets. In order to get a clear view the
researcher further divided it in the categories of age, marital status, gender and
annual family income. The results found gave an interesting scenario of the Mumbai
based consumers.

249
Table 5.4
Visit to Organized retail outlets as per age group
Sr.No Age Number of Respondent
yes No
1 15-25 264 104
2 25-35 165 28
3 35-45 86 7
4 45-55 52 5
5 > 55 7 5
Total 574 149
Source: Compiled from Primary data.
Graph 5.4
Visit to Organized retail outlets as per age group
Table 5.4 and Graph 5.4 give a clear view of the respondent belonging to the different
age group visiting to organized retail outlets. The researcher was keen in knowing the
age group who visit the organized retail outlets maximum. The results put up gives a
clear view that 264 respondent of the age group 15-25 165 respondent of the age
group 25-35 and 86 respondents of the age group 35-45 visit the organized retail

250
outlets the maximum stating that it is the teenagers and the young adults who prefer
organized retail outlets the maximum. Further the senior citizens with 7 respondents
still prefer to visit the traditional outlets. Therefore it is seen from the research that
gradually the organized retail outlets have started pulling the maximum population
resulting in changing consumer behavior.
Table 5.5
Visit to Organized retail outlets as per Gender
Source: Compiled from Primary data.
Graph 5.5
Visit to Organized retail outlets as per Gender
Sr.No Response Details Sex Total
Male Female Male
1. Yes Total
Respondents 260 314 260
2. No Total
Respondents 109 40 109
Total
Respondents 369 354 369

251
Table 5.5 and Graph 5.5 give a clear view of the respondents visiting to organized
retail outlets. The results put up gives a clear view of the respondent belonging to the
different age group weather married or male or female and earning any annual income
of family. On being asked about their visits to organized retail outlets it was absorbed
that a total of 79 percent of respondents gave an affirmative reply of their visit and the
21 percent gave a negative reply this shows that the visiting population outnumbered
the non visitors. Further it is also seen from the research that gradually the organized
retail outlets have started pulling the maximum population resulting in changing
consumer behavior.
Table 5.6
Visit to Organized retail outlets as per Annual Family Income
Sr.
No.
Response Details
Annual Family Income
Total % 1-3 Lakh 3-5 Lakh 5-7 Lakh 7-9 Lakh 10 & above
1 Yes Respondents 77% 62% 89% 92% 97% 79%
2 No Respondents 23% 38% 11% 8% 3% 21%
Source: Compiled from Primary data.
Graph 5.6
Visit to Organized retail outlets as per Annual Family Income

252
Table 5.6 and Graph 5.6 give a clear view of the respondents visiting to organized
retail outlets. The results put up gives a clear view of the respondent belonging to the
different age group weather married or male or female and earning any annual income
of family. On being asked about their visits to organized retail outlets it was absorbed
that a total of 79 percent of respondents gave an affirmative reply of their visit and the
21 percent gave a negative reply this shows that the visiting population outnumbered
the non visitors. Further it is also seen from the research that gradually the organized
retail outlets have started pulling the maximum population resulting in changing
consumer behavior.
Frequency of Visit to Organized Retail Outlets
Seven hundred twenty three respondents from different suburbs of Mumbai were
selected for the purpose of data collection. The research was divided into various
categories and the researcher basically concentrated on marital status wise. To
understand the changing behavior of consumers it is very much important to analyze
the frequency of their visits. The results are put up in tabular form below.
Table 5.7
Visit to Organized Retail Outlets as per Marital Status
Source: Compiled from Primary data.
Sr.No Frequency of the
Visit
Marital Status
Total Married Unmarried
1 Daily Total Respondents 6 27 33
2 3-4/week Total Respondents 9 18 27
3 Weekly Total Respondents 91 93 184
4 1-2/month Total Respondents 120 144 264
5 Occasionally Total Respondents 26 40 66
Total 252 322 574

253
Graph 5.7
Visits to Organized Retail Outlets as per Marital Status
From the Table 5.7 and graph 5.7 it is pertinent that it is unmarried people who visit
the malls more with three hundred twenty two respondents visiting .Further a deep
survey showed that the frequency varied but all of them visited the organized outlets.
27 percent respondent visited daily, 18 visited in three to four weeks 29 percent
visiting weekly 45 percent visiting in one to two months and forty percent visiting
occasionally. The respondents also gave the list of most chosen destination by them
which were only the preferences they included:
i. Globus, ii) Inorbit Mall, iii) Growells iv) V Mall v) Shoppers Stop vi)
Nirmal Lifestyle vii) The Hub viii) Megha Mall ix) Lifestyle.
Products preferred
Malls basically termed as Multi Brand Outlets. The organized retail outlets are very
much popular in Mumbai because of the fact that they offer variety of choices and
again they provide a unique experience of see feel touch and posses. The shops in
these outlets have unique blend of various merchandise which include basic, comfort,
lifestyle branded and unbranded therefore the researcher made an attempt to find out
the preferences of Mumbai based on consumers and this throws a light on the shift of
behavior of consumers.
254
Table 5.8
Products Preferred
Source: Compiled from Primary data.
Graph 5.8
Products Preferred
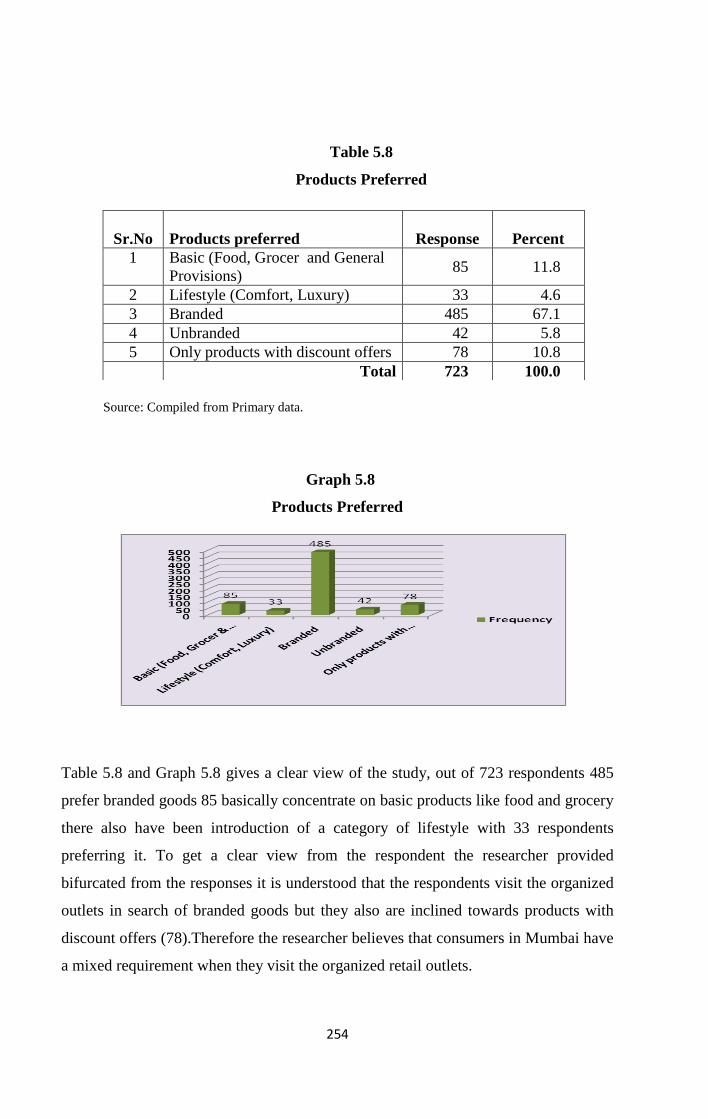
Table 5.8 and Graph 5.8 gives a clear view of the study, out of 723 respondents 485
prefer branded goods 85 basically concentrate on basic products like food and grocery
there also have been introduction of a category of lifestyle with 33 respondents
preferring it. To get a clear view from the respondent the researcher provided
bifurcated from the responses it is understood that the respondents visit the organized
outlets in search of branded goods but they also are inclined towards products with
discount offers (78).Therefore the researcher believes that consumers in Mumbai have
a mixed requirement when they visit the organized retail outlets.
Sr.No
Products preferred Response Percent
1 Basic (Food, Grocer and General
Provisions) 85 11.8
2 Lifestyle (Comfort, Luxury) 33 4.6
3 Branded 485 67.1
4 Unbranded 42 5.8
5 Only products with discount offers 78 10.8
Total 723 100.0

255
Table 5.9
Products Preferred as per Age
Sr.
No.
Products Preferred Age
Total 15-25 25-35 35-45 45-55 > 55
1 Basic (Food, Grocer
and General Provisions) 43 34 6 2 0 85
2 Lifestyle (Comfort,
Luxury) 19 7 4 2 1 33
3 Branded 230 132 68 48 7 485
4 Unbranded 41 1 0 0 0 42
5 Only products with
discount offers 35 19 15 5 4 78
Total 368 193 93 57 12 723
Source: Compiled from Primary data.
Graph 5.9
Products Preferred as per Age
The respondent tried to find out the type of products purchased by the consumers of
different age groups which are put up below.

256
Table 5.9 and Graph 5.9 throws light on the information about the product preference
by the different age groups. The detailed analysis shows that consumers of all the age
group prefer branded goods. The proportion is very high in the young age group of
15-25 with 230 respondents preferring branded followed by age group 25-35 with 132
respondents. Therefore the analysis shows that according to the young generation
perception it is organized retail outlets where branded goods are sold because as seen
in the earlier table the young generation visit organized outlets.
Table 5.10
Products preferred as per Annual Family Income
Source: Compiled from Primary data.
Sr.
No.
Annual Family Income
Total
1-3
Lakh
3-5
Lakh
5-7
Lakh
7-9
Lakh
10 &
above
1
Basic (Food, Grocer
and General
Provisions)
Total
Respondents 43 34 4 3 1 85
2
Lifestyle (Comfort,
Luxury) Total
Respondents 13 14 2 1 3 33
3 Branded Total
Respondents 159 115 61 39 111 485
4 Unbranded Total
Respondents 41 1 0 0 0 42
5
Only products with
discount offers Total
Respondents 33 14 7 6 18 78
Total 289 178 74 49 133 723

257
Graph 5.10
Products preferred as per Annual Family Income
The respondent tried to find out the type of products purchased by the consumers of
different age groups which are put up below.
Table 5.10 and graph 5.10 throws light on the information about the product
preference as per the Annual family Income. The detailed analysis shows that
consumers belonging to any income group prefer branded goods. The proportion is
very high in the income range of 1-3 lakh with 289 respondents opting for organized
retail outlets for purchasing basic (food grocery and general provisions) with 43
respondents, lifestyle goods with 13 respondents and with 159 respondents for
branded goods. It is also seen that 485 respondents belonging to any income range
prefer to go to organized outlets basically for branded goods. This shows that in
Mumbai no matter to which income group the respondent belongs to but for opting
branded goods they go to organized outlets.
The researcher was keen in knowing the preference of married and unmarried
respondents in buying the products. There was a belief that it is unmarried who visit
more to the organized outlets. To understand this analysis was done and the compiled
data is put in a tabular form below.

258
Table 5.11
Products preferred as per Marital Status
Source: Compiled from Primary data.
Graph 5.11
Products preferred as per Marital Status
Table 5.11 and Graph 5.11, shows that out of 723 respondents, it is 286 married and
437 unmarried respondents who visit malls for fulfillment of their requirement.
Further it is also seen that both married and unmarried prefer branded goods but it is
Sr.
No.
Types of Products
Preferred
Marital Status
Total
Married Unmarried
1 Basic (Food, Grocer and
General Provisions)
Total Respondents 33 52 85
2 Lifestyle (Comfort,
Luxury)
Total Respondents 9 24 33
3 Branded Total Respondents 208 277 485
4 Unbranded Total Respondents 0 42 42
5 Only products with
discount offers
Total Respondents 36 42 78
Total 286 437 723

259
unmarried respondents (277) who visit malls with an intention to purchase branded
goods.
Therefore the researcher believes that organized outlets offer number of options to the
consumers to make choices. Consumers also prefer visiting these outlets because here
they not only get goods of their choice but they can touch feel and also see and
thereby giving them a unique experience. The researcher tried to explore this fact and
find out the result.
Impact of Organized Outlets on Budgetary Spending
There has been an assumption that growth of organized retail outlets have increased a
impact on the budget of the consumers visiting them to find out this the researcher
framed a question asking the respondents randomly about the impact these outlets
have created on their monthly budgets and to analyze the researcher conducted study
under two categories employment status and annual family income.
Table 5.12
Impact on Budgetary Spending as per Employment Status
Sr.
No.
Response Employment Status Total
Self
Employed Service Business Retired
Not Employed
Currently Housewife
1 Yes, Higher
spending 28 162 36 8 95 31 360
2 Yes, Lower
spending 15 65 6 1 51 13 151
3 No 19 104 22 42 23 2 212
Total 62 331 64 51 169 46 723
Source: Compiled from Primary data.
260
Graph 5.12
Impact on Budgetary Spending as per Employment Status
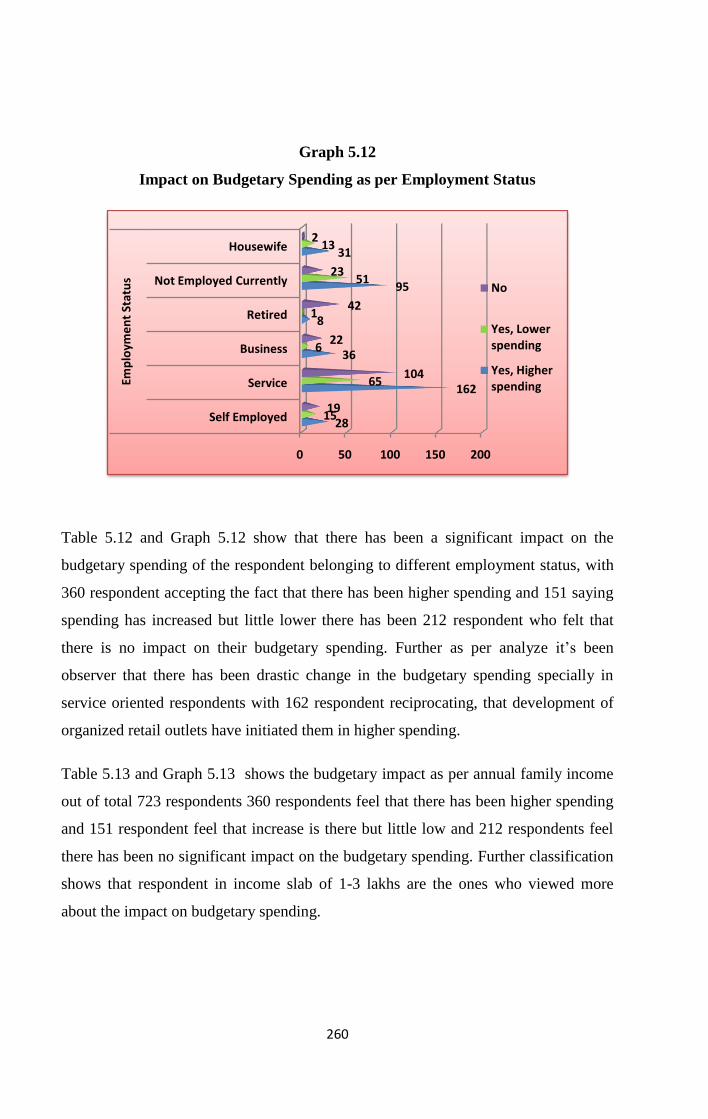
Table 5.12 and Graph 5.12 show that there has been a significant impact on the
budgetary spending of the respondent belonging to different employment status, with
360 respondent accepting the fact that there has been higher spending and 151 saying
spending has increased but little lower there has been 212 respondent who felt that
there is no impact on their budgetary spending. Further as per analyze it‟s been
observer that there has been drastic change in the budgetary spending specially in
service oriented respondents with 162 respondent reciprocating, that development of
organized retail outlets have initiated them in higher spending.
Table 5.13 and Graph 5.13 shows the budgetary impact as per annual family income
out of total 723 respondents 360 respondents feel that there has been higher spending
and 151 respondent feel that increase is there but little low and 212 respondents feel
there has been no significant impact on the budgetary spending. Further classification
shows that respondent in income slab of 1-3 lakhs are the ones who viewed more
about the impact on budgetary spending.
0 50 100 150 200
Self Employed
Service
Business
Retired
Not Employed Currently
Housewife
Emp
loym
en
t St
atu
s
28
162
36
8
95
31
15
65
6
1
51
13
19
104
22
42
23
2
No
Yes, Lower spending
Yes, Higher spending

261
Table 5.13
Impact on Budgetary Spending as per Annual Family Income
Source: Compiled from Primary data.
Graph 5.13
Impact on Budgetary Spending as per Annual Family Income
Preference of visit to organized retail outlets than unorganized retail outlets
There has been long debate on the popularity of both the retail outlets and also to
know which outlets the consumers prefer to visit the more. The researcher in order to
find out the preferences of the respondents between organized and unorganized tried
to ask certain questions. The main objective was to understand the shift in their
Sr.
No.
Details
frequency of
visits
Annual Family Income Total
1-3 Lakh 3-5 Lakh 5-7 Lakh 7-9 Lakh 10 & above
1 Yes, Higher
spending 114 69 42 31 104 360
2 Yes, Lower
spending 74 28 18 6 25 151
3 No 101 81 14 12 4 212
Total 289 178 74 49 133 723

262
behavior after the development of these outlets. The replies gave a clear idea about
the trends that will be followed in the future. The researcher categorized two basic
areas (Gender wise and age wise) to know the preference.
Table 5.14
Preference of visit to organized retail outlets than unorganized retail outlets as
per Gender
Source: Compiled from Primary data.
Graph 5.14
Preference of visit to organized retail outlets than unorganized retail outlets as
per Gender
An attempt was made by the researcher to understand the preferences made by the
respondents as per gender Table 5.14 and Graph 5.14 shows that in all 723
respondents were surveyed and 498 respondent gave an affirmative response of
visiting the organized retail outlets further analysation showed that the female
Sr.No Preference Sex
Total Male Female
1 Yes Total Respondents 237 261 498
2 No Total Respondents 132 93 225
Total 369 354 723

263
population in Mumbai are more inclined towards organized outlets with 261
respondents confirming yes as their visit and 237 male respondents confirming of
their visit. It was also seen that about 225 respondents, denied their visits to organized
outlets and in this category it was male population with 132 respondents who
outnumbered female population with 93 numbers.
Table 5.15
Frequency of the Visit as per Gender Wise
Source: Compiled from Primary data.
Graph 5.15
Frequency of the Visit as per Gender Wise
Graph 5.15
Sr.No. Frequency of
visit
Sex
Total Male Female
1 Up to 25% Total Respondents 47 71 118
2 Up to 50% Total Respondents 129 115 244
3 Up to 75% Total Respondents 52 72 124
4 Up to 100% Total Respondents 9 3 12
Total 237 261 498

264
The researcher was keen in knowing the frequency of the visits made by the
respondents, Table 5.15 and Graph 5.15 shows the results, when both male and
female respondents were questioned about their frequency of visit around 244
respondents confirmed it to be about 50 percent with male (129 ) outnumbered female
(115). Further 124 respondent confirmed their frequency up to 75 percent in this
category it was female (72) who outnumbered male (52). This analysis made by the
researcher therefore shows that with the development of malls in Mumbai region the
frequency of visits by both male and female have increased.
Table 5.16
Preference of visit to organized retail outlets as per Age
Source: Compiled from Primary data.
Sr.No. Preference Age
Total 15-25 25-35 35-45 45-55 > 55
1 Yes Total
Respondents 224 149 79 39 7 498
2 No Total
Respondents 144 44 14 18 5 225
Total 368 193 93 57 12 723
100% 100% 100% 100% 100% 100%

265
Graph 5.16
Preference of visit to organized retail outlets as per Age
The researcher further made an attempt to understand the preferences made by the
respondents as per age Table 5.16 and Graph 5.16 shows that in all 723 respondents
were surveyed and 498 respondent gave an affirmative response of visiting the
organized retail outlets it has also been absorbed that respondents of all the age group
are inclined towards organized retail outlets but the young respondents in the age
bracket 15 to 25 (224) and 25 to 35 (149) are maximum who visit the outlets and
respondents above the age bracket 55(7) hardly do visit the outlets, this shows the
Mumbai with young generation is slowly moving towards change. It was also seen
that about 225 respondent, denied their visits to organized outlets and in this category
with the consumers in age bracket of 15-25 (144) outnumbering the list.

266
Table 5.17
Frequency of the Visit as per Age Wise
Sr.
No.
Frequency
of visit
Age Total
15-25 25-35 35-45 45-55 > 55
1 Up to
25%
Total
Respondents
77 30 5 6 0 118
2 Up to
50%
Total
Respondents
100 74 40 26 4 244
3 Up to
75%
Total
Respondents
41 43 31 7 2 124
4 Up to
100%
Total
Respondents
6 2 3 0 1 12
Total 224 149 79 39 7 498
Source: Compiled from Primary data.
Graph 5.17
Frequency of the Visit as per Age Wise

267
Table 5.17 and Graph 5.17 shows the results of survey, when the respondents were
questioned about their frequency of visit around 244 respondents belonging to
different age group confirmed it to be about 50 percent with maximum respondents
being in the age bracket of 15-25 (100), 25-35 (74), 35-45 (40) and 45-55(26) and the
lowest being respondent in the age bracket of above 55 (4).Further the response has
been move of the respondents in the age brackets of 15-25 (218) and 25-35 (147), this
shows that Mumbai has the young generation who are the reason for this change.
Change in Buying Behavior due organized retail outlets
There was requirement to understand the change in the consumer behavior due to the
setting of the organized retail outlets. The researcher also was keen in knowing the
impact created by these outlets in a city like Mumbai that keeps accepting the changes
gracefully. To understand this researcher concentrated on one category basically
namely gender wise and while doing so she tried to find out the frequency also.
Table 5.18
Change in Buying Behaviour as per Gender
Sr.No. Response Sex
Total Male Female
Yes, very much Total Respondents 207 93 300
Yes, to some extent Total Respondents 138 232 370
No not at all Total Respondents 24 29 53
369 354 723
Source: Compiled from Primary data.

268
Graph 5.18
Change in Buying Behaviour as per Gender
Table 5.18 and Graph 5.18 give a clear analization of the changing buying habit of
consumers. Total 300 respondents were of the opinion that due to organized retail
outlets their behavior has changed very much with male respondents (207)
outnumbering female respondents (93). Further 370 respondents were of the opinion
that their behavior has changed but to some extent with female respondents (232)
being more than male (138). Around 53 respondents were of the opinion that their
behavior is stable and there has been no change.
Table 5.19
Frequency in Change in Buying Behaviour as per Gender
Sr.No Response Sex
Total Male Female
1 25% Total Respondents 144 95 239
2 50% Total Respondents 148 185 333
3 75% Total Respondents 47 45 92
4 100% Total Respondents 6 0 6
Total 345 325 670
Source: Compiled from Primary data.

269
Graph 5.19
Frequency in Change in Buying Behaviour as per Gender
Table 5.19 and Graph 5.19 give the frequency of the changing behavior. The
respondents agreed that this shift in the buying behavior is due to the offers and
facilities being given by them. The researcher also tried to find the frequency in this
change in behavior the result is with 333 respondents responding to 50 percent with
male (148) and female (185). The result also showed that there are few respondents
numbering to 53 who felt that the development of these organized retail outlets have
not changed their buying behavior.
Changes in Buying Behavior
Organised retail outlets resulting in Impulsive Purchases
There is a general assumption that the malls attract people and even when they
go for window shopping they end up in making impulsive purchases. The
researcher therefore wanted to test this on the basis of the following
parameters and categories. Since the researcher wanted to have a clear idea
about the impulsive purchases with respect to annual family income and age
group wise.

270
Table 5.20
Impulsive purchases in Organised Retail Outlets as per Annual Family Income
Source: Compiled from Primary data.
Graph 5.20
Impulsive purchases in Organised Retail Outlets as per Annual Family Income
Sr
No
Annual Family Income
Total 1-3 Lakh
3-5
Lakh
5-7
Lakh
7-9
Lakh
10 &
above
1 Strongly
Agree
Total
Respondents 49 13 7 5 7 81
2 Agree Total
Respondents 135 124 25 18 21 323
3 Disagree Total
Respondents 74 30 21 15 48 188
4 Strongly
Disagree
Total
Respondents 31 11 21 11 57 131
Total 289 178 74 49 133 723
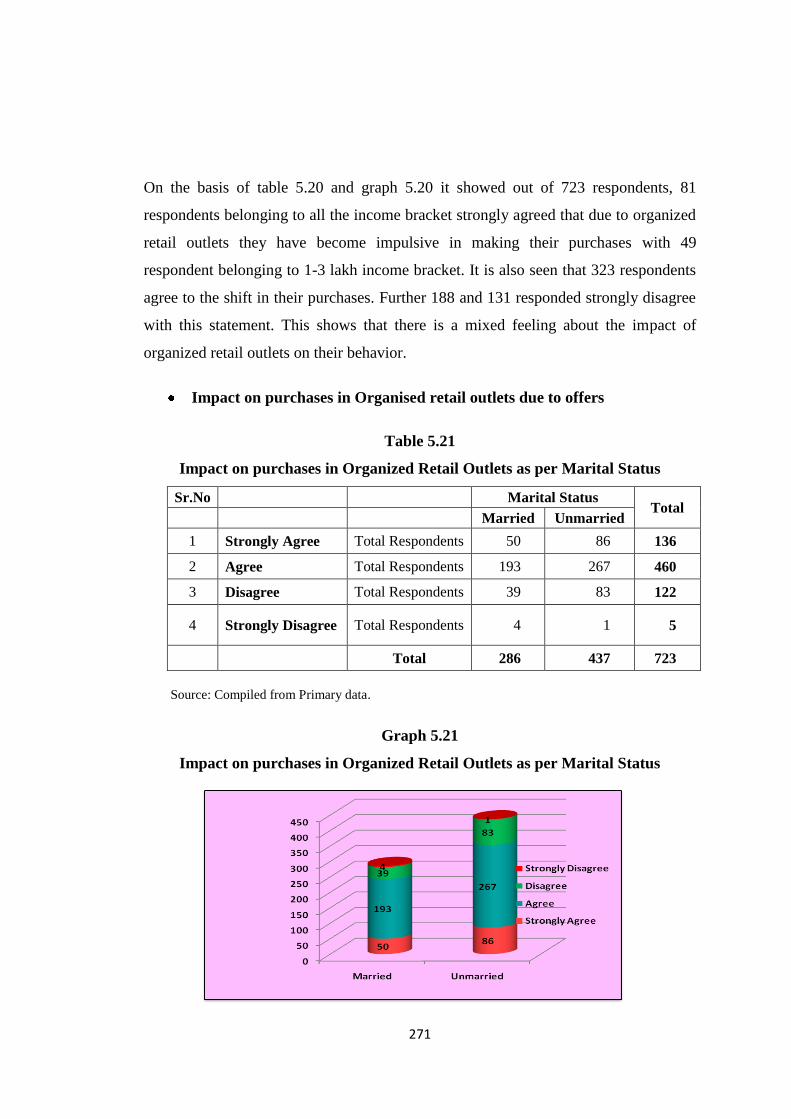
271
On the basis of table 5.20 and graph 5.20 it showed out of 723 respondents, 81
respondents belonging to all the income bracket strongly agreed that due to organized
retail outlets they have become impulsive in making their purchases with 49
respondent belonging to 1-3 lakh income bracket. It is also seen that 323 respondents
agree to the shift in their purchases. Further 188 and 131 responded strongly disagree
with this statement. This shows that there is a mixed feeling about the impact of
organized retail outlets on their behavior.
Impact on purchases in Organised retail outlets due to offers
Table 5.21
Impact on purchases in Organized Retail Outlets as per Marital Status
Sr.No Marital Status Total
Married Unmarried
1 Strongly Agree Total Respondents 50 86 136
2 Agree Total Respondents 193 267 460
3 Disagree Total Respondents 39 83 122
4 Strongly Disagree Total Respondents 4 1 5
Total 286 437 723
Source: Compiled from Primary data.
Graph 5.21
Impact on purchases in Organized Retail Outlets as per Marital Status
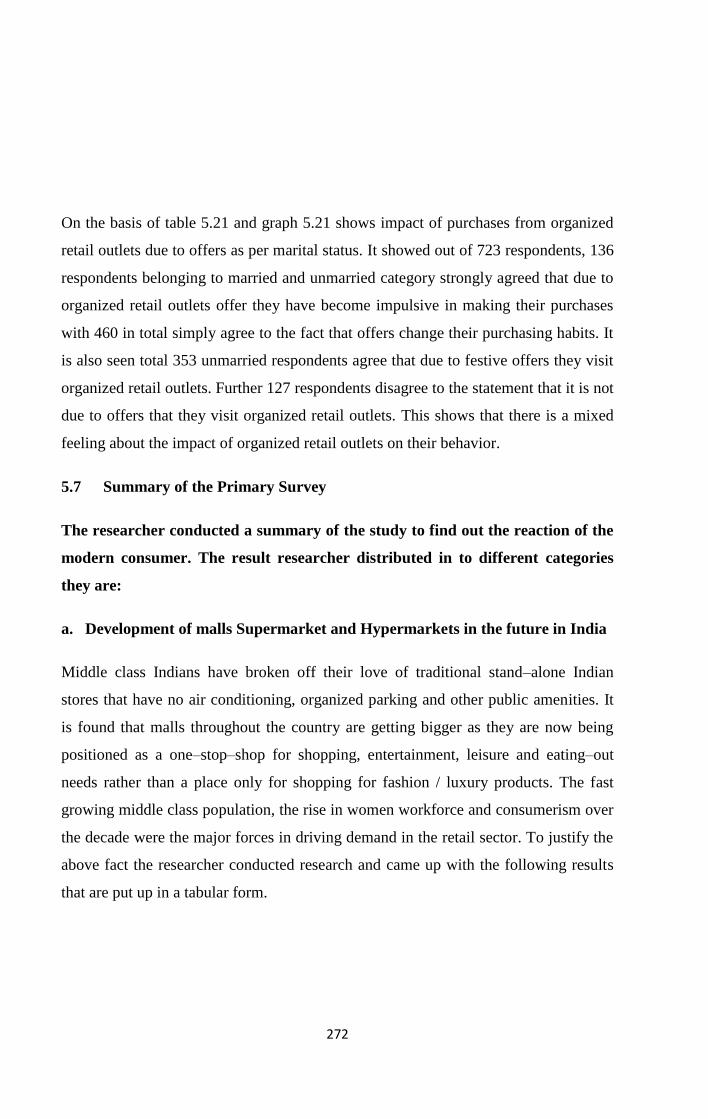
272
On the basis of table 5.21 and graph 5.21 shows impact of purchases from organized
retail outlets due to offers as per marital status. It showed out of 723 respondents, 136
respondents belonging to married and unmarried category strongly agreed that due to
organized retail outlets offer they have become impulsive in making their purchases
with 460 in total simply agree to the fact that offers change their purchasing habits. It
is also seen total 353 unmarried respondents agree that due to festive offers they visit
organized retail outlets. Further 127 respondents disagree to the statement that it is not
due to offers that they visit organized retail outlets. This shows that there is a mixed
feeling about the impact of organized retail outlets on their behavior.
5.7 Summary of the Primary Survey
The researcher conducted a summary of the study to find out the reaction of the
modern consumer. The result researcher distributed in to different categories
they are:
a. Development of malls Supermarket and Hypermarkets in the future in India
Middle class Indians have broken off their love of traditional stand–alone Indian
stores that have no air conditioning, organized parking and other public amenities. It
is found that malls throughout the country are getting bigger as they are now being
positioned as a one–stop–shop for shopping, entertainment, leisure and eating–out
needs rather than a place only for shopping for fashion / luxury products. The fast
growing middle class population, the rise in women workforce and consumerism over
the decade were the major forces in driving demand in the retail sector. To justify the
above fact the researcher conducted research and came up with the following results
that are put up in a tabular form.

273
Table 5.22
Development of Malls Supermarket and Hypermarkets in the future in India as
per Age
Sr. No
Options Age
Total
15-25 25-35
35-45 45-55 > 55
1 Strongly Agree 104 47
27 13 4 195
2 Agree 233 139
63 38 6 479
3 Disagree 28 6
2 5 2 43
4 Strongly Disagree 3 1
1 1 0 6
Total 368 193
93 57 12 723
Source: Compiled from Primary data.
Graph 5.22
Development of Malls Supermarket and Hypermarkets in the future in India as
per Age

274
As shown in Table 5.22 and Graph 5.22, approximately 195 respondents belonging to
different age group strongly agreed that that malls have good future in India further
479 just agreed that this is possible to happen, but 43 respondents felt that in India
malls and hypermarkets will not survive. The result further shows that it is the
respondents in the age bracket of 15-25 (377), 25-35 (186) and 35-45 (90) have a
strong feeling that soon India will have predominantly many malls and hypermarket.
Table 5.23
Development of malls Supermarket and Hypermarkets in the future in India as
per Gender
Source: Compiled from Primary data.
Graph 5.23
Development of malls Supermarket and Hypermarkets in the future in India as
per Gender
Sex
Total Male Female
1 Strongly Agree Total Respondents 67 128 195
2 Agree Total Respondents 270 209 479
3 Disagree Total Respondents 29 14 43
4 Strongly Disagree Total Respondents 3 3 6
Total 369 354 723

275
Malls, supermarkets, hypermarkets will grow and succeed in India in the future. Table
5.23 and Graph 5.23 shows according to Marital status 674 respondents interviewed
under this category stated unanimously that the growth of malls supermarkets and
hypermarkets will grow in the future around 43 respondents felt that there would be
no impact. Further bifurcation showed that unmarried respondents had strong feeling
that the future could be seen more with mall jungles.
As per the research the following conclusion has been drawn on the popularity and
future of mall in Mumbai city. To the present generation, shopping means much more
than a mere necessity and malls are now fast becoming image benchmarks for
communities. The following highlights of the shopping malls explicate why they have
become so popular amongst the Indian bourgeoisie.
1. All-in-one stores – With everything from groceries and vegetables to
footwear, clothes, cosmetics, furnishings and electrical items available under
one roof, a growing Indian middle class with higher disposable incomes is
heading for the malls in droves. For some, it is a way to chill out on movies
and food in the added comfort of a fully air-conditioned space. In short, it is
a living room for most of them.
2. The malls are another sign of the new, prosperous India, of call centers,
outsourcing and more disposable income, of fashionable young people who
look as though they belong on MTV. Although much of rural India remains
in deep poverty, many urban Indians are becoming richer.
3. Middle class Indians can shop at stores selling U.S. brands, which they
could only dream of, a few years back. But they also can buy expensive
pillows from Indian stores, statues of Hindu gods and fancy outfits, from the
same place. They can watch movies, eat Indian street food, Italian pasta,
American snack food, from the food courts or have their pictures plastered
on Coca-Cola cans at a promotional stand. At night they can dance and drink
alcohol in the mall‟s swanky nightclubs, also relatively new in India.

276
a) Organized Retail Outlets have negative impact on Unorganized Outlets
The development of organized retail outlets raised a question regarding it negative
impact on the unorganized retail outlets. The researcher tried to analyze this with
respect to following two categories
i. On the basis of Annual family income
ii. On the basis of Gender
Table 5.24
Impact on Unorganized outlets (Income Wise)
Source: Compiled from Primary data.
Graph 5.24
Impact on Unorganized outlets (Income Wise)
Sr.No Response Annual Family Income
Total
1-3
Lakh
3-5
Lakh
5-7
Lakh
7-9
Lakh
10 &
above
1 Yes Percentage 47% 31% 80% 63% 89% 55%
2 No Percentage 53% 69% 20% 37% 11% 45%
100% 100% 100% 100% 100% 100%

277
Table 5.24 and Graph 5.24 shows the result of analysis, when researcher took the
category of annual family income to understand the impact of organized outlets on
unorganized outlets to this 55 percent of respondent felt that organized outlets have a
negative impact on unorganized outlets majority of the respondents fell into the
income slab of 10 and above (89 percent) followed be 5-7 lakh (80 percent).
Accordingly 45 percent expressed negatively to this question to this maximum
response coming from 3-5 lakh (69 percent) followed by 1-3 lakh (53 percent) income
slab. This shows that respondents at higher income slab believe that organized retail
outlets have affected negatively to the unorganized retail outlets but the lower income
slab had a different opinion.
Table 5.25
Impact on Unorganized outlets (Gender Wise)
Source: Compiled from Primary data.
Graph 5.25
Impact on Unorganized outlets (GenderWise)
Sr.No Response Sex
Total Male Female
1 Yes 174 225 399
2 No 195 129 324
3 Total 369 354 723

278
Table 5.25 and Graph 5.25 shows the figures on the basis of gender it was seen out of
total respondent of (723), 399 gave positive reply, the maximum respondent were
female (225) and around (175) males and 324 respondents were of the opinion that
organized retail outlets have no impact on the unorganized outlets. This shows that in
Mumbai the consumers tilt towards those outlets who provide them good and
satisfying services. But again the results show that large number of respondents felt
that organized retailers are definitely creating an impact on the growth and
sustainability of unorganized retailers. It is also suggested that if unorganized sectors
does not change their traditional outlook they will not be able to sustain the
competition created by organized retailers in the future.
Impact on average spending due to malls
The organized retails or malls the moment it is heard a feeling comes up that there
would be huge impact on the average spending to an extent that it will cross the limit
and shatter the entire budget.
To find out the reality the researcher took up certain products categories like food and
grocery, readymade garments, health and beauty products, furniture and electronics
goods. The researcher also wanted to analyze this on the basis of different category to
which the respondent belongs to.
Change in consumer behavior with respect to select product categories
Food and Grocery
With the change in culture and tradition the perspective of the consumers also started
changing with respect to their purchases of selected goods. There has been a
confusion of consumers‟ preference in organized and unorganized outlets while
making purchases of certain essential and selected products. To understand this
respondent picked up the following product categories and conducted a research on
the basis of marital status and employment status.
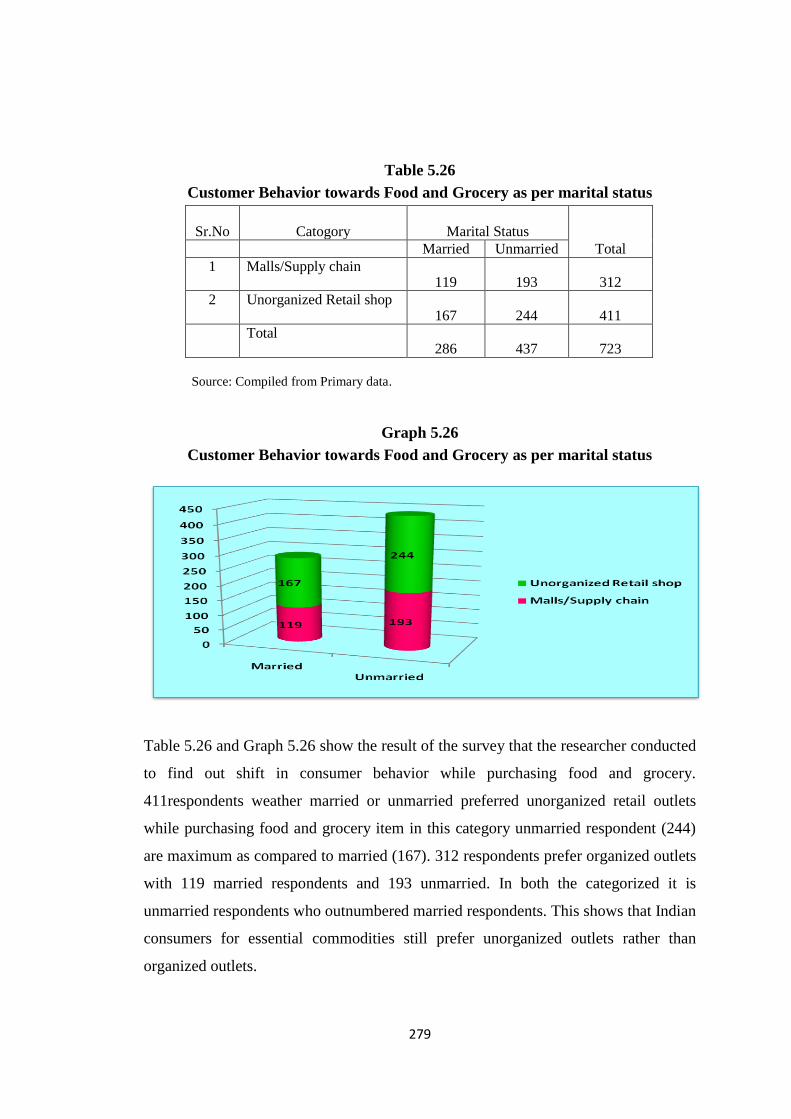
279
Table 5.26
Customer Behavior towards Food and Grocery as per marital status
Sr.No
Catogory Marital Status
Total Married Unmarried
1 Malls/Supply chain 119 193 312
2 Unorganized Retail shop 167 244 411
Total 286 437 723
Source: Compiled from Primary data.
Graph 5.26
Customer Behavior towards Food and Grocery as per marital status
Table 5.26 and Graph 5.26 show the result of the survey that the researcher conducted
to find out shift in consumer behavior while purchasing food and grocery.
411respondents weather married or unmarried preferred unorganized retail outlets
while purchasing food and grocery item in this category unmarried respondent (244)
are maximum as compared to married (167). 312 respondents prefer organized outlets
with 119 married respondents and 193 unmarried. In both the categorized it is
unmarried respondents who outnumbered married respondents. This shows that Indian
consumers for essential commodities still prefer unorganized outlets rather than
organized outlets.
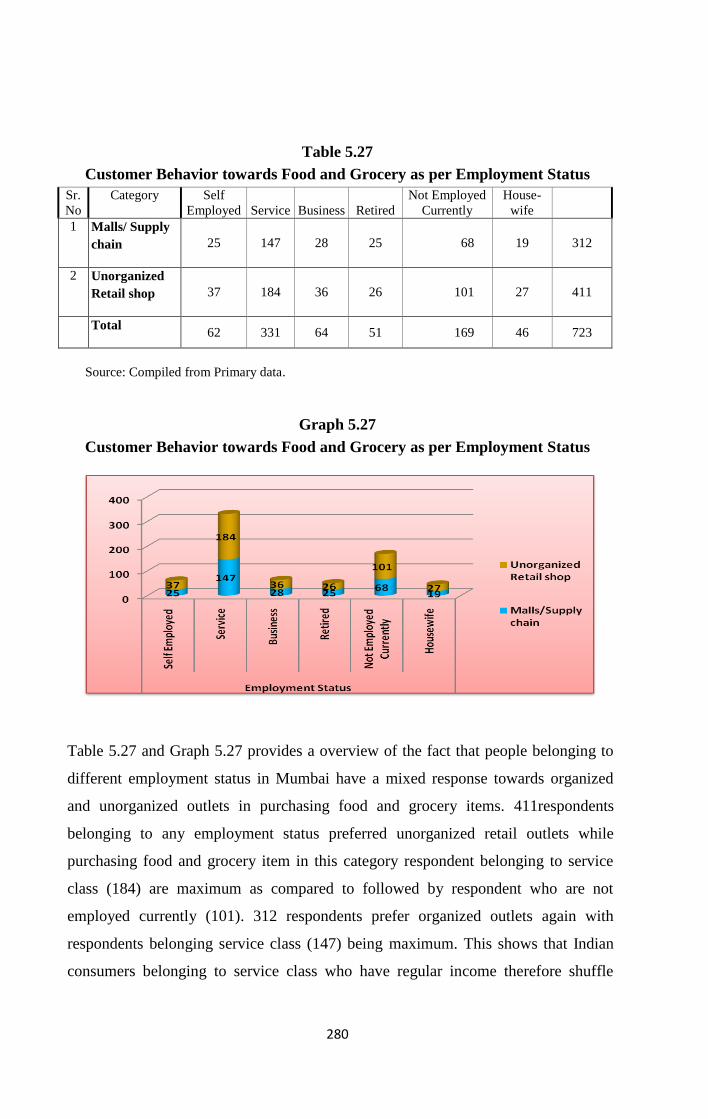
280
Table 5.27
Customer Behavior towards Food and Grocery as per Employment Status
Sr.
No
Category Self
Employed Service Business Retired
Not Employed
Currently
House-
wife
1 Malls/ Supply
chain 25 147 28 25 68 19 312
2 Unorganized
Retail shop 37 184 36 26 101 27 411
Total 62 331 64 51 169 46 723
Source: Compiled from Primary data.
Graph 5.27
Customer Behavior towards Food and Grocery as per Employment Status
Table 5.27 and Graph 5.27 provides a overview of the fact that people belonging to
different employment status in Mumbai have a mixed response towards organized
and unorganized outlets in purchasing food and grocery items. 411respondents
belonging to any employment status preferred unorganized retail outlets while
purchasing food and grocery item in this category respondent belonging to service
class (184) are maximum as compared to followed by respondent who are not
employed currently (101). 312 respondents prefer organized outlets again with
respondents belonging service class (147) being maximum. This shows that Indian
consumers belonging to service class who have regular income therefore shuffle

281
between both organized and unorganized to balance their income and at the same
time meet the requirement for essential commodities.
Readymade Garments
As the modern era started moving there has been continuous change in consumer
behavior with regards to purchase of readymade garments. The researcher in order to
find this change considered two categories marital status and employment status.
Table 5.28
Customer Behaviour towards Readymade Garments as per Marital Status
Source: Compiled from Primary data.
Graph 5.28
Customer Behaviour towards Readymade Garments as per Marital Status
Sr.No Preferences Marital Status
Total Married Unmarried
1 Malls/Supply chain 45% 48% 47%
2 Unorganized Retail shop 55% 52% 53%
100% 100% 100%

282
Table 5.28 and Graph 5.28 Shows that respondent whether married unmarried prefer
buying Readymade garments from unorganized outlets with 53 percent respondent
opting for it and 55 percent of married respondents preferring to buy readymade
garments from the unorganized outlets rather than visiting organized retail outlets and
52 percent of unmarried respondents. Whereas 47 percent of respondents opted for the
Malls, with 45 percent of married respondent and 48 percent of unmarried. This
shows that in Mumbai still it is the unorganized outlets that are popular with
maximum people.
Table 5.29
Customer Behaviour towards Readymade Garments as per Employment Status
Source: Compiled from Primary data.
Graph 5.29
Customer Behaviour towards Readymade Garments as per Employment Status
Sr.No Preferences
Employment Status
Total Self
Employed Service Business Retired
Not Employed
Currently Housewife
1
Malls/Supply
chain 44% 46% 47% 43% 50% 50% 47%
2
Unorganized
Retail shop 57% 54% 53% 57% 50% 50% 53%
100% 100% 100% 100% 100% 100% 100%

283
Table 5.29 and Graph 5.29 portraits the preference of respondents of different
Employment status in purchasing readymade garments. 53 percent respondents of all
occupation preferring unorganized outlets and 47 percent of respondents preferring to
buy readymade garments from the organized outlets.
Electronics
Electronics is the new field that is developed and slowly the impact is growing. There
has been a belief that the growth of organized retail outlets are pulling the consumers
toward them. The researcher in order to find this change conducted a research on the
basis of two categories marital status and employment status.
Table 5.30
Customer Behaviour towards Electronics As per Marital Status
Sr.No Preferences Marital Status Total
Married Unmarried
1 Malls/Supply chain
67 104 171
2 Unorganized Retail shop
219 333 552
Total 286 437 723
Source: Compiled from Primary data.
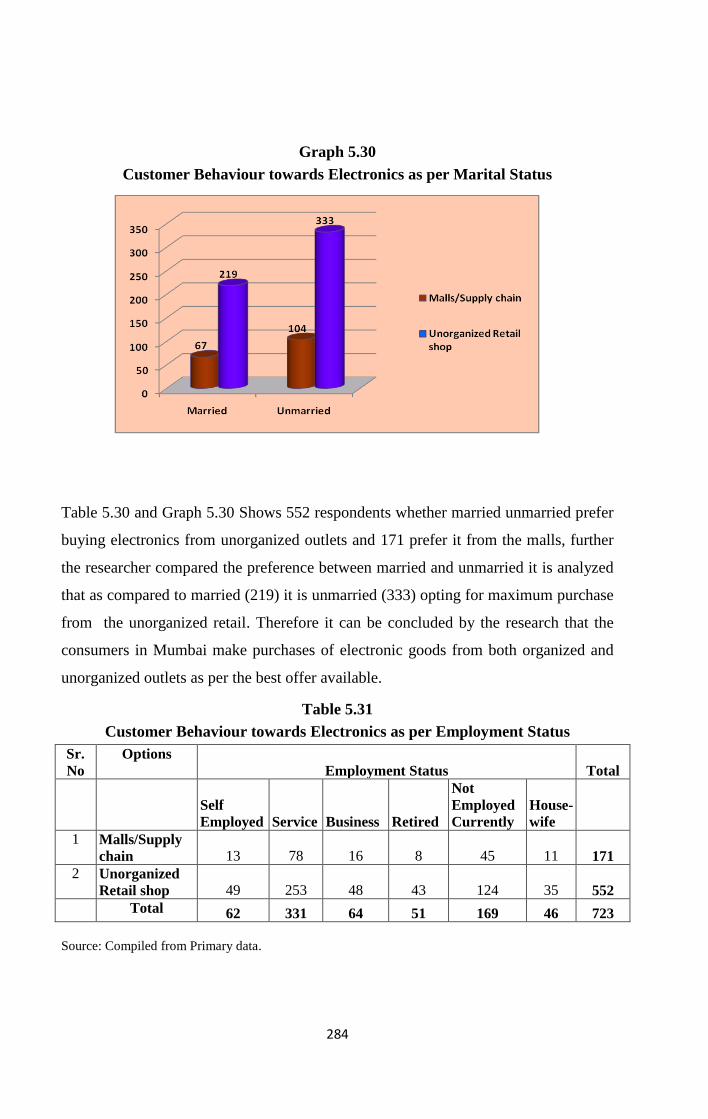
284
Graph 5.30
Customer Behaviour towards Electronics as per Marital Status
Table 5.30 and Graph 5.30 Shows 552 respondents whether married unmarried prefer
buying electronics from unorganized outlets and 171 prefer it from the malls, further
the researcher compared the preference between married and unmarried it is analyzed
that as compared to married (219) it is unmarried (333) opting for maximum purchase
from the unorganized retail. Therefore it can be concluded by the research that the
consumers in Mumbai make purchases of electronic goods from both organized and
unorganized outlets as per the best offer available.
Table 5.31
Customer Behaviour towards Electronics as per Employment Status
Sr.
No
Options
Employment Status Total
Self
Employed Service Business Retired
Not
Employed
Currently
House-
wife
1 Malls/Supply
chain 13 78 16 8 45 11 171
2 Unorganized
Retail shop 49 253 48 43 124 35 552
Total 62 331 64 51 169 46 723
Source: Compiled from Primary data.

285
Graph 5.31
Customer Behaviour towards Electronics as per Employment Status
Table 5.31 Graph 5.31 of Employment wise bifurcations again shows the preference
of unorganized sector with 552 respondents of all occupation preferring unorganized
outlets and with 253 respondents from service section toping the table followed by
124 respondents who are not employed (students and housewives). This shows as for
as electronic goods are concern it is still the unorganized sector that is popular in
Mumbai.
Furniture
Furniture industry has been growing gradually and changing according to the
requirement of the consumers. There has been a belief that the growth of organized
retail outlets are pulling the consumers toward them. By giving good offers and
preferences. The researcher in order to find this change considered two categories
marital status and employment status.

286
Table 5.32
Customer Behaviour towards Furniture as per Marital Status
S.No Preferences Marital Status Total
Married Unmarried
1 Malls/Supply chain 157 230 387
2 Unorganized Retail shop 129 207 336
Total 286 437 723
Source: Compiled from Primary data.
Graph 5.32
Customer Behaviour towards Furniture as per Marital Status
Table 5.32 and Graph 5.32 Shows 387 respondents whether married unmarried prefer
buying furniture‟s from organized outlets and 336 prefer it from the unorganized
outlets, further compared to married (157) it is unmarried (230) who visit the malls
maximum and prefer purchasing furniture‟s from organized retail outlets.

287
Table 5.33
Customer Behaviour towards Furniture As per Employment Status
Sr.No Preferences Employment Status
Total
Self
Employed Service Business Retired
Not Employed
Currently Housewife
Malls/Supply
chain 34 178 31 30 88 26 387
Unorganized
Retail shop 28 153 33 21 81 20 336
62 331 64 51 169 46 723
Source: Compiled from Primary data.
Graph 5.33
Customer Behaviour towards Furniture as per Employment Status
Table 5.33 Graph 5.33 of Employment wise bifurcation again shows the preference of
organized sector with 387 respondents of all occupation preferring organized outlets
and with 336 respondents from unorganized sectors. It is the service section with 178
respondents opting for the malls followed by 88 respondents who are not employed
(students and housewives). This shows as for as for as furniture‟s are concern the
buying behavior of the consumers have changed with onset of the malls.

288
5.8 Testing of the Hypotheses
Hypothesis 1
For testing this hypothesis the researcher calculated this on the basis of
parameter related to the gender which specified the maximum inflow of
customer’s gender wise in Mumbai. Chi Square test is used on the various
primary survey and the results have been put up in the tabular form given
below:
Ho: Malls are patronized equally by males and females.
H1: Malls are patronized more by females than by males.
Table 5.34
Hypotheses testing Showing consumer visit as per gender wise.
Visit
Mall Sex
Male Female Total
Yes 260(70.5%) 314(88.7%) 574(79.4%)
No 109(29.5%) 40(11.3%) 149(20.6%)
Total 369(100.0%) 354(100.0%) 723(100.0%)
Source: Analyzed from primary data.
Table 5.35
Chi-Square Test showing visit of respondents to the malls
Source: Statistical analysis of primary data.
Value df
Asymp. Sig. (2-
sided)
Pearson Chi-Square 36.738(b) 1 .000
Continuity Correction(a) 35.631 1 .000

289
Chi Square test is applied to verify the difference between males and females and
according to Table 5.34 and Table 5.35 it is concluded that it is women who
patronize more to mall with 314 (88.7 percent) females giving positive reply and
260 (70.5 percent) male respondents saying yes to visit the malls. The Chi Square
result shows the P-value as 0.000 which is much less than 0.05. Thus Null
hypothesis that malls are patronized equally by males and females stands rejected.
We conclude that Malls are patronized more by females than by males. Therefore
the hypothesis stands authentic and it is proved.
Hypothesis 2
There was an assumption that most of the men in Mumbai feel that due to malls
their buying behavior changed. For testing this hypothesis the researcher took
parameter on the basis of gender which specified the change in behavior in the
course of time. Chi Square test is used on the various primary survey and the
results have been put up in the tabular form given below:
Ho: Men and to women feel equally that the development of organized retail
outlets has changed their buying behavior.
H1: Compared to women more men feel that the development of organized
retail outlets has changed their buying behavior.

290
Table 5.36
Change in Consumer Behavior due to O.R
Source: Analysed from primary data.
Table 5.37
Chi Square Test showing frequency in change in consumer behavior due to O.R
Source: Statistical analysis of primary data.
Chi Square test is applied to calculate that male or female who felt more that
development of organized retail outlets have changed their buying behavior. From
Table 5.36 and Table 5.37 it is concluded that it is 207 (56.1 percent) and 138 (37.4
percent) male respondent who were affirmative in stating that malls have changed
their buying behavior female with 232 (65.5 percent ) were of the opinion that mall
development to some extent has changed their buying behavior. To this result Chi
Square gives an indication of expected count less than 5 and the P- value shows the
asymp as .000 which is much less than the expected resulted. Thus Null hypothesis
that men and women feel equally that the development of organized retail outlets has
changed their buying behavior stand rejected. We conclude that compared to women
more men feel that the development of organized retail outlets has changed their
buying behavior. Therefore the hypothesis stands authentic and it is proved.
S.No Response Sex Total
Male Female
1 Yes, very much 207 (56.1%) 93 (26.3%) 300 (41.5%)
2 Yes, to some extent 138 (37.4%) 232 (65.5%) 370(51.2%)
3 No not at all 24 (6.5%) 29(8.2%) 53(7.3%)
Total 369(100%) 354(100%) 723(100%)
Value df Asymp. Sig. (2-sided)
Pearson Chi-Square 67.391(a) 2 .000

291
5.9 Conclusion
Consumers, who are as news aware as marketers, were conscious of the much-
reported down turn in consumer spending. News shows and newspapers were not shy
in telling us about the slump in high street spending and the drop in profits at major
retailers across the world. And it did not go unnoticed, either through personal
experience or the media, that India is a nation in a growing amount of debt, factors
that have unarguably shaped retail spending. Organized retailing has so far remained
confined primarily to the urban markets in the country by relating to the changing
paradigm of consumer behavior in the urban areas, especially, metros and big cities.
There are a number of reasons for this kind of development. However, most
importantly, organized retailers are yet to feel the saturation effect in urban markets
and have, therefore, probably not paid enough attention to the other markets.
Secondly, modern retailing, despite its cost-effectiveness, has come to be identified
with lifestyles particularly the affluent one, thereby excluding an important and larger
segment of consumers. In fact, in order to appeal to all classes of society, organized
retail stores would have to identify with different lifestyles and socioeconomic strata
and respond to their respective requirements and shopping patterns. To some extent,
this trend is already visible with the emergence of stores with an essentially 'value for
money' image. Consumer expectations are very high from the organized retail stores
and such expectations have also rubbed off on the conventional retailers. While
insisting on value for money and cost effectiveness, today consumers want a better
shopping experience, recreation, friendly interactions and a wide choice of products
and services. Retail stores have to live up to these expectations in order to flourish,
prosper and grow in the Indian market.
The retailer in order to satisfy customer needs must have a thorough understanding of
how customers make store choice and purchase decisions. Customer‟s behavior
provides some valuable insights into the process and therefore is useful for retail
management decision making. It is important to realize that the purchase of product

292
involves motivational, social, psychological and economic factors. There are also
important stages involved in the purchase process and the type of purchase and the
users of the purchase that will affect the buying behavior.
The survey was a small attempt made by the researcher to find out the views of the
respondents in Mumbai on the growth of mall culture and its likely impact on the
society. The analysis of the data proves that:
a. Optimum about economic development of India is fueling the expansion of
retail market in the country with steady entry of both Indian corporate would
as well as global retail companies in organized retail section with different
retail models.
b. The researcher shows that there is gradual shift in consumer behavior. The
consumer of today has gradually drifted away from the thought of saving for
the future and steadily adopting the thought of comfortable life at affordable
price.
c. There has been an observation that gradually young generation is becoming
more enthusiastic. They have been willing to accept change, willing also to
experiment with the new concepts, products, services. Therefore it is said that
it is young India.
d. The analysis clearly stated that no matter what offers or changes the malls can
bring with food and grocery sections yet the major crowd puller till date are
the unorganized sector.
Retail customers also need to understand the variety of levels
1. They are problem solvers deciding on what offer satisfies their needs. All
retail activities and promotions should therefore aid the consumer to make a
decision.

293
2. Consumers seek to reduce the risk of their purchase. Retailers need to provide
information, guarantees and after sales services to reduce the perception of
risk.
3. Consumers will go shopping for a variety of reasons. The complexity of the
shopping trip should be clear to the retail staff.
4. There are number of demographic and other changes which are having an
impact on the patterns of purchasing and consumption.