rationale for a post-2015 framework for disaster risk ... · pdf filethis guide aims to...
TRANSCRIPT

Rationale for a post-2015 framework for disaster risk reduction - Evidence from
the Global Assessment Report 2009, 2011
and 2013

This guide aims to provide the context of the need for a post-2015 framework for DRR. It builds on evidence of three Global Assessment Reports, explaining progress made on the Hyogo Framework
for Action’s (HFA) implementation so far and highlighting gaps and challenges.
This document is compiled by the Preventionweb team based on the original GARs. An inter-active version will be made available soon.
www.preventionweb.net
© United Nations 2014. All rights reserved.Disclaimer:
The views expressed in this publication do not necessarily reflect the views of the United Nations Secretariat. The designations employed and the presentation of the material do not imply the expres-
sion of any opinion whatsoever on the part of the United Nations Secretariat concerning the legal status of any country, territory, city or area, or of its authorities, or concerning the delineation of its
frontiers or boundaries.
There is a clear need for further action to achieve the HFA’s original objective:
“The substantial reduction of disaster losses, in lives and in the social, eco-nomic and environmental assets of communities and countries.”
post-2015 frame-work for disaster
risk reduction
Evidence from the GAR 2009, 2011 and 2013
Page | 1
1 Good progress in implementation of most Priorities for Action under the HFA
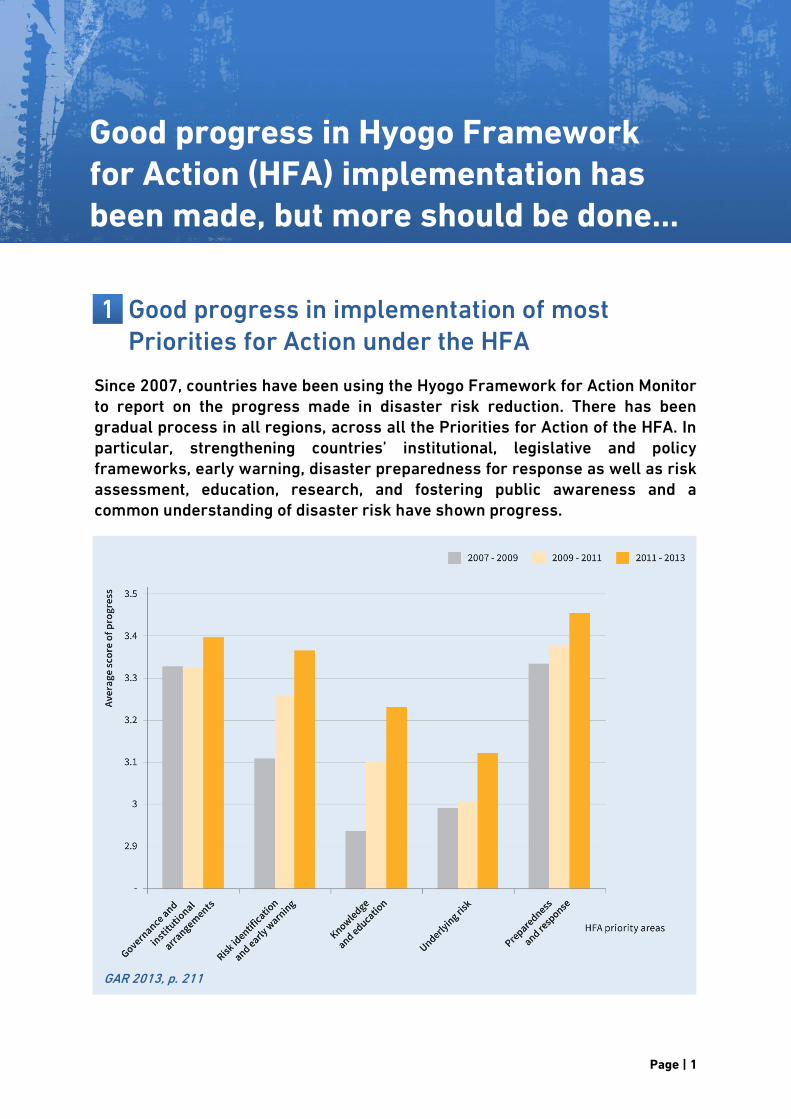
Since 2007, countries have been using the Hyogo Framework for Action Monitor to report on the progress made in disaster risk reduction. There has been gradual process in all regions, across all the Priorities for Action of the HFA. In particular, strengthening countries’ institutional, legislative and policy frameworks, early warning, disaster preparedness for response as well as risk assessment, education, research, and fostering public awareness and a common understanding of disaster risk have shown progress.
GAR 2013, p. 211
Good progress in Hyogo Framework for Action (HFA) implementation has been made, but more should be done…

Rationale for a post-2015 framework for disaster risk reduction
2 | Page
2 However, not under HFA Priority for Action 4 — reducing underlying risk
However, countries have been more challenged to factor disaster risk reduction into public investment, land-use planning, infrastructure projects, environmental management and social policies, which are the activities under HFA Priority for Action 4 on reducing the underlying risk driversi and tackling the causes of risk creation.
RISK CONSTRUCTION IN THAILAND Thailand’s Board of Investment (BOI) encouraged investment in three promotional zones —through tax privileges; sectoral incentives through BOI-identified priority projects; and privileges provided by the Industrial Authority of Thailand (IEAT). Although this policy was successful in attracting Foreign Direct Investment, it led to massive increases in flood exposure. Much of the investment took place in former rice paddies located in floodplains, which paved the way for the 2011 Chao Phraya flood disaster. (GAR 2013, p. 215)
Thai soldiers hold onto each other, pulling against the stream of water flowing into a neighbourhood after a wall was breached by the swollen Chao Phraya River in Bangkok, Thailand, on October 30, 2011. Photo credit: AP Photo/Altaf Qadri

Evidence from the GAR 2009, 2011 and 2013
Page | 3
3 What are the repercussions of slow implementation of HFA Priority for Action 4?
GAR 2009 showed how underlying risk drivers—such as poor urban governance, vulnerable rural livelihoods and declining ecosystems—concentrate extensive disaster riskii in low-income communities and households and enhance poverty, undermining development. (GAR 2009, ch. 4) Although extensive disasters do not cause significant fatalities, they are responsible for a large proportion of damage to local infrastructure and livelihoods of low-income households and communities. The number of houses damaged relative to population growth in 21 countries and states has increased six-fold since the 1990s. This reflects how the risks generated by rapid economic growth are transferred to low-income households and communities who least enjoy its benefits. (GAR 2011, p. 39)
TRANSFER OF RISKS TO LOW INCOME HOUSEHOLDS IN ST. LOUIS The population of Saint Louis increased from 115,000 to 200,000 between 1998 and 2002. Floods affect low-lying areas with no drainage that have been settled by poor rural migrants fleeing the effects of rural drought. To protect themselves against floodwaters, residents make barriers using household waste, but this increases health problems. Flood risk in Saint Louis is a problem of poor urban governance. (GAR 2009, p. 75)
West Africa floods. Photo source: transparencyng.com

Rationale for a post-2015 framework for disaster risk reduction
4 | Page
4 Exposure is one of the major drivers of risk
Analyzing extensive risk highlights a key development challenge of our time: how to strengthen risk governance capacities fast enough to address the rapidly increasing exposure of population and assets that accompanies economic growth. Extensive risk exists wherever development occurs, and risk drivers such as badly planned and managed urbanization, environmental degradation and poverty directly construct it. Extensive disaster losses and their impacts on health, education, structural poverty and displacement go unaccounted for in most countries, hiding the real cost of disasters. Also, as the earthquake in Haiti (2010) showed, the extensive risks of today can become the intensive risks of tomorrow when people, property and livelihoods accumulate in places exposed to major hazards such as earthquakes or tropical cyclones.
2010 EARTHQUAKE RISKS IN HAITI, CHILE AND NEW ZEALAND That hazards are translated into risk through exposure and vulnerability was tragically illustrated by the high death toll (222,517) from the earthquake that struck Haiti on 12 January, 2010, compared with the 27 February 2010 earthquake in Chile which released 500 times more energy yet only killed 486. The earthquake that hit Christchurch, New Zealand, on 3 September 2010 also was of severe magnitude. However, only some 500 buildings were destroyed and no lives were lost. While more than 100 people were killed in another earthquake on 22 February 2011, the low casualty rate in both events reflects tough building regulations, strict enforcement, and experience in dealing with earthquakes. (GAR 2011, p. 8)
The Cathedral of Our Lady of the Assumption, Port-au-Prince, Haiti, after the 12 January 2010 earthquake. Photo credit: iStockphoto (R) / arindambanerjee (C)

Evidence from the GAR 2009, 2011 and 2013
Page | 5
5 Why can’t we catch up with this increasing risk trend?
GAR 2013 found that there is increased government investment in corrective disaster risk managementiii and in risk financing. However, there is little solid progress in anticipatory or prospective disaster risk managementiv. We are simply not doing enough to reduce underlying risk. Investment in disaster risk reduction is still not a priority for many governments, as its cost-effectiveness might not yet be fully understood, and other competing issues such as unemployment or fiscal stability are often prioritized.
PREVENTING FUTURE RISKS AND THE 2005 MUMBAI FLOODS In July 2005, a week of incessant rainfall caused floods in several low-lying areas of Mumbai causing nearly 600 deaths, seriously affecting more than a million people, and dislocating the lives of many millions. Lifeline infrastructure and services including water, sewerage, drainage, road, rail and air transport, power and telecommunications stopped functioning across one of the world’s largest cities. The Government of Maharashtra had developed India’s first urban Disaster Management Plan for Mumbai in the late 1990s, which highlighted flooding as a significant risk, pinpointed bottleneck locations in each ward, and identified vulnerable slums and settlements. However, not much systematic action was taken to mitigate the risk. Rapid urbanization, a constant modification of building norms, the narrowing and congestion of the Mithi River by development, and the construction of informal settlements adjacent to the river exacerbated the situation. (GAR 2009, p. 102)
Mumbai flooding. Photo source: http://writtenpath.blogspot.ch

Rationale for a post-2015 framework for disaster risk reduction
6 | Page
6 Fewer lives are lost, despite more people being exposed and weather related hazards growing more intense
There is a rapid increase in population exposure to weather related hazards. The figure below shows the increasing number of population exposed to tropical cyclones in millions per year.
Adapted from GAR 2011, p. 27
There is good news from these developments – mortality is decreasing...

Evidence from the GAR 2009, 2011 and 2013
Page | 7
In addition, more intense tropical cyclones have been observed since 1970, as shown in the figure below (average annual number of tropical cyclones by Saffir-Simpson Category between 1970 and 2009 as observed).
Adapted from GAR 2011, p. 27
The combination of the rapid growth of ‘at risk’ populations – with global physical exposure to tropical cyclones almost tripling from 1970 to 2009 – and the increasing strength of tropical cyclones would normally result in more deaths. However, despite growing exposure of people and intensifying hazards, mortality risk associated with major weather-related hazards is now declining globally, including in Asia, where most of the risk is concentrated. In most of the world, the risk of being killed by a tropical cyclone or a major river flood is lower today than it was in 1990. (GAR 2011, p. 29) For example, it was estimated that mortality risk associated with tropical cyclones in East Asia and the Pacific fell by 50 percent between 1980 and 2010, although exposure increased by about 160 percent.
UNISDR, Asia Pacific Disasters Report 2012

Rationale for a post-2015 framework for disaster risk reduction
8 | Page
7 Significant progress in social and economic development has contributed to reduced mortality
A combination of achievements towards the Millennium Development Goals (MDGs) and investments in preparedness and early warning has contributed to the reduction of mortality over the decades. For example, improved transport infrastructure and health facilities, which facilitate evacuation and prompt medical attention, lead to reduced vulnerability – at least in the case of floods and tropical cyclones. Mortality risk for all weather related hazards continues to be concentrated in countries with low Gross Domestic Product (GDP) and weak governance, and mortality is still increasing in countries with weak risk governance capacities. In general, higher-income countries and those with rapid economic growth over recent decades have successfully reduced their mortality risk. With economic development, capacities in disaster and emergency management generally improve. In contrast, in regions with slower economic growth, mortality risk is still high. For example, in sub-Saharan Africa, flood mortality risk has been growing consistently since 1980 because the rapid increase in exposure has not been accompanied by a commensurable reduction in vulnerability. (GAR 2013, p. 46)

Evidence from the GAR 2009, 2011 and 2013
Page | 9
8 However, what works for one hazard, does not work for another
REDUCING CYCLONE VULNERABILITY IN DHAKA, BANGLADESH An innovative cyclone shelter programme has helped Bangladesh dramatically reduce cyclone mortality since the 1970s. In the past four decades, Bangladesh has been struck by three severe cyclones: Bhola (1970), Gorky (1991) and Sidr (2007). Bhola caused an estimated 300,000 deaths and Gorky was responsible for more than 138,000. The death toll for Sidr, however, was ‘only’ around 4,000. Unfortunately, the disaster management capacities that have reduced cyclone mortality have not been able to address earthquake risk in Dhaka. (GAR 2011, p. 19)
A view of densely populated Dhaka. Photo source: UN.org
Earthquake mortality risk differs from the mortality risk associated with floods and tropical cyclones. While warning systems are becoming increasingly sophisticated and can reduce mortality for weather related hazards, earthquake mortality is closely correlated to building collapse. This implies that earthquake-prone countries with rapidly growing economies and the inability to reduce the vulnerability of their building stock may also have increased earthquake mortality risk. As the case of Dhaka illustrates, earthquake mortality risk may be increasing, particularly in countries experiencing rapid urban growth whereas mortality risk associated with major weather-related hazards is now declining globally.

Rationale for a post-2015 framework for disaster risk reduction
10 | Page
9 Increasing economic losses In contrast to mortality risk, estimated economic loss risk associated with floods and tropical cyclones is increasing in all regions. As countries develop, they strengthen their risk governance capacities and reduce their vulnerabilities. However, these improvements have failed to offset the very rapid increase in exposure fuelled by rapid economic growth. Increases in such capacities do not immediately reduce the vulnerability of existing fixed assets, such as buildings and infrastructure, which are often used beyond their expected lifespan. In the case of floods, economic loss risk is increasing faster in OECD and high-income countries than in other geographic and income regions, even though exposure in these countries is increasing at a far slower rate than elsewhere, for example, Latin America and the Caribbean, as shown in the figure below. This means that the risk of economic damage is only growing faster than GDP per capita in high-income countries. (GAR 2011, p. 31)
GAR 2011, p. 32
There is also bad news – economic losses are increasing...

Evidence from the GAR 2009, 2011 and 2013
Page | 11
10 Absolute losses are greatest in richer countries Most of the largest losses are in middle-income and developed countries. This means that development was unable to reduce risks, and may actually drive its growth. This trend in losses indicates that a larger proportion of the growing economies remain at risk despite the availability of more capital assets. This confirms that economic growth alone has failed to reduce economic losses due to disasters.
Economic losses from disasters in Asia and Pacific by income classification of countries, 1970-2009. UNISDR, ESCAP, Asia Pacific Disasters Report 2012, p. 9

Rationale for a post-2015 framework for disaster risk reduction
12 | Page
11 Relative losses are greatest in poorer countries Countries with small and vulnerable economies, such as many Small Island Developing States (SIDS) and land-locked developing countries (LLDCs), have seen their economic development set back decades by disaster impacts. The countries with the highest ratio of economic losses in disasters, with respect to their capital stock, are all SIDS and LLDCs, such as Samoa and St. Lucia. In addition, the countries with the highest economic vulnerability are those with the highest percentage of economic losses and the lowest economic resilience to shocks, indicated by very low national savings. Many of these countries also have extreme limitations to their ability to benefit from international trade, characterized by a very low participation in world export markets (less than 0.1%) and low export diversification. SIDS and LLDCs together constitute 67% of the countries with very high economic vulnerability to disasters.
THE 2011 GREAT EAST JAPAN EARTHQUAKE AND THE THAILAND FLOODS On 11 March 2011, the Great East Japan Earthquake and tsunami generated direct losses of about US$206 billion, representing approximately 20 percent of average annual gross fixed capital formation from 2008 to 2012. Similarly, direct losses from the Chao Phraya river floods were approximately US$45.7 billion, which equals more than 60 percent of Thailand’s average annual gross fixed capital formation from 2006 to 2010. Because so many businesses suffered simultaneously, the respective national economies were severely impacted. (GAR 2013, p. 25)
The Great East Japan Earthquake of 2011 Photo: Asahi Shimbun file photo

Evidence from the GAR 2009, 2011 and 2013
Page | 13
12 Economic exposure is growing faster in the developed world
The proportion of the world’s GDP exposed to tropical cyclones increased from 3.6 percent in the 1970s to 4.3 percent in the first decade of the 2000s. During that time, the absolute value of global GDP exposed to tropical cyclones tripled, from US$525.7 billion to US$1.6 trillion, as shown in the graph below. (GAR 2011, p. 31)
Adapted from GAR 2011, p. 32
In the OECD, which concentrates about 53% of the global GDP exposed per year, the economic loss risk to floods in 2010 is 170% higher than in 1990. As the 2011 floods in Germany and Australia illustrate, even high-income countries struggle to manage increasing exposure. Although GDP exposure to floods is increasing faster than GDP per capita in all regions, the risk of economic damage is only growing faster than GDP per capita in high-income countries, as shown in the table below. (GAR 2011, p. 31)
Average annual global GDP exposed to floods in billion (2000) US$. Adapted from GAR 2011, p. 32

Rationale for a post-2015 framework for disaster risk reduction
14 | Page
13 Development patterns drive increasing economic losses
Some regions that are successfully attracting investment and have seen the largest increase in produced capital are also exposed to hazards such as earthquakes, tropical cyclones and tsunamis. As such, benefits to business from globalization have also been accompanied by major boosts in population and value of assets in hazard-exposed areas. These areas include tsunami and cyclone-prone coastlines, flood-prone river basins and earthquake-prone mega-cities. Many such areas offer higher productivity and comparative advantages for investors. For example, export-oriented production and distribution tends to cluster around international ports. Tourism is attracted to tropical beaches and islands. These areas, however, present disaster risks, which are not necessarily factored into business investment decisions. (GAR 2013, p. 44)
Between 1970 and 2010, for example, while global population growth was 87 percent, populations living in flood plains grew by 114 percent and in cyclone-prone coastlines by 192 percent. The figure below, for example, highlights the concentration of produced capital in areas exposed to cyclonic winds in East Asia. Roughly 80 percent of cyclonic wind risk is concentrated in Asia. The continent also has significant tsunami exposure, with Japan leading in both absolute and relative exposure of its people. (GAR 2011, p. 22)
PRODUCED CAPITAL IN HIGH RISK AREAS
The figure below shows exposure of urban centres in South East Asia to tropical cyclones with a 50 year return period. Japan and the Philippines are most at risk of being exposed to wind speeds of up to 300 km per hour.
Produced capital stock in Southeast Asia and cyclone wind hazard (50 year return period). (GAR 2013, p.45)
Evidence from the GAR 2009, 2011 and 2013
Page | 15
14 Vulnerability reduction has not caught up with the pace of increase in exposure
Rapid economic growth in many low- and middle-income countries has improved human development and reduced poverty for millions of people. This is matched, however, by an equally rapid increase in the exposure of economic assets to natural hazards. Particularly in higher-income countries, the risk of losing wealth in a disaster is now increasing at a faster rate than wealth is being created. Although countries are strengthening risk governance capacities and reducing vulnerability, this is not happening quickly or effectively enough – increases in exposure have meant increases in risk. (GAR 2011, p. 33)
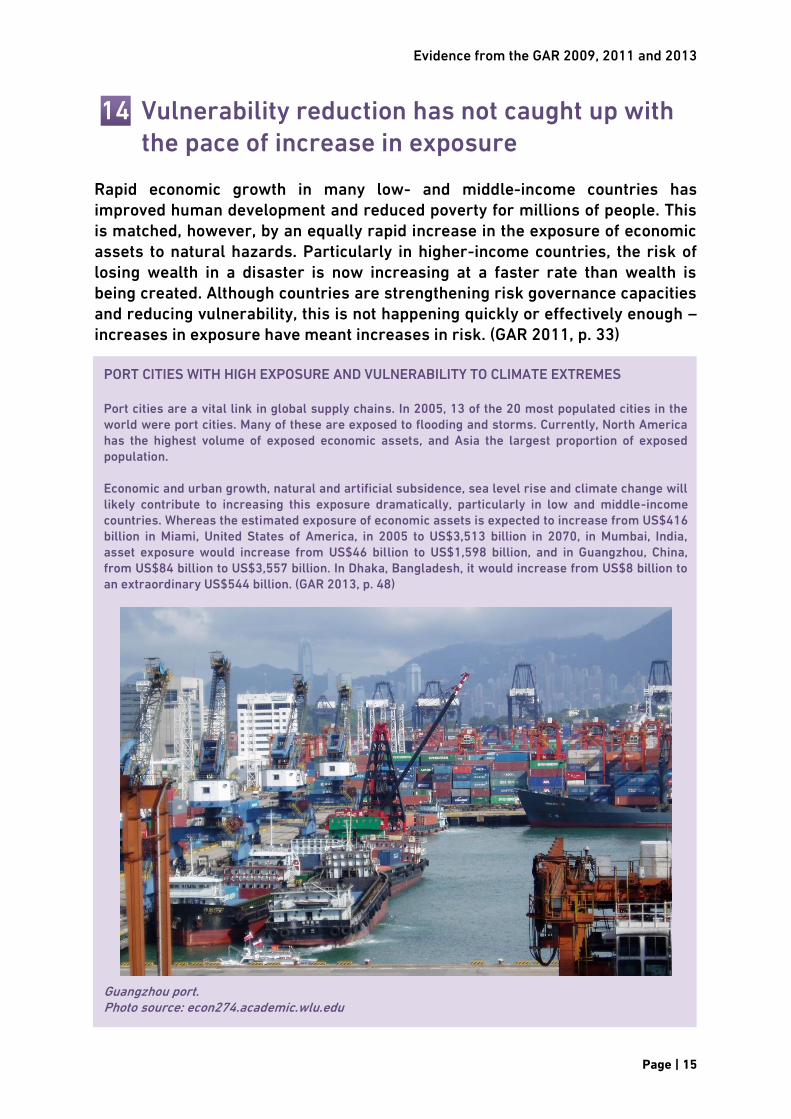
PORT CITIES WITH HIGH EXPOSURE AND VULNERABILITY TO CLIMATE EXTREMES Port cities are a vital link in global supply chains. In 2005, 13 of the 20 most populated cities in the world were port cities. Many of these are exposed to flooding and storms. Currently, North America has the highest volume of exposed economic assets, and Asia the largest proportion of exposed population. Economic and urban growth, natural and artificial subsidence, sea level rise and climate change will likely contribute to increasing this exposure dramatically, particularly in low and middle-income countries. Whereas the estimated exposure of economic assets is expected to increase from US$416 billion in Miami, United States of America, in 2005 to US$3,513 billion in 2070, in Mumbai, India, asset exposure would increase from US$46 billion to US$1,598 billion, and in Guangzhou, China, from US$84 billion to US$3,557 billion. In Dhaka, Bangladesh, it would increase from US$8 billion to an extraordinary US$544 billion. (GAR 2013, p. 48)
Guangzhou port. Photo source: econ274.academic.wlu.edu

Rationale for a post-2015 framework for disaster risk reduction
16 | Page
15 Potential staggering losses Patterns of risk have developed together with decades of economic development and globalization. The potential consequences of these risks represent a wake-up call: global average annual lossesv from earthquakes alone are estimated to exceed US$100 billion. Of these, 80 percent are concentrated in high-income countries. Probable maximum lossesvi for Japan and the United States of America in the case of a catastrophic one-in-250 year earthquake are over US$100 billion. In these countries, high exposure is the key driver of disaster risk. By contrast, in low and middle-income countries, vulnerability continues to determine risk levels. Philippines and Puerto Rico could lose more than 15 percent of their exposed capital stock to winds from a catastrophic one-in-250 year tropical cyclone. (GAR 2013, p. 52)
RISK MOUNTING LIABILITIES In Colombia, estimated annual disaster losses represent approximately 1 percent of GDP. Although this is less than the cost of cyclical unemployment, disaster losses are higher than the cost of 5 percent inflation and are comparable to the cost of armed conflict. Furthermore, the probable maximum disaster losses with return periods of 500 and 1,000 years represent costs of 2.3 percent and 2.9 percent of GDP, respectively, equivalent to the losses caused by the financial crises of the 1980s and 1990s. These figures indicate that disaster risk management should have a similar public policy importance as controlling inflation or resolving armed conflict if decision-making were based on a realistic assessment of the social and economic costs and benefits. In Nepal, the government is implicitly liable for losses amounting to US$1 million almost 10 times per year, and of almost US$100 million every second year. (GAR 2011, pp. 104-105)
Resilience challenge – filling the risk reduction and mitigation gap...
Evidence from the GAR 2009, 2011 and 2013
Page | 17
16 These accumulated risks result in a risk-financing gap
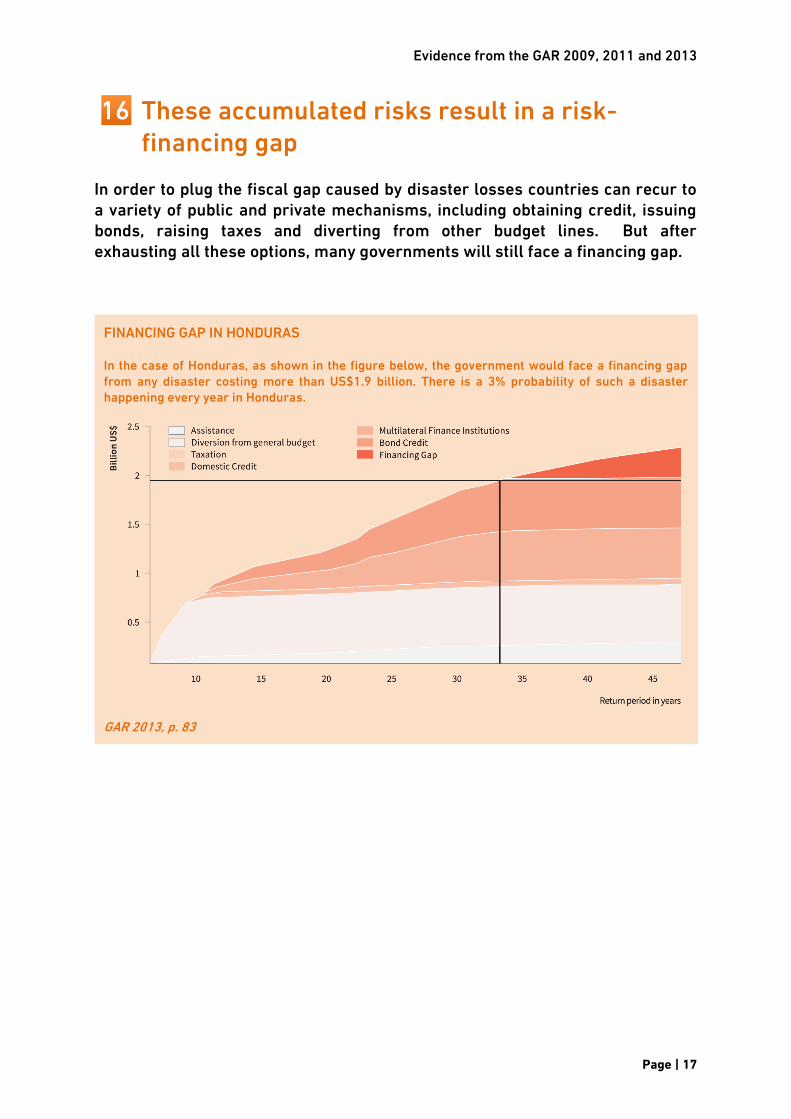
In order to plug the fiscal gap caused by disaster losses countries can recur to a variety of public and private mechanisms, including obtaining credit, issuing bonds, raising taxes and diverting from other budget lines. But after exhausting all these options, many governments will still face a financing gap.
FINANCING GAP IN HONDURAS In the case of Honduras, as shown in the figure below, the government would face a financing gap from any disaster costing more than US$1.9 billion. There is a 3% probability of such a disaster happening every year in Honduras.
GAR 2013, p. 83
Rationale for a post-2015 framework for disaster risk reduction
18 | Page
17 Need to address increasing exposure and accelerate vulnerability reduction — especially for extensive risk
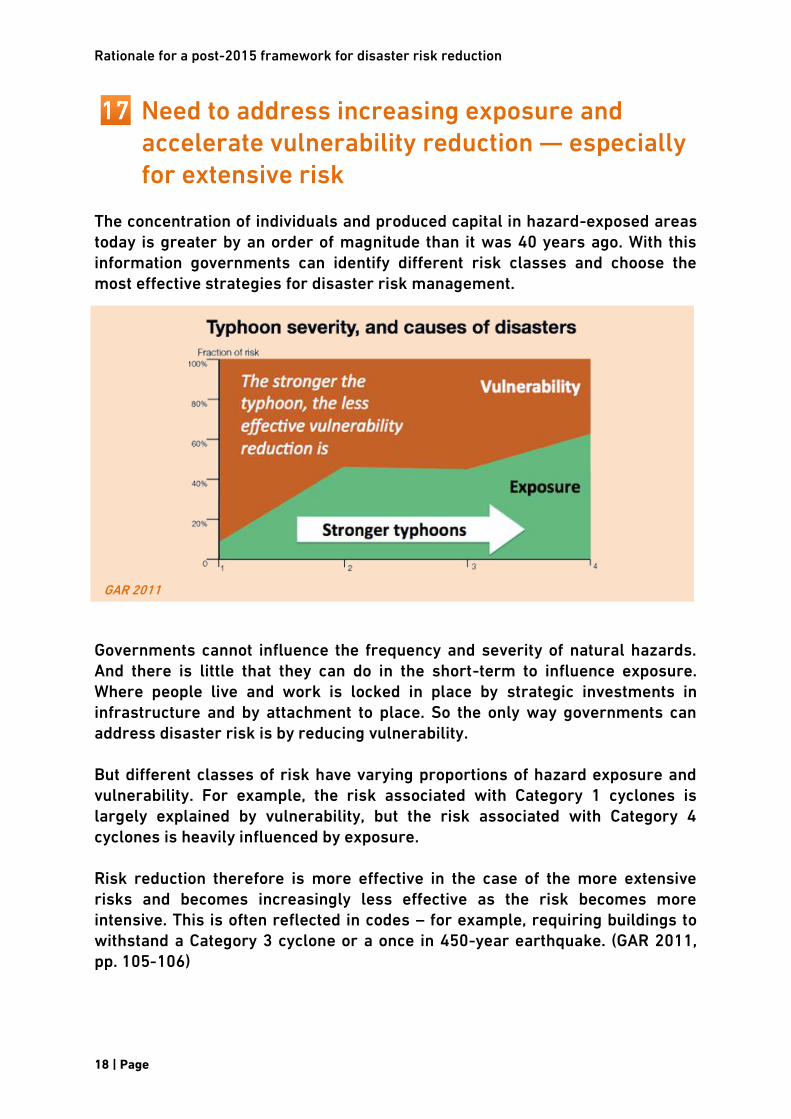
The concentration of individuals and produced capital in hazard-exposed areas today is greater by an order of magnitude than it was 40 years ago. With this information governments can identify different risk classes and choose the most effective strategies for disaster risk management.
GAR 2011
Governments cannot influence the frequency and severity of natural hazards. And there is little that they can do in the short-term to influence exposure. Where people live and work is locked in place by strategic investments in infrastructure and by attachment to place. So the only way governments can address disaster risk is by reducing vulnerability. But different classes of risk have varying proportions of hazard exposure and vulnerability. For example, the risk associated with Category 1 cyclones is largely explained by vulnerability, but the risk associated with Category 4 cyclones is heavily influenced by exposure. Risk reduction therefore is more effective in the case of the more extensive risks and becomes increasingly less effective as the risk becomes more intensive. This is often reflected in codes – for example, requiring buildings to withstand a Category 3 cyclone or a once in 450-year earthquake. (GAR 2011, pp. 105-106)

Evidence from the GAR 2009, 2011 and 2013
Page | 19
All governments are responsible for a stock of public assets. These include schools, health facilities, roads and infrastructure. At the same time, they are often the insurers of last resort for the houses and assets of low-income households and communities. Unfortunately, much public investment does not increase a country's stock of development assets – but its stock of risks and liabilities. GAR 2011 looked in detail at nationally reported disaster losses in 21 countries in Africa, Asia and Latin America. Of these losses, 46 percent of the schools, 54 percent of the health facilities, 80 percent of the roads and more than 90 percent of the water, sewer and power installations were damaged or destroyed in frequently occurring extensive disasters – losses, which ultimately governments are liable for. (GAR 2011, p. 102)
Damages to public infrastructure from intensive and extensive risks. Note: Red bars are damages from intensive risks while blue bars are damages from extensive risks. (GAR 2011)

Rationale for a post-2015 framework for disaster risk reduction
20 | Page
18 Risk prevention is more cost effective than risk mitigation
In the case of Colombia, a comparison of the cost–benefit ratios of improved land use planning, relocating exposed settlements, and retrofitting and mitigation measures showed that land use planning and improved building standards generate the largest ratio of benefits to costs. Although corrective risk management produces a positive benefit to cost ratio, it is clear that it is far more cost-effective to anticipate and avoid the buildup of risk than to correct it. Corrective risk management, however, is far more cost-effective when it is concentrated on the most vulnerable part of risk prone assets. In Mexico, for example, the ratio of benefits to costs when investing in strengthening risk-prone public buildings is far more attractive when it is focused on the most vulnerable 20 percent of the portfolio. (GAR 2011, p. 111)

Evidence from the GAR 2009, 2011 and 2013
Page | 21
19 We need to engage communities because they are most affected by — and can contribute to reducing — the impact of disasters
Poorer communities suffer a disproportionate share of disaster loss. Poor households are usually less resilient to loss and are rarely covered by insurance or social protection. Disaster impacts lead to income and consumption shortfalls and negatively affect welfare and human development, often over the long term. (GAR 2009, p. 7; p. 61) For example, investments in urban drainage to reduce extensive risk in informal settlements will be ineffective if the drains are not maintained, are obstructed with garbage, or are encroached upon by buildings. If the drainage is planned and built in partnership with local government and the affected communities, there is a far better chance of it being maintained and protected in the long-term. (GAR 2009, p. 181) Where communities, civil society organizations and governments enter into partnership, the scale of disaster risk management (DRM) efforts can be increased considerably. However, this requires a change in the administrative culture of many public departments: to accept that working directly with low-income communities in risk-prone areas must become the norm rather than the exception. A strong civil society can play a critical role in creating social demand for DRM, by ensuring political responsibility and increased accountability, mostly at local levels. Civil society organizations, where they have the ability and opportunity to organize and voice their positions, can reduce local risks while building political and economic imperatives for DRM. (GAR 2011, p. 144)
Need to engage stakeholders to reduce risks and build resilience...

Rationale for a post-2015 framework for disaster risk reduction
22 | Page
COMMUNITY-LED SYSTEM OF SOCIAL PROTECTION PROGRAMMES Rwanda’s highly decentralized administrative structure has allowed the country to develop an innovative community-led system for targeting social protection programmes. Rwanda has a good track record in social protection, including the provision of universal health insurance to 91 percent of the population, free education and several social transfers, including pension benefits. The new targeted approach, based on a traditional practice of collective action known as ubudehe, allows communities to identify beneficiaries of social protection based on locally relevant criteria, such as the size of land holding. Communities also suggest and lead area-specific programmes. Preliminary evidence shows that poor households can be directly involved in the planning and execution of social protection instruments and that even those usually without access to formal support can participate. (GAR 2011, p. 123)
Rwandan women who participated in a micro loan project Photo source: www.newstribune.com

Evidence from the GAR 2009, 2011 and 2013
Page | 23
20 We need to engage the private sector in disaster risk reduction because businesses are the greatest owners of risks, and we need their innovation to build resilience
Private investment largely determines disaster risk: in most economies 70–85 percent of overall investment is made by the private sector, including annual institutional investments worth more than US$80 trillion globally. Both regulators and investors are increasingly demanding that businesses disclose their hidden risks, including disaster risks. Seeking competitive advantages, large businesses have decentralized, outsourced or off-shored parts of their value chain to countries offering cheap labor, access to export markets, subsidized infrastructure, tax breaks and other benefits. This has been facilitated by dramatic reductions in the cost of transport and communications, new organizational models and by deregulation and liberalization of markets. While globalization has spurred economic growth, it has also dramatically increased the value of assets at risk. The value of produced capital in East Asia and the Pacific, for example, more than doubled from US$4.6 trillion in 1995 to US$10 trillion in 2005. Globally, USD 71 trillion of assets are exposed to one-in-250 year earthquakes. While both businesses and the countries they invest in have benefited from globalization, they are now sitting on a multi-trillion dollar stock of disaster prone assets – a new class of toxic assets. Recent major disasters such as Hurricane Sandy in 2012 and the 2011 floods in Thailand focused attention on the growing impact of disasters on the private sector. Many large global businesses are now strengthening their risk management capacities. Yet, businesses still display a ‘blind spot' to disaster risk, which is largely ignored in economic forecasts and growth projections. (GAR 2013)

Rationale for a post-2015 framework for disaster risk reduction
24 | Page
IN A GLOBALIZED WORLD, NO SUCH THING AS FAR AWAY FOR DISASTERS As the economy of Japan is highly integrated into the world economy, both direct and indirect supply disruptions caused by the Great East Japan Earthquake (2011) also were experienced elsewhere. The disaster caused declines in automobile production in the Philippines (-24%), Thailand (-20%) and Indonesia (-6%).
UNISDR, ESCAP, Asia Pacific Disasters Report 2012
Evidence from the GAR 2009, 2011 and 2013
Page | 25
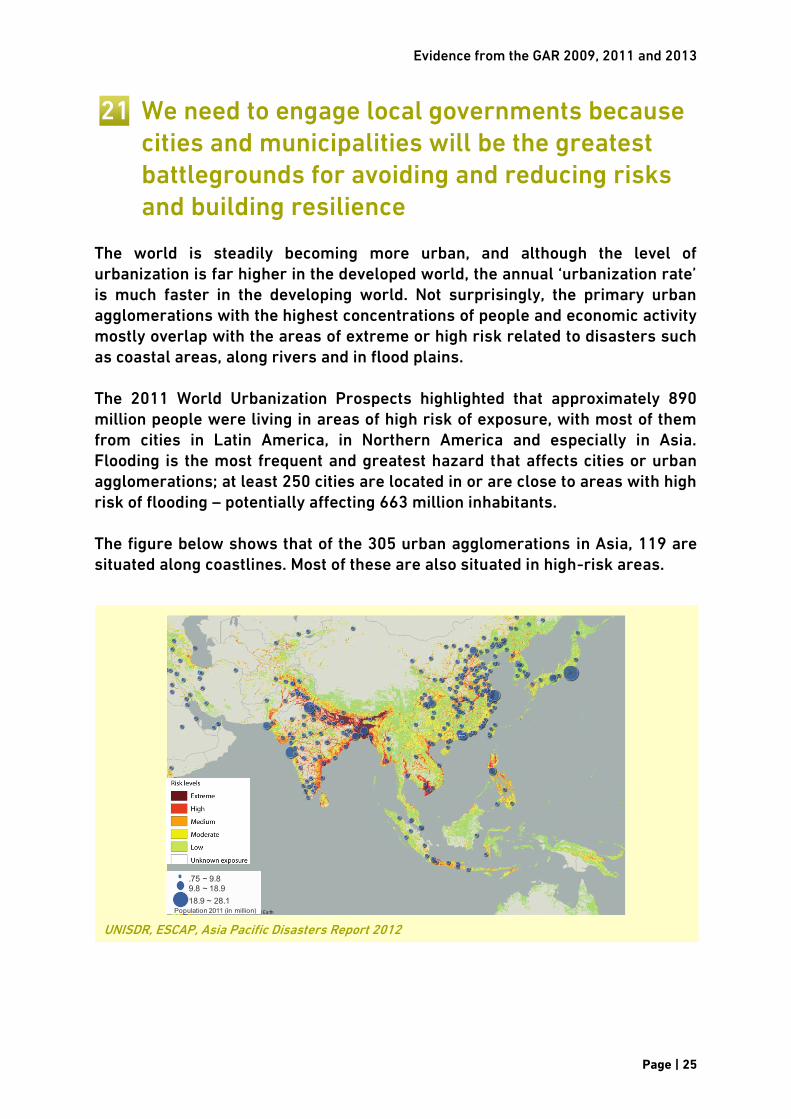
21 We need to engage local governments because cities and municipalities will be the greatest battlegrounds for avoiding and reducing risks and building resilience
The world is steadily becoming more urban, and although the level of urbanization is far higher in the developed world, the annual ‘urbanization rate’ is much faster in the developing world. Not surprisingly, the primary urban agglomerations with the highest concentrations of people and economic activity mostly overlap with the areas of extreme or high risk related to disasters such as coastal areas, along rivers and in flood plains. The 2011 World Urbanization Prospects highlighted that approximately 890 million people were living in areas of high risk of exposure, with most of them from cities in Latin America, in Northern America and especially in Asia. Flooding is the most frequent and greatest hazard that affects cities or urban agglomerations; at least 250 cities are located in or are close to areas with high risk of flooding – potentially affecting 663 million inhabitants. The figure below shows that of the 305 urban agglomerations in Asia, 119 are situated along coastlines. Most of these are also situated in high-risk areas.
UNISDR, ESCAP, Asia Pacific Disasters Report 2012

Rationale for a post-2015 framework for disaster risk reduction
26 | Page
In addition, GAR 2009 notes that poor urban governance drives urban risks. For example, safe land is in short supply driven by growing informal settlements, slums, and squatters, which in turn have limited infrastructure and services exacerbating disaster risks. Cities’ commercial, industrial and residential locations prove to be livelihood centre for urban poor, who are left with no choice but to settle on dangerous locations subject to natural or man-made hazards. (GAR 2009, p. 73)
DELHI METRO EXPOSED TO MULTIPLE RISKS A new metro line to connect Delhi, India, with a suburb has more than 50 stations located in areas of high earthquake hazard, exposing the line to earthquakes of up to a magnitude of 8 on the Richter scale. One of the stations was also built in a high flood hazard area. In both cases, hazard information was available on municipal zoning maps. As a result, the metro line is exposed to high flood and earthquake risk even for short return periods of 1-10 years. Decision-making for such large-scale infrastructure projects is a complex process in any country or city. But in planning and implementing such projects, disaster risks are constructed and then transferred to the ultimate users of the infrastructure. Despite awareness of earthquake and flood risk, much of the expansion of Delhi has taken place in highly hazard-prone areas. (GAR 2013, p. 132)
Delhi metro. Photo source: archive.indianexpress.com
Evidence from the GAR 2009, 2011 and 2013
Page | 27
From the evidence above it is now clear that we have only achieved part of the HFA's original objective, which is:
“The substantial reduction of disaster losses, in lives and in the social, economic and environmental assets of communities and countries.”
This means that the HFA is an unfinished business. The challenges for the post-2015 framework for disaster risk reduction (DRR) are:
Preventing the creation of new risk by the adoption of risk-informed
growth and development pathways that minimize increase in exposure and
vulnerability.
Reducing existing risk by actions that address and reduce exposure and
vulnerability.
Strengthening resilience by social and economic measures that enable
countries and people to absorb loss, minimize impact and recover.
Challenges for the post-2015 framework for disaster risk reduction (DRR)...

Rationale for a post-2015 framework for disaster risk reduction
28 | Page
A. Global Assessment Reports (GAR)
GAR 2009 - http://unisdr.org/s/fhwxv
GAR 2011 - http://unisdr.org/s/m674d
GAR 2013 - http://unisdr.org/s/6twtm
B. Data platform
Risk Data Platform – CAPRAViewer
Access CAPRAViewer: http://unisdr.org/s/yxvdk
Preview
Access Preview: http://preview.grid.unep.ch/
National Disaster Loss Data Collection
Access the National Disaster Loss Data Collection: http://unisdr.org/s/stecs
GAR for Tangible Earth - GfT Application
You can get the GfT App free from the AppStore: http://unisdr.org/s/7kxvr
C. HFA Monitoring & Review
HFA Regional Progress Reports
Regional HFA progress reports assess strategic priorities in the
implementation of disaster risk reduction actions and establish baselines on
levels of progress achieved in implementing the HFA's five priorities for
action.
Access HFA Regional Progress Reports: http://unisdr.org/s/p3ufm
Resources...

Evidence from the GAR 2009, 2011 and 2013
Page | 29
HFA National Progress Reports
National HFA progress reports assess strategic priorities in the
implementation of disaster risk reduction actions and establish baselines on
levels of progress achieved in implementing the HFA's five priorities for
action. You may search the HFA national reports by country and reporting
cycle, or in a more advanced manner using the query builder tool.
Access list of HFA National Progress Reports: http://unisdr.org/s/44yl6
Query builder
Create your own view of country national HFA progress by selecting, sorting
and comparing the data and information you wish to see. View it online or
download a spreadsheet.
Access the query builder: http://unisdr.org/s/l9lh7
HFA Progress Viewer Tool (2009 – 2011)
Interactive online tool to visualize HFA progress by country and HFA Priority
for Action as well as by indicator.
Access HFA Progress Viewer: http://unisdr.org/s/t7e6w
HFA Local Progress Reports
Local HFA progress reports assess strategic priorities in the
implementation of disaster risk reduction actions and establish baselines
on levels of progress achieved in implementing the HFA's five priorities for
action and the 10 essentials for making cities resilient.
Access HFA Local Progress Reports: http://unisdr.org/s/a4l5n

Rationale for a post-2015 framework for disaster risk reduction
30 | Page
i. HFA Priority for Action 4 defines underlying risks as disaster risks related
to changing social, economic, environmental conditions and land use, and
the impact of hazards associated with geological events, weather, water,
climate variability and climate change, which are addressed in sector
development planning and programmes as well as in post-disaster
situations.
(HFA, p. 10)
GAR 2009 specifically noted four underlying risk drivers that characterize
the accumulation of risks: (1) poor urban and local governance; (2)
vulnerable rural livelihoods; (3) decline of regulatory ecosystem ser¬vices;
and (4) lack of access to risk transfer and social protection.
(GAR 2009, p. 8)
GAR 2013 describes underlying risk drivers as development-related
processes such as badly planned and managed urban and regional
development, environmental degradation, poverty and inequality, climate
change and weak governance, which shape risk patterns and trends.
(GAR 2013, Glossary)
ii. GAR 2009 describes extensive risk as the geographically dispersed
exposure of vulnerable people and economic assets to mainly low or
moderate intensity hazard.
(GAR 2009, p. 5)
The UNISDR 2009 Terminology defines extensive risk as "the widespread
risk associated with the exposure of dispersed populations to repeated or
persistent hazard conditions of low or moderate intensity, often of a highly
localized nature, which can lead to debilitating cumulative disaster
impacts".
(UNISDR Terminology, 2009)
References...

Evidence from the GAR 2009, 2011 and 2013
Page | 31
iii. Corrective risk management refers to removing risks that are already
present before they manifest as loss. This may include relocating highly
exposed and vulnerable settlements, adapting and upgrading existing
facilities such as schools and hospitals, or restoring degraded ecosystems.
(GAR 2011)
iv. Prospective risk management includes better planning and is designed to
avoid the construction of new risks, such as land use planning, building
codes, environmental protection etc.
(GAR 2013)
v. Annual Average Loss (AAL) is the estimated average loss per year over a
long time period considering the range of loss scenarios relating to
different return periods.
vi. Maximum losses associated with events of specific return periods are
described as probable maximum losses (PML): for example, the maximum
loss that might occur once every 250 years would reflect a 0.4 percent
probability of the loss occurring in any given year.
(GAR 2013, Glossary)

Rationale for a post-2015 framework for disaster risk reduction
32 | Page
Evidence from the GAR 2009, 2011 and 2013
Page | 33
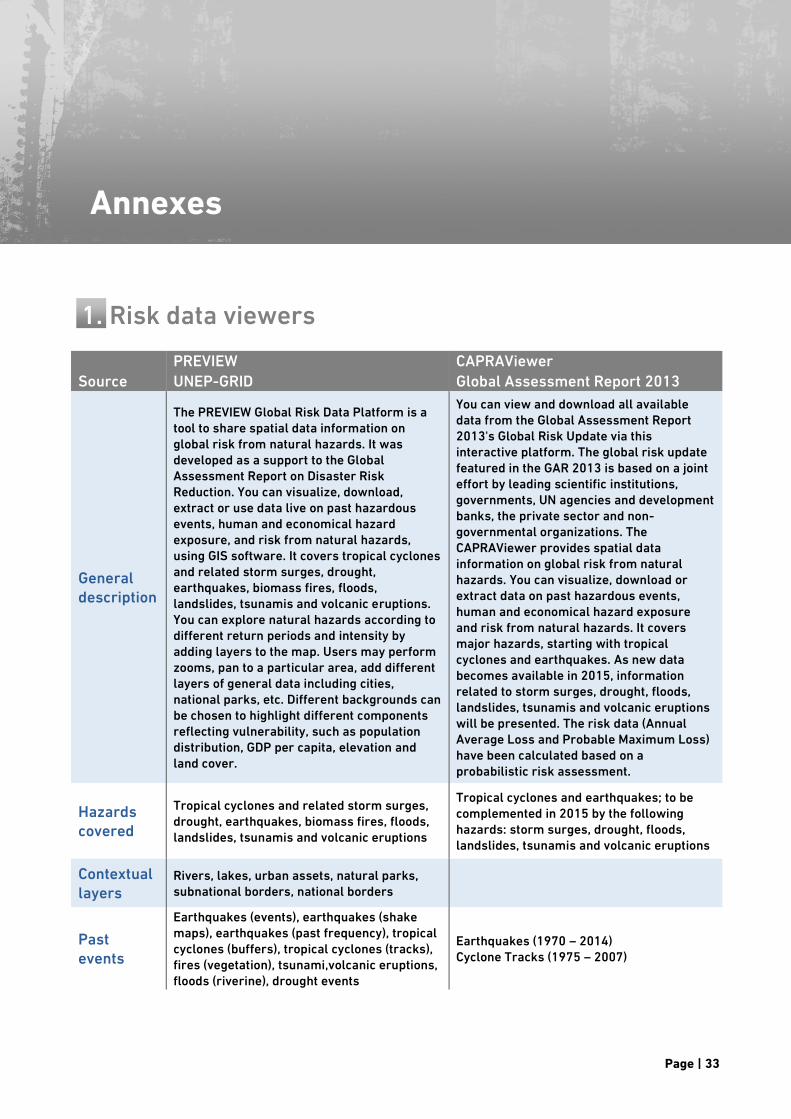
1. Risk data viewers PREVIEW CAPRAViewer
Source UNEP-GRID Global Assessment Report 2013
General description
The PREVIEW Global Risk Data Platform is a tool to share spatial data information on global risk from natural hazards. It was developed as a support to the Global Assessment Report on Disaster Risk Reduction. You can visualize, download, extract or use data live on past hazardous events, human and economical hazard exposure, and risk from natural hazards, using GIS software. It covers tropical cyclones and related storm surges, drought, earthquakes, biomass fires, floods, landslides, tsunamis and volcanic eruptions. You can explore natural hazards according to different return periods and intensity by adding layers to the map. Users may perform zooms, pan to a particular area, add different layers of general data including cities, national parks, etc. Different backgrounds can be chosen to highlight different components reflecting vulnerability, such as population distribution, GDP per capita, elevation and land cover.
You can view and download all available data from the Global Assessment Report 2013's Global Risk Update via this interactive platform. The global risk update featured in the GAR 2013 is based on a joint effort by leading scientific institutions, governments, UN agencies and development banks, the private sector and non-governmental organizations. The CAPRAViewer provides spatial data information on global risk from natural hazards. You can visualize, download or extract data on past hazardous events, human and economical hazard exposure and risk from natural hazards. It covers major hazards, starting with tropical cyclones and earthquakes. As new data becomes available in 2015, information related to storm surges, drought, floods, landslides, tsunamis and volcanic eruptions will be presented. The risk data (Annual Average Loss and Probable Maximum Loss) have been calculated based on a probabilistic risk assessment.
Hazards covered
Tropical cyclones and related storm surges, drought, earthquakes, biomass fires, floods, landslides, tsunamis and volcanic eruptions
Tropical cyclones and earthquakes; to be complemented in 2015 by the following hazards: storm surges, drought, floods, landslides, tsunamis and volcanic eruptions
Contextual layers
Rivers, lakes, urban assets, natural parks, subnational borders, national borders
Past events
Earthquakes (events), earthquakes (shake maps), earthquakes (past frequency), tropical cyclones (buffers), tropical cyclones (tracks), fires (vegetation), tsunami,volcanic eruptions, floods (riverine), drought events
Earthquakes (1970 – 2014) Cyclone Tracks (1975 – 2007)
Annexes

Rationale for a post-2015 framework for disaster risk reduction
Page | 34
PREVIEW CAPRAViewer
Source UNEP-GRID Global Assessment Report 2013
Exposure
Tsunami (population, economy), floods (population, economy), landslides (caused by earthquake/precipitation - population, economy), earthquakes (population, economy), tropical cyclones (population, economy), drought (population, economy)
Urban capital stock (buildings’ monetary value) Human exposure (population) Economic exposure (per country)
Hazard
Fires (vegetation) density, tsunami hazard, flood frequency (100 years), landslides (earthquake / precipitation), earthquakes (intensity), earthquakes (per ground acceleration) - return periods 250, 475, 1000, 1500, 2500 years), tropical cyclones (wind speed - 50, 100, 250, 500, 1000 years)
Tsunami hazard (run-up 500 year return period) Earthquake hazard (spectral acceleration) 250, 475, 1000, 1500, 2500 years Cyclone Wind hazard (50, 100, 250, 475, 500, 1000 years)
Background (map)
Satellite, elevation, MapQuest - Open Street Map, land cover, population (2010), GDP (2010)
Mortality risk
Landslides (precipitation), flood, earthquake, tropical cyclones
Annual Average Loss (AAL) and Probable Maximum Loss (PML) (risk data)
Earthquake Annual Average Loss Cyclone Wind Annual Average Loss Urban Capital Stock (buildings’ monetary value) Earthquake Probable Maximum Loss - 250 year return period Cyclone Wind Annual Average Loss - 250 year return period Earthquake Hazard (spectral acceleration) - 250 year return period Cyclone wind - 250 year return period
Graphs by hazard
Tropical cyclone: mortality risk index, economical risk index, vulnerability, percentage of people exposed, percentage of economy exposed Earthquake: mortality risk index, vulnerability, percentage of people exposed, percentage of economy exposed Flood: mortality risk index, economical risk index, vulnerability Landslide: mortality risk index, economical risk index, vulnerability, percentage of people exposed, percentage of economy exposed Multiple risk: mortality index
Evidence from the GAR 2009, 2011 and 2013
Page | 35
PREVIEW CAPRAViewer
Source UNEP-GRID Global Assessment Report 2013
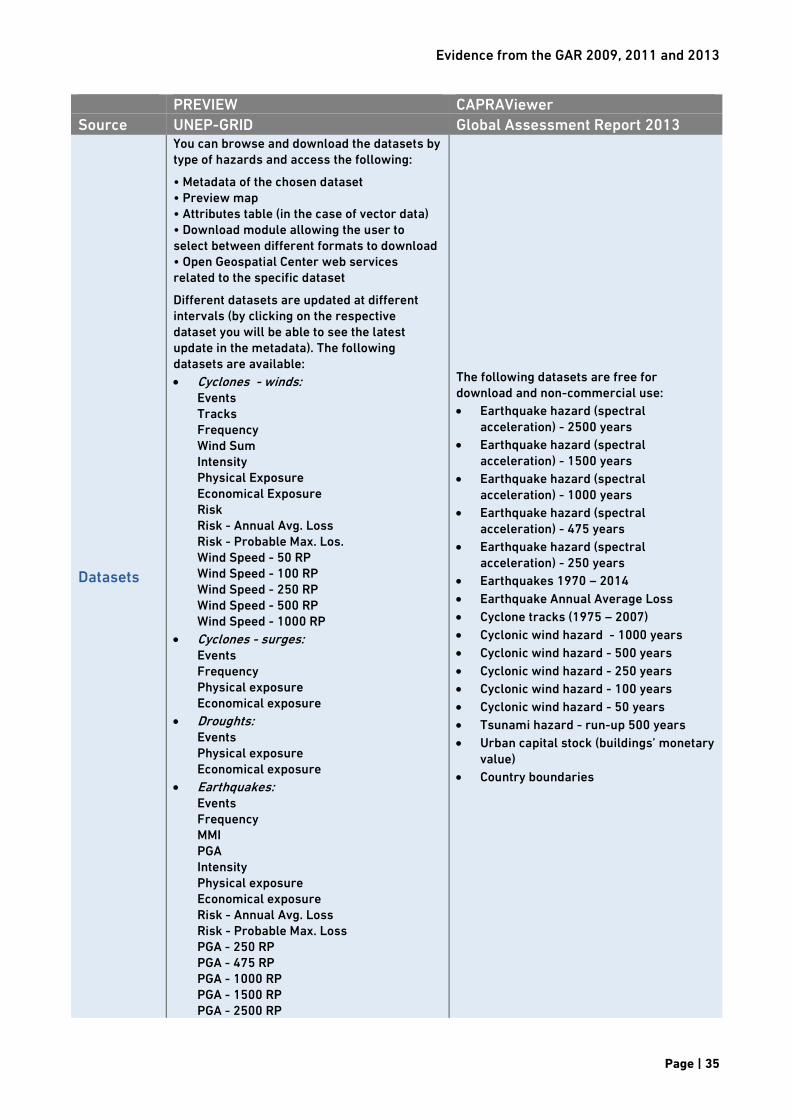
Datasets
You can browse and download the datasets by type of hazards and access the following:
• Metadata of the chosen dataset • Preview map • Attributes table (in the case of vector data) • Download module allowing the user to select between different formats to download • Open Geospatial Center web services related to the specific dataset
Different datasets are updated at different intervals (by clicking on the respective dataset you will be able to see the latest update in the metadata). The following datasets are available:
Cyclones - winds: Events Tracks Frequency Wind Sum Intensity Physical Exposure Economical Exposure Risk Risk - Annual Avg. Loss Risk - Probable Max. Los. Wind Speed - 50 RP Wind Speed - 100 RP Wind Speed - 250 RP Wind Speed - 500 RP Wind Speed - 1000 RP
Cyclones - surges: Events Frequency Physical exposure Economical exposure
Droughts: Events Physical exposure Economical exposure
Earthquakes: Events Frequency MMI PGA Intensity Physical exposure Economical exposure Risk - Annual Avg. Loss Risk - Probable Max. Loss PGA - 250 RP PGA - 475 RP PGA - 1000 RP PGA - 1500 RP PGA - 2500 RP
The following datasets are free for download and non-commercial use:
Earthquake hazard (spectral acceleration) - 2500 years
Earthquake hazard (spectral acceleration) - 1500 years
Earthquake hazard (spectral acceleration) - 1000 years
Earthquake hazard (spectral acceleration) - 475 years
Earthquake hazard (spectral acceleration) - 250 years
Earthquakes 1970 – 2014
Earthquake Annual Average Loss
Cyclone tracks (1975 – 2007)
Cyclonic wind hazard - 1000 years
Cyclonic wind hazard - 500 years
Cyclonic wind hazard - 250 years
Cyclonic wind hazard - 100 years
Cyclonic wind hazard - 50 years
Tsunami hazard - run-up 500 years
Urban capital stock (buildings’ monetary value)
Country boundaries

Rationale for a post-2015 framework for disaster risk reduction
Page | 36
PREVIEW CAPRAViewer
Source UNEP-GRID Global Assessment Report 2013
Datasets (continued)
Fires: Events Density Floods Events Frequency Physical exposure Economical exposure Risk
Landslides: Frequency - EQ Frequency - PR Physical exposure - EQ Physical exposure - PR Eco. exposure - EQ Eco. exposure - PR Risk
Tsunamis: Events Frequency Physical exposure Economical exposure Hazard - Max Area Flooded
Volcanoes: Events Multiple hazards Risk Socio-economics GDP Urban exposure
Data extraction
You can extract data by country or territory, or by region
Open Geospatial Consortium (OCG) web services
The PREVIEW Global Risk Data Platform is compliant with the OGC Web Services (OWS) and shares data through three types of services: - Map: use the Web Map Service (WMS) - Vector: use the Web Feature Service (WFS) - Raster: use the Web Coverage Service (WCS)
Results & Assets
Map Attributes (Shapefile-DBase table) This table is associated to a digital map in vector format and contains attributes that correspond to each geographic element
Link http://preview.grid.unep.ch/ http://unisdr.org/s/yxvdk

Evidence from the GAR 2009, 2011 and 2013
Page | 37
2. National Disaster Loss Database Collection
General description
DesInventar is a conceptual and methodological tool for the development of national disaster damage and loss databases. It was conceived in Latin America in 1994 as a system of historical information about disasters of small, medium and greater impact. The disaster information management system is based on pre-existing official data, academic records, newspaper sources and institutional reports. UNDP and UNISDR supported the implementation of similar systems in the Caribbean, Asia and Africa. Most of these countries have published this information as open data for the benefit of everyone. Currently, about 70 country disaster loss databases are available. It should be noted, however, that not all of these databases are regularly being updated.
Methodology
The DesInventar methodology includes the following criteria: • Standard definition of hazards and their impacts • Standard set of common indicators plus unlimited custom indicators • Wide coverage of disasters regardless of scale • Disaggregation of data into subnational units (county/ municipality) • Data collected and validated locally within the country
Country profile
Users can view country data by reported hazardous event, number of deaths, people affected, and houses damaged and destroyed. Disaster statistics including composition, spatial distribution and temporal behaviour of disasters are available. The spatial distribution as well as temporal behaviour of disasters is shown using maps and graphs as well as data tables. Disaster records are broken down to the local level, providing a detailed overview of their geographical distribution. Disaster statistics detailing the composition of disasters by hazard include the number of reported events, number of deaths, people injured, missing, affected, evacuated and relocated, number of houses destroyed and damaged, number of education centres and hospitals destroyed or damaged, economic losses, damages in crops, lost cattle and damages in roads.
View data You can view the data per each reported hazardous event.
Query You can query the data by selecting events and geographic units, and setting the options that specify the disasters you want to query.
Charts You can visualize data by generating charts according to the composition of disasters and their temporal behaviour, as well as perform a retrospective risk assessment by generating a Loss Exceedance Curve.
Statistics generator
You can generate your individual statistics by selecting the columns and functions that you would like to appear in the report.
Thematic map generator
You can generate your own map view by selecting the variables you would like to include (e.g. number of deaths, houses destroyed etc.).
Link http://unisdr.org/s/stecs

Rationale for a post-2015 framework for disaster risk reduction
Page | 38
3. GfT - GAR for Tangible Earth Application
General description
GAR for Tangible Earth, or GfT (“gift”), is a stand-alone application for tablet computers users, freely available from iTunes. The GfT is a dynamic and evolving interactive platform bringing the data behind the UNISDR Global Assessment Report on Disaster Risk Reduction (GAR) 2013 into vivid context. The application is capable of monitoring the planet in real-time. With a touch of a finger, users can request hourly weather updates or query the probability of seismic events for a given region. You can also make correlations between such phenomena as continental drift, El Nino, global warming and the growth of megacities. The application, developed by the Earth Literacy Program in Japan, is open-source, using a common graphic language accessible to any number of data sources. Additionally, a rich assortment of augmented reality (AR) icons sprinkled throughout the printed version of the GAR 2013 connect with the application via a GfT-installed tablet or smart phone device to activate a variety of dynamic information functions designed to enrich the reading experience.
Link http://unisdr.org/s/7kxvr