rational-optimism-p- (1)
TRANSCRIPT

Reasons to Be Optimistic about Living Today
NOT CONFIDENTIAL OR PROPRIETARY – ENTIRELY SHAREABLE Purpose+, Amstel 95, Amsterdam, The Netherlands
Rational Optimism

We are richer than ever before, with unparalleled GDP growth in recent decades...
0
5,000,000
10,000,000
15,000,000
20,000,000
25,000,000
1 1000 1500 1600 1700 1820 1870 1913 1951 1964 1976 1983 1991 1995 2002 2008
Africa
Asia
Latin America
Former USSR
East Europe
Western Offshoots
Western Europe
Real GDP over time in 1990 dollars by major world area; note that timescale is not lineair
Source: Angus Maddison Historical Statistics (www.ggdc.net), www.ourworldindata.org
Wealth

...rising much of our population out of the poverty that was considered normal for thousands of years...GDP per Capita, year 1
Source: Angus Maddison Historical Statistics (www.ggdc.net), www.ourworldindata.org
Above 25000
20000-24999
15000-19999
10000-14999
6000-9999
4000-5999
2000-3999
1000-1999
Below 1000
No data
Wealth

...into a state where poverty can theoretically be eradicated within the next 20 years*
Above 25000
20000-24999
15000-19999
10000-14999
6000-9999
4000-5999
2000-3999
1000-1999
Below 1000
No data
Source: Angus Maddison Historical Statistics (www.ggdc.net), www.ourworldindata.org
GDP per Capita, year 2008
* Prediction by the UN
Wealth

The pace of our growth keeps accelerating as well – doubling our world economy in years where it used to be centuries
...time it took to double the world economy...The type of society...
Pleistoceen hunter-gatherer society
Source: Robin Hanson, 2000; Superintelligence (2014), Nick Bostrom
Assuming a similar growth rate of the
economy as in the last 50 years will make us: • 4,8 times richer
than today in 2050 • 34 times richer
than today in 2100.
224.000 years
Farming society 909 years
industrial society 6,3 years
...and future predictions based on the trend
Wealth

Our life expectancy has increased more in the last century than in all of the previous evolution combined...
20
26 2825 26 26
31
49
67
0
10
20
30
40
50
60
70
80
10.000 BC
(Neolithic age)
3300-1 BC
(Bronze, Iron age)
500-300 BC
(Classical Greece)
450-50 BC
(Classical Rome)
1700 1820 1900 1950 2010
Life expectancy
Source: Galor et al. (2007) The Neolithic Revolution and Contemporary Variations in Life Expectancy; www.ourworldindata.org; Frier (2001) More is worse: some observations on the population of the Roman empire; www.wikipedia.org; CIA The World Factbook
Factor 2,4 difference
Industrial Revolution
Life expectancy

...and our global population is expected to reach it’s plateau before 2050
0
0.5
1.0
1.5
2.0
2.5
Actual Low fertility (est) Medium fertility (est) High fertility (est)
Source: UN, dep. of economic and social affairs, World Population Prospects: The 2012 Revision
Average annual rate of population growth
Life expectancy

Working hours have almost declined by half since the industrial revolution...
00
500
1,000
1,500
2,000
2,500
3,000
3,500
1870 1913 1950 1973 1990 1998
Austria
Denmark
Finland
France
Germany
Italy
Netherlands
Norway
Sweden
United Kingdom
Spain
Australia
Canada
United States
Argentina
Brazil
Source: www.ourworldindata.com
Free time

...allowing us to have more free time than ever before...
0
10
20
30
40
50
60
70
80
90
1900 1922 1975
Work
Free Time
Hours
Source: Stanley Lebergott, The Americans: An Economic Record (1984)
Average number of hours homemakers spend on work and free time
Free time

...which can free up time for things that are just fun to doTime spent watching ‘Gangnam Style’ on Youtube, in million man hours, data between July 2012 and June 2014
0 20 40 60 80 100 120 140 160
Empire State Building
Burj Khalifa
Stonehenge
The Great Pyramid
Aircraft Carrier (USS Gerald R. Ford)
London Olympic Park
Wikipedia
Watching Gangnam Style (YouTube)
Source: adapted from The Economist, June 2014
Free time

Just over 5% of our population works over 50 hours per week
00%
05%
10%
15%
20%
25%
30%
35%
40%
45%
50%
Rus
sia
Net
herla
nds
Sw
eden
Den
mar
k
Luxe
mbo
urg
Nor
way
Hun
gary
Finl
and
Can
ada
Irela
nd
Italy
Est
onia
Bel
gium
Gre
ece
Deu
tsch
land
Slo
veni
a
Sw
itzer
land
Spa
in
Slo
vaki
a
Pol
and
Cze
ch R
epub
lic
Por
tuga
l
OE
CD
Aus
tria
Fran
ce
US
A
Gre
at B
ritai
n
Bra
zil
New
Zea
land
Aus
tralia
Chi
li
Isra
el
Mex
ico
Turk
ey
2011 (or latest available)
Employees working long hours, % working more than 50 hours a week
Source: OECD, How’s Life? 2013
Free time

The literacy rate for the world has never been higher, with over 83% of the population literate
12
19 20 21 21 26
32
42 36
42
56 56
68
81 83
0
10
20
30
40
50
60
70
80
90
1820 1870 1880 1890 1900 1910 1920 1940 1950 1960 1970 1980 1990 2000 2010
Source: www.ourworldindata.org, Buring & Van Zanden (2009)
World literacy rate, % over time
World War II
Development

Human development – a composite measure of three key developmental trends - is growing rapidly all around the world...
0
0.1
0.2
0.3
0.4
0.5
0.6
0.7
0.8
0.9
1870 1880 1890 1900 1913 1929 1938 1950 1960 1970 1980 1990 2000 2007
OECD
Central & Eastern Europe
Latin America
China
India
North Africa
Sub-Saharan Africa
Human Development Index: composite measure of life expectancy, literacy and education, GDP growth
Source: Leandro Prados de la Escosura (2014), World Human Development: 1870-2007
Development

Everybody can start a business today – with the costs of a new tech startup a factor ~1000 lower than a decade ago...
5,000,000
500,000
50,000 5,000 0
1,000,000
2,000,000
3,000,000
4,000,000
5,000,000
6,000,000
2000 2005 2009 2011
Cost of launching a tech startup
Launching a tech startup became 1,000 times cheaper in just 11 years
Source: Mark Suster
Opportunities

...with the value of companies increasingly driven by intangibles, rather than the tangible assets companies possess
83% 68%
32% 20% 16%
17% 32%
68% 80% 84%
0%
20%
40%
60%
80%
100%
120%
1975 1985 1995 2005 2015
Tangible assets Intangible assets
Source: Ocean Tomo, LLC, 2015
Opportunities

We are less violent that ever before – with a chance of dying violently that is just a fraction of what it used to be
145010001000
970870
750740731
710590
550480
460450
420419
330320320
290240
230166160160
150140
7016.36.26.14.70.9
0 200 400 600 800 1000 1200 1400 1600Kato (1840s, California)
Grand Valley Dani (New Guinea)Piegan (North American Plains)
Dinka (1928, N-E Africa)Fiji (1860s, Melanesia)
Chippewa (1825-1832, Minnesota)Telefolmin (1939-1950, New Guinea)
Hewa (New Guinea)Buin (Salomon Is.)
Mtetwa (1806-1814, South Africa)Goilala (Papua New Guinea)
Dugum Dani (1961, New Guinea)Manga (1949-1956, New Guinea)
Modoc (California)Auyana (1924-1949, New Guinea)
Gebusi (New Guinea)Murngin (Australia)
Tauade (1900-1946, New Guinea)Mae Enga (1900-1950, New Guinea)
Yanomama (1938-1958, Brazil)Yurok (California)
Mohave (1840s, California, Arizona)Yanomamo (1970-1974)
Tiwi (1893-1903, Australia)Germany (1900-1990)
Russia (1900-1990)Boko Dani (1937-1962, New Guinea)
France (1800-1899)Americas (2013)
World (2013)California (2013)
United States (2013)The Netherlands (2013)
Source: www.ourworldindata.org, UN Office on Drugs and Crime
Chance of getting killed in California today is ~238 times smaller than centuries ago
Number of violent deaths per year, per 100,000 individuals
Peace

The risks of nuclear warfare have gone down significantly in the last decades – with nuclear stock diminishing in all areas
0
5,000
10,000
15,000
20,000
25,000
30,000
35,000
40,000
45,000
50,000
1945 1950 1955 1960 1965 1970 1975 1980 1986 1990 1995 2000 2005
United States
Russia
Britain
France
China
Cold war, 1947-1991
Total warhead number down by 60%
Source: www.ourworldindata.org
Peace
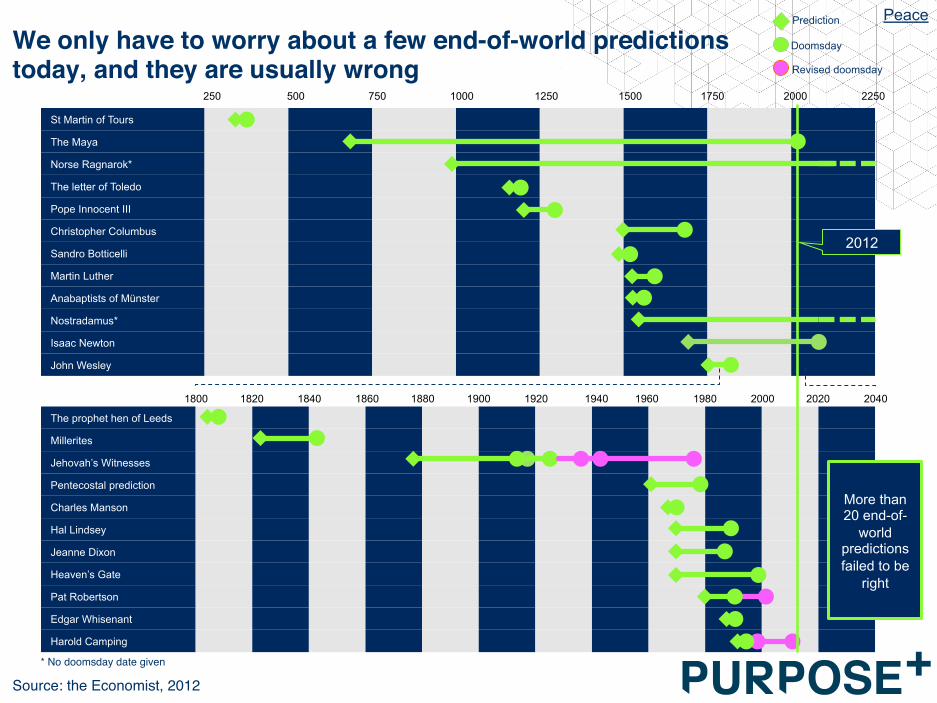
We only have to worry about a few end-of-world predictions today, and they are usually wrong
Source: the Economist, 2012
St Martin of Tours
The Maya
Norse Ragnarok*
The letter of Toledo
Pope Innocent III S
Christopher Columbus
Sandro Botticelli
Martin Luther
Anabaptists of Münster
Nostradamus*
Isaac Newton
John Wesley
The prophet hen of Leeds
Millerites
Jehovah’s Witnesses
Pentecostal prediction
Charles Manson
Hal Lindsey
Jeanne Dixon
Heaven’s Gate
Pat Robertson
Edgar Whisenant
Harold Camping
250 500 750 1000 1250 1500 1750 2000 2250
Prediction
Doomsday
Revised doomsday
1820 1840 1860 1880 1900 1920 1940 1960 1980 2000 2020 2040 1800
2012
More than 20 end-of-
world predictions failed to be
right
* No doomsday date given
Peace

The number of democracies is on the rise, and has gone up specifically since the 1970s
0 0 1 1 1 1 1 1 1 1 3 3 3 4 5 5 8 7 8 8 10 11 11 13
20 20 19 16
9
21 24 25
33 34 32 34 38
42
52
73 77
89 87
0
10
20
30
40
50
60
70
80
90
100
Source: www.ourworldindata.org, Buring & Van Zanden (2009)
Amount of democracies globally, absolute numbers over time
World War II
Breakdown of the Soviet Union
Freedom

Compared to the 1970s there is also a strong shift towards post-materialistic values
Source: Modernization, Cultural Change, and Democracy: The Human Development Sequence, Inglehart & Welzel (2005)
% post-materialist minus % materialists
-40
-30
-20
-10
0
10
20
U.S. Britain France West Germany
Italy Netherlands
1970
2000
Freedom
