ratio estimation(edited)
TRANSCRIPT

8/13/2019 Ratio Estimation(Edited)
http://slidepdf.com/reader/full/ratio-estimationedited 1/21
1
8/13/2019 Ratio Estimation(Edited)
http://slidepdf.com/reader/full/ratio-estimationedited 2/21
8/13/2019 Ratio Estimation(Edited)
http://slidepdf.com/reader/full/ratio-estimationedited 3/21
• Technology Oriented • Business Driven • Sustainable Development • Environmental Friendly
Note
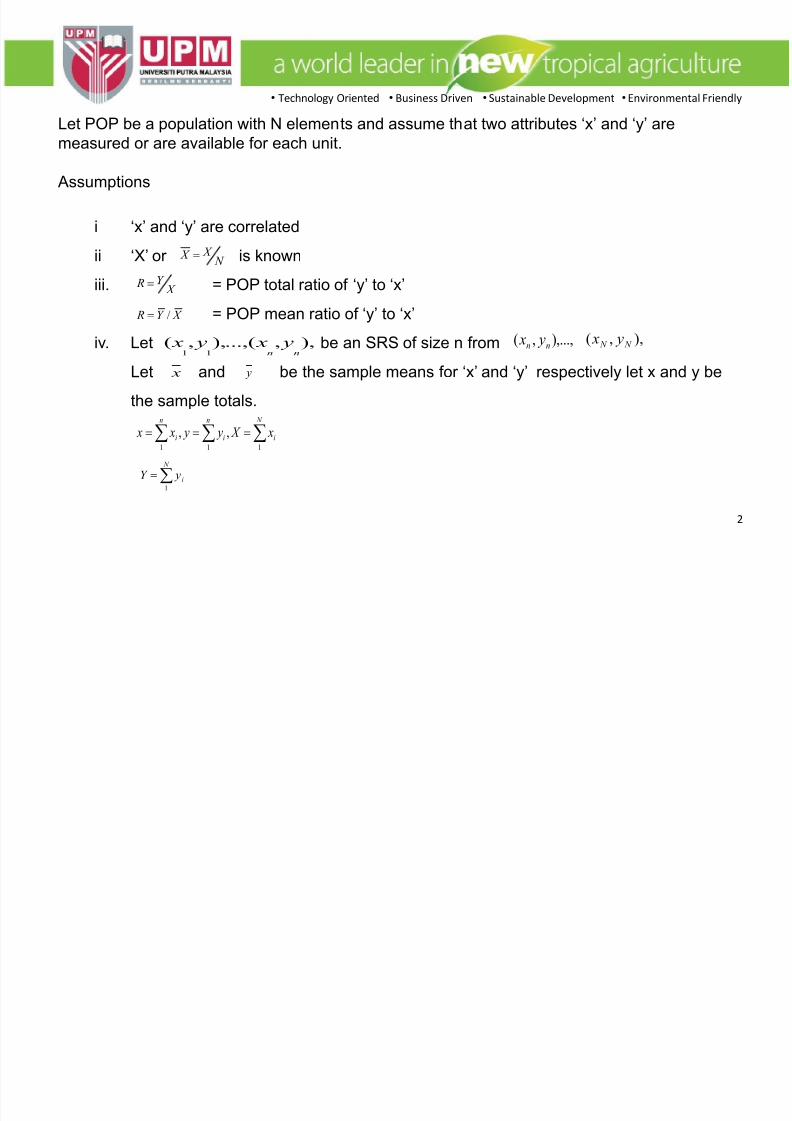
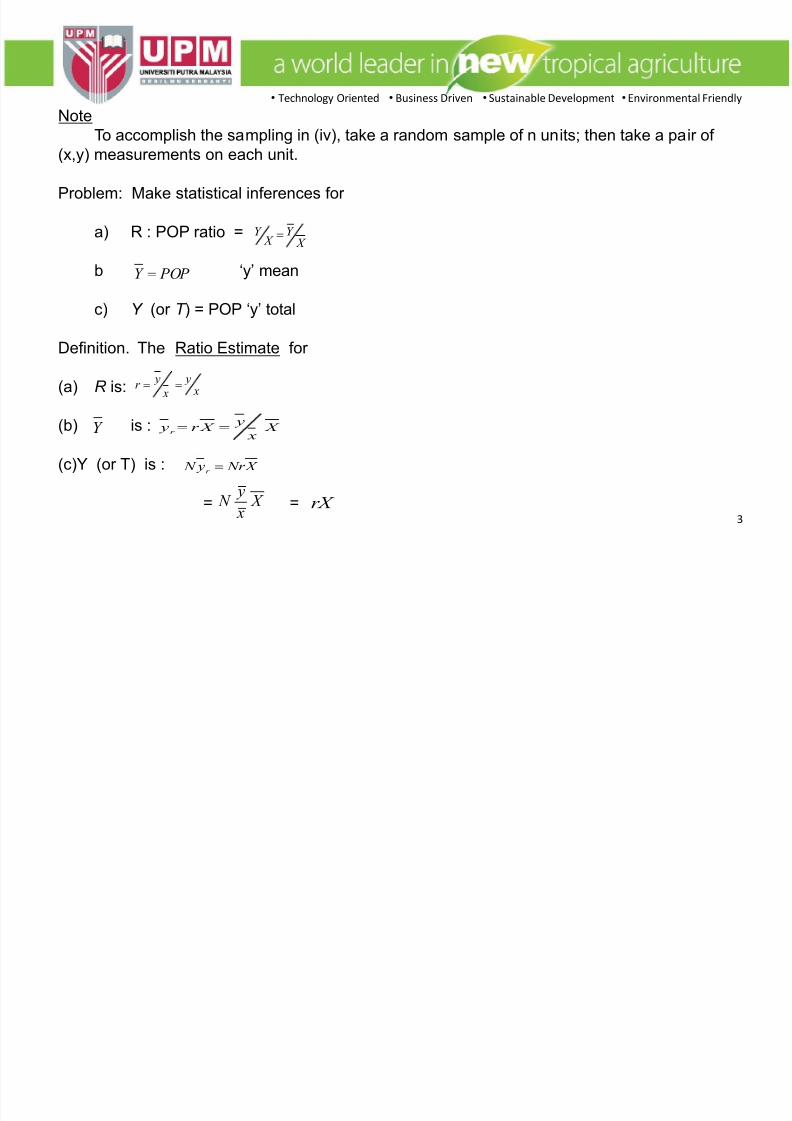
To accomplish the sampling in (iv), take a random sample of n units; then take a pair of(x,y) measurements on each unit.
Problem: Make statistical inferences for
a) R : POP ratio =
b ‘y’ mean
c) Y (or T ) = POP ‘y’ total
Definition. The Ratio Estimate for
(a) R is:
(b) is :
(c)Y (or T) is :
= =
X Y
X Y
POP Y
x y
x
yr
Y X x
y X r y
r
X Nr y N r
X x
y N rX
3
8/13/2019 Ratio Estimation(Edited)
http://slidepdf.com/reader/full/ratio-estimationedited 4/21
• Technology Oriented • Business Driven • Sustainable Development • Environmental Friendly
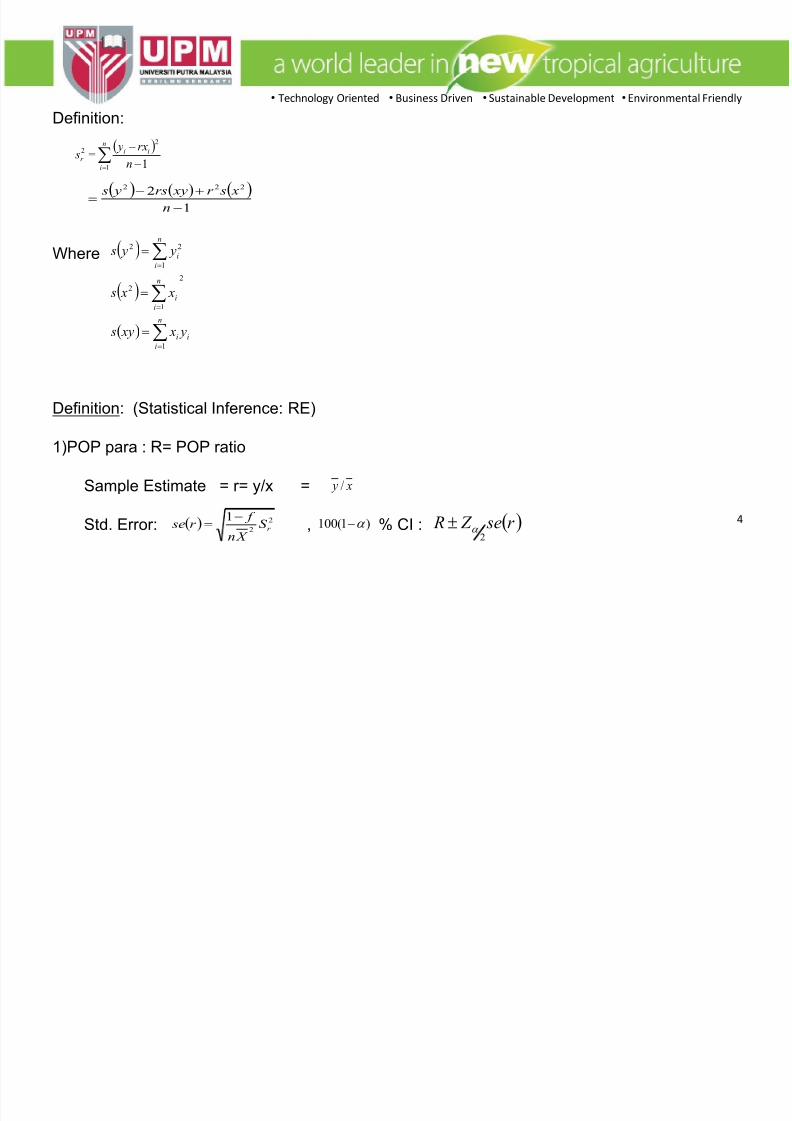
Definition:
Where
Definition: (Statistical Inference: RE)
1)POP para : R= POP ratio
Sample Estimate = r= y/x =
Std. Error: , % CI :
n
i
iir
n
rx y s
1
2
2
1
1
2 222
n
x sr xyrs y s
i
n
i
i
n
i
i
n
i
i
y x xy s
x x s
y y s
1
2
1
2
1
22
/ y x
2
2
1ˆ r S
X n
f r e s 100(1 ) r e s Z R ˆ
2 4

8/13/2019 Ratio Estimation(Edited)
http://slidepdf.com/reader/full/ratio-estimationedited 5/21
• Technology Oriented • Business Driven • Sustainable Development • Environmental Friendly
2) POP para : =POP mean
Sample estimate :
100 (1- ) % CI:
3) POP para: Y=POP total
sample estimate :
std. error:
100
Y
r
X y r X r
N
y X
x
21
ˆ r r
f se y S
n
2
ˆ r r y Z se y
r Ny NrX rX
ˆ ˆr r se Ny N se y
21r
f N S
n
r r y N e s Z y N CI ˆ:)%1(
2
5

8/13/2019 Ratio Estimation(Edited)
http://slidepdf.com/reader/full/ratio-estimationedited 6/21
• Technology Oriented • Business Driven • Sustainable Development • Environmental Friendly
Example
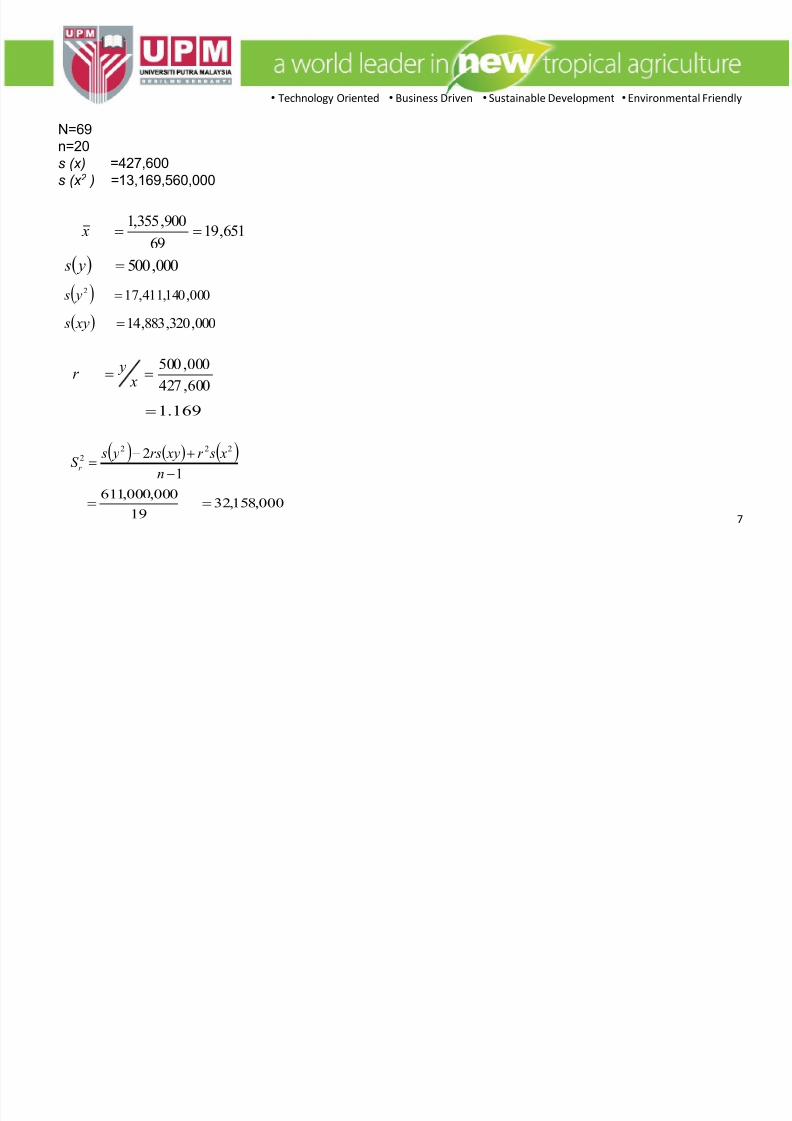
The POP ‘x’ of 69 urban areas of Greece are known from a previous census in 1941, the total
POP being X = 1,355,900. Twenty cities are selected at random and their present 1951 ‘y’
POP determined.
City X Y City X Y 1 12,200 12,600 11 15,600 22,400
2 29,000 25,700 12 32,300 41,000
3 7,000 10,800 13 15,300 13,100
4 14,100 18,500 14 30,400 29,500
5 49,700 42,100 15 13,900 17,700
6 13,000 14,800 16 62,300 79,000
7 8,700 11,900 17 15,000 17,600
8 19,800 33,800 18 21,700 23,600
9 34,700 36,800 19 9,100 12,900
10 15,100 22,100 20 8,300 12,100
6
8/13/2019 Ratio Estimation(Edited)
http://slidepdf.com/reader/full/ratio-estimationedited 7/21
• Technology Oriented • Business Driven • Sustainable Development • Environmental Friendly
N=69
n=20
s (x) =427,600
s (x 2 ) =13,169,560,000
651,1969
900,355,1 x
000,500 y s
000,140,411,172 y s
000,320,883,14 xy s
600,427
000,500
x yr
169.1
1
2 2222
n
x sr xyrs y sS r
000,158,3219
000,000,611
7

8/13/2019 Ratio Estimation(Edited)
http://slidepdf.com/reader/full/ratio-estimationedited 8/21
• Technology Oriented • Business Driven • Sustainable Development • Environmental Friendly
Goal:
i) Estimate the rate of growth
ii) Estimate the present POP Y
iii) Find a 95% CI for Y
Solution:
i) = Estimate for rate of growth
ii) = 69(1.169)(19.651)
= 1,585,069.311
iii)
∴ 95% CI for Y is 1,585,069,311 ± 1.96 (73731.34)
1,585,069.311 ± 144,513.42
169.1ˆ
r R
r Ny NrX
34.73731
000,158,3220
69/201
69
1ˆ
2
r r S
n
f N y N e s
8
8/13/2019 Ratio Estimation(Edited)
http://slidepdf.com/reader/full/ratio-estimationedited 9/21
• Technology Oriented • Business Driven • Sustainable Development • Environmental Friendly
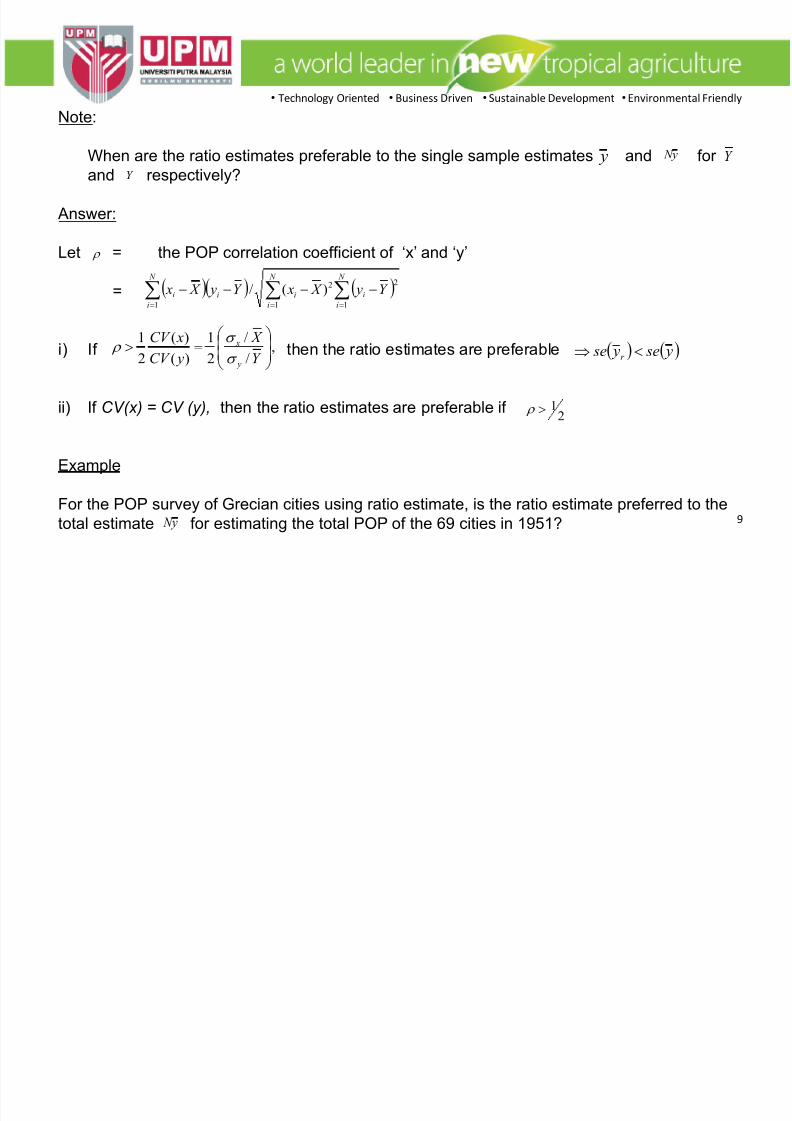
Note:
When are the ratio estimates preferable to the single sample estimates and for
and respectively?
Answer:
Let = the POP correlation coefficient of ‘x’ and ‘y’
=
i) If then the ratio estimates are preferable
ii) If CV(x) = CV (y), then the ratio estimates are preferable if
Example
For the POP survey of Grecian cities using ratio estimate, is the ratio estimate preferred to the
total estimate for estimating the total POP of the 69 cities in 1951?
y y N Y
Y
N
i
N
i
iii
N
i
i Y y X xY y X x1 1
22
1
)(/
,/
/
2
1
)(
)(
2
1
Y
X
yCV
xCV
y
x
ye s ye s r ˆˆ
2
1
Ny 9
8/13/2019 Ratio Estimation(Edited)
http://slidepdf.com/reader/full/ratio-estimationedited 10/21
• Technology Oriented • Business Driven • Sustainable Development • Environmental Friendly
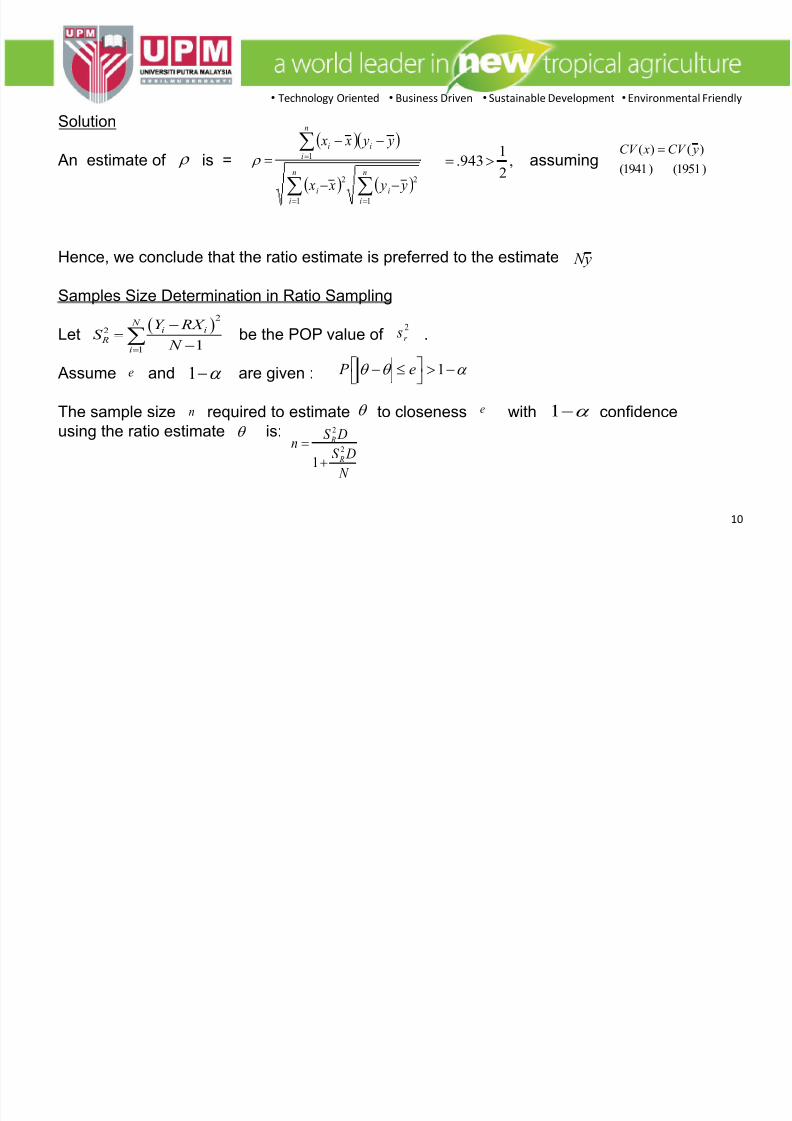
Solution
An estimate of is = assuming
Hence, we conclude that the ratio estimate is preferred to the estimate
Samples Size Determination in Ratio Sampling
Let be the POP value of .
Assume and are given :
The sample size required to estimate to closeness with confidenceusing the ratio estimate is:
n
i
n
i
ii
n
i
ii
y y x x
y y x x
1 1
22
1ˆ ,
2
1943.
)1951()1941(
)()( yCV xCV
y N
22
1 1
N i i
Ri
Y RX S
N
2
r s
1 ˆ 1 P e
n
e
1ˆ
N
DS
DS n
R
R
2
2
1
e
10

8/13/2019 Ratio Estimation(Edited)
http://slidepdf.com/reader/full/ratio-estimationedited 11/21
• Technology Oriented • Business Driven • Sustainable Development • Environmental Friendly
2
2
22
2
2
22
2
2
2
/
ˆ
e
Z N X Nr y N Y
e
Z X r r yY
X e
Z x yr R
D
r
- POP Ratio
- POP Mean
- POP Total
Example (Refer to handout)
Solution
i) The estimate of Y is
Note that: N is not needed to estimate Y
X x
y X
x
y N y N r
.246(1800)
.4.35
101.79 lbs
11
8/13/2019 Ratio Estimation(Edited)
http://slidepdf.com/reader/full/ratio-estimationedited 12/21
• Technology Oriented • Business Driven • Sustainable Development • Environmental Friendly
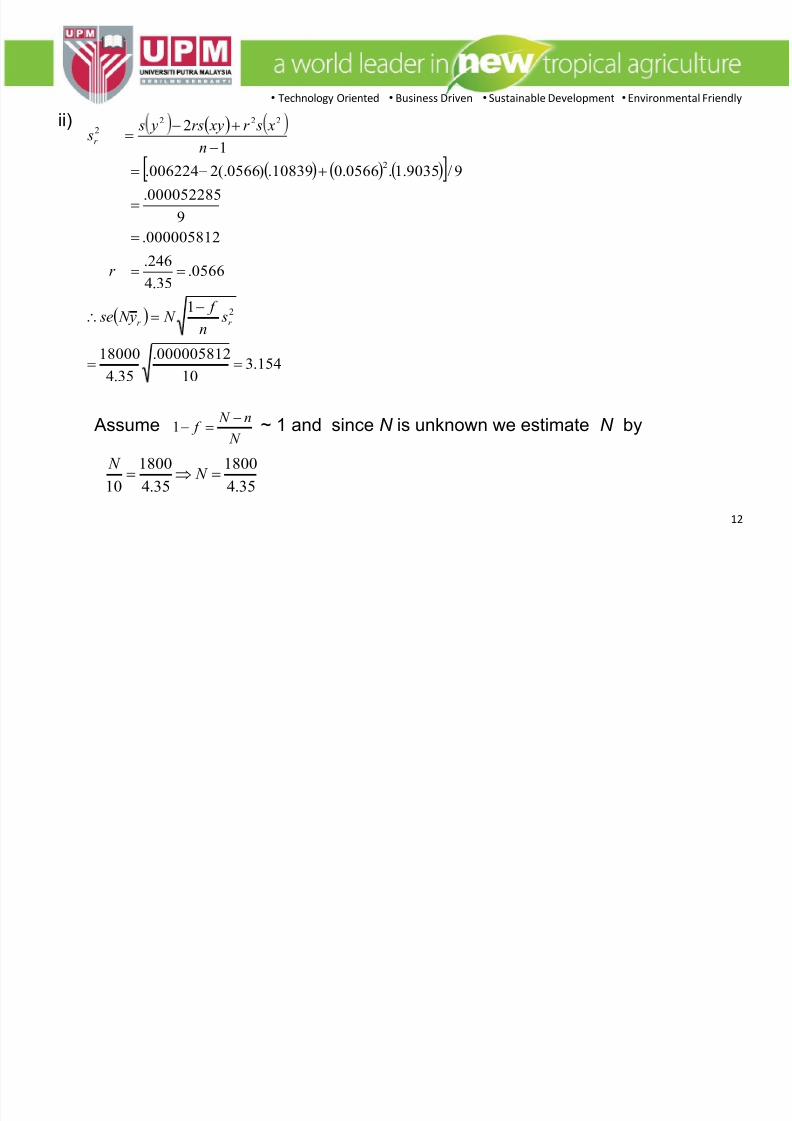
ii)
Assume ~ 1 and since N is unknown we estimate N by
154.310
000005812.
35.4
18000
1ˆ
0566.35.4
246.
000005812.
9
000052285.
9/9035.1.0566.010839.)0566(.2006224.
1
2
2
2
2222
r r
r
sn
f N y N e s
r
n
x sr xyrs y s
s
N n N f 1
35.4
1800
35.4
1800
10 N
N
12

8/13/2019 Ratio Estimation(Edited)
http://slidepdf.com/reader/full/ratio-estimationedited 13/21
• Technology Oriented • Business Driven • Sustainable Development • Environmental Friendly
Note
∴ A 95% CI for Y is
101.79 ± (1.96)(3.154)
101.79 ± 6.18 = (95.61, 107.97)
iii)
xnX N
x X
n N
22
2
2 2
2 2
2
2
,
1
.000005812
18000 413.8
4.35
4138 1.960.0000058129
42.48
42.48 42.4842.05
42.48 1.01031
4138
43
r
r
R r
r
D N Z S Dn
S D e
N
S is estimated with s
N is estimates by
s D
n
13

8/13/2019 Ratio Estimation(Edited)
http://slidepdf.com/reader/full/ratio-estimationedited 14/21
• Technology Oriented • Business Driven • Sustainable Development • Environmental Friendly
Ratio Estimation in Stratified Random Sampling
For the same reason indicated earlier, it is sometimes advantageous to stratify the POP before
using a ratio estimator. We will assume that we can take a large enough sample of both x’s
and y’s in each stratum for the variance approximation to work fairly well.
Basically, there are two different methods for constructing estimators of a ratio in stratified
sampling:-
1. Estimate the ratio of to within each stratum and then form a weighted average
of these separate estimates as a single estimate of the POP ratio. The result of this is
called a separate ratio estimator.
2. Estimate by the usual and similarly estimate
3. Then can be used as an estimator of This is called a combined ratio
estimator
strs strs X Y
strsY strs y strs strs X by x
strs
strs x y Y X
14

8/13/2019 Ratio Estimation(Edited)
http://slidepdf.com/reader/full/ratio-estimationedited 15/21
• Technology Oriented • Business Driven • Sustainable Development • Environmental Friendly
Separate Ratio method of .
Combined Ratio method of .
strsY
L
L
L L RS X
x
y
N
N X
x
y
N
N Y
...ˆ
1
1
11
1
1 1
22
1
2
1
11
11
2
1
1...
1
ˆˆ
n
i
n
i L
i Li
L L
L L Lii RS
l
n
xr y
n N
n N
N
N
n
xr y
n N
n N
N
N Y V
strsY
Ln
i L
ici
L L
L L L
n
i
ic
RC
strs
strs RC
n
xr y
n N
n N
N
N
n
xr y
n N
n N
N
N
Y V
X x
yY
1
22
1 1
2
1
11
11
2
1
1...1
ˆˆ
ˆ
1
15
8/13/2019 Ratio Estimation(Edited)
http://slidepdf.com/reader/full/ratio-estimationedited 16/21
• Technology Oriented • Business Driven • Sustainable Development • Environmental Friendly
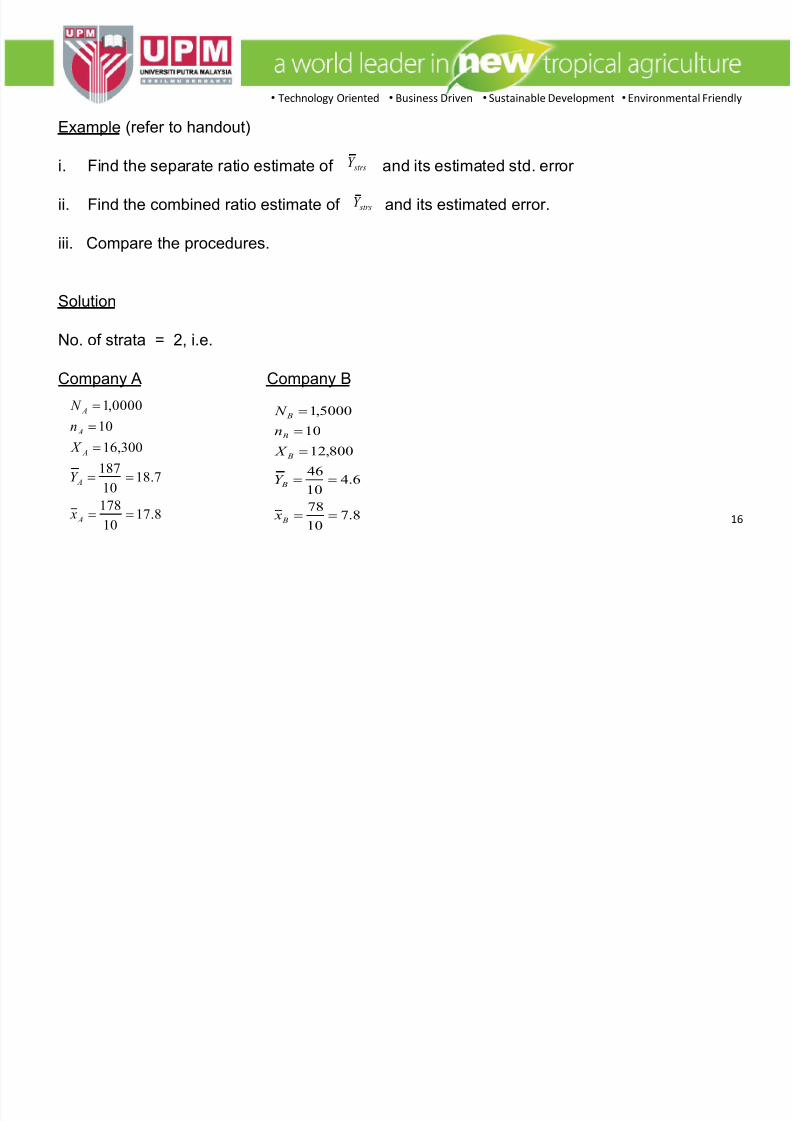
Example (refer to handout)
i. Find the separate ratio estimate of and its estimated std. error
ii. Find the combined ratio estimate of and its estimated error.
iii. Compare the procedures.
Solution
No. of strata = 2, i.e.
Company A Company B
strsY
strsY
8.1710
178
7.1810
187
300,16
10
0000,1
A
A
A
A
A
x
Y
X
n
N
8.710
78
6.410
46
800,12
10
5000,1
B
B
B
B
B
x
Y
X
n
N
16

8/13/2019 Ratio Estimation(Edited)
http://slidepdf.com/reader/full/ratio-estimationedited 17/21
• Technology Oriented • Business Driven • Sustainable Development • Environmental Friendly
i.
and similar calculations for Company B,
B
A
n
i B
i Bi
B B
B B B
n
i A
i Ai
A A
A A A RS
B
B
B B A
A
A A RS
n
xr y
n N
n N
N
N
n
xr y
n N
n N
N
N Y V
X x
y
N
N X
x
y
N
N Y
1
2
1
22
1
1
ˆˆ
87.9
500,1
800,12
8.7
6.4
500,2
500,1
000,1
300,16
8.17
7.18
500,2
000,1
ˆ
265.31
)24.4)(05.1(2)066.4()05.1(463,4
2
2
10
1
10
1
2210
1
10
1
22
iii A
i
ii Ai y xr xr y xr y
17
8/13/2019 Ratio Estimation(Edited)
http://slidepdf.com/reader/full/ratio-estimationedited 18/21
• Technology Oriented • Business Driven • Sustainable Development • Environmental Friendly
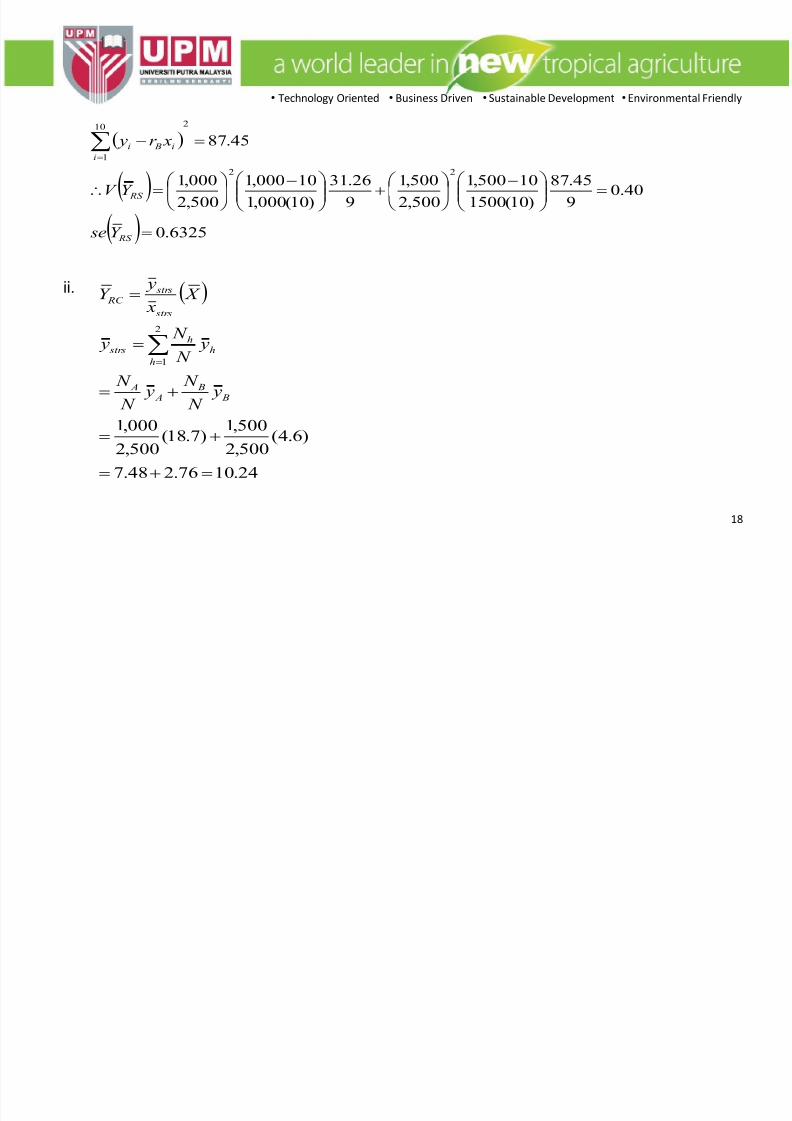
6325.0ˆ
ˆ
40.09
45.87
)10(1500
10500,1
500,2
500,1
9
26.31
)10(000,1
10000,1
500,2
000,1ˆˆ
45.87
22
210
1
RS
RS
i
i Bi
Y e s
Y V
xr y
ii.
24.1076.248.7
)6.4(500,2
500,1)7.18(
500,2
000,1
ˆ
2
1
B B
A A
h
hh
strs
strs
strs RC
y N
N y
N
N
y N
N y
X x
yY
18
8/13/2019 Ratio Estimation(Edited)
http://slidepdf.com/reader/full/ratio-estimationedited 19/21
• Technology Oriented • Business Driven • Sustainable Development • Environmental Friendly
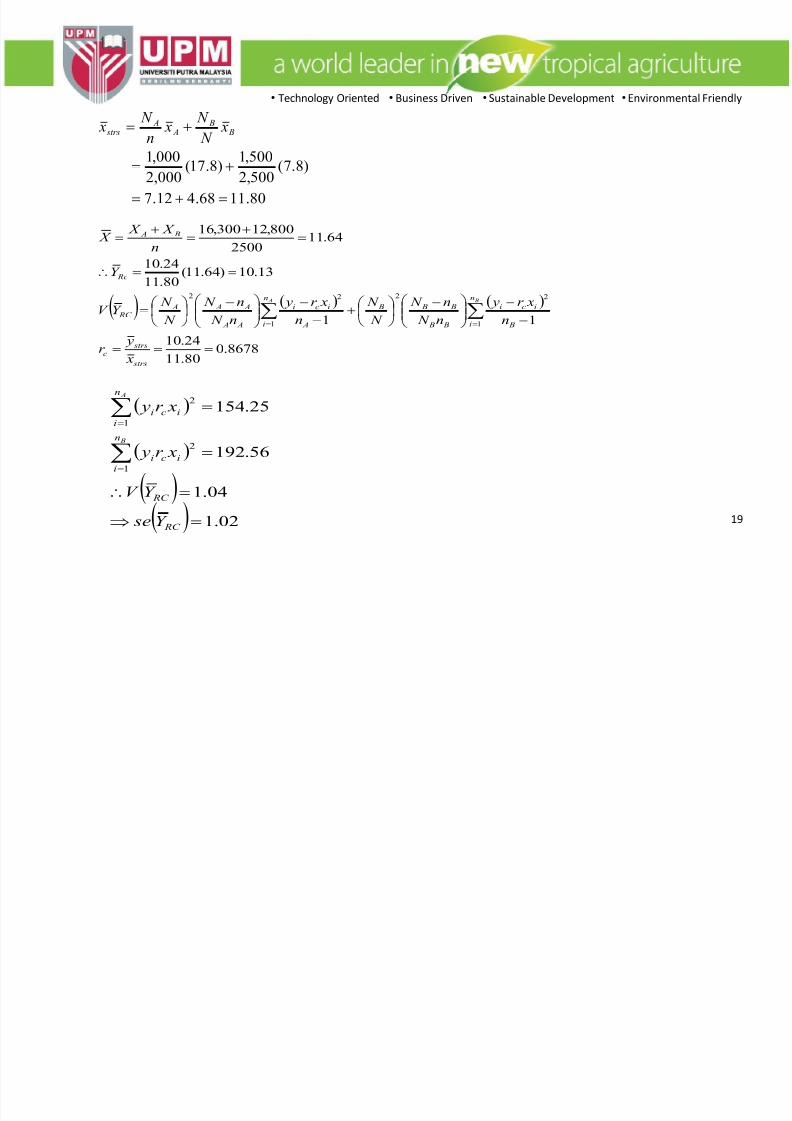
80.1168.412.7
)8.7(500,2
500,1)8.17(
000,2
000,1
B B
A A
strs x
N
N x
n
N x
8678.080.11
24.10
11
ˆˆ
13.10)64.11(
80.11
24.10ˆ
64.112500
800,12300,16
1
22
1
22
strs
strsc
n
i B
ici
B B
B B B
n
i A
ici
A A
A A A RC
Rc
B A
x
yr
n
xr y
n N
n N
N
N
n
xr y
n N
n N
N
N Y V
Y
n
X X X
B A
02.1ˆ
ˆ
04.1ˆˆ
56.192
25.154
1
2
1
2
RC
RC
n
i
ici
n
i
ici
Y e s
Y V
xr y
xr y
B
A
19
8/13/2019 Ratio Estimation(Edited)
http://slidepdf.com/reader/full/ratio-estimationedited 20/21
• Technology Oriented • Business Driven • Sustainable Development • Environmental Friendly
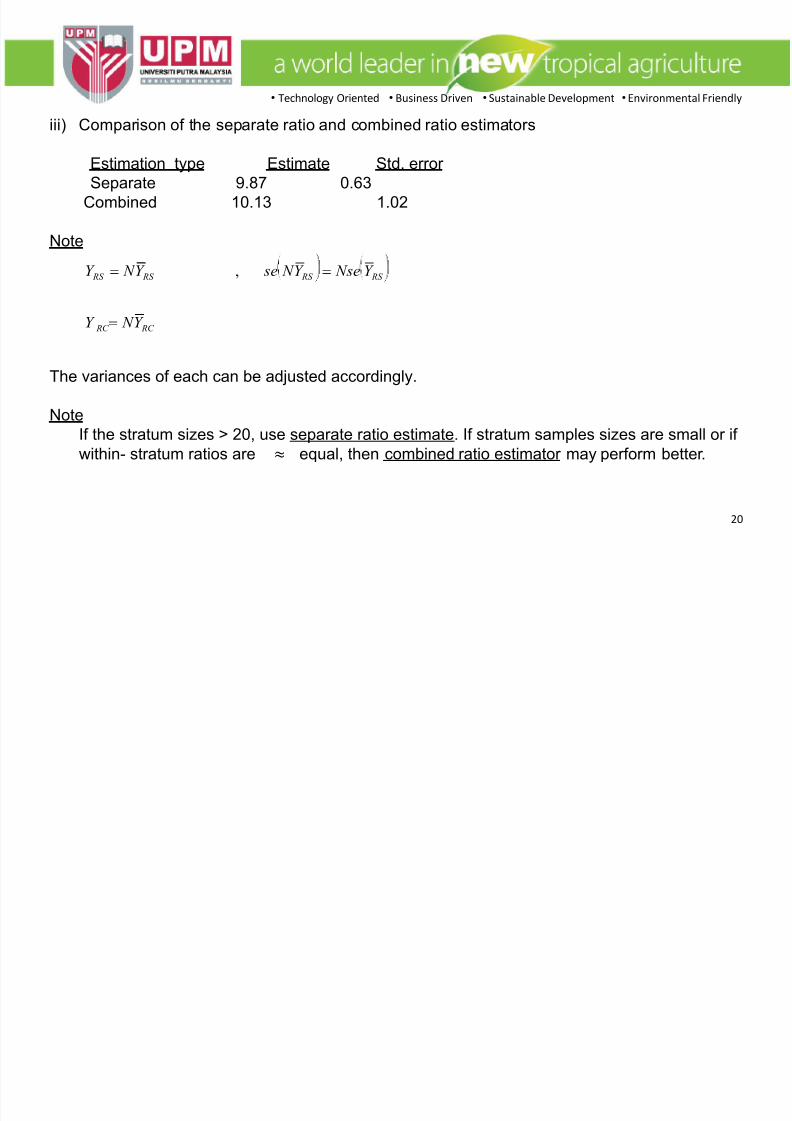
iii) Comparison of the separate ratio and combined ratio estimators
Estimation type Estimate Std. error
Separate 9.87 0.63
Combined 10.13 1.02
Note
The variances of each can be adjusted accordingly.
NoteIf the stratum sizes > 20, use separate ratio estimate. If stratum samples sizes are small or if
within- stratum ratios are ≈ equal, then combined ratio estimator may perform better.
RC RC
RS RS RS RS
Y N Y
Y e s N Y N e sY N Y
ˆˆ
ˆˆ
ˆˆ,ˆˆ
20

8/13/2019 Ratio Estimation(Edited)
http://slidepdf.com/reader/full/ratio-estimationedited 21/21
• Technology Oriented • Business Driven • Sustainable Development • Environmental Friendly
21