ratio analysis of standard chartered bank
TRANSCRIPT

Ratio Analysis of Standard Chartered
Bank
Standard Chartered Bank is a leading international banking group committed to building a sustainable business over the long-term. They operate in some of the world's most dynamic markets and have been working for over 150 years.
Date: 25/02/2015 Company: Standard Chartered Bank
Submitted By: Jannatul Ferdous, BRAC University

RATIO ANALYSIS OF STANDARD CHARTERED BANK
2 | P a g e
Internship Report
On
Ratio Analysis
Of
Standard Chartered Bank
Submitted To: Sohana Wadud Ahmad
Lecturer, BRAC Business School BRAC University
Submitted By
Jannatul Ferdous ID: 11104096
BRAC Business School BRAC University
RATIO ANALYSIS OF STANDARD CHARTERED BANK
3 | P a g e
February 25th, 2015
To
Ms. Sohana Wadud Ahmad
Lecturer
BRAC University
Mohakhali, Dhaka
Subject: Submission of Internship Report
Dear Madam,
With due respect, I would like to notify you that I have completed my Internship at Standard
Chartered Bank and also completed my report on “Ratio Analysis of Standard Chartered
Bank.” This particular report enables me to get an insight of the performance of SCB and how
they create value for their stake holders. I have analyzed some ratios and data to judge the
performance of SCB.
Finally, I would like to express my gratitude for your supportive thoughts and kind
consideration in making this report. At each stage, I have given my best efforts in preparing this
report. Without any doubt, this experience enriches my knowledge in a greater degree. It
would be very kind of you for examine my report work and give me further suggestions and
enhanced my clarification due to future prospects.
Regards
Jannatul Ferdous
11104096
RATIO ANALYSIS OF STANDARD CHARTERED BANK
4 | P a g e
• Mr. Aparup Barua , Internship Supervisor, Senior Manager PMI.
Acknowledgment
This internship report is an accumulation of many people’s endeavor. But at the beginning I
would like to convey my sincere appreciation to the almighty Allah for giving me the strength &
the ability to finish the task within the planned time. Then I like to express my sincere gratitude
to everyone who contributed towards preparing & making this study successfully. Major
contribution was received from the officers of Standard Chartered Bank as from the Cash
Management Operation department’s PMI Unit..
First of all I would like to express my Sincere & immense gratitude to my internship supervisor
Mrs. Sohana Wadud Ahmed, Lecturer of BRAC Business School, BRAC University. I am deeply
indebted to her whole hearted supervision to me during the Internship Period. Her valuable
suggestion & guideline helped me a lot to prepare the report in a well-organized manner.
I would also like to thank the authority of Standard Chartered Bank for giving me the
opportunity to do my internship in their well renowned bank. The experience & knowledge
gained in Standard Chartered Bank helped me to understand different elements related to my
study. I would like to give thanks to:
• Salahuddin Ahmad, Manager.
• Md.Tareq Hasan, Asst. Manager.
• Mustafa Reza Pahlovi, Officer.
• Mohammad Noor Hossain, Officer.
I am also grateful to each & every employees of these departments for their cordial acceptance.
They have been very helpful in showing me the work process and provided relevant
information for my report whenever I approached.
It was a great opportunity to do internship in Standard Chartered Bank Limited. The experience
I have gathered will be a privilege for my future career planning.

RATIO ANALYSIS OF STANDARD CHARTERED BANK
5 | P a g e
TABLE OF CONTENTS
CONTENTS
PAGE NUMBER
CHAPTER –ONE- SCB AT A GLANCE
5-22
1.1 Standard Chartered Bank, overview
6
1.2 History of SCB
7
1.3 Vision of SCB
7
1.4 Mission of SCB
7
1.5 objective of SCB
8
1.6 Brand Promise of SCB
8
1.7 Value of SCB
8
1.8 Priorities
8
1.8 Expansion of Standard Chartered Bank
• SCB at 1990’s • SCB in Middle East and South Asia • SCB in Hong Kong • SCB in Singapore • SCB in Malaysia • SCB in Africa • SCB in United Kingdom and USA • SCB in India Region • The Acquisition of ANZ Grind lays • SCB in Bangladesh • SCB International Network
9-14 10 10 10 11 11 11 11 12 12 12 14
1.9 Business Operations of SCB, in Bangladesh
15-18

RATIO ANALYSIS OF STANDARD CHARTERED BANK
6 | P a g e
1.9.1 Consumer Banking 1.9.2Corporate Banking Group 1.9.3 Cash Management Operations 1.9.4 Trade Finance 1.9.5 Custody and Clearing Service 1.9.6 Electronic banking 1.9.7 Lending 1.9.8 The Treasury Division
16 16 16 17 17 17 18
1.10 Organization Organ gram
21-22
CHAPTER - TWO - JOB RESPONSIBILITIES AT SCB
23-26
2.1 Nature of the job performed
24
2.2 Critical observations and recommendations
25
2.3 Limitations of my work
26
CHAPTER- THREE – DETAILS OF THE PROJECT
27-45
3.1 Objective of the report
28
3.2 Data collection Methodology
28
3.3Limitations of the Study
29
3.4 Scope of learning
30
3.5 Financial performance measure
31
3.6 Analysis
32-45
Conclusion 46
References 47
Appendix I 48-59
Appendix II 60-74
RATIO ANALYSIS OF STANDARD CHARTERED BANK
7 | P a g e
CHAPTER- ONE
SCB at a glance

RATIO ANALYSIS OF STANDARD CHARTERED BANK
8 | P a g e
1.1 STANDARD CHARTERED BANK; AN OVERVIEW:
Standard Chartered Bank (SCB) PLC is a multinational bank and a financial service group which
is incorporated in the UK with its Headquarters at 1 Alderman buries Square, London. By
serving the world for 150 years, it now spans in the developed and emerging economies of the
world. The group operations are mainly concentrated in Asia, Africa and the Middle East and its
operation is segmented under six regions: LTK, Europe, Middle East, South Asia, South East Asia
and the USA. SCB plays an invigorating role in linking the world economic trend with different
services under the big umbrella of retail banking, corporate banking, private banking, SME
banking and SAADIQ Islamic banking. Globally, the SCB group owns an array of key resources
that includes; a network of 600 offices in more than 50 countries; a staff of about 89,000 of 115
diverse nationalities helps to energize creativity and innovation, supporting the development of
exciting new services and products for the worldwide customers. At the global level, SCB
operates with some key strategies that are quite unique to other banks such as; to build and
grow strong businesses in Middle East, South Asia and Far East Asia. There vision for work, here
in this regions is, building unique position and image among the target customer segment and
being responsive to the needs and serve the needs better than the competitors.
Presently at this time of age Standard Chartered bank is at the centre of one of the greatest
challenges of time; their concentration is on how to generate enough growth and jobs for 7
billion people, and counting. With their firm footprint in Asia, Africa and the Middle East, they
are trying to meet the challenges by enabling trade and investment to flow to, from and within
some of the fastest-growing markets of the world.
Over the last decade, SCB has continuously served their clients and customers, shareholders
and communities. From 2002 to 2012, they have increased their lending from $57 billion to
$289 billion, increased the corporate tax contribution almost five fold and tripled their staff to
over 89,000.
RATIO ANALYSIS OF STANDARD CHARTERED BANK
9 | P a g e
In Bangladesh Standard Chartered Bank has started their operation in Chittagong, 1947. In the
year of 2000, it acquired ANZ Grind Lays bank for $1.34 billons. Now the bank serves with the
consumer banking and wholesale banking, managing 26 branches all over the country.
1.2 HISTORY OF STANDARD CHARTERED BANK IN BRIEF:
SCB has a history of more than 150 years. The name Standard Chartered has came from two
distinct original banks. The portions “STANDARD” and “Chartered” stems from the “Chartered
Bank” of India, Australia and China; the rest came from the “Standard Bank” of British South
Africa.
Chartered bank was established in 1853 by a Royal Charter granted by Queen Victoria of
England. The main person behind the Chartered Bank was a Scot, James Wilson. He kind of
foresaw the advantages of financing the growing trade links with the areas in the East, where
no other financial institution was present that time widely.
1.3
1.4
VISION OF SCB:
Vision of SCB is to focus on getting the basics of banking right making sure that they're
financially stable with strong governance, so that they can create value for their shareholders
and society in the long run. So, their brand promise is to be the right partner.
Mission of SCB is to run the operations well; standing by their clients and investing in local
communities by providing high quality products and services backed by latest technology and a
team of highly motivated personnel to deliver excellence in banking , so they can be a powerful
force for good.
MISSION OF SCB
RATIO ANALYSIS OF STANDARD CHARTERED BANK
10 | P a g e
1.5
SCB’s objective and brand promise is “Here for good”, and is the essence of who they actually
are. It's about sticking by their clients through good times and bad, and always trying to do the
right thing.
OBJECTIVE OF SCB
1.6
Standard Chartered Bank’s brand promise is “Here for good”, that underpins everything
they do.
BRAN PROMISE OF SCB:
1.7
As SCB strives to be the
VALUES OF SCB
world’s best international bank, it’s important to them that they
conduct their business to the highest standards and are guided by their core values. To do so
they act in an open, innovative and collaborative manner to advance the best interests of our
clients. SCB has five stated core values:
• Courageous
• Responsive
• International
• Creative
• Trustworthy
1.8 PRIORITIES
Standard Chartered Bank uses their business model to make a difference in three ways:
By contributing to sustainable economic growth; providing finance efficiently
and responsibly, they contribute to sustainable economic growth and job

RATIO ANALYSIS OF STANDARD CHARTERED BANK
11 | P a g e
creation. They are committed to supporting the clients and customers; helping
businesses to set up, expand and trade across borders.
Being a responsible company they want to deliver long-term value for
shareholders and society. This means having the right culture, structures and
processes in place to ensure that they practice strong governance, serve the
clients and customers well and provide a great workplace for their people.
Investing in communities; their sustainability as a business is closely intertwined
with the health and prosperity of the communities where they operate. Through
the employee volunteering and community investment programs they work with
partners to deliver programs that promote positive social and economic
outcomes for people in their wide markets.
1.8 EXPANSION OF STANDARD CHARTERED BANK:
• Expansion in Africa and Asia:
The Standard Bank opened for business in Port Elizabeth, South Africa, in 1863. It followed a
policy of expansion and soon amalgamated with several other banks including the Commercial
Bank of Port Elizabeth, the Coles berg Bank and the British Kaffarian Bank. The Standard Bank
was prominent in the financing and development of the diamond fields of Kimberly in 1867 and
later extended its network further north to the new town of Johannesburg when gold was
discovered there in 1885.
• Standard Chartered in the 1990s

RATIO ANALYSIS OF STANDARD CHARTERED BANK
12 | P a g e
Within the period of apparent retrenchment during the First and Second World War Standard
Chartered Bank expanded its network, re-opening in Vietnam in 1990, Cambodia and Iran in
1992, Tanzania in 1993 and Myanmar in 1995. Standard Chartered now has an office in every
country in the Asia Pacific Region with the exception of North Korea.
In 1998 Standard Chartered concluded the purchase of a controlling interest in Banco Exterior
de Los Andes (Extebandes), an Andean Region bank involved primarily in trade finance.
• Standard Chartered in Middle East & South Asia;
The MESA region performed well in year 2002. The region accounts for approximately 11% of
the group’s revenues. The integration of Grind Lays was successfully completed and the group is
now one of the leading international banks in each of its chosen markets in the region. The
contribution of the Group’s business in the United Arab Emirates reflects the businesses.
Standard Chartered now holds leadership positions in most of its key product segments in the
UAE. The average number of employees in the Middle East and other South Asia region in 2002
was 2995.
• Standard Chartered in Hong Kong:
Hong Kong remains the Group’s largest market, generating one third of the Group’s revenue.
They have a network of 74 branches. Standard Chartered has been transacting business in Hong
Kong since 1858 and they issue bank notes there. In 2002, Standard Chartered became the first
FTSE 100 Company to launch a new dual primary listing in Hong Kong.
• Standard Chartered in Singapore:

RATIO ANALYSIS OF STANDARD CHARTERED BANK
13 | P a g e
Standard Chartered has been doing business in Singapore for 144 years and has 20 branches and
offices, the largest branch network among foreign banks. The business in Singapore accounts for
approximately 11% of the Group’s revenues. Standard Chartered has Qualifying Full Bank Status,
which has enabled expansion of the distribution network. In 2002, Asian banker magazine
named Standard Chartered the ‘Best Retail Bank in Singapore’.
• Standard Chartered in Malaysia:
Standard Chartered is the oldest bank in Malaysia, where there is a network of 29 branches. The
group continues to expand its Shared Service Center that was opened in 2001 and carries out
operations and processing activity. The Centre in Kuala Lumpur has contributed significantly to
improvements in the Group’s processing and service efficiency.
• Standard Chartered in Africa:
Standard Chartered continues to be one of the leading banks in sub Saharan Africa. The group
offers consumer banking and wholesale banking services in 13 African countries with a network
of 149 branches and offices. Standard Chartered recently launched operations in the Ivory Coast
and re-entered Nigeria. The average number of employees in 2002 was 5009.
• Standard Chartered in United Kingdom and the United States of America:
Businesses in the United Kingdom and the Americas provide services to leading multinationals
and major financial institutions, which trade or invest in Asia, Africa, the Middle East and Latin
America. In 2003, the businesses in the Americans were extensively restructured to improve
efficiency for future growth. The Group also operates a growing off shore banking business
based in Jersey. The average number of employee in the United Kingdom and America in 2002
was 2098.

RATIO ANALYSIS OF STANDARD CHARTERED BANK
14 | P a g e
• Standard Chartered in India Region:
Standard Chartered is the largest international bank in India and, following successful
completion of the integration of Grind Lays, have a combined customer base of 2.4 million in
Consumer Banking and over 1200 corporate customers in Wholesale Banking. The shared
service centre in Chennai continues to develop rapidly as more services and processes are
migrated from other countries. The average number of employees in the India region in 2002
was 5251.
• The Acquisition of ANZ Grind Lays by Standard Chartered:
The main idea behind acquisition and merger is making an investment and usually involves more
than mere cash. When two separate legal entities merge every organization aspect of both
companies is expected to change be it internal or external. Such management decision is taken
for a variety of reasons but the ultimate aim is to add up to shareholder’s wealth. For banks
operating in the consumer and wholesale banking sector, earning depends largely on the
interest margin as well as the service charges.
• Standard Chartered Bank in Bangladesh
The Chartered Bank started operating in Bangladesh in 1947, opening a branch in
Chittagong. The branch was opened mainly to facilitate the post-war reestablishment and
expansion of South and Southeast Asia. The Chartered Bank opened another branch in Dhaka
in 1966, where it is still headquartered. After the merger of the Chartered Bank with the
Standard Bank in 1969, the Standard Chartered Bank took up a program of expansion. It
increasingly invested in people; technology and premises as its business grew in relation to the
country’s economy. In 1993, there was an organizational re-structuring, which led to a

RATIO ANALYSIS OF STANDARD CHARTERED BANK
15 | P a g e
substantial expansion of the Bank’s business. Today the bank has in total four branches in
Dhaka apart from the Chittagong branch, including an offshore branch at the Savar Export
Processing Zone.

RATIO ANALYSIS OF STANDARD CHARTERED BANK
16 | P a g e
STANDARD CHARTERED INTERNATIONAL NETWORK

RATIO ANALYSIS OF STANDARD CHARTERED BANK
17 | P a g e
1.9 BUSINESS OPERATIONS OF STANDARD CHARTERED BANK; IN BANGLADESH:
The IBG of Standard Chartered Bank offers a wide variety of products and services to the banks
and financial institutions. It has global links with leading banking institutions and agency
arrangements through its network of offices in 40 countries.
The Bank offers a full range of clearing, payment collection and import-export handling
services. The bank offers foreign missions, voluntary organizations, consultants, airlines,
shipping lines, and their personnel the following financial services:
• Current accounts in both Taka and other major foreign currencies
• Convertible Taka accounts (these funds are freely convertible to major international
currencies)
• Local and foreign currency remittances etc.
SCB Bangladesh has two main functional areas to perform its business.
Those are:
A. Business
B. Support
SCB Bangladesh can be divided into the following business areas
• Consumer banking
• Wholesale banking
• Treasury
• Institutional banking
• Custodial service

RATIO ANALYSIS OF STANDARD CHARTERED BANK
18 | P a g e
In our country, corporate banking division has historically contributed more to revenue and
profits compared to customer banking division.
The support division of SCB Bangladesh contains the following departments:
• Operations
• Finance, administration and risk management
• Information technology
• Human resources
• Legal and compliance
• External affairs
• Management
Products and Services of the Bank:
Standard Chartered Bank has highly qualified professional staff members who have the
capability to manage and meet all the requirements of the bank. Every account is assigned to
an Account Manager who personally takes care of it and is available for discussion and
inquiries, whether one writes, telephones or calls. The services of the Bank are personalized
and backed by advanced computerization.
1.9.1 Consumer Banking
Superior retail banking services comprising a wide range of deposit and loan products are
offered by the Standard Chartered Bank to its individual customers. The Consumer Banking
division constantly faces challenges and meets them by developing new products and services
to fulfill the specific requirements of local TU Bank offers a 24-hour service in Bangladesh
through its Moneylink ATM network and Phone-link Phone Banking services.
RATIO ANALYSIS OF STANDARD CHARTERED BANK
19 | P a g e
1.9.2 Corporate Banking Group:
Standard Chartered bank offers its local customers a wide varity of financial services. All the
accounts of corporate clients, that mainly comprise top local and multinational companies
operating in Bangladesh, are assigned a RM or Relationship Manager; who maintains regular
and close contact to serve the needs.
The expertise of the financial institution and treasury division is available whenever its needed.
The unique off shore banking unit (OBU) in Savar offers a full range of facilities to overseas
investors, and recently that Savar Branch have expanded many of its activities.
The offerings to the customer:
o Project finance
o Investment consultancy
o Syndicated loan
o Bonds and guarantees
o Local and international treasury products
1.9.3 Cash Management Operations:
Standard Chartered is highly recognized as a leading cash management supplier across the
emerging markets. Their Cash Management Services cover local and cross border payments,
collections, information management, account services and liquidity management for both
corporate and institutional customers.
Operations:
o Manage the availability of client’s funds efficiently
o Monitor and control the movement of funds
RATIO ANALYSIS OF STANDARD CHARTERED BANK
20 | P a g e
o Settle payments to client’s suppliers in a timely and cost-effective
manner.
o Capture every investment opportunity to increase income
o Investigating the source of the funds
1.9.4 Trade finance:
Standard Chartered possesses 140 years of experience in Trade Finance. The bank has presence
in over 40 countries, in addition to our extensive network of overseas banking partners and
correspondents. The bank obtained ISO9002 accreditation for its quality service. Dedicated
trade and payment systems are in place to make sure that every transaction, even across
different currencies, will be professionally executed.
1.9.5 Custody and clearing services:
Standard Chartered Bank’s Custody and Clearing Services’ combination of local market
expertise, with the security offered by being an integral part of one of the world’s leading
international banks has garnered an impressive client base which includes leading North
American, European and Asian institutions.
1.9.6 Electronic banking:
Standard Chartered offers the client a comprehensive range of Cash Management services.
Whether it is a financial institution, a multi-national corporation or a domestic company,
Electronic Banking application has the capability to support full range of Cash Management
RATIO ANALYSIS OF STANDARD CHARTERED BANK
21 | P a g e
reporting and transaction initiation needs. It provides the secure, reliable and effective link
between the client and client’s accounts anywhere across the Standard Chartered network.
1.9.7 Lending:
Provides working Capital Loan to help the client meet their financial obligations and operate
effectively, the bank offers assistance in the form of working capital loans, overdrafts, term
loans (including real estate loans and other secured debt), backstops and revolvers.
Two types of lending facility are provided to client at present:
o Loan Structure and Syndication: this facility helps borrowers to meet
substantial financing needs by enabling them to reach the banks most
interested in lending to their particular industry, geographic location and
structure through syndicated debt offerings.
1.9.8 The Treasury division
The treasury division of the Standard Chartered Bank has a centralized dealing room in Dhaka
and consists of the following two areas:
• Structured finance: Standard Chartered provides Commodity, Structured Trade and
Export Finance global group service. Many financial institutions have been retreating
from these markets. Standard Chartered Bank stands out as the only bank which is
committed to financing Commodity and Export Credit Agency supported trade flows.
Features:
RATIO ANALYSIS OF STANDARD CHARTERED BANK
22 | P a g e
o Access to long establish expertise in Commodity Finance and willingness to
accept the credit risks associated with approved counterparties.
o Access to structuring skills for emerging markets medium term financing and
to country limit availability for many countries in Asia, India, Middle East,
Africa and Latin America.
o Presence on the ground in many emerging markets which facilitates
transactions through local knowledge and the provision of local commercial
banking infrastructure.
o Track record and capability for global arranging, underwriting and
syndication in the whole area of Structured Finance.
• Foreign Exchange: The Reuters monitors placed in the Treasury Division give
continuous updates on exchange rate movements as well as ready access to market
information. The Foreign Exchange service includes:
Foreign exchange contracts for the same day value, next day value or spot transactions
o Forward Contracts: Foreign exchange contracts to hedge exchange risks.
o Cross Currency Contracts: The customers can trade a wide range of currencies.
RATIO ANALYSIS OF STANDARD CHARTERED BANK
23 | P a g e
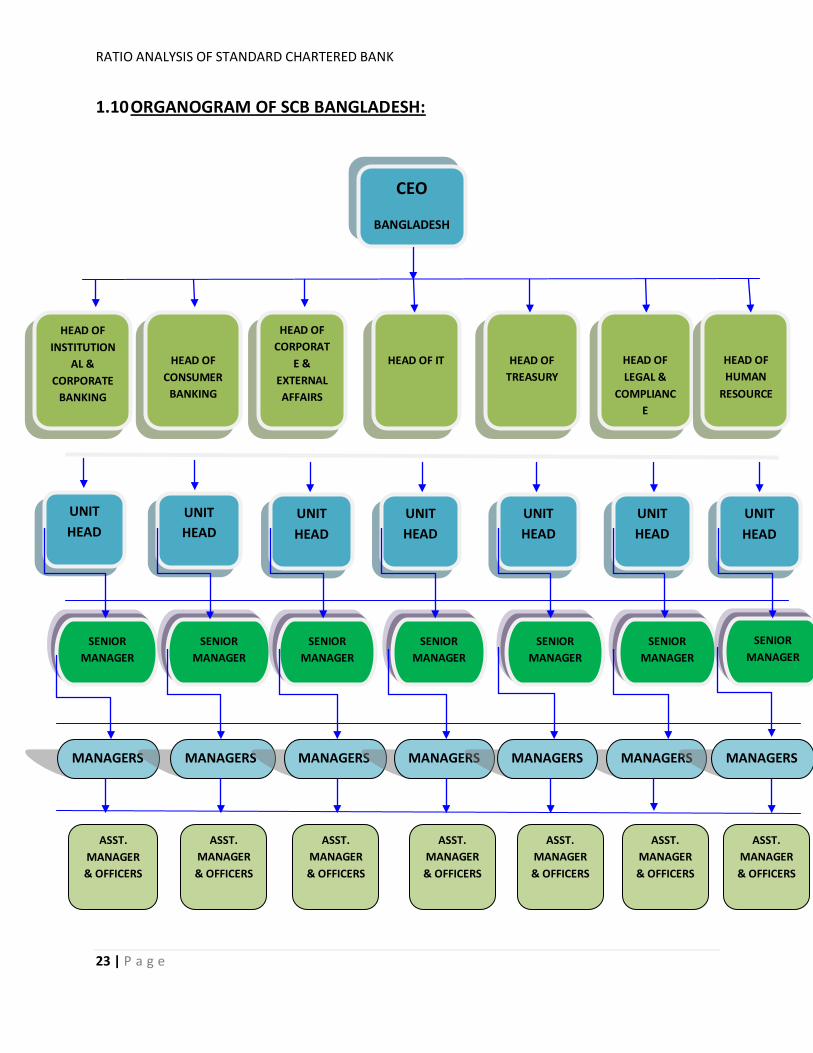
1.10 ORGANOGRAM OF SCB BANGLADESH:
CEO
BANGLADESH
HEAD OF INSTITUTION
AL & CORPORATE
BANKING
HEAD OF CONSUMER
BANKING
HEAD OF CORPORAT
E & EXTERNAL AFFAIRS
HEAD OF IT
HEAD OF TREASURY
HEAD OF LEGAL &
COMPLIANCE
HEAD OF HUMAN
RESOURCE
UNIT HEAD
UNIT HEAD
UNIT HEAD
UNIT HEAD
UNIT HEAD
UNIT HEAD
UNIT HEAD
SENIOR MANAGER
SENIOR MANAGER
SENIOR MANAGER
SENIOR MANAGER
SENIOR MANAGER
SENIOR MANAGER
SENIOR MANAGER
MANAGERS
MANAGERS
MANAGERS
MANAGERS
MANAGERS
MANAGERS
ASST. MANAGER & OFFICERS
ASST. MANAGER& OFFICERS
ASST. MANAGER& OFFICERS
ASST. MANAGER& OFFICERS
ASST. MANAGER& OFFICERS
ASST. MANAGER& OFFICERS
ASST. MANAGER& OFFICERS
MANAGERS

RATIO ANALYSIS OF STANDARD CHARTERED BANK
24 | P a g e
Bank is conservative by nature and activities. Since it is a financial institution, conservativeness
is important here. SCB follows top down approach in communication. The hierarchical ladder of
the chain of command is given in the above mentioned organ gram.
RATIO ANALYSIS OF STANDARD CHARTERED BANK
25 | P a g e
CHAPTER- TWO
Job Responsibilities at SCB

RATIO ANALYSIS OF STANDARD CHARTERED BANK
26 | P a g e
2.1 NATURE OF THE JOB PERFORMED:
My internship at Standard Chartered Bank started on November 12th, 2014 and ended on
February 12th, 2015. During this 3 months of period, I was assigned at the Standard Chartered
Bank Head Office and was appointed to the Project, MIS and Investigation team, while working
there I gathered valuable knowledge and experience. I have learned several things from the
fellow mates and colleagues and seniors as well. I learned how to be responsible for your own
work, being committed to the organization, open to learn new things, work-life balance, and
work ethics in the organization, being regular and punctual and how to communicate and
handle different types of customer.
In Standard Chartered Bank, my main specific task was related to reporting foreign direct
investment (FDI) returns and related rationalized input template (RIT) for Bangladesh Bank. For
this task at first I had to check client’s financial statements, relevant encashment papers &
documents that have been attached with the company’s FI-1 form (A Foreign Investment
related form of client’s financial information). It was also important to check that those papers
were signed by any authorized person of the client’s company or not. At the same time my task
was to find out the similarities between given financial statements & documents information
with the FI-1 form’s information that has been given by the client’s company.
For the purpose of RIT input, after getting proper financial information from the client I had put
that information in rationalized input template (which is a standardized non-executable file
type used by computer designed file as a pre-formatted example on which to base other files.)
The template of FI-1 form is provided by the Bangladesh Bank. The task is easy to understand
but for this it is mandatory to study their circular about FDI returns & related RIT and to follow
their guidelines. Being a student of finance it was very easy for me to understand but had to

RATIO ANALYSIS OF STANDARD CHARTERED BANK
27 | P a g e
clear and properly understand all the terms and follow as far mentioned in the Bangladesh
Bank’s circular and guidelines.
On the other hand, client sometimes provides misleading information so after checking the
template report, to ask for clarification and to ask to put down the information in right way
even if required I had to contact with the clients.
Another task for me was to make a full copy of client’s submitted papers like FI-1 form, financial
statements, company documents, encashment papers etc for both Standard Chartered Bank
and Bangladesh Bank. Because for the purpose of the bank, the main copy of the clients papers
is required to have in Standard Chartered Bank as a proved file. And the photocopy files are
required submitting in Bangladesh Bank for further checking. So I had to make copies of the
reports.
Apart from working in Project and MIS division I had also worked with the investigation team;
there my tasks was;
• Swift massage sorting and reconciliation
• Delivery of the swifts to the other units
• Manual voucher reconciliation
• NOSTRO recon
• Amendment message releasing and delivery
• Photocopy of other messages and delivery
• Paid ITT finding through system
• Client query handling and visit
2.2 CRITICAL OBSERVATIONS AND RECOMMENDATIONS
It was very good experience working in Standard Chartered Bank. The supervisors, seniors and
colleagues are very helpful and supportive every time I wanted to learn something new. While
working there I have noticed some critical aspects of their work, which are:

RATIO ANALYSIS OF STANDARD CHARTERED BANK
28 | P a g e
• No work has ever left pending for the next working day, unless it is absolutely
necessary.
• The work processes could be more prompt and faster if they use upgraded software
and operating systems.
• Performances are continuously appreciated by the seniors that eventually motivate the
employees to work well further.
• There is always a rush of customer throughout the day so as a result sometimes the
sequence of work among the employees varies a lot.
• The supporting staffs should do their own staffs rather taking continuous help from
their colleagues because it hampers the work of others.
• They should maintain proper schedule of work and meet the deadlines, for this they
should take necessary measures to make the clients understand.
2.3 LIMITATIONS OF MY WORK:
• If I go specific then while working on FI-1 reporting, I found out that there are no
proper guidelines given from SCB except the guidelines of Bangladesh Bank to their
clients about how to fill up the forms
• There is lack of electronic equipment’s like computers
• There is limited scope where you can imply your knowledge, thoughts and
innovations
• It is a chain of work where if one breaks the other eventually collapses
• The customers not that much supportive as they are a little bit of denial to except
or understand the importance of FI-1 reporting, as a result they often provide
wrong or misleading information

RATIO ANALYSIS OF STANDARD CHARTERED BANK
29 | P a g e
CHAPTER- THREE
Details of the Project

RATIO ANALYSIS OF STANDARD CHARTERED BANK
30 | P a g e
3.1 OBJECTIVES OF THE REPORT:
The objectives of the report can be divided in to two parts;
1. General objective
2. Specific objective
General objective:
The report is prepared to primarily to full fill the Bachelor of Business Administration (BBA)
degree requirement under the faculty of BRAC Business School, BRAC University.
Specific objective:
If I go specific then the reports entails the following aspects:
• To provide an overview of Standard Chartered Bank
• To focus on the services, products, work environment provided to the employees or
customers at SCB
• To understand the functions of SCB
• To determine the profitability, cost ratio, credit performance, liquidity etc.
• To identify the financial performance of SCB
• To determine the market position of SCB
• To identify the competitive market or environment of SCB
3.2 DATA COLLECTION METHODOLOGY
As I have been working there for three months, it was some extent to hassle free to collect the
financial information from the MIS and Finance department.
There are two types data have been used here to conduct the analysis:

RATIO ANALYSIS OF STANDARD CHARTERED BANK
31 | P a g e
1. Primary data:
The primary sources are:
• Interview with the employees of SCB
• Conversations and discussion with the seniors and finance department
2. Secondary data:
Secondary sources are:
• Annual report of SCB
• Internet browsing
• Various other reports related to the performance of SCB
3.3 LIMITATIONS OF THE STUDY:
While doing the report there I have found some limitations which debilitate the accuracy of my
outcome of the report:
• It was difficult to get information out of the bank as they are very much strict to it
• Few researches over the financial analysis was given on the very same organization are
given online so that’s make it tough to analyze
• Load of work pressure was also a barrier in preparing the report
• Although the officers of Standard Chartered Bank was helpful enough, they did not have
enough time to provide, as they remain busy with their assigned works
• Due to lack of experience there might be some mistakes in the report, though maximum
effort has been given to avoid mistakes
• Lastly I was appointed to the cash management operations where the dealings of work
was all related to operations rather than finance and finance related works so I get a
lesser chance to gather information from my working unit.

RATIO ANALYSIS OF STANDARD CHARTERED BANK
32 | P a g e
3.4 SCOPE OF LEARNING:
The department I was assigned was Cash Management Operations under the Project, MIS and
Investigations Unit. My first job was to collecting, checking and to fill up the RIT template of FI-1
reporting to report Bangladesh Bank. There was a lot of scope to learn from there, like how the
customers are assisted or communicated, how finish the checking and data entry within a time
frame as there was a deadline stated by Bangladesh Bank. I learned how to communicate with
the clients and handle them. Apart from all this I learned how to work balancing time and
handle work load. From this 3 months period I also have learn how to prioritize work and make
a work life balance.
Here from everyone and from unit of CMO I have learnt something as when you will explore the
place and meet the people working there you will eventually know that there is something new
to learn from every place in every single minute.

RATIO ANALYSIS OF STANDARD CHARTERED BANK
33 | P a g e
3.5 FINANCIAL PERFORMANCE MEASURE:
A tool used by individuals to conduct a quantitative analysis of information in a company's
financial statements. Ratios are calculated from current year numbers and are then compared
to previous years, other companies, the industry, or even the economy to judge the
performance of the company. Ratio analysis is predominately used by proponents of
fundamental analysis. (Investopedia)
To do an analysis, the following ratios and values have been calculated:
ROA, ROE, Net Interest Income, cost to income ratio, deposit run off ratio, net interest I\income
as a % of TRGA, net non interest income as a % of TRGA net loans to asset ratio, net loans to
deposit and borrowings, Earnings per Share, price earnings ratio, interest sensitive gap, relative
interest sensitive gap, interest sensitivity ratio, investment maturity strategy, liquidity
indicators and Tier 1 or Core Capital,
[Please see Appendix I for the calculations]
RATIO ANALYSIS OF STANDARD CHARTERED BANK
34 | P a g e
3.6 ANALYSIS:
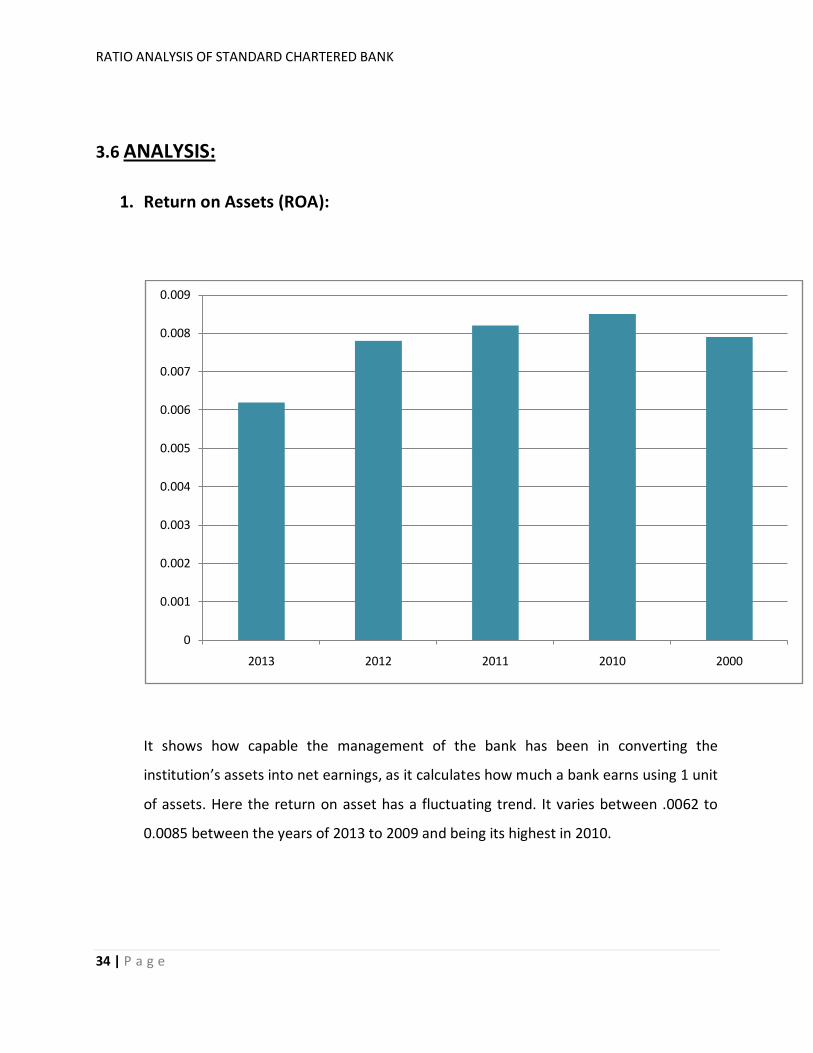
1. Return on Assets (ROA):
It shows how capable the management of the bank has been in converting the
institution’s assets into net earnings, as it calculates how much a bank earns using 1 unit
of assets. Here the return on asset has a fluctuating trend. It varies between .0062 to
0.0085 between the years of 2013 to 2009 and being its highest in 2010.
0
0.001
0.002
0.003
0.004
0.005
0.006
0.007
0.008
0.009
2013 2012 2011 2010 2000

RATIO ANALYSIS OF STANDARD CHARTERED BANK
35 | P a g e
2. Return on Equity (ROE):
The trend shows that SCB had a fair return on equity ratio in 2009 to 2011 but it was not
enough as it started to fall from 2012 and it is least at 2013 with 8.9% where as it was
12.5% in 2009. The reason could be the shortage of profits and as a result net income
had gone down. Another reason could be the effect on ROE due to the new instruction
of Bangladesh Bank to limit the Credit Deposit Ratio within 85%. So the banks have to
take deposit in higher competitive rates.
0
0.02
0.04
0.06
0.08
0.1
0.12
0.14
2013 2012 2011 2010 2009
RATIO ANALYSIS OF STANDARD CHARTERED BANK
36 | P a g e
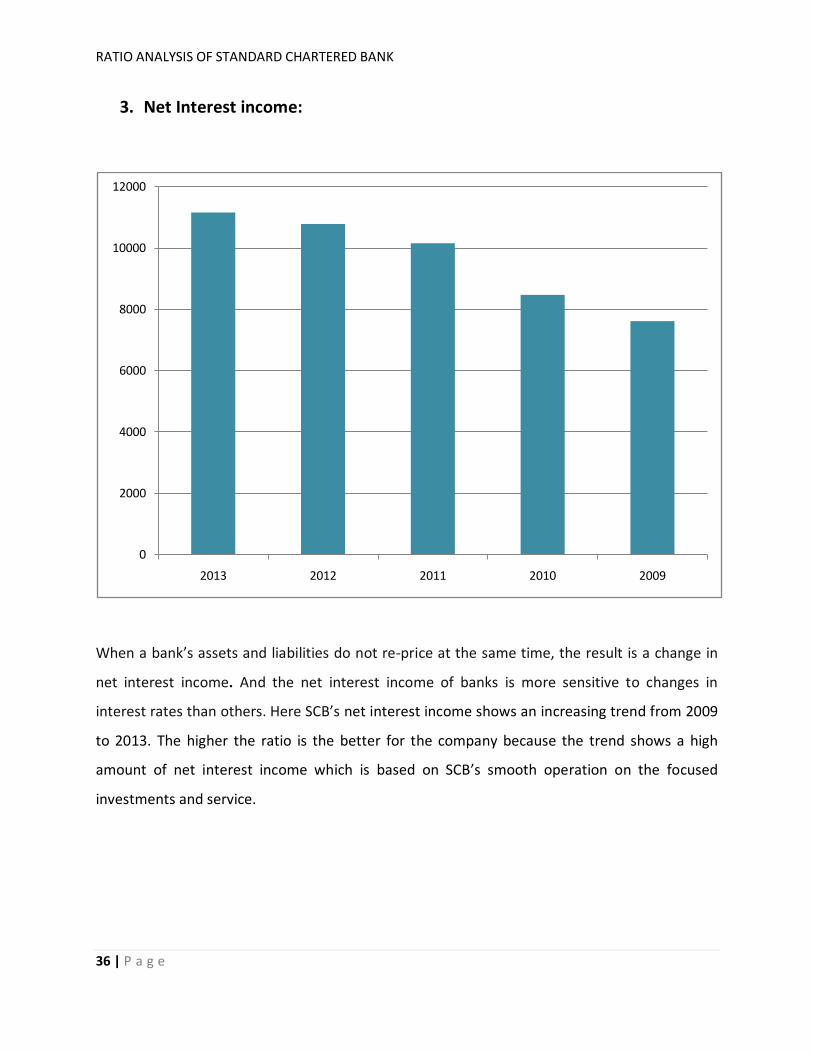
3. Net Interest income:
When a bank’s assets and liabilities do not re-price at the same time, the result is a change in
net interest income. And the net interest income of banks is more sensitive to changes in
interest rates than others. Here SCB’s net interest income shows an increasing trend from 2009
to 2013. The higher the ratio is the better for the company because the trend shows a high
amount of net interest income which is based on SCB’s smooth operation on the focused
investments and service.
0
2000
4000
6000
8000
10000
12000
2013 2012 2011 2010 2009

RATIO ANALYSIS OF STANDARD CHARTERED BANK
37 | P a g e
4. Cost to Income Ratio:
Cost to income ratio is only affected by banks cost but also by the variations in income.
For any given level of cost relative to a bank’s assets, a reduction in income will cause
cost to ratio to increase. Here we can see that the least cost to ratio of SCB was in 2009
and then it increased during 2010 to 2012 and in 2012 it was highest in last five years
then again it reduced to a great extent in 2013. It might be a reason of ineffectuality in
generating income by the bank or it could be a reflection of change in the competitive
conditions reducing the margins available to banks. But this downturn can also be
defined from the insight of economic downturn during 2010-2012 that has reduced the
opportunities of banks to undertake profitable business from which to earn interest and
fees. But it again started to go downwards in 2013 which is good.
0.49
0.5
0.51
0.52
0.53
0.54
0.55
0.56
0.57
0.58
2013 2012 2011 2010 2009

RATIO ANALYSIS OF STANDARD CHARTERED BANK
38 | P a g e
5. Net interest Margin:
The net interest margin is used to track the profitability of bank’s investing and lending
activities over a time period. SCB’s net interest margin declined from 2.30% in 2009 to
2.10% in 2013. Also the yields on its assets that generate interest income declined from
3.9% to 3.4% over this period, it increased its reliance on low-cost deposits and short-term
debt, and reduced its use of higher-cost long-term debt, lowering its funding costs more
than the interest income on its loans and investments.
0.02
0.0205
0.021
0.0215
0.022
0.0225
0.023
0.0235
2013 2012 2011 2010 2009

RATIO ANALYSIS OF STANDARD CHARTERED BANK
39 | P a g e
6. Net Interest Income as % of Total Revenue Generating Assets:
Net interest income as % of TRGA shows how a bank’s net interest income is increasing
by utilizing its revenue generating assets. This particular ratio also shows a fall on the
2010 than again it rose in 2011 and became stable in 2012 as well but there is a slight
fall in 2013 from 1.69% to 1.65% rate which happened probably because of the slow
pace in the economic growth of the year.
0.0156
0.0158
0.016
0.0162
0.0164
0.0166
0.0168
0.017
0.0172
0.0174
0.0176
2013 2012 2011 2010 2009

RATIO ANALYSIS OF STANDARD CHARTERED BANK
40 | P a g e
7. Net Non Interest Income as % of Total Revenue Generating Assets
Net non interest income as % of TRGA shows here the fluctuating trend over 5 years.
The highest amount of NNII as % of TRGA is in the year of 2009 which explains that SCB’s
main earning revenue sources were non operating income on that particular year, which
has both positive and negative sides, because non operating income is not the main
source of income of a company. But from the year of 2010 to 2013 the trend has
become somewhat stable between 1.36% to 1.27%.
0
0.002
0.004
0.006
0.008
0.01
0.012
0.014
0.016
0.018
2013 2012 2011 2010 2009
RATIO ANALYSIS OF STANDARD CHARTERED BANK
41 | P a g e
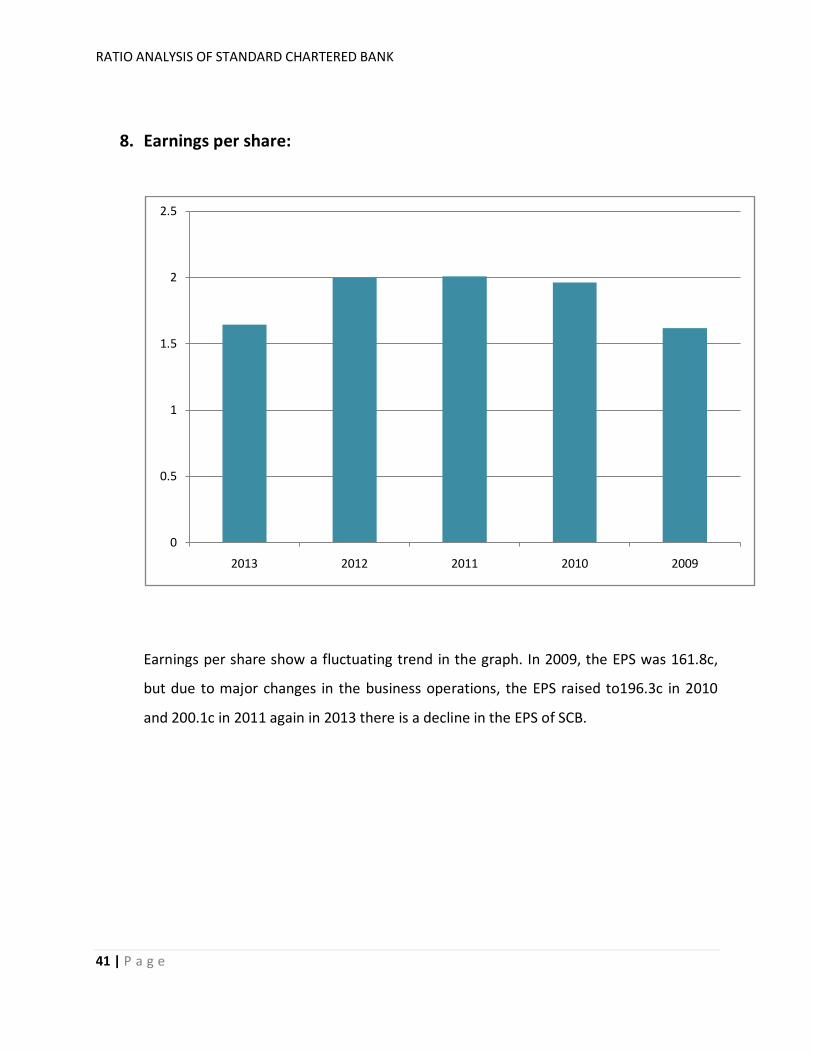
8. Earnings per share:
Earnings per share show a fluctuating trend in the graph. In 2009, the EPS was 161.8c,
but due to major changes in the business operations, the EPS raised to196.3c in 2010
and 200.1c in 2011 again in 2013 there is a decline in the EPS of SCB.
0
0.5
1
1.5
2
2.5
2013 2012 2011 2010 2009
RATIO ANALYSIS OF STANDARD CHARTERED BANK
42 | P a g e
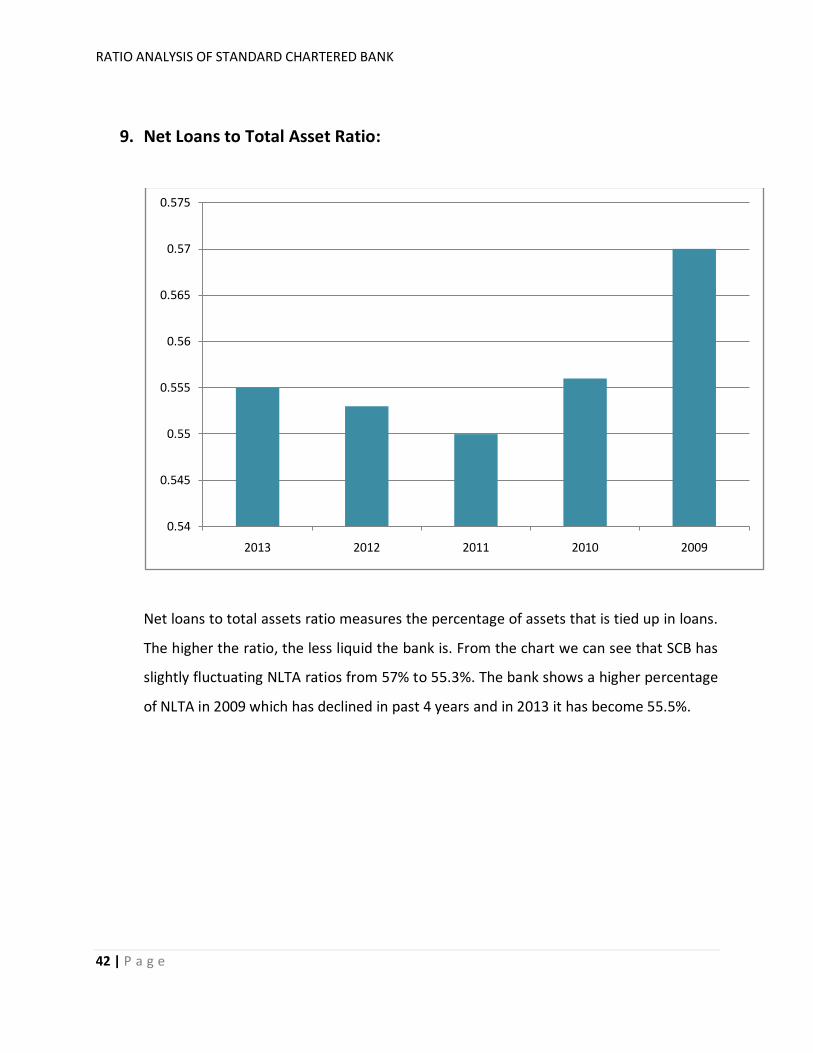
9. Net Loans to Total Asset Ratio:
Net loans to total assets ratio measures the percentage of assets that is tied up in loans.
The higher the ratio, the less liquid the bank is. From the chart we can see that SCB has
slightly fluctuating NLTA ratios from 57% to 55.3%. The bank shows a higher percentage
of NLTA in 2009 which has declined in past 4 years and in 2013 it has become 55.5%.
0.54
0.545
0.55
0.555
0.56
0.565
0.57
0.575
2013 2012 2011 2010 2009

RATIO ANALYSIS OF STANDARD CHARTERED BANK
43 | P a g e
10. Net Loans to Deposit and Borrowings:
This ratio indicates the percentage of the total deposits locked into non-liquid assets. A
high figure denotes lower liquidity. Here we can see that in 2013 the ratio is much
higher than the previous 5 years that indicates lower liquidity of the bank due to the
fact that deposits are locked by non liquid assets and are less liquid.
0.795
0.8
0.805
0.81
0.815
0.82
0.825
0.83
0.835
0.84
0.845
2013 2012 2011 2010 2009

RATIO ANALYSIS OF STANDARD CHARTERED BANK
44 | P a g e
11.Interest Sensitivity Ratio:
Indicates the degree of change in the price of an asset (such as securities, bonds, notes)
in response to the fluctuations in the market interest rates. This graph shows that the
bank has fluctuating interest sensitivity ratio from year 2009-2013 but spread is
comparatively less. Interest rate sensitivity also denotes that the longer the maturity of
the asset, the more sensitive the asset will be to changes in interest rates. Changes in
interest rates are watched closely by bond and fixed income traders, as the resulting
price fluctuations will affect the overall yield of the bank securities.
1.04
1.05
1.06
1.07
1.08
1.09
1.1
1.11
2013 2012 2011 2010 2009
RATIO ANALYSIS OF STANDARD CHARTERED BANK
45 | P a g e
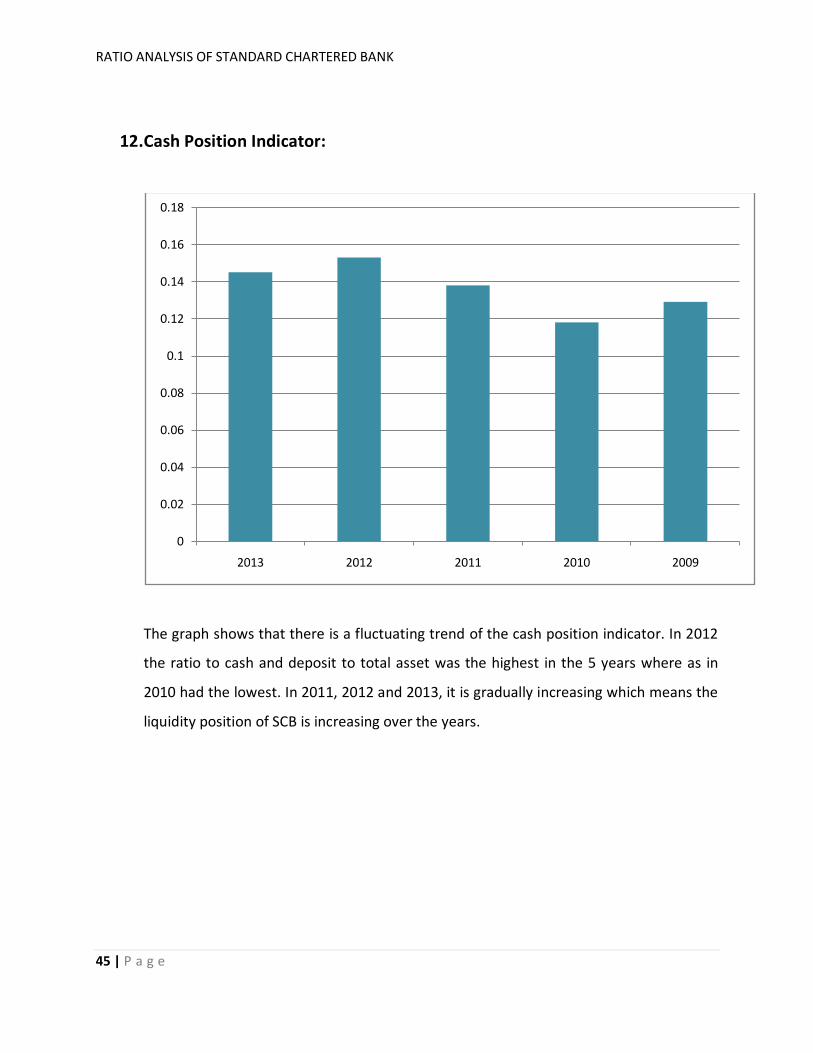
12.Cash Position Indicator:
The graph shows that there is a fluctuating trend of the cash position indicator. In 2012
the ratio to cash and deposit to total asset was the highest in the 5 years where as in
2010 had the lowest. In 2011, 2012 and 2013, it is gradually increasing which means the
liquidity position of SCB is increasing over the years.
0
0.02
0.04
0.06
0.08
0.1
0.12
0.14
0.16
0.18
2013 2012 2011 2010 2009

RATIO ANALYSIS OF STANDARD CHARTERED BANK
46 | P a g e
13.Liquid Securities Indicator:
The ratio of short-term securities to total asset was the highest in 2013. This increase
was due to a high amount of investment in the short term portfolio. As investments was
low in 2010 ratio fell down significantly but started to rise slowly since 2011 onwards.
0
0.02
0.04
0.06
0.08
0.1
0.12
2013 2012 2011 2010 2009

RATIO ANALYSIS OF STANDARD CHARTERED BANK
47 | P a g e
Conclusion and Recommendation:
By observing and analyzing the overall performance and profitability of Standard Chartered
Bank Limited, it can be said that net interest income shows an increasing trend over the five
years, which is good for the bank and shows smooth operation of the investments and that the
expenses are controlled.
A decreasing ROA indicates less profitability. As ROA is derived from net income and assets, so
to improve the return on assets, they can increase net Income without acquiring new assets or
improve the effectiveness of existing assets. As the more SCB generates in fees, the more it may
concentrate on activities that carry high fixed costs. The degree to which SCB is able
to leverage its fixed costs also affects its efficiency ratio; that is, the more scalable it would be,
the more efficient it would become. .
In year after year they are trying to improve themselves by establishing a sound capital base.
They are trying to make their products and services more lucrative to their customers. And they
are rewarding their shareholder’s by enhancing their wealth and attracting more investors by
their bank performance.
They follow a front-end load maturity strategy where more than 80% of the investments are
short and medium term investments which say that SCB prefers higher liquidity to higher
profitability. But that is something that they might face trouble with as shown by the analysis of
liquidity indicators. The Cash Position Indicator shows fluctuation in the graph and in 2011,
2012 and 2013; it is gradually decreasing which means the liquidity position of the bank is
unstable over the years. This problem can be solved by finding out ways to lower the costs of
overhead like advertising, professional costs and rent. However, since the bank is well
capitalized with sound investments, this after all might not be a major problem for a bank that
operates for 150 years with excellence and expertise.

RATIO ANALYSIS OF STANDARD CHARTERED BANK
48 | P a g e

RATIO ANALYSIS OF STANDARD CHARTERED BANK
49 | P a g e
References
• Standard Chartered PLC Annual Report 2013
• Standard Chartered PLC Annual Report 2012
• Standard Chartered PLC Annual Report 2011
• Standard Chartered PLC Annual Report 2010
• Standard Chartered PLC Annual Report 2009
• https://www.sc.com/en/index.html
• http://reports.standardchartered.com/annual-report-2013/
• http://seekingalpha.com/article/1609382-standard-chartereds-ceo-discusses-h1-2013-results-
earnings-call-transcript
• http://investors.sc.com/en/stockquote.cfm
• http://www.investopedia.com/terms/o/overdraft.asp
• http://www.cic.gc.ca/english/resources/manuals/op/op17-eng.pdf
• http://www.thefreedictionary.com/Cash+credit
• http://www.businessdictionary.com/definition/construction-loan.html
• http://www.businessdictionary.com/definition/payment-against-documents.html
• http://www.investopedia.com/terms/c/currentratio.asp
• http://www.investopedia.com/articles/stocks/07/bankfinancials.asp
• http://www.investopedia.com/terms/r/returnonequity.asp
• http://www.investopedia.com/terms/r/returnonassets.asp
• http://en.wikipedia.org/wiki/Return_on_assets
• http://www.investopedia.com/terms/r/returnonequity.asp
• http://en.wikipedia.org/wiki/Barbell_strategy
• http://archive.thedailystar.net/newDesign/news-details.php?nid=174912
• https://www.bis.org/publ/bcbs270.pdf
• http://www.investopedia.com/terms/t/tier-1-capital-ratio.asp
• http://www.investopedia.com/terms/t/tier-1-capital-ratio.asp

RATIO ANALYSIS OF STANDARD CHARTERED BANK
50 | P a g e
Appendix I
These are the tools useful in valuation because it helps the financial analyst gauge returns and risks. So, here are the calculations for SCB:
• ROA (RETURN ON ASSETS) = NET INCOME/TOTAL ASSETS (AMOUNTS IN MILLIONS)
2013
ROA= 4200/674380
=0.0062
2012
ROA= 4985/631208
=0.0078
2011
ROA= 4933/599070
=0.0082
2010
ROA= 4414/516542
=0.0085
2009
ROA= 3477/436653
=0.0079

RATIO ANALYSIS OF STANDARD CHARTERED BANK
51 | P a g e
• ROE (RETURNS ON EQUITY)= NET INCOME/ TOTAL EQUITY
2013
ROE= 4200/4684
1= 0.089
2012
ROE= 4985/46055
=0.108
2011
ROE= 4933/41375
= 0.119
2010
ROE= 4414/38865
=0.113
2009
ROE= 3477/27920
=0.125
RATIO ANALYSIS OF STANDARD CHARTERED BANK
52 | P a g e
• NET INTEREST INCOME= TOTAL INT INCOME-TOTAL INT EXPENSE
2013 Net interest income = 17593-6437
= 11156
2012
Net interest income= 17827-7046
= 10781
2011
Net interest income= 16584-6431
=10153
2010
Net interest income= 13500-5030
=8470
2009
Net interest income= 12926-5303
= 7623

RATIO ANALYSIS OF STANDARD CHARTERED BANK
53 | P a g e
• COST TO INCOME RATIO= OPERATING EXPENSES/OPERATING INCOME 2013
Cost to Income Ratio= 10193/18777
= 0.5428
2012
Cost to Income Ratio= 10896/19071
= 0.5713
2011
Cost to Income Ratio= 9917/17637
= 0.5622
2010
Cost to Income Ratio= 9023/16062
= 0.5617
2009
Cost to Income Ratio= 7952/15184
= 0.5237

RATIO ANALYSIS OF STANDARD CHARTERED BANK
54 | P a g e
• NET INTEREST MARGIN=(INTEREST INCOME-INTEREST EXPENSE)/ AVG
TOTAL ASSET
2013
Net interest margin= 17593-6437/521287
= 0.021
2012
Net interest margin= 18258-7248/488178
= 0.023
2011
Net interest margin= 16584-6431/441892
= 0.023
2010
Net interest margin= 13500-5030/383359
=0.022
2009
Net interest margin= 12926-5303/328688
=0.023
RATIO ANALYSIS OF STANDARD CHARTERED BANK
55 | P a g e
• NET INTEREST INCOME AS % OF TRGA= NET INTEREST INCOME/ TRGA
2013
Net interest income as % of TRGA= 11156/674380
= 0.0165
2012
Net interest income as % of TRGA= 10781/636508
= 0.0169
2011
Net interest income as % of TRGA= 10153/599070
= 0.0169
2010
Net interest income as % of TRGA= 8470/516542
= 0.0163
2009
Net interest income as % of TRGA= 7623/436653
= 0.0174

RATIO ANALYSIS OF STANDARD CHARTERED BANK
56 | P a g e
• NET NON INTEREST INCOME AS % OF TRGA= NET NON INTEREST INCOME/TRGA
2013
Net non interest income as % of TRGA= (18777-10193)/674380
= 0.0127
2012
Net non interest income as % of TRGA = (19071-10896)/636508
= 0.0128
2011
Net non interest income as % of TRGA = (17367-9917)/599070
= 0.0124
2010
Net non interest income as % of TRGA = (16062-9023)/516542
= 0.0136
2009
Net non interest income as % of TRGA = (15184-7952)/436653
= 0.0165

RATIO ANALYSIS OF STANDARD CHARTERED BANK
57 | P a g e
• NLTA (NET LOANS TO TOTAL ASSET RATIO)= NET LOANS/ TOTAL ASSETS
2013
Net loans to total asset ratio= (83702+290708)/674380
= 0.555
2012
Net loans to total asset ratio= (68381+283885)/636518
= 0.553
2011
Net loans to total asset ratio= (65981+263765)/599070
= 0.550
2010
Net loans to total asset ratio= (52058+240358)/516542
= 0.566
2009
Net loans to total asset ratio= (50885+198292)/436653
= 0.570
RATIO ANALYSIS OF STANDARD CHARTERED BANK
58 | P a g e
• NLDST (NET LOANS TO DEPOSIT AND BORROWINGS)= NET LOANS/TOTAL DEPOSITS AND SHORT TERM BORROWINGS 2013
Net loans to deposit and borrowings= (83702+290708)/444980
= 0.841
2012
Net loans to deposit and borrowings= (68381+283885)/432915 = 0.813
2011
Net loans to deposit and borrowings= 65981+263765)/394714
= 0.835
2010
Net loans to deposit and borrowings= (52058+240358)/351482
= 0.831
2009
Net loans to deposit and borrowings= (50885+198292)/306435
= 0.813
RATIO ANALYSIS OF STANDARD CHARTERED BANK
59 | P a g e
• INTEREST SENSITIVITY RATIO= INTEREST SENSITIVE ASSETS/INTEREST SENSITIVE LIABILITIES
2013
Interest sensitivity ratio= 521287/488593
= 1.066
2012
Interest sensitivity ratio= 488178/461480
=1.05
2011
Interest sensitivity ratio= 441892/410602
=1.076
2010
Interest sensitivity ratio= 383359/347058
= 1.104
2009
Interest sensitivity ratio= 328688/298365
= 1.101

RATIO ANALYSIS OF STANDARD CHARTERED BANK
60 | P a g e
• CASH POSITION INDICATOR = (CASH + DEPOSIT)/ TOTAL ASSET
2013
Cash composition indicator= (54534+ 43517)/674380
= 0.145
2012
Cash composition indicator= (61043+36477)/636518
= 0.1532
2011
Cash composition indicator= (47364+35296)/599070
= 0.1379
2010
Cash composition indicator= (32724+28551)/516542
=0.118
2009
Cash composition indicator= (18131+38461)/436653
=0.129

RATIO ANALYSIS OF STANDARD CHARTERED BANK
61 | P a g e
• LIQUID SECURITIES INDICATOR = SHORT TERM SECURITY/ TOTAL ASSET
2013
Liquid securities indicator= 71412/674380
= 0.105
2012
Liquid securities indicator= 61240/636518
= 0.096
2011
Liquid securities indicator= 51573/599070
= 0.086
2010
Liquid securities indicator= 34691/516542
= 0.067
2009
Liquid securities indicator= 33259/436653
= 0.076
RATIO ANALYSIS OF STANDARD CHARTERED BANK
62 | P a g e
Appendix II
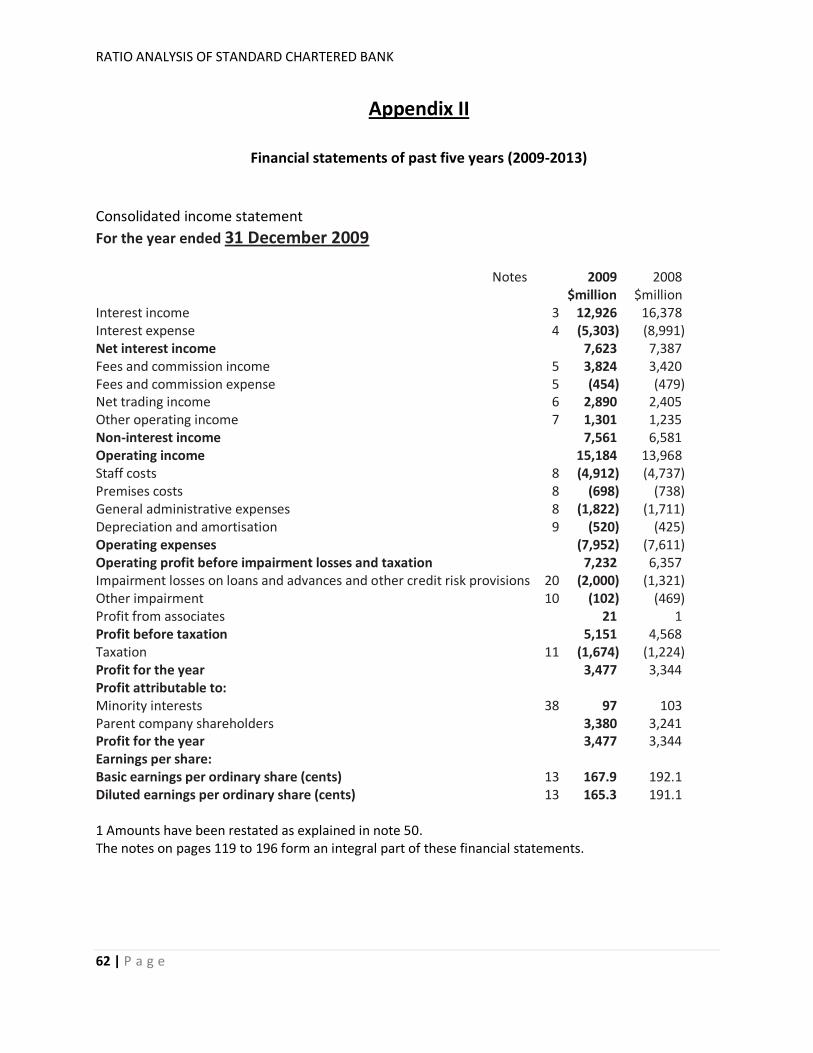
Financial statements of past five years (2009-2013)
Consolidated income statement For the year ended 31 December 2009
Notes 2009 $million
2008 $million
Interest income 3 12,926 16,378 Interest expense 4 (5,303) (8,991) Net interest income 7,623 7,387 Fees and commission income 5 3,824 3,420 Fees and commission expense 5 (454) (479) Net trading income 6 2,890 2,405 Other operating income 7 1,301 1,235 Non-interest income 7,561 6,581 Operating income 15,184 13,968 Staff costs 8 (4,912) (4,737) Premises costs 8 (698) (738) General administrative expenses 8 (1,822) (1,711) Depreciation and amortisation 9 (520) (425) Operating expenses (7,952) (7,611) Operating profit before impairment losses and taxation 7,232 6,357 Impairment losses on loans and advances and other credit risk provisions 20 (2,000) (1,321) Other impairment 10 (102) (469) Profit from associates 21 1 Profit before taxation 5,151 4,568 Taxation 11 (1,674) (1,224) Profit for the year 3,477 3,344 Profit attributable to: Minority interests 38 97 103 Parent company shareholders 3,380 3,241 Profit for the year 3,477 3,344 Earnings per share: Basic earnings per ordinary share (cents) 13 167.9 192.1 Diluted earnings per ordinary share (cents) 13 165.3 191.1 1 Amounts have been restated as explained in note 50. The notes on pages 119 to 196 form an integral part of these financial statements.

RATIO ANALYSIS OF STANDARD CHARTERED BANK
63 | P a g e
Consolidated balance sheet As at 31 December 2009
Notes 2009 $million
2008 $million
Assets Cash and balances at central banks 14, 41 18,131 24,161 Financial assets held at fair value through profit or loss 14, 15 22,446 15,425 Derivative financial instruments 14, 16 38,193 69,657 Loans and advances to banks 14, 17, 20 50,885 46,583 Loans and advances to customers 14, 18, 20 198,292 174,178 Investment securities 14, 22 75,728 69,342 Other assets 14, 23 17,201 20,374 Current tax assets 203 764 Prepayments and accrued income 3,241 3,466 Interests in associates 24 514 511 Goodwill and intangible assets 26 6,620 6,361 Property, plant and equipment 27 4,103 3,586 Deferred tax assets 28 1,096 660 Total assets 436,653 435,068 Liabilities Deposits by banks 14, 29 38,461 31,909 Customer accounts 14, 30 251,244 234,008 Financial liabilities held at fair value through profit or loss 14, 15 14,505 15,478 Derivative financial instruments 14, 16 36,584 67,775 Debt securities in issue 14, 31 29,272 23,447 Other liabilities 14, 33 16,139 17,363 Current tax liabilities 802 512 Accruals and deferred income 4,113 4,132 Subordinated liabilities and other borrowed funds 14, 34 16,730 16,986 Deferred tax liabilities 28 193 176 Provisions for liabilities and charges 35 184 140 Retirement benefit obligations 36 506 447 Total liabilities 408,733 412,373 Equity Share capital 37 1,013 948 Reserves 26,327 21,192 Total parent company shareholders’ equity 27,340 22,140 Minority interests 38 580 555 Total equity 27,920 22,695 Total equity and liabilities 436,653 435,068 The notes on pages 119 to 196 form an integral part of these financial statements. These financial statements were approved by the Board of directors and authorised for issue on 3 March 2010 and signed on its behalf by:

RATIO ANALYSIS OF STANDARD CHARTERED BANK
64 | P a g e
Supplementary financial information
2009 Average non-interest earning balance
$million Average interest earning
balance $million
Interest income $million
Grossyield %
Assets Cash and balances at central banks 8,629 7,145 6 0.1 Gross loans and advances to banks 2,945 47,172 755 1.6 Gross loans and advances to customers 260 192,638 9,427 4.9 Impairment provisions against loans and advances to banks and customers
(193) (1,810) – –
Investment securities 3,650 83,543 2,738 3.3 Property, plant and equipment and intangible assets
3,551 – – –
Prepayments, accrued income and other assets
122,165 – – –
Total average assets 141,007 328,688 12,926 3.9
RATIO ANALYSIS OF STANDARD CHARTERED BANK
65 | P a g e
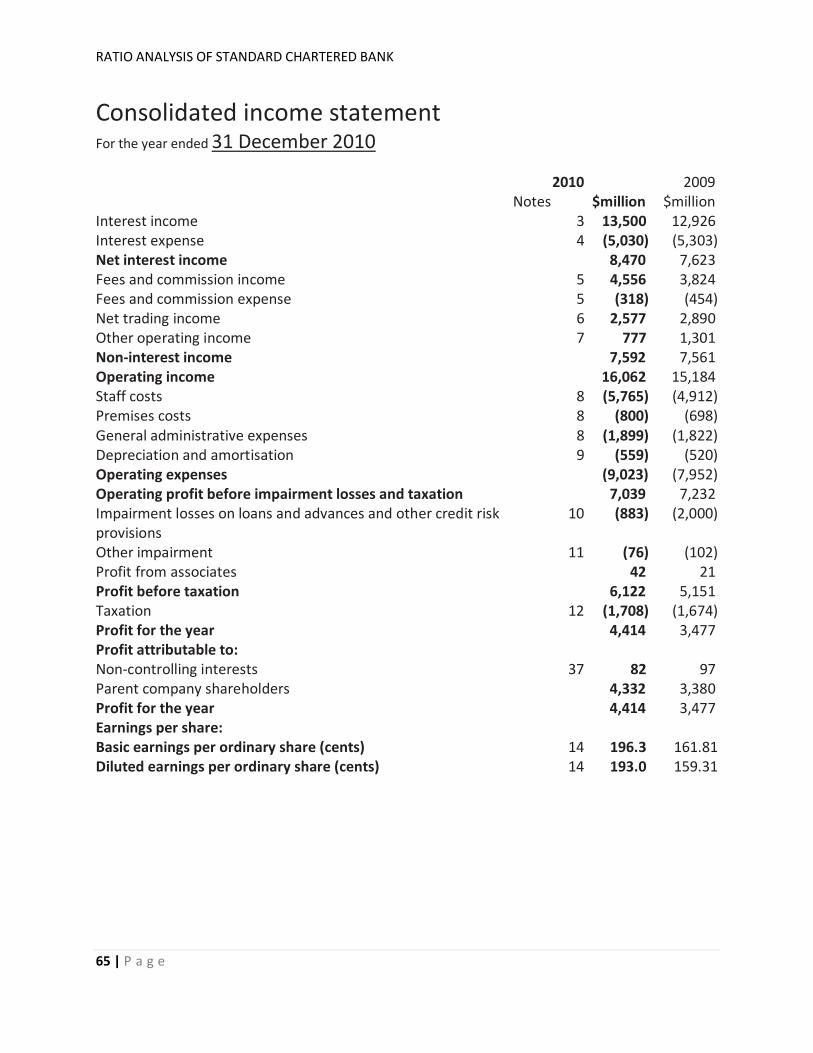
Consolidated income statement For the year ended 31 December 2010
2010 2009 Notes $million $million
Interest income 3 13,500 12,926 Interest expense 4 (5,030) (5,303) Net interest income 8,470 7,623 Fees and commission income 5 4,556 3,824 Fees and commission expense 5 (318) (454) Net trading income 6 2,577 2,890 Other operating income 7 777 1,301 Non-interest income 7,592 7,561 Operating income 16,062 15,184 Staff costs 8 (5,765) (4,912) Premises costs 8 (800) (698) General administrative expenses 8 (1,899) (1,822) Depreciation and amortisation 9 (559) (520) Operating expenses (9,023) (7,952) Operating profit before impairment losses and taxation 7,039 7,232 Impairment losses on loans and advances and other credit risk provisions
10 (883) (2,000)
Other impairment 11 (76) (102) Profit from associates 42 21 Profit before taxation 6,122 5,151 Taxation 12 (1,708) (1,674) Profit for the year 4,414 3,477 Profit attributable to: Non-controlling interests 37 82 97 Parent company shareholders 4,332 3,380 Profit for the year 4,414 3,477 Earnings per share: Basic earnings per ordinary share (cents) 14 196.3 161.81 Diluted earnings per ordinary share (cents) 14 193.0 159.31

RATIO ANALYSIS OF STANDARD CHARTERED BANK
66 | P a g e
Consolidated balance sheet As at 31 December 2010 Standard Chartered Annual Report 2010 www.standardchartered.com
2010 2009 Notes $million $million
Assets Cash and balances at central banks 15, 40 32,724 18,131 Financial assets held at fair value through profit or loss 15, 16 27,021 22,446 Derivative financial instruments 15, 17 47,859 38,193 Loans and advances to banks 15, 18 52,058 50,885 Loans and advances to customers 15, 19 240,358 198,292 Investment securities 15, 21 75,796 75,728 Other assets 15, 22 25,356 17,201 Current tax assets 179 203 Prepayments and accrued income 2,127 3,241 Interests in associates 23 631 514 Goodwill and intangible assets 25 6,980 6,620 Property, plant and equipment 26 4,507 4,103 Deferred tax assets 27 946 1,096 Total assets 516,542 436,653 Liabilities Deposits by banks 15, 28 28,551 38,461 Customer accounts 15, 29 306,992 251,244 Financial liabilities held at fair value through profit or loss 15, 16 20,288 14,505 Derivative financial instruments 15, 17 47,133 36,584 Debt securities in issue 15, 30 31,381 29,272 Other liabilities 15, 32 21,094 16,139 Current tax liabilities 981 802 Accruals and deferred income 4,528 4,113 Subordinated liabilities and other borrowed funds 15, 33 15,939 16,730 Deferred tax liabilities 27 165 193 Provisions for liabilities and charges 34 315 184 Retirement benefit obligations 35 310 506 Total liabilities 477,677 408,733 Equity Share capital 36 1,174 1,013 Reserves 37,038 26,327 Total parent company shareholders’ equity 38,212 27,340 Non-controlling interests 37 653 580 Total equity 38,865 27,920 Total equity and liabilities 516,542 436,653

RATIO ANALYSIS OF STANDARD CHARTERED BANK
67 | P a g e

RATIO ANALYSIS OF STANDARD CHARTERED BANK
68 | P a g e
Consolidated income statement
For the year ended 31 December 2011
2011 2010 Notes $million $million Interest income 3 16,584 13,500 Interest expense 4 (6,431) (5,030) Net interest income 10,153 8,470 Fees and commission income 5 4,466 4,556 Fees and commission expense 5 (420) (318) Net trading income 6 2,645 2,577 Other operating income 7 793 777 Non-interest income 7,484 7,592 Operating income 17,637 16,062 Staff costs 8 (6,630) (5,765) Premises costs 8 (862) (800) General administrative expenses 8 (1,804) (1,899) Depreciation and amortisation 9 (621) (559) Operating expenses (9,917) (9,023) Operating profit before impairment losses and taxation 7,720 7,039 Impairment losses on loans and advances and other credit risk provisions
10 (908) (883)
Other impairment 11 (111) (76) Profit from associates 74 42 Profit before taxation 6,775 6,122 Taxation 12 (1,842) (1,708) Profit for the year 4,933 4,414
Profit attributable to:
Non-controlling interests 36 84 82 Parent company shareholders 4,849 4,332 Profit for the year 4,933 4,414
cents cents Earnings per share: Basic earnings per ordinary share 14 200.8 196.3 Diluted earnings per ordinary share 14 198.2 193.0 The notes on pages 170 to 235 form an integral part of these financial statements.

RATIO ANALYSIS OF STANDARD CHARTERED BANK
69 | P a g e
Consolidated balance sheet As at 31 December 2011 2011 2010 Notes $million $million Assets Cash and balances at central banks 15, 39 47,364 32,724 Financial assets held at fair value through profit or loss 15, 16 24,828 27,021
Derivative financial instruments 15, 17 67,933 47,859 Loans and advances to banks 15, 18 65,981 52,058 Loans and advances to customers 15, 19 263,765 240,358 Investment securities 15, 21 85,283 75,796 Other assets 15, 22 27,286 25,356 Current tax assets 232 179 Prepayments and accrued income 2,521 2,127 Interests in associates 23 903 631 Goodwill and intangible assets 25 7,061 6,9981 Property, plant and equipment 26 5,078 4,507 Deferred tax assets 27 835 946 Total assets 599,070 516,560
Liabilities
Deposits by banks 15, 28 35,296 28,551 Customer accounts 15, 29 342,701 306,992 Financial liabilities held at fair value through profit or loss 15, 16 19,599 20,288
Derivative financial instruments 15, 17 65,926 47,133 Debt securities in issue 15, 30 47,140 31,381 Other liabilities 15, 31 23,834 21,094 Current tax liabilities 1,005 981 Accruals and deferred income 4,458 4,528 Subordinated liabilities and other borrowed funds
15, 32 16,717 15,939
Deferred tax liabilities 27 131 1831 Provisions for liabilities and charges
33 369 315
Retirement benefit obligations 34 519 310 Total liabilities 557,695 477,695
RATIO ANALYSIS OF STANDARD CHARTERED BANK
70 | P a g e
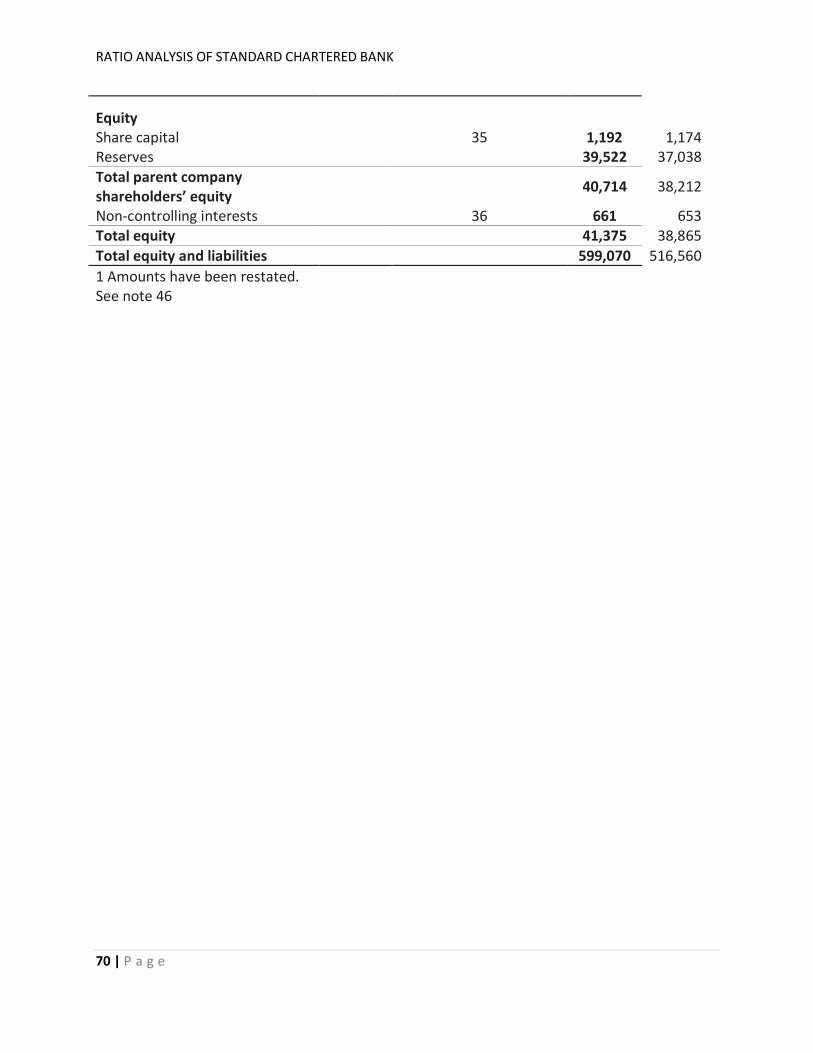
Equity
Share capital 35 1,192 1,174 Reserves 39,522 37,038 Total parent company shareholders’ equity
40,714 38,212
Non-controlling interests 36 661 653 Total equity 41,375 38,865 Total equity and liabilities 599,070 516,560 1 Amounts have been restated. See note 46

RATIO ANALYSIS OF STANDARD CHARTERED BANK
71 | P a g e
Consolidated income statement For the year ended 31 December 2012
2012 2011 Notes $million $million Interest income 3 18,258 16,584 Interest expense 4 (7,248) (6,431) Net interest income 11,010 10,153 Fees and commission income 5 4,618 4,466 Fees and commission expense 5 (497) (420) Net trading income 6 2,748 2,645 Other operating income 7 1,192 793 Non-interest income 8,061 7,484 Operating income 19,071 17,637 Staff costs 8 (6,5 84) (6,630) Premises costs 8 (886) (862) General administrative expenses 8 (2,7 58) (1,804) Depreciation and amortisation 9 (668) (621) Operating expenses (10,896) (9,917) Operating profit before impairment losses and taxation 8,175 7,720 Impairment losses on loans and advances and other credit risk provisions
10 (1,221) (908)
Other impairment 11 (194) (111) Profit from associates 116 74 Profit before taxation 6,876 6,775 Taxation 12 (1,891) (1,842) Profit for the year 4,985 4,933
Profit attributable to: Non-controlling interests 36 98 84 Parent company shareholders 4,887 4,849 Profit for the year 4,985 4,933
cents cents Earnings per share: Basic earnings per ordinary share 14 199.7 200.8 Diluted earnings per ordinary share 14 197.7 198.2 The notes on pages 204 to 267 form an integral part of these financial statements.
RATIO ANALYSIS OF STANDARD CHARTERED BANK
72 | P a g e
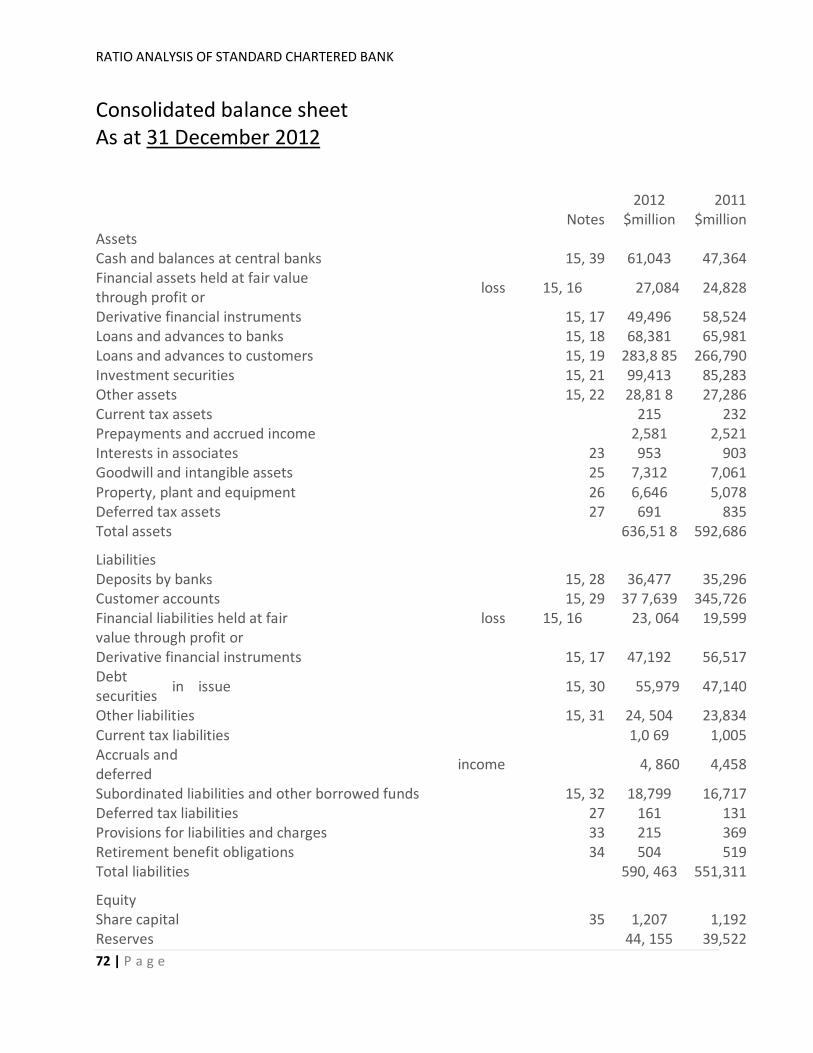
Consolidated balance sheet As at 31 December 2012
2012 2011 Notes $million $million Assets Cash and balances at central banks 15, 39 61,043 47,364 Financial assets held at fair value through profit or loss 15, 16 27,084 24,828
Derivative financial instruments 15, 17 49,496 58,524 Loans and advances to banks 15, 18 68,381 65,981 Loans and advances to customers 15, 19 283,8 85 266,790 Investment securities 15, 21 99,413 85,283 Other assets 15, 22 28,81 8 27,286 Current tax assets 215 232 Prepayments and accrued income 2,581 2,521 Interests in associates 23 953 903 Goodwill and intangible assets 25 7,312 7,061 Property, plant and equipment 26 6,646 5,078 Deferred tax assets 27 691 835 Total assets 636,51 8 592,686
Liabilities Deposits by banks 15, 28 36,477 35,296 Customer accounts 15, 29 37 7,639 345,726 Financial liabilities held at fair value through profit or
loss 15, 16 23, 064 19,599
Derivative financial instruments 15, 17 47,192 56,517 Debt securities in issue 15, 30 55,979 47,140
Other liabilities 15, 31 24, 504 23,834 Current tax liabilities 1,0 69 1,005 Accruals and deferred income 4, 860 4,458
Subordinated liabilities and other borrowed funds 15, 32 18,799 16,717 Deferred tax liabilities 27 161 131 Provisions for liabilities and charges 33 215 369 Retirement benefit obligations 34 504 519 Total liabilities 590, 463 551,311
Equity Share capital 35 1,207 1,192 Reserves 44, 155 39,522

RATIO ANALYSIS OF STANDARD CHARTERED BANK
73 | P a g e
Total parent company shareholders’ equity 45, 362 40,714 Non-controlling interests 36 693 661 Total equity 46, 055 41,375 Total equity and liabilities 636,51 8 592,686

RATIO ANALYSIS OF STANDARD CHARTERED BANK
74 | P a g e
Consolidated income statement
For the year ended 31 December 2013
2013 20121 Notes $million $million Interest income 3 17,593 17,827 Interest expense 4 (6,437) (7,046) Net interest income 11,156 10,781 Fees and commission income 5 4,581 4,575 Fees and commission expense 5 (480) (496) Net trading income 6 2,514 2,739 Other operating income 7 1,006 1,184 Non-interest income 7,621 8,002 Operating income 18,777 18,783 Staff costs 8 (6,570) (6,492) Premises costs 8 (877) (863) General administrative expenses 8 (2,032) (2,707) Depreciation and amortisation 9 (714) (660) Operating expenses (10,193) (10,722) Operating profit before impairment losses and taxation 8,584 8,061 Impairment losses on loans and advances and other credit risk provisions
10 (1,617) (1,196)
Other impairment Goodwill impairment 11 (1,000) – Other 11 (129) (196) Profit from associates and joint ventures 226 182 Profit before taxation 6,064 6,851 Taxation 12 (1,864) (1,866) Profit for the year 4,200 4,985
Profit attributable to:
Non-controlling interests 37 110 98 Parent company shareholders 4,090 4,887 Profit for the year 4,200 4,985 cents cents Earnings per share: Basic earnings per ordinary share 14 164.4 199.7 Diluted earnings per ordinary share 14 163.0 197.7

RATIO ANALYSIS OF STANDARD CHARTERED BANK
75 | P a g e
Consolidated balance sheet As at 31 December 2013
2013 20121
Notes $million $million
Assets Cash and balances at central banks 15, 40 54,534 60,537 Financial assets held at fair value through profit or loss 15, 16 29,335 27,076
Derivative financial instruments 15, 17 61,802 49,495 Loans and advances to banks 15, 18 83,702 67,797 Loans and advances to customers 15, 19 290,708 279,638 Investment securities 15, 21 102,716 99,225 Other assets 15, 22 33,570 28,548 Current tax assets 234 215 Prepayments and accrued income 2,510 2,552 Interests in associates and joint ventures 23 1,767 1,684 Goodwill and intangible assets 26 6,070 7,145 Property, plant and equipment 27 6,903 6,620 Deferred tax assets 28 529 676 Total assets 674,380 631,208
Liabilities
Deposits by banks 15, 29 43,517 36,427 Customer accounts 15, 30 381,066 372,874 Financial liabilities held at fair value through profit or loss
15, 16 23,030 23,064
Derivative financial instruments 15, 17 61,236 47,192 Debt securities in issue 15, 31 64,589 55,979 Other liabilities 15, 32 27,338 24,285 Current tax liabilities 1,050 1,066 Accruals and deferred income 4,668 4,811 Subordinated liabilities and other borrowed funds 15, 33 20,397 18,588
Deferred tax liabilities 28 176 161 Provisions for liabilities and charges 34 107 215 Retirement benefit obligations 35 365 491 Total liabilities 627,539 585,153
Equity
Share capital 36 1,214 1,207 Reserves 45,032 44,155 Total parent company shareholders’ equity 46,246 45,362

RATIO ANALYSIS OF STANDARD CHARTERED BANK
76 | P a g e
Non-controlling interests 37 595 693 Total equity 46,841 46,055 Total equity and liabilities 674,380 631,208