rating equity in sa and the financial impacts on local
TRANSCRIPT

RATING EQUITY IN SA AND THE FINANCIAL IMPACTS ON LOCAL GOVERNMENT’S ABILITY TO SUPPORT GROWTH LEGATUS GROUP FEBRUARY 2020

RATING EQUITY IN SA & THE FINANCIAL IMPACTS ON LOCAL GOVERNMENT’S ABILITY TO SUPPORT GROWTH
i
DOCUMENT CONTROL Job ID: J001628
Job Name: Rating Equity in SA and the Financial Impacts on Local Government’s Ability to Support Growth
Client: Legatus Group
Client Contact: Simon Millcock
Project Manager: Gavin O’Donovan
Email: [email protected]
Telephone: (07) 3831 0577
Document Name: Rating Equity Impact Assessment - Final Report
Last Saved: 2/2/2020 4:22 PM
Version Date Reviewed Approved
Draft Report 26/01/2020 GO GO Final Report 02/02/2020 GO GO
Disclaimer:
Whilst all care and diligence have been exercised in the preparation of this report, AEC Group Pty Ltd does not warrant the accuracy of the information contained within and accepts no liability for any loss or damage that may be suffered as a result of reliance on this information, whether or not there has been any error, omission or negligence on the part of AEC Group Pty Ltd or their employees. Any forecasts or projections used in the analysis can be affected by a number of unforeseen variables, and as such no warranty is given that a particular set of results will in fact be achieved.

RATING EQUITY IN SA & THE FINANCIAL IMPACTS ON LOCAL GOVERNMENT’S ABILITY TO SUPPORT GROWTH
ii
EXECUTIVE SUMMARY BACKGROUND In 2018, AEC’s Rating Equity report included recommendations to increase the flexibility for SA Councils in the categorisation of land uses for rating purposes to better reflect intensity of use, and to allow SA Councils to recover payments in lieu of rates directly from electricity generators under a regulated formula (as exists in Victoria). These recommendations are yet to be adopted, with the Minister for Local Government highlighting a concern that such changes may have a real impact on the commercial/industrial sector and there would need to be assurances of no negative impact on employment in regional areas. The Legatus Group, in partnership with other regional local government associations, commissioned this report to specifically analyse the impact of an amendment to rating policy to ensure that appropriate and equitable contributions from energy sector developments would not affect their viability and ongoing attraction, in addition to modelling the opportunity cost to regional employment.
INDUSTRY & COUNCIL/COMMUNITY IMPACT ASSESSMENT Figure E.1 shows a comparison of the cumulative energy generation capacity from wind and solar farms by state since 2000. The assessment highlights considerable growth in renewable energy capacity across Australia, with SA being an early adopter and capacity growing most rapidly in NSW, VIC and QLD in recent years. The substantial growth in renewable energy capacity in VIC and QLD relative to SA in recent years has occurred despite their respective State Governments enabling Councils to levy appropriate and equitable rates on (or receive payments made in lieu of rates from) energy sector developments which are considerably higher than the rates able to be levied by SA Councils.
Figure E.1: Wind Farm + Solar Farm Generation Capacity – Cumulative Since 2000
Source: AEC, AEMO (2019), assorted online sources.
The analysis suggests that the introduction by SA Councils of similar rating practices to VIC will not impact the commercial viability of energy sector projects, and therefore will not influence location decisions for investments in these projects. Presently, SA Council rates account for less than 0.1% of infrastructure lifecycle costs excluding financing for wind and solar farms, compared with 1% in VIC – these contributions halve when financial costs are included. Location decisions are primarily made with reference to electricity generation efficiencies and the ease with which connection can be made to the national grid. Further, no flow-on effects on electricity prices are anticipated from higher SA rates on energy sector projects given prices are determined in a national market where other generators are already levied higher Council rates.
Under current SA Government valuation and rating policy, the estimated annual revenue foregone by SA regional Councils when compared to VIC Government rating policy is estimated at $4.8 million (as shown in Table E.1), which equates to $120.9 million over 25 years (equal to the asset life for the majority of renewable energy sector developments). It should be noted here that the actual revenue loss for SA Councils is much greater when
-
500
1,000
1,500
2,000
2,500
3,000
3,500
20
00
20
01
20
02
20
03
20
04
20
05
20
06
20
07
20
08
20
09
20
10
20
11
20
12
20
13
20
14
20
15
20
16
20
17
20
18
20
19
NSW VIC QLD WA SA TAS

RATING EQUITY IN SA & THE FINANCIAL IMPACTS ON LOCAL GOVERNMENT’S ABILITY TO SUPPORT GROWTH
iii
compared to the rates payable under the full capital valuation approach (as exists as the base position in VIC), with the estimated annual loss being around $26 million or $650 million over 25 years.
Allowing the regions to access this revenue has the potential to facilitate ongoing permanent employment of up to 43 jobs assuming the VIC regulated formula approach is adopted – maintaining current rating policy will prevent these additional regional employment opportunities from occurring. These Council and community impacts are expected to grow significantly in the short to medium term given the significant number of renewable energy projects currently under financial close and approved in SA regional areas.
Table E.1: Estimated Foregone Revenue from Energy Sector Developments for Regional SA Councils
Source: AEC, selected SA Councils.
Overall, this report shows that:
• The competitiveness of SA regions in attracting renewable energy developments will not be impacted by the proposed rating policy amendments particularly if rates levied are comparable with VIC. As such, there would be no negative impact on investment and employment opportunities in SA regions as a result of the proposed rating policy amendments.
• There is an opportunity to provide a financial, economic and social boost to SA regions through the proposed rating policy amendments, as the additional rate payments retained within local economies and communities is estimated to provide sufficient stimulus to sustainably create up to an additional 43 permanent full-time equivalent jobs in SA regions.
RECOMMENDATIONS As a result of the above findings, the following recommendations are made:
• Amendments to SA legislation to include electricity generation and storage plant and equipment in capital valuations (as occurs in VIC) and to allow energy sector developments to make appropriate payments in lieu of rates under a regulated formula subject to indexation consisting of a fixed payment per site and a variable payment based on installed capacity.
• Applicable developments subject to the rating policy amendments will include all current electricity generation and storage developments under existing technologies, as well as future generation and storage developments under existing and new technologies.
Council Current Contribution
Potential Contribution
Foregone Revenue
EYRE PENINSULALower Eyre Peninsula 4,288$ 138,801$ 134,513$ Port Lincoln 3,215$ 148,226$ 145,011$ Franklin Harbour 12,382$ 143,828$ 131,446$ LEGATUSBarossa 4,672$ 118,693$ 114,020$ Clare & Gilbert Valleys 29,441$ 389,201$ 359,760$ Goyder 16,141$ 741,064$ 724,923$ Northern Areas 70,600$ 934,842$ 864,242$ Peterborough 2,000$ 62,893$ 60,893$ Port Pirie 6,975$ 189,252$ 182,277$ Wakefield 26,050$ 519,595$ 493,545$ Yorke Peninsula 15,515$ 263,463$ 247,948$ LIMESTONE COASTWattle Range 26,067$ 898,225$ 872,158$ SOUTHERN & HILLSYankalilla 20,804$ 99,213$ 78,409$ UPPER SPENCER GULFPort Augusta 1,737$ 194,098$ 192,360$ MURRAYLANDS & RIVERLANDSCoorong 2,000$ 175,246$ 173,246$ Murray Bridge 2,000$ 62,139$ 60,139$ TOTAL 243,888$ 5,078,778$ 4,834,891$

RATING EQUITY IN SA & THE FINANCIAL IMPACTS ON LOCAL GOVERNMENT’S ABILITY TO SUPPORT GROWTH
iv
• Consideration of the means by which Councils located within reasonable proximity of energy sector developments in unincorporated areas that impact infrastructure and service provision are appropriately compensated via similar payment arrangements to ensure ratepayers are not financially impacted by these developments.
An indepth industry assessment found that no negative economic or employment effects would be felt by SA regions as a result of the above recommendations. In fact, adoption of the above recommendations may result in additional employment in SA regions of up to 43 full-time equivalent jobs from developments to date, with the extent of this benefit likely to increase with the addition of more developments in the future.

RATING EQUITY IN SA & THE FINANCIAL IMPACTS ON LOCAL GOVERNMENT’S ABILITY TO SUPPORT GROWTH
v
TABLE OF CONTENTS DOCUMENT CONTROL .......................................................................................................................................... I
EXECUTIVE SUMMARY ........................................................................................................................................ II
TABLE OF CONTENTS ......................................................................................................................................... V
1. INTRODUCTION ............................................................................................................................................ 1
1.1 BACKGROUND .............................................................................................................................................. 1
1.2 PURPOSE OF THIS REPORT ............................................................................................................................ 1
1.3 APPROACH .................................................................................................................................................. 1
2. INDUSTRY ASSESSMENT ........................................................................................................................... 2
2.1 ENERGY SECTOR DEVELOPMENT PROFILE ...................................................................................................... 2
2.2 UNDERLYING DRIVERS OF LOCATION DECISIONS ............................................................................................. 6
2.3 INFLUENCE OF LOCAL GOVERNMENT RATES ON ENERGY SECTOR DEVELOPMENTS ............................................. 7
2.4 KEY FINDINGS .............................................................................................................................................. 8
3. IMPACT ON REGIONAL COUNCILS & COMMUNITIES ............................................................................. 9
3.1 IMPACT ON REGIONAL COUNCILS ................................................................................................................... 9
3.2 IMPACT ON REGIONAL COMMUNITIES ............................................................................................................ 11
3.3 GROWING IMPACTS ON COUNCILS & COMMUNITIES ........................................................................................ 11
3.4 KEY FINDINGS ............................................................................................................................................ 12
4. FINDINGS & RECOMMENDATIONS .......................................................................................................... 13
4.1 FINDINGS ................................................................................................................................................... 13
4.2 RECOMMENDATIONS ................................................................................................................................... 13
REFERENCES...................................................................................................................................................... 15
APPENDIX A: VICTORIAN LEGISLATIVE PROVISION FOR PAYMENTS BY ENERGY SECTOR DEVELOPMENTS ....................................................................................................................................... 16
APPENDIX B: INPUT-OUTPUT METHODOLOGY .............................................................................................. 19

RATING EQUITY IN SA & THE FINANCIAL IMPACTS ON LOCAL GOVERNMENT’S ABILITY TO SUPPORT GROWTH
1
1. INTRODUCTION 1.1 BACKGROUND In 2018, AEC assisted the Legatus Group in developing recommendations to increase the flexibility for SA Councils in the categorisation of different land uses for rating purposes to better reflect intensity of land use, and to allow SA Councils to recover payments in lieu of rates directly from electricity generators under a regulated formula (as exists in Victoria). As yet, these recommendations have not been adopted, with the SA Minister for Local Government highlighting a concern that such changes may have a real impact on the commercial and industrial sector and there would need to be assurances that there would not be a negative impact on employment in regional areas.
1.2 PURPOSE OF THIS REPORT The Legatus Group, in partnership with other regional local government associations, commissioned this report to analyse and model the impact and potential opportunity cost to employment and regional growth by not addressing the rating inequity issues identified in the 2018 AEC report – specifically the impacts associated with the inability to effectively rate electricity generation and storage developments.
The assessment also investigates the potential negative effects on investment (and associated employment outcomes) in SA regions by energy sector developments from an increase in rates and compares these impacts with the extent of financial loss to SA Councils and/or the local economic and employment effects associated with SA Councils being unable to levy appropriate payments on energy sector developments.
The findings of the report should assist in providing government with an informed basis upon which to decide on the appropriateness or otherwise from implementing the recommendations within the 2018 AEC report.
1.3 APPROACH The approach adopted in the report is as follows:
• Undertake an industry assessment that profiles renewable energy sector developments across Australia in recent years, including:
o Comparison of the level of development in SA relative to other states.
o Consideration of the underlying drivers of location decisions for energy sector developments.
o Influence of local government rating levels on location decisions and potential investment and employment effects from an increase in rates levied by SA Councils.
• Estimate the extent of foregone rate revenue by SA Councils in regional areas by not being able to rate energy sector developments appropriately and determine associated employment effects.

RATING EQUITY IN SA & THE FINANCIAL IMPACTS ON LOCAL GOVERNMENT’S ABILITY TO SUPPORT GROWTH
2
2. INDUSTRY ASSESSMENT 2.1 ENERGY SECTOR DEVELOPMENT PROFILE
2.1.1 Energy Generation Overview
The majority of Australia’s energy is currently generated through fossil fuels, although the composition of energy generation has changed markedly in recent years as a result of considerable investment in wind and solar farms. The figure below highlights that wind, solar, hydro and battery developments are likely to comprise the majority of Australia’s energy generation in the future. Energy generation in Australia and globally is seeing a push towards a higher proportion of renewable energy as a result of renewable energy and emissions reduction targets and technological advancements.
Figure 2.1: National Energy Market Scheduled, Semi-Scheduled & Non-Scheduled Electricity Generation (MW) – Existing, Withdrawing, Committed & Proposed Developments, 2019
Source: AEMO (2019). Notes: Solar excludes Rooftop PV installations.
SA generates a significant proportion of its energy generation through renewable energy sources – accounting for 50% of total electricity generation in 20181 – the clear majority of which is via wind farms (when excluding household rooftop solar PV systems). Non-renewable energy generation in SA is mainly via natural gas-fired plants, with approximately 60% of SA natural gas used for electricity generation. A small amount of electricity is generated from diesel-fired power stations which generally operate during peak demand periods.
The SA Government has a 2030 target of 100% renewable energy generation showing its commitment to further growing the renewable energy sector.
1 Climate Council, 2019.
0
5,000
10,000
15,000
20,000
25,000
30,000
35,000
Coal CCGT OCGT Gasother
Solar* Wind Water Biomass BatteryStorage
Other
Gen
erat
ion
Cap
acity
(MW
)
Existing Existing to be Withdrawn Committed Proposed

RATING EQUITY IN SA & THE FINANCIAL IMPACTS ON LOCAL GOVERNMENT’S ABILITY TO SUPPORT GROWTH
3
2.1.2 Renewable Energy Sector Developments
An industry assessment was undertaken of renewable energy sector developments across Australia focussing on wind and solar farms using a range of online sources. The outcomes of the assessment are presented in Figures 2.2 and 2.3 below, which show total cumulative generation capacity since 2000 and capacity additions since 2010, respectively. Breakdowns of the composition between wind farms and solar farms are provided on the following page.
Figure 2.2: Wind Farm + Solar Farm Generation Capacity – Cumulative Since 2000
Source: AEC, AEMO (2019), assorted online sources.
Figure 2.3: Wind Farm + Solar Farm Generation Capacity – Additions Since 2010
Source: AEC, AEMO (2019), assorted online sources.
The following trends are evident:
• SA wind farm capacity has grown consistently for 15 years, with solar farm capacity growing modestly in the past few years.
• NSW and VIC were slower to install wind and solar farm capacity but are now installing capacity at a rapid pace.
• QLD wind and solar farm capacity (particularly solar) is being added at a rapid pace after capacity only begun to be added in 2017.
• SA had the highest renewable energy generation capacity until recently, but heading into 2020 VIC, NSW and QLD now exceed SA’s generation capacity due to recent strong additions for both wind and solar generation.
-
500
1,000
1,500
2,000
2,500
3,000
3,500
20
00
20
01
20
02
20
03
20
04
20
05
20
06
20
07
20
08
20
09
20
10
20
11
20
12
20
13
20
14
20
15
20
16
20
17
20
18
20
19
NSW VIC QLD WA SA TAS
-
200
400
600
800
1,000
1,200
1,400
1,600
20
10
20
11
20
12
20
13
20
14
20
15
20
16
20
17
20
18
20
19
NSW VIC QLD WA SA TAS

RATING EQUITY IN SA & THE FINANCIAL IMPACTS ON LOCAL GOVERNMENT’S ABILITY TO SUPPORT GROWTH
4
Figure 2.4: Wind Farm Generation Capacity – Cumulative Since 2000 Figure 2.5: Solar Farm Generation Capacity – Cumulative Since 2000
Source: AEC, AEMO (2019), assorted online sources. Source: AEC, AEMO (2019), assorted online sources.
Figure 2.6: Wind Farm Generation Capacity – Additions Since 2010 Figure 2.7: Solar Farm Generation Capacity – Additions Since 2010
Source: AEC, AEMO (2019), assorted online sources. Source: AEC, AEMO (2019), assorted online sources.
-
500
1,000
1,500
2,000
2,500
3,000
20
00
20
01
20
02
20
03
20
04
20
05
20
06
20
07
20
08
20
09
20
10
20
11
20
12
20
13
20
14
20
15
20
16
20
17
20
18
20
19
NSW VIC QLD WA SA TAS
-
500
1,000
1,500
2,000
2,500
3,000
20
00
20
01
20
02
20
03
20
04
20
05
20
06
20
07
20
08
20
09
20
10
20
11
20
12
20
13
20
14
20
15
20
16
20
17
20
18
20
19
NSW VIC QLD WA SA TAS
-
200
400
600
800
1,000
1,200
20
10
20
11
20
12
20
13
20
14
20
15
20
16
20
17
20
18
20
19
NSW VIC QLD WA SA TAS
-
200
400
600
800
1,000
1,200
20
10
20
11
20
12
20
13
20
14
20
15
20
16
20
17
20
18
20
19
NSW VIC QLD WA SA TAS

RATING EQUITY IN SA & THE FINANCIAL IMPACTS ON LOCAL GOVERNMENT’S ABILITY TO SUPPORT GROWTH
5
In the past five years, SA’s share of Australia’s wind and solar farm generation capacity has dropped from 39% to 21% as accelerated development in renewable energy has occurred in NSW, QLD and VIC.
Figure 2.8: National Wind Farm + Solar Farm Generation Capacity Contribution, 2014 vs 2019
Source: AEC, AEMO (2019), assorted online sources.
From 2014 to 2019, the following growth outcomes are evident for wind and solar generation farm capacity:
• 21059% growth in QLD (over a pretty much non-existent base), contributing 32% of national capacity additions. • 553% growth in NSW, contributing 27% of national rm capacity additions. • 298% growth in VIC, contributing 27% of national capacity additions. • 168% growth in SA (off a relatively high base), contributing 13% of national capacity additions. • 136% growth in TAS, contributing 1% of national capacity additions. • 110% growth in WA, contributing 1% of national capacity additions.
Overall, SA’s recent growth in percentage terms is relatively modest when compared to QLD, NSW and VIC. However, SA was coming off a high base relative to other states in terms of wind and solar farm generation capacity. Further, compared a national population share of 7.1%, SA’s growth has still outperformed its relative size.
For information purposes, the following figure includes hydro generation capacity in comparing renewable energy capacity across states. SA’s share of national renewables generation capacity drops back from 21% to 12% when including hydro.
Figure 2.9: National Wind Farm + Solar Farm + Hydro Generation Capacity Contribution, 2019
Source: AEC, AEMO (2019), assorted online sources.
27%
28%16%
3%
12%
14%
NSW VIC QLD WA SA TAS

RATING EQUITY IN SA & THE FINANCIAL IMPACTS ON LOCAL GOVERNMENT’S ABILITY TO SUPPORT GROWTH
6
A high-level assessment of projects under construction and in the pipeline indicates that both VIC (particularly wind) and NSW (particularly solar) have very large additions coming online in 2020 and 2021 that will considerably increase their overall contribution to national renewable energy capacity. SA’s potential supply in terms of approved projects also appears quite strong.
2.1.3 Employment Effects from Renewable Energy Projects
Construction employment (temporary effects) for renewable energy projects varies by project depending on size and construction timeframe. Construction workforces are generally FIFO and sourced from outside regional areas. Based on information sourced for existing projects, the following is noted:
• 1.07 construction workers per MW installed in wind farms (sample of 32 projects).
• 1.99 construction workers per MW installed in solar farms (sample of 40 projects).
From an operational perspective (ongoing effects), renewable energy projects are not very labour intensive. Much of the labour required – particularly for maintenance – is specialist in nature and sourced from outside of regional areas. Operational employment is generally 3-5 FTEs per solar/wind farm but can increase for larger wind farms to around 1 FTE per 15-20MW installed (e.g. 10-15 FTEs for 200MW installed capacity).
2.2 UNDERLYING DRIVERS OF LOCATION DECISIONS Given a relatively stable installation cost outside of specific site nuances, environmental factors are the key drivers of location decisions for both wind and solar farms, including the extent and frequency of strong winds and solar radiation factors which drive the efficiency with which electricity is able to be generated. For example, Figure 2.10 provides an indication of mean wind speed 80m above ground level across Australia and highlights SA’s competitive advantage in wind power generation capability relative to NSW and QLD. A further consideration is the proximity and ease of connection to the electricity network and capacity of associated infrastructure in transmitting the generated electricity (supply) to customers (demand).
Figure 2.10: Mean Wind Speed, 80m Above Ground Level
Source: Australian Government (2008).

RATING EQUITY IN SA & THE FINANCIAL IMPACTS ON LOCAL GOVERNMENT’S ABILITY TO SUPPORT GROWTH
7
2.3 INFLUENCE OF LOCAL GOVERNMENT RATES ON ENERGY SECTOR DEVELOPMENTS
2.3.1 Rating Structures in VIC & QLD
The 2018 AEC Rating Equity report included a full assessment of interstate rating structures. Specific to energy sector developments, it found that SA Councils and communities are at a relative financial disadvantage when compared to VIC and QLD Councils and communities in levying rates, or receiving payment in lieu of rates, from energy sector developments.
In VIC, Councils levy rates generally based on capital value, with capital improved value for energy sector developments including the value of all electricity generating plant and equipment. Section 94(6A) of the Electricity Industry Act 2000 allows electricity generators to make payments to Council in lieu of general rates (rather than landowners). The prescribed methodology for the payments was established by order in Council and published via Government Gazette on 25th August 2005 and is based on the following components:
• Base payment of $40,000 per annum (June 2005 value subject to indexation) for each power station of the generation company, which equates to $55,855 in present day terms after indexation is applied.
• Capacity payment of $900 per MW (June 2005 value subject to indexation) of the nameplate rating for each generating unit comprising the power station, which equates to $1,257/MW in present day terms after indexation is applied.
Where the average capacity factor for the power station for a financial year is less than 10% the amount payable is reduced by 50%, and where it is less than 20% the amount payable is reduced by 25%.
Payments made by energy sector entities to Councils may be increased or decreased based on agreement between the two parties after considering other factors such as the age and efficiency of the power station and/or the impact of the energy sector development on the local area. Payment structures and other arrangements are to be agreed by the two parties or via an arbitrator if agreement cannot be reached. Details of the VIC arrangements are included in Appendix A.
In QLD, many Councils separately categorise energy sector developments on the basis of installed MW capacity for rating purposes, with minimum rates for projects generating 50MW up to 400MW levied at a rate of up to $1,500/MW of installed capacity with a benchmark median of around $750/MW of installed capacity. Differential rates in the dollar (which are levied on site/unimproved values) levied on energy sector developments can also be up to 20 times the base residential rate in the dollar.
Section 2.1.2 highlights that there has been much stronger growth in renewable energy capacity in VIC and QLD relative to SA in recent years, despite their respective State Governments enabling Councils to levy appropriate and equitable rates on (or receive payments made in lieu of rates from) energy sector developments which are considerably higher than the rates able to be levied by SA Councils under current rating powers.
2.3.2 Influence of SA Council Rates on Project Investment & Commercial Viability
In order to assess the influence of Council rates on energy sector developments, it is important to consider the annual lifecycle costs of developments and the contribution of Council rates as an operating cost component to those lifecycle costs.
The following estimate has been produced for annual lifecycle costs excluding financing:
• Capital establishment costs (adopting useful lives of 25 years):
o $100,000 per MW of installed capacity for wind farms.
o $80,000 per MW of installed capacity for solar farms.
• Operating costs (inclusive of labour, landowner lease payments, maintenance, other):
o $25,000 per MW of installed capacity for wind farms.
o $20,000 per MW of installed capacity for solar farms.

RATING EQUITY IN SA & THE FINANCIAL IMPACTS ON LOCAL GOVERNMENT’S ABILITY TO SUPPORT GROWTH
8
The total annual infrastructure lifecycle cost per MW of installed capacity is estimated at $125,000 for wind farms and $100,000 for solar farms, excluding financing costs. The inclusion of financing costs doubles these total annual infrastructure lifecycle cost estimates to $250,000 for wind farms and $200,000 for solar farms.
Based on Council rates paid on existing wind and solar farm developments in SA, the median outcomes for rates levied on these developments is 0.07% of infrastructure lifecycle costs excluding financing for wind farms and 0.02% of infrastructure lifecycle costs excluding financing for solar farms. These estimates halve when including financing costs in the lifecycle cost estimates. By comparison, rates levied by VIC Councils on electricity developments are estimated to account for around 1% of infrastructure lifecycle costs excluding financing and 0.5% of infrastructure lifecycle costs including financing. It is evident that SA Council rating levels do not impact the commercial viability of energy sector projects, and therefore do not influence location decisions for investment in these projects.
Section 2.1.2 highlights that energy sector development and investment in VIC has not been impeded by the rates levied by VIC councils on electricity developments. As such, any introduction of similar rating practices will also not impact the commercial viability of energy sector projects, and therefore will not influence location decisions for investment in these projects nor will they impact SA’s competitiveness in attracting these projects to regional areas.
The preceding analysis therefore confirms that overall investment and employment opportunities in SA’s regional areas will not be affected by the proposed amendments to rating structures levied on the energy sector.
2.4 KEY FINDINGS
The key findings of the industry assessment include:
• Renewable energy capacity has grown much more rapidly in NSW, VIC and QLD in recent years, although SA’s installed capacity relative to its population size remains high.
• There has been much stronger growth in renewable energy capacity in VIC and QLD relative to SA in recent years, despite their respective State Governments enabling Councils to levy appropriate and equitable rates on (or receive payments made in lieu of rates from) energy sector developments which are considerably higher than the rates able to be levied by SA Councils.
• Looking at median outcomes, SA Council rates presently account for 0.07% of lifecycle costs excluding financing for wind farms and 0.02% of infrastructure lifecycle costs excluding financing for solar farms, compared with 1% in VIC – these contributions halve when financing costs are included.
• The introduction by SA Councils of similar rating practices to VIC will not impact the commercial viability of energy sector projects, and therefore will not influence location decisions for investments in these projects.
• Location decisions are primarily made with reference to electricity generation efficiencies and the ease with which connection can be made to the national grid.
• No flow-on effects on electricity prices are anticipated from higher SA rates resulting from the introduction of the proposed amendments to rating structures levied on the energy sector given prices are determined within a national market where other generators are already levied higher rates.
Overall, the industry assessment highlights that the competitiveness of SA regions in attracting renewable energy developments will not be impacted by the proposed rating policy amendments particularly if rates levied are comparable with VIC. As such, there would be no negative impact on investment and employment opportunities in SA regions as a result of the proposed rating policy amendments.
RATING EQUITY IN SA & THE FINANCIAL IMPACTS ON LOCAL GOVERNMENT’S ABILITY TO SUPPORT GROWTH
9
3. IMPACT ON REGIONAL COUNCILS & COMMUNITIES
3.1 IMPACT ON REGIONAL COUNCILS
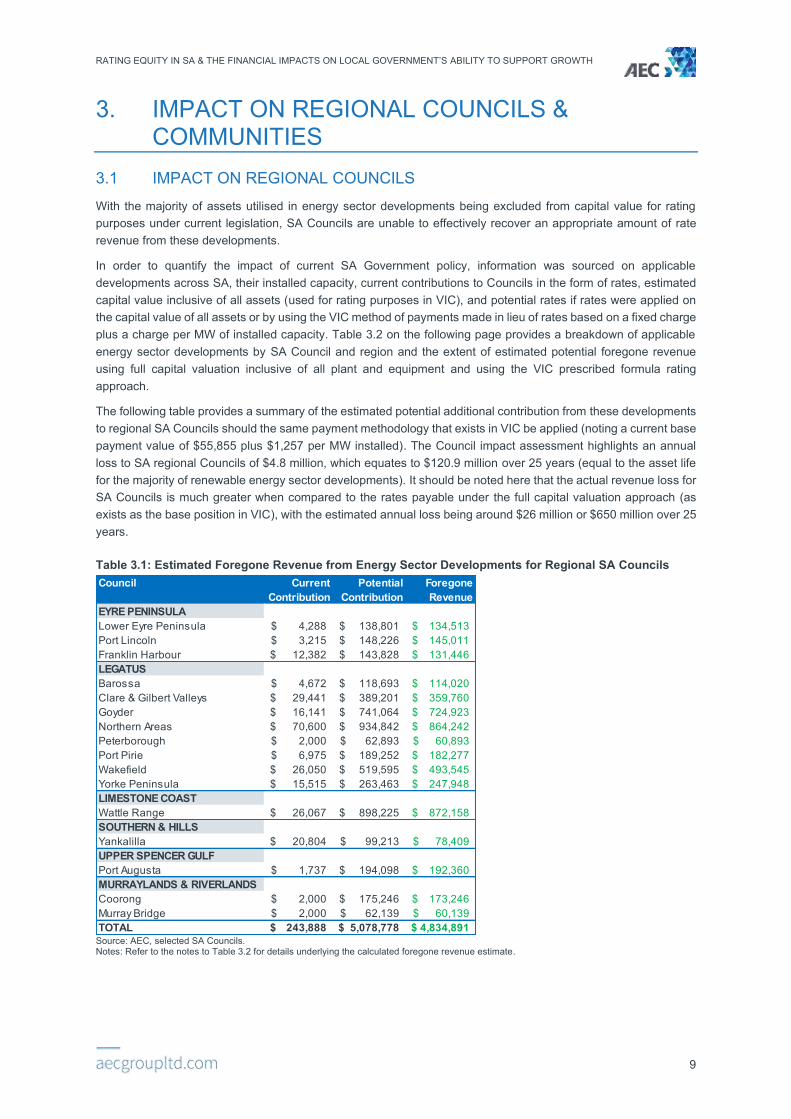
With the majority of assets utilised in energy sector developments being excluded from capital value for rating purposes under current legislation, SA Councils are unable to effectively recover an appropriate amount of rate revenue from these developments.
In order to quantify the impact of current SA Government policy, information was sourced on applicable developments across SA, their installed capacity, current contributions to Councils in the form of rates, estimated capital value inclusive of all assets (used for rating purposes in VIC), and potential rates if rates were applied on the capital value of all assets or by using the VIC method of payments made in lieu of rates based on a fixed charge plus a charge per MW of installed capacity. Table 3.2 on the following page provides a breakdown of applicable energy sector developments by SA Council and region and the extent of estimated potential foregone revenue using full capital valuation inclusive of all plant and equipment and using the VIC prescribed formula rating approach.
The following table provides a summary of the estimated potential additional contribution from these developments to regional SA Councils should the same payment methodology that exists in VIC be applied (noting a current base payment value of $55,855 plus $1,257 per MW installed). The Council impact assessment highlights an annual loss to SA regional Councils of $4.8 million, which equates to $120.9 million over 25 years (equal to the asset life for the majority of renewable energy sector developments). It should be noted here that the actual revenue loss for SA Councils is much greater when compared to the rates payable under the full capital valuation approach (as exists as the base position in VIC), with the estimated annual loss being around $26 million or $650 million over 25 years.
Table 3.1: Estimated Foregone Revenue from Energy Sector Developments for Regional SA Councils
Source: AEC, selected SA Councils. Notes: Refer to the notes to Table 3.2 for details underlying the calculated foregone revenue estimate.
Council Current Contribution
Potential Contribution
Foregone Revenue
EYRE PENINSULALower Eyre Peninsula 4,288$ 138,801$ 134,513$ Port Lincoln 3,215$ 148,226$ 145,011$ Franklin Harbour 12,382$ 143,828$ 131,446$ LEGATUSBarossa 4,672$ 118,693$ 114,020$ Clare & Gilbert Valleys 29,441$ 389,201$ 359,760$ Goyder 16,141$ 741,064$ 724,923$ Northern Areas 70,600$ 934,842$ 864,242$ Peterborough 2,000$ 62,893$ 60,893$ Port Pirie 6,975$ 189,252$ 182,277$ Wakefield 26,050$ 519,595$ 493,545$ Yorke Peninsula 15,515$ 263,463$ 247,948$ LIMESTONE COASTWattle Range 26,067$ 898,225$ 872,158$ SOUTHERN & HILLSYankalilla 20,804$ 99,213$ 78,409$ UPPER SPENCER GULFPort Augusta 1,737$ 194,098$ 192,360$ MURRAYLANDS & RIVERLANDSCoorong 2,000$ 175,246$ 173,246$ Murray Bridge 2,000$ 62,139$ 60,139$ TOTAL 243,888$ 5,078,778$ 4,834,891$

RATING EQUITY IN SA & THE FINANCIAL IMPACTS ON LOCAL GOVERNMENT’S ABILITY TO SUPPORT GROWTH
10
Table 3.2: Estimated Foregone Revenue from Energy Sector Developments for SA Councils – Capital Value Approach vs VIC Approach
Source: AEC, selected SA Councils. Notes: The base payment under the VIC formula is assumed as 1 charge per Council area per facility but may vary based on the numbers of sites/stages (e.g. 4 x Hallett Wind Farms). While the Hornsdale Power Reserve is currently rate exempt due to being tied to the SA Government, but proposed rates are still included in the above table to identify the revenue foregone due to this relationship. Current rates are estimated for the Peterborough, Tailem Bend and Mobilong Solar Farms, and the Cathedral Rocks and Snowtown Wind Farms (based on $50,000 valuation per wind turbine). Capital values were unavailable for power stations but are estimated for a few.
FACILITY ASSESSMENTSite Type Council MW Current
ContributionEst. Cap. Value $M
Fixed Charge
Rate in $ Potential Contribution
Foregone Revenue
Base $ MW $ Potential Contribution
Foregone Revenue
EYRE PENINSULACathedral Rocks Wind Farm Wind/Solar Farm Lower Eyre Peninsula 66 4,288$ 160$ 486$ 0.23040$ 369,126$ 364,838$ 55,855$ 82,945$ 138,801$ 134,513$ Port Lincoln Gas Turbine Power Station Port Lincoln 74 3,215$ n.a. 55,855$ 92,371$ 148,226$ 145,011$ Mt Millar Wind Farm Wind/Solar Farm Franklin Harbour 70 12,382$ 130$ 375$ 0.21000$ 273,375$ 260,993$ 55,855$ 87,972$ 143,828$ 131,446$ LEGATUSAngaston Power Station Power Station Barossa 50 4,672$ n.a. 55,855$ 62,837$ 118,693$ 114,020$ Mintaro Gas Turbine Station Power Station Clare & Gilbert Valleys 90 2,829$ n.a. 55,855$ 113,107$ 168,963$ 166,134$ Waterloo Wind Farm Wind/Solar Farm Clare & Gilbert Valleys 131 26,612$ 386$ -$ 0.49806$ 1,922,512$ 1,895,899$ 55,855$ 164,383$ 220,238$ 193,626$ Hallett Power Station Power Station Goyder 180 1,131$ n.a. 55,855$ 226,214$ 282,070$ 280,939$ Hallett Wind Farm Wind/Solar Farm Goyder 157 10,451$ 359$ 150$ 0.53270$ 1,911,094$ 1,900,643$ 55,855$ 197,278$ 253,133$ 242,683$ Willogoleche Wind Farm Wind/Solar Farm Goyder 119 4,560$ 250$ 150$ 0.53270$ 1,331,900$ 1,327,340$ 55,855$ 150,005$ 205,861$ 201,301$ Hornsdale Wind Farm Wind/Solar Farm Northern Areas 317 42,900$ 800$ 390$ 0.35130$ 2,810,790$ 2,767,890$ 55,855$ 398,137$ 453,993$ 411,093$ Hallett Wind Farm Wind/Solar Farm Northern Areas 194 27,700$ 469$ 390$ 0.35130$ 1,648,219$ 1,620,519$ 55,855$ 243,463$ 299,319$ 271,619$ Hornsdale Power Reserve Battery Storage Northern Areas 100 -$ 50$ 390$ 0.35130$ 176,040$ 176,040$ 55,855$ 125,675$ 181,530$ 181,530$ Peterborough Solar Farm Wind/Solar Farm Peterborough 6 2,000$ 10$ 375$ 0.40970$ 39,297$ 37,297$ 55,855$ 7,038$ 62,893$ 60,893$ Clements Gap Wind Farm Wind/Solar Farm Port Pirie 57 4,699$ 150$ 510$ 0.65850$ 988,260$ 983,561$ 55,855$ 71,258$ 127,113$ 122,414$ Pirie Solar Farm Wind/Solar Farm Port Pirie 5 2,276$ 9$ 510$ 0.65850$ 56,483$ 54,207$ 55,855$ 6,284$ 62,139$ 59,863$ Snowtown Wind Farm Wind/Solar Farm Wakefield 369 26,050$ 660$ 320$ 0.37290$ 2,461,460$ 2,435,410$ 55,855$ 463,740$ 519,595$ 493,545$ Wattle Point Wind Farm Wind/Solar Farm Yorke Peninsula 91 13,998$ 234$ 410$ 0.27853$ 652,170$ 638,172$ 55,855$ 114,050$ 169,905$ 155,907$ Dalrymple North Battery Battery Storage Yorke Peninsula 30 1,517$ 30$ 410$ 0.27853$ 83,969$ 82,452$ 55,855$ 37,702$ 93,558$ 92,041$ LIMESTONE COASTSnuggery Power Station Power Station Wattle Range 63 600$ 38$ -$ 0.59200$ 223,776$ 223,176$ 55,855$ 79,175$ 135,030$ 134,430$ Ladbroke Grove Power Station Power Station Wattle Range 80 600$ 30$ -$ 0.59200$ 177,600$ 177,000$ 55,855$ 100,540$ 156,395$ 155,795$ Lake Bonney Wind Farm Wind/Solar Farm Wattle Range 279 20,630$ 700$ -$ 0.59200$ 4,144,000$ 4,123,370$ 55,855$ 350,004$ 405,859$ 385,229$ Canunda Wind Farm Wind/Solar Farm Wattle Range 46 4,237$ 93$ -$ 0.59200$ 547,600$ 543,363$ 55,855$ 57,810$ 113,666$ 109,429$ Lake Bonney Battery Battery Storage Wattle Range 25 -$ 38$ -$ 0.59200$ 224,960$ 224,960$ 55,855$ 31,419$ 87,274$ 87,274$ SOUTHERN & HILLSStarfish Hill Wind Farm Wind/Solar Farm Yankalilla 35 20,804$ 85$ -$ 0.52795$ 446,121$ 425,317$ 55,855$ 43,358$ 99,213$ 78,409$ UPPER SPENCER GULFBungala 1 Solar Power Project Wind/Solar Farm Port Augusta 110 1,737$ 236$ 55,855$ 138,242$ 194,098$ 192,360$ MURRAYLANDS & RIVERLANDSTailem Bend Solar Power Project Wind/Solar Farm Coorong 95 2,000$ 200$ 360$ 0.42200$ 844,360$ 842,360$ 55,855$ 119,391$ 175,246$ 173,246$ Mobilong Solar Farm Wind/Solar Farm Murray Bridge 5 2,000$ 9$ -$ 0.67541$ 57,410$ 55,410$ 55,855$ 6,284$ 62,139$ 60,139$ ADELAIDE METROTemporary Generation South Power Station Onkaparinga 123 n.a. n.a. 55,855$ 154,831$ 210,687$ n.a.Lonsdale Power Station Power Station Onkaparinga 20 n.a. n.a. 55,855$ 25,135$ 80,990$ n.a.Port Stanvac Power Station Power Station Onkaparinga 58 n.a. n.a. 55,855$ 72,389$ 128,244$ n.a.Temporary Generation North Power Station Playford 154 n.a. n.a. 55,855$ 193,539$ 249,394$ n.a.Osborne Power Station Power Station Port Adelaide Enfield 180 n.a. n.a. 55,855$ 226,214$ 282,070$ n.a.Pelican Point Power Station Power Station Port Adelaide Enfield 478 n.a. n.a. 55,855$ 600,725$ 656,580$ n.a.Dry Creek Gas Turbine Station Power Station Port Adelaide Enfield 156 n.a. n.a. 55,855$ 196,053$ 251,908$ n.a.UNINCORPORATEDBarker Inlet Power Station Power Station Unincorporated 211 n.a. n.a. 55,855$ 265,174$ 321,029$ n.a.Torrens Island Power Station Power Station Unincorporated 1,280 n.a. n.a. 55,855$ 1,608,636$ 1,664,492$ n.a.Quarantine Power Station Power Station Unincorporated 229 n.a. n.a. 55,855$ 287,795$ 343,650$ n.a.Lincoln Gap Wind Farm Wind/Solar Farm Unincorporated 212 n.a. 500$ 55,855$ 266,933$ 322,788$ n.a.Bungala 2 Solar Power Project Wind/Solar Farm Unincorporated 110 n.a. 236$ 55,855$ 138,242$ 194,098$ n.a.
PAYMENT USING VIC FORMULARATES UNDER FULLY CAPITALISED VALUE
Capital value unavailable
Capital value unavailableCapital value unavailableCapital value unavailable
Capital value unavailable
No rates levied
Capital value unavailable
No rates leviedNo rates leviedNo rates leviedNo rates levied
Capital value unavailable
Council uses site value
Capital value unavailable
Capital value unavailable
Capital value unavailable
Capital value unavailable

RATING EQUITY IN SA & THE FINANCIAL IMPACTS ON LOCAL GOVERNMENT’S ABILITY TO SUPPORT GROWTH
11
3.2 IMPACT ON REGIONAL COMMUNITIES It is important to highlight that any additional rates paid by energy sector developments to SA regional Councils would be considered ‘new’ money to the regions from an economic activity standpoint. This is the case whether the Councils are provided with greater capacity for additional spending to ensure appropriate services and service levels are provided within their respective communities or Councils are able to offset the payments against otherwise higher rates that would need to be paid by local residents and businesses. As such, the proposed rating policy amendments for energy sector developments would provide significant economic stimulus to SA regions.
AEC has internal economic impact models that it uses to determine the economic and employment effects of projects and policies. Two different economic impact assessment methodologies were adopted to estimate the employment effects for SA regional communities from additional rates paid of the order of $4.8 million by energy sector developments, including:
1. Increase in local government spending2:
o It is assumed that a portion of the additional funds is lost to the SA regional economy as a result of imports (25%) with the remaining portion of the additional funds (75%) spent within the SA regional economy.
o The estimated employment effects equate to 43 full-time equivalent jobs which includes 25 jobs from the initial stimulus, 4 jobs from production-induced (type 1 flow-on) impacts and 14 jobs from household consumption (type 2 flow-on) impacts.
o Enhancements to social infrastructure and local amenity are a key factor in facilitating population growth, economic growth and employment growth in regional areas and the identified additional funds to support local government infrastructure and service provision would help facilitate this growth in a sustainable manner.
2. Increase in incomes for households3 and local businesses4 due to lower rates than would otherwise need to be levied:
o It is assumed that the additional income split is 80% to households and 20% to local businesses.
o The estimated employment effects equate to 23 full-time equivalent jobs which includes 13 jobs from the initial stimulus, 3 jobs from production-induced (type 1 flow-on) impacts and 7 jobs from household consumption (type 2 flow-on) impacts.
The community impact assessment highlights a potential ongoing permanent employment benefit to SA regions of up to 43 jobs. Maintenance of current rating policy would prevent the identified additional regional employment opportunities from occurring.
3.3 GROWING IMPACTS ON COUNCILS & COMMUNITIES As outlined earlier, there are considerable renewable energy projects in the pipeline across Australia. Focussing on SA’s pipeline, there are a significant number of renewable energy projects currently under financial close and approved many of which are anticipated to come online in the next five years that will more than double current
2 The local government spending model uses data from the Input Output transaction tables regarding government consumption spend and gross fixed capital formation spend to estimate the breakdown of spend by industry.
3 The household spending calculation uses ratios from the household expenditure survey for the ratio of spend to incomes, and which industries expenditure is then allocated to.
4 The business spending calculation allocates the increase in available income to business investment based on the ratio of Gross Operating Surplus to gross fixed capital formation spend by business in the Input Output transaction tables and splits this by industry based on industry splits for gross fixed capital formation spend by business. After this, a second round of consumption spend is estimated based on increased incomes for people, which was derived by getting the ratio of consumption spend to total incomes from the Input Output transaction tables and applying to the remaining reduction in rates for business not already captured through business investment. This is then split to industry based on consumption spend by industry in the Input Output transaction tables.

RATING EQUITY IN SA & THE FINANCIAL IMPACTS ON LOCAL GOVERNMENT’S ABILITY TO SUPPORT GROWTH
12
generation capacity. It should be highlighted that the Council and community impacts identified in Sections 3.1 and 3.2 above have the potential to grow significantly in the short to medium term.
3.4 KEY FINDINGS
The key findings of the Council and community impact assessment include:
• Estimated annual revenue foregone for SA regional Councils under current SA Government rating policy of $4.8 million, which equates to $120.9 million over 25 years (equal to the asset life for the majority of renewable energy sector developments).
• A potential ongoing permanent employment benefit to SA regions of up to 43 jobs from adopting the VIC method of rating energy sector developments – maintaining current rating policy will prevent these additional regional employment opportunities from occurring.
• These Council and community impacts are expected to grow significantly in the short to medium term given the significant number of renewable energy projects currently under financial close and approved in SA regional areas.
Overall, the Council and community impact assessment highlights that the proposed amendment to rating of energy sector developments has the opportunity to provide a financial, economic and social boost to SA regions. Additional rate payments retained within local economies and communities are anticipated to provide sufficient stimulus to sustainably create up to an additional 43 permanent full-time equivalent jobs.

RATING EQUITY IN SA & THE FINANCIAL IMPACTS ON LOCAL GOVERNMENT’S ABILITY TO SUPPORT GROWTH
13
4. FINDINGS & RECOMMENDATIONS 4.1 FINDINGS The industry assessment highlights considerable growth in renewable energy capacity across Australia, with SA being an early adopter and capacity growing most rapidly in NSW, VIC and QLD in recent years. The substantial growth in renewable energy capacity in VIC and QLD relative to SA in recent years has occurred despite their respective State Governments enabling Councils to levy appropriate and equitable rates on (or receive payments made in lieu of rates from) energy sector developments which are considerably higher than the rates able to be levied by SA Councils.
The introduction by SA Councils of similar rating practices to VIC will not impact the commercial viability of energy sector projects, and therefore will not influence location decisions for investments in these projects. Presently, SA Council rates account for less than 0.1% of infrastructure lifecycle costs excluding financing for wind and solar farms, compared with 1% in VIC. Location decisions are primarily made with reference to electricity generation efficiencies and the ease with which connection can be made to the national grid. Further, no flow-on effects on electricity prices are anticipated from higher SA rates on energy sector developments given prices are determined within a national market where other generators are already levied higher rates.
Under current SA Government valuation and rating policy, the estimated annual revenue foregone by SA regional Councils when compared to VIC Government rating policy is estimated at $4.8 million, which equates to $120.9 million over 25 years (equal to the asset life for the majority of renewable energy sector developments). It should be noted here that the actual revenue loss for SA Councils is much greater when compared to the rates payable under the full capital valuation approach (as exists as the base position in VIC), with the estimated annual loss being around $26 million or $650 million over 25 years.
Allowing the regions to access the additional revenue has the potential to facilitate ongoing permanent employment of up to 43 jobs assuming the VIC regulated formula approach is adopted – maintaining current rating policy will prevent these additional regional employment opportunities from occurring. These Council and community impacts are expected to grow significantly in the short to medium term given the significant number of renewable energy projects currently under financial close and approved in SA regional areas.
Overall, this report shows that:
• The competitiveness of SA regions in attracting renewable energy developments will not be impacted by the proposed rating policy amendments particularly if rates levied are comparable with VIC. As such, there would be no negative impact on investment and employment opportunities in SA regions as a result of the proposed rating policy amendments.
• There is an opportunity to provide a financial, economic and social boost to SA regions through the proposed rating policy amendments, as the additional rate payments retained within local economies and communities are estimated to provide sufficient stimulus to sustainably create up to an additional 43 permanent full-time equivalent jobs in SA regions.
4.2 RECOMMENDATIONS As a result of the above findings, the following recommendations are made:
• Amendments to SA legislation to include electricity generation and storage plant and equipment in capital valuations (as occurs in VIC) and to allow energy sector developments to make appropriate payments in lieu of rates under a regulated formula subject to indexation consisting of a fixed payment per site and a variable payment based on installed capacity.
• Applicable developments subject to the rating policy amendments will include all current electricity generation and storage developments under existing technologies, as well as future generation and storage developments under existing and new technologies.
• Consideration of the means by which Councils located within reasonable proximity of energy sector developments in unincorporated areas that impact infrastructure and service provision are appropriately

RATING EQUITY IN SA & THE FINANCIAL IMPACTS ON LOCAL GOVERNMENT’S ABILITY TO SUPPORT GROWTH
14
compensated via similar payment arrangements to ensure ratepayers are not financially impacted by these developments.
An indepth industry assessment found that no negative economic or employment effects would be felt by SA regions as a result of the above recommendations. In fact, adoption of the above recommendations may result in additional employment in SA regions of up to 43 full-time equivalent jobs from developments to date, with the extent of this benefit likely to increase with the addition of more developments in the future.

RATING EQUITY IN SA & THE FINANCIAL IMPACTS ON LOCAL GOVERNMENT’S ABILITY TO SUPPORT GROWTH
15
REFERENCES ABS (2012). Census of Population and Housing 2011 – Employment by Place of Work. Cat. No. 2068.0. Australian
Bureau of Statistics, Canberra.
ABS (2017). Census of Population and Housing 2016. TableBuilder. Australian Bureau of Statistics, Canberra.
ABS (2017). Household Expenditure Survey, Australia: Summary of Results, 2015-16. Cat. No. 6530.0, Australian Bureau of Statistics, Canberra.
ABS (2019a). Australian National Accounts: Input-Output Tables – Electronic Publication, 2016-17 tables. Cat. No. 5209.0.55.001, Australian Bureau of Statistics, Canberra.
ABS (2019b). Labour Force, Australia, Detailed, Quarterly. Cat. No. 6291.0.55.003, Australian Bureau of Statistics, Canberra.
ABS (2019c). Consumer Price Index, Australia. Cat. No. 6401.0, Australian Bureau of Statistics, Canberra.
AEC (2018). Rating Equity for Commercial and/or Industrial Land Uses Outside Towns in South Australia, Prepared on Behalf of Legatus Group, June 2018.
AEMO (2019). Generation Information, https://www.aemo.com.au/energy-systems/electricity/national-electricity-market-nem/nem-forecasting-and-planning/forecasting-and-planning-data/generation-information
AEMO (2019). NEM Registration and Exemption List, https://www.aemo.com.au/energy-systems/electricity/national-electricity-market-nem/participate-in-the-market/information-for-current-participants/participants-registered-for-the-nem
AEMO (2019). Market Data Western Australia – Facilities, http://data.wa.aemo.com.au/#facilities:download
Australian Government (2008). Renewable Energy Atlas of Australia: Mean Wind Speed at 80m Above Ground Level, Environmental Resources Information Network, Department of the Environment, Water, Heritage and the Arts, October 2008, https://upload.wikimedia.org/wikipedia/commons/9/9e/Renewable_Energy_Atlas_of_Australia_Mean_Wind_Speed_80m_above_ground_level.jpg
Climate Council (2019). South Australia hits 50% as the march to renewables continues. Climate Council.
DoESSFB (2019). Small Area Labour Market Data. Department of Employment, Skills, Small and Family Business.
Parkinson G. Vorrath, S (2019). South Australia has 10GW wind and solar in pipeline as it heads to 100% renewables. Renew Economy, 23 July 2019, https://reneweconomy.com.au/south-australia-has-10gw-wind-and-solar-in-pipeline-as-it-heads-to-100-renewables-65116/
South Australian Government (2018). SA’s Electricity Supply and Market. South Australian Government, Adelaide.
Victorian Government (2019). Electricity Industry Act 2000, Act No. 68/2000.
Victorian Government (2005). Victoria Government Gazette, No. G 34 Thursday 25 August 2005.
West, G. R. (1993). User’s Guide, Input-Output Analysis for Practitioners an Interactive Input-Output Software Package Version 7.1. Department of Economics. University of Queensland, 1993.

RATING EQUITY IN SA & THE FINANCIAL IMPACTS ON LOCAL GOVERNMENT’S ABILITY TO SUPPORT GROWTH
16
APPENDIX A: VICTORIAN LEGISLATIVE PROVISION FOR PAYMENTS BY ENERGY SECTOR DEVELOPMENTS Extracts of the Electricity Industry Act 2000 and order in Council published via Government Gazette regarding payments from energy sector entities in lieu of general rates in Victoria are provided below.
Electricity Industry Act 2000 No. 68 of 2000
Part 5 – Powers of electricity corporations
94 Rateability of certain property
(2) Despite anything to the contrary in the Local Government Act 1989, land is not occupied land for the purposes of that Act merely because any pole, wire or cable of a distribution company, transmission company or generation company is on, under or over that land.
(3) The Loy Yang B land is rateable land and an agreement under section 27 of the Loy Yang B Act 1992 in force immediately before 8 May 1997 has effect as if it had been entered into under subsection (4)(a) of this section.
(4) Despite anything in the Local Government Act 1989—
(a) a generation company, an associated entity of a generation company or an exempt generator that is liable to pay rates in respect of land used for generation functions may, instead of paying rates in respect of that land, elect by notice in writing given to the relevant council to pay amounts agreed or determined under subsection (5); or
(b) the relevant council may, by notice in writing given to a generation company, an associated entity of a generation company or an exempt generator that is liable to pay rates in respect of land used for generation functions, require that company, associated entity or exempt generator to pay, instead of rates in respect of that land, amounts agreed or determined under subsection (5).
(5) A generation company, associated entity or exempt generator that elects to, or is required to, pay amounts under this subsection must pay to the relevant council—
(a) such amount or amounts as are agreed between the generation company, associated entity or exempt generator and the relevant council, at such times as are so agreed; or
(b) if, at any time, the amount required to be paid is not the subject of an agreement under paragraph (a) or the prior determination of an arbitrator, such amount and at such times as are determined by an arbitrator jointly appointed by the generation company, associated entity or exempt generator and the relevant council or, if within a reasonable time they fail to agree on such an appointment, by the chairperson of the Victoria Grants Commission as arbitrator or by another arbitrator nominated by that chairperson.
(6) In determining an amount required to be paid under subsection (5), an arbitrator must have regard to any methodology prescribed by an Order under subsection (6A).
(6A) The Governor in Council may, by Order published in the Government Gazette, prescribe a methodology for determining amounts payable under subsection (5).
(6B) A power may only be exercised under subsection (6A) on the joint recommendation of the Minister and the Minister administering the Local Government Act 1989.
(7) The Commercial Arbitration Act 2011 applies to arbitrations under this section.
(8) Section 221 of the Local Government Act 1989 does not apply in relation to land owned or occupied by a generation company, an associated entity of a generation company or an exempt generator which is land used for generation functions.
(8A) A generation company, an associated entity of a generation company or an exempt generator is deemed for the purposes of this section to be liable to pay rates in respect of land used for generation functions if the generation company, the associated entity or the exempt generator—
(a) is liable to pay rates in respect of the land under the Local Government Act 1989; or
(b) is liable to pay rates in respect of the land under an agreement with the person who is liable to pay rates in respect of the land under the Local Government Act 1989.
(9) In this section—
associated entity, in relation to a generation company, means a person to whom an exemption under section 17 applies in respect of an activity relating to the generation of electricity for supply or sale, being an activity for which the generation company holds a licence under Part 2;
exempt generator means a person to whom an exemption under an Order made under section 17 applies in respect of the generation of electricity for supply or sale;

RATING EQUITY IN SA & THE FINANCIAL IMPACTS ON LOCAL GOVERNMENT’S ABILITY TO SUPPORT GROWTH
17
land used for generation functions means land used primarily for the generation of electricity on which a generation facility is situated—
(a) whether or not the land consists of more than one parcel of land; and
(b) if the land consists of more than one parcel, whether or not those parcels are contiguous or in the same ownership;
Loy Yang B land means the land shown hatched on the plan in Schedule 2 to the Loy Yang B Act 1992;
relevant council means any council in whose municipal district any land used for generation functions (or any part of that land) is situated.

RATING EQUITY IN SA & THE FINANCIAL IMPACTS ON LOCAL GOVERNMENT’S ABILITY TO SUPPORT GROWTH
18

RATING EQUITY IN SA & THE FINANCIAL IMPACTS ON LOCAL GOVERNMENT’S ABILITY TO SUPPORT GROWTH
19
APPENDIX B: INPUT-OUTPUT METHODOLOGY INPUT-OUTPUT MODEL OVERVIEW Input-Output analysis demonstrates inter-industry relationships in an economy, depicting how the output of one industry is purchased by other industries, households, the government and external parties (i.e. exports), as well as expenditure on other factors of production such as labour, capital and imports. Input-Output analysis shows the direct and indirect (flow-on) effects of one sector on other sectors and the general economy. As such, Input-Output modelling can be used to demonstrate the economic contribution of a sector on the overall economy and how much the economy relies on this sector or to examine a change in final demand of any one sector and the resultant change in activity of its supporting sectors.
The economic contribution can be traced through the economic system via:
• Initial stimulus (direct) impacts, which represent the economic activity of the industry directly experiencing the stimulus.
• Flow-on impacts, which are disaggregated to:
o Production induced effects (type I flow-on), which comprise the effects from:
▪ Direct expenditure on goods and services by the industry experiencing the stimulus (direct suppliers to the industry), known as the first round or direct requirements effects.5
▪ The second and subsequent round effects of increased purchases by suppliers in response to increased sales, known as the industry support effects.
o Household consumption effects (type II flow-on), which represent the consumption induced activity from additional household expenditure on goods and services resulting from additional wages and salaries being paid within the economic system.
These effects can be identified through the examination of four types of impacts:
• Output: Refers to the gross value of goods and services transacted, including the costs of goods and services used in the development and provision of the final product. Output typically overstates the economic impacts as it counts all goods and services used in one stage of production as an input to later stages of production, hence counting their contribution more than once.
• Gross product: Refers to the value of output after deducting the cost of goods and services inputs in the production process. Gross product (e.g., Gross Regional Product) defines a true net economic contribution and is subsequently the preferred measure for assessing economic impacts.
• Income: Measures the level of wages and salaries paid to employees of the industry under consideration and to other industries benefiting from the project.
• Employment: Refers to the part-time and full-time employment positions generated by the economic shock, both directly and indirectly through flow-on activity, and is expressed in terms of full time equivalent (FTE) positions.
Input-Output multipliers can be derived from open (Type I) Input-Output models or closed (Type II) models. Open models show the direct effects of spending in a particular industry as well as the indirect or flow-on (industrial support) effects of additional activities undertaken by industries increasing their activity in response to the direct spending.
Closed models re-circulate the labour income earned as a result of the initial spending through other industry and commodity groups to estimate consumption induced effects (or impacts from increased household consumption).
5 Modelling note: In assessing construction phase impacts, AEC’s modelling approach treats subcontractors in the construction services sector engaged through first round effects as part of the initial stimulus impact rather than as part of the production induced impact.

RATING EQUITY IN SA & THE FINANCIAL IMPACTS ON LOCAL GOVERNMENT’S ABILITY TO SUPPORT GROWTH
20
MODEL DEVELOPMENT Multipliers used in this assessment are derived from sub-regional transaction tables developed specifically for this project. The process of developing a sub-regional transaction table involves developing regional estimates of gross production and purchasing patterns based on a parent table, in this case, the 2016-17 Australian transaction table (ABS, 2019a).
Estimates of gross production (by industry) in the study areas were developed based on the percent contribution to employment (by place of work) of the study areas to the Australian economy (ABS, 2012; ABS, 2017; ABS, 2019b; DoESSFB, 2019), and applied to Australian gross output identified in the 2016-17 Australian table.
Industry purchasing patterns within the study area were estimated using a process of cross industry location quotients and demand-supply pool production functions as described in West (1993).
Where appropriate, values were rebased from 2016-17 (as used in the Australian national IO transaction tables) to 2018 values using the Consumer Price Index (ABS, 2019c).
MODELLING ASSUMPTIONS The key assumptions and limitations of Input-Output analysis include:
• Lack of supply-side constraints: The most significant limitation of economic impact analysis using Input-Output multipliers is the implicit assumption that the economy has no supply-side constraints so the supply of each good is perfectly elastic. That is, it is assumed that extra output can be produced in one area without taking resources away from other activities, thus overstating economic impacts. The actual impact is likely to be dependent on the extent to which the economy is operating at or near capacity.
• Fixed prices: Constraints on the availability of inputs, such as skilled labour, require prices to act as a rationing device. In assessments using Input-Output multipliers, where factors of production are assumed to be limitless, this rationing response is assumed not to occur. The system is in equilibrium at given prices, and prices are assumed to be unaffected by policy and any crowding out effects are not captured. This is not the case in an economic system subject to external influences.
• Fixed ratios for intermediate inputs and production (linear production function): Economic impact analysis using Input-Output multipliers implicitly assumes that there is a fixed input structure in each industry and fixed ratios for production. That is, the input function is generally assumed linear and homogenous of degree one (which implies constant returns to scale and no substitution between inputs). As such, impact analysis using Input-Output multipliers can be seen to describe average effects, not marginal effects. For example, increased demand for a product is assumed to imply an equal increase in production for that product. In reality, however, it may be more efficient to increase imports or divert some exports to local consumption rather than increasing local production by the full amount. Further, it is assumed each commodity (or group of commodities) is supplied by a single industry or sector of production. This implies there is only one method used to produce each commodity and that each sector has only one primary output.
• No allowance for economies of scope: The total effect of carrying on several types of production is the sum of the separate effects. This rules out external economies and diseconomies and is known simply as the “additivity assumption”. This generally does not reflect real world operations.
• No allowance for purchasers’ marginal responses to change: Economic impact analysis using multipliers assumes that households consume goods and services in exact proportions to their initial budget shares. For example, the household budget share of some goods might increase as household income increases. This equally applies to industrial consumption of intermediate inputs and factors of production.
• Absence of budget constraints: Assessments of economic impacts using multipliers that consider consumption induced effects (type two multipliers) implicitly assume that household and government consumption is not subject to budget constraints.

RATING EQUITY IN SA & THE FINANCIAL IMPACTS ON LOCAL GOVERNMENT’S ABILITY TO SUPPORT GROWTH
21
Despite these limitations, Input-Output techniques provide a solid approach for taking account of the inter-relationships between the various sectors of the economy in the short-term and provide useful insight into the quantum of final demand for goods and services, both directly and indirectly, likely to be generated by a project.
In addition to the general limitations of Input-Output analysis, there are two other factors that need to be considered when assessing the outputs of sub-regional transaction table developed using this approach, namely:
• It is assumed the sub-region has similar technology and demand/ consumption patterns as the parent (Australia) table (e.g. the ratio of employee compensation to employees for each industry is held constant).
• Intra-regional cross-industry purchasing patterns for a given sector vary from the national tables depending on the prominence of the sector in the regional economy compared to its input sectors. Typically, sectors that are more prominent in the region (compared to the national economy) will be assessed as purchasing a higher proportion of imports from input sectors than at the national level, and vice versa.
