rate-splitting multiple access for downlink communication ... · achieved by tdma/single-user...
TRANSCRIPT

arX
iv:1
710.
1101
8v4
[cs
.IT
] 1
7 A
pr 2
018
Rate-Splitting Multiple Access for Downlink
Communication Systems: Bridging, Generalizing
and Outperforming SDMA and NOMAYijie Mao, Bruno Clerckx, and Victor O.K. Li
Abstract—Space-Division Multiple Access (SDMA) utilizeslinear precoding to separate users in the spatial domain andrelies on fully treating any residual multi-user interference asnoise. Non-Orthogonal Multiple Access (NOMA) uses linearlyprecoded superposition coding with successive interferencecancellation (SIC) to superpose users in the power domain andrelies on user grouping and ordering to enforce some users tofully decode and cancel interference created by other users.
In this paper, we argue that to efficiently cope with thehigh throughput, heterogeneity of Quality-of-Service (QoS),and massive connectivity requirements of future multi-antennawireless networks, multiple access design needs to depart fromthose two extreme interference management strategies, namelyfully treat interference as noise (as in SDMA) and fully decodeinterference (as in NOMA).
Considering a multiple-input single-output broadcast chan-nel, we develop a novel multiple access framework, calledRate-Splitting Multiple Access (RSMA). RSMA is a moregeneral and more powerful multiple access for downlink multi-antenna systems that contains SDMA and NOMA as specialcases. RSMA relies on linearly precoded rate-splitting withSIC to decode part of the interference and treat the remainingpart of the interference as noise. This capability of RSMAto partially decode interference and partially treat interferenceas noise enables to softly bridge the two extremes of fullydecoding interference and treating interference as noise, andprovide room for rate and QoS enhancements, and complexityreduction.
The three multiple access schemes are compared and ex-tensive numerical results show that RSMA provides a smoothtransition between SDMA and NOMA and outperforms themboth in a wide range of network loads (underloaded andoverloaded regimes) and user deployments (with a diversityof channel directions, channel strengths and qualities of Chan-nel State Information at the Transmitter). Moreover, RSMAprovides rate and QoS enhancements over NOMA at a lowercomputational complexity for the transmit scheduler and thereceivers (number of SIC layers).
Index Terms—RSMA, NOMA, SDMA, MISO-BC, linearprecoding, rate region, weighted sum rate, rate-splitting
I. INTRODUCTION
With the dramatic upsurge in the number of devices
expected in 5G and beyond, wireless networks will be
operated in a variety of regimes ranging from underloaded
to overloaded (where the number of scheduled devices is
smaller and larger than the number of transmit antennas
at each access point, respectively). Moreover due to the
heterogeneity of devices (high-end such as smartphones and
low-end such as Internet-of-Things and Machine-Type Com-
munications devices), deployments and applications in 5G
This work is partially supported by the U.K. Engineering and PhysicalSciences Research Council (EPSRC) under grant EP/N015312/1.
and beyond, the transmitter will need to serve simultaneously
users with different capabilities, deployments and qualities
of Channel State Information at the Transmitter (CSIT). This
massive connectivity problem together with the demands
for high throughput and heterogeneity of Quality-of-Service
(QoS) has recently spurred interests in re-thinking multiple
access for the downlink of communication systems.
In this paper, we propose a new multiple access called
Rate-Splitting Multiple Access (RSMA). In order to fully
assess the novelty of the proposed multiple access paradigm
and the design philosophy, we first review the state-of-the-
art of two major multiple accesses, namely Non-Orthogonal
Multiple Access (NOMA) [1], also called Multi-User Su-
perposition Transmission (MUST) in 3GPP LTE Rel-13 [2]
and Space-Division Multiple Access (SDMA). We identify
their benefits and limitations and make critical observations,
before motivating the introduction of the novel and more
powerful RSMA.
A. SDMA and NOMA: The Extremes
Contrary to Orthogonal Multiple Access (OMA) that
schedules users or groups of users in orthogonal dimensions,
e.g. time (TDMA), frequency (FDMA), NOMA superposes
users in the same time-frequency resource via the power
domain or the code domain, leading to the power-domain
NOMA (e.g. [1]) and code-domain NOMA (e.g. sparse
code multiple access (SCMA) [3]). Power-domain NOMA1
relies on superposition coding (SC) at the transmitter and
successive interference cancellation (SIC) at the receivers
(denoted in short as SC–SIC) [1], [4]–[6]. Such a strategy
is motivated by the well-known result that SC–SIC achieves
the capacity region of the Single-Input Single-Output (SISO)
(Gaussian) Broadcast Channel (BC) [7], [8]. It is also well
known that the capacity region of the SISO BC is larger than
the rate region achieved by OMA (e.g. TDMA) when users
experience a disparity of channel strengths [8]. On the other
hand, when users exhibit the same channel strengths, OMA
based on TDMA is sufficient to achieve the capacity region
[8].
The benefit of single-antenna NOMA using SC–SIC is
therefore to be able, despite the presence of a single trans-
mit antenna in a SISO BC, to cope with an overloaded
regime in a spectrally efficient manner where multiple users
experience potentially very different channel strengths/path
1In the sequel, power-domain NOMA will be referred to simply byNOMA.
losses (e.g. cell centre users and cell edge users) on the same
time/frequency resource.
The limitation of single-antenna NOMA lies in its com-
plexity as the number of users grows. Indeed for a K-user
SISO BC, the strongest user needs to decode using SIC
the K − 1 messages of all co-scheduled users and therefore
peel off K − 1 layers before accessing its intended stream.
Though SIC of a small number of layers should be feasible in
practice2, the complexity and likelihood of error propagation
becomes quickly significant for a large number of users.
This calls for ways to decrease the number of SIC layers at
each user. One could divide users into small groups of users
with disparate channels and apply SC–SIC in each group and
schedule groups on orthogonal resources (using OMA), but
that may lead to some performance loss and latency increase.
In nowadays wireless networks, access points are often
equipped with more than one antenna. This spatial dimension
opens the door to another well-known type of multiple
access, namely SDMA. SDMA superposes users in the same
time-frequency resource and separates user via a proper
use of the spatial dimensions. Contrary to the SISO BC,
the multi-antenna BC is non-degraded, i.e. users cannot be
ordered based on their channel strengths in general settings.
This is the reason why SC–SIC is not capacity achieving
and the complex Dirty Paper Coding (DPC) is the only strat-
egy that achieves the capacity region of the Multiple-Input
Single-Output (MISO) (Gaussian) BC with perfect CSIT
[10]. DPC, rather than performing interference cancellation
at the receivers as in SC–SIC, can be viewed as a form of
enhanced interference cancellation at the transmitter and re-
lies on perfect CSIT to do so. Due to the high computational
burden of DPC, linear precoding is often considered the most
attractive alternative to simplify the transmitter design [11].
Interestingly, in a MISO BC, Multi-User Linear Precoding
(MU–LP), e.g. either in closed form or optimized using op-
timization methods, though suboptimal, is often very useful
when users experience relatively similar channel strengths
or long term Signal-to-Noise Ratio (SNR) and have semi-
orthogonal to orthogonal channels [12]. SDMA is therefore
commonly implemented using MU–LP. The linear precoders
create different beams with each beam being allocated a
fraction of the total transmit power. Hence, similarly to
NOMA, SDMA can also be viewed as a superposition of
users in the power-domain, though users are separated at
the transmitter side by spatial beamformers rather than by
the use of SIC at the receivers.
SDMA based on MU–LP is a well-established multiple
access that is nowadays the basic principle behind numerous
techniques in 4G and 5G such as Multi-user Multiple-
Input Multiple-Output (MU–MIMO), Coordinated Multi-
Point (CoMP) coordinated beamforming, network MIMO,
millimeter-wave MIMO and Massive MIMO.
The benefit of SDMA using MU–LP is therefore to reap
all spatial multiplexing benefits of a MISO BC with perfect
CSIT with a low precoder and receiver complexity.
The limitations of SDMA are threefold.
2Recall that SU–MIMO in LTE Rel. 8 was designed with Minimum MeanSquare Error–SIC (MMSE–SIC) in mind [9].
First, it is suited to the underloaded regime and per-
formance of MU–LP in the overloaded regime quickly
drops as it requires more transmit antennas than users to
be able to efficiently manage the multi-user interference.
When the MISO BC becomes overloaded, the current and
popular approach for the transmitter is to schedule group of
users over orthogonal dimensions (e.g. time/frequency) and
perform linear precoding in each group, which may increase
latency and decrease QoS depending on the application.
Second, its performance is sensitive to the user channel
orthogonality and strengths and requires the scheduler to
pair semi-orthogonal users with similar channel strengths
together. The complexity of the scheduler can quickly in-
crease when an exhaustive search is performed, though
low complexity (suboptimal) scheduling and user pairing
algorithms exist [11].
Third, it is optimal from a Degrees-of-Freedom3 (DoF),
also known as spatial multiplexing gain, perspective in the
perfect CSIT setting but not in the presence of imperfect
CSIT [13]. The problem of SDMA design in the presence
of imperfect CSIT has been to strive to apply a framework
motivated by perfect CSIT to scenarios with imperfect CSIT,
not to design a framework motivated by imperfect CSIT
from the beginning [13]. This leads to the well-known severe
performance loss of MU–LP in the presence of imperfect
CSIT [14].
In view of SC–SIC benefits in a SISO BC, attempts have
been made to study multi-antenna NOMA. Two lines of
research have emerged that both rely on linearly precoded
SC–SIC.
The first strategy, which we simply denote as ’SC–SIC’,
is a direct application of SC–SIC to the MISO BC by
degrading the multi-antenna broadcast channel. It consists
in ordering users based on their effective scalar channel
(after precoding) strengths and enforce receivers to decode
messages (and cancel interference) in a successive manner.
This is advocated and exemplified for instance in [15]–
[18]. This NOMA strategy converts the multi-antenna non-
degraded channel into an effective single antenna degraded
channel, as at least one receiver ends up decoding all mes-
sages. While such a strategy can cope with the deployment
of users experiencing aligned channels and different path
loss conditions, it comes at the expense of sacrificing and
annihilating all spatial multiplexing gains in general settings.
By forcing one receiver to decode all streams, the sum
DoF is reduced to unity4. This is the same DoF as that
achieved by TDMA/single-user beamforming (or OMA).
This is significantly smaller than the sum DoF achieved by
DPC and MU–LP in a MISO BC with perfect CSIT, which
is the minimum of the number of transmit antennas and the
number of users5. Moreover, this loss in multiplexing gain
3The DoF characterizes the number of interference-free streams that canbe transmitted or equivalently the pre-log factor of the rate at high SNR.
4This can be easily seen since, for the receiver forced to decode allstreams, the model reduces to a Multiple Access Channel (MAC) with asingle-antenna receiver, which has a sum-DoF of 1. This was discussed inlength in [19].
5Recall that this spatial multiplexing gain is the main driver for usingmultiple antennas in a multi-user setup and the introduction of MU–MIMOin 4G [20].

comes with a significant increase in receiver complexity due
to the multi-layer SIC compared to the treat interference
as noise strategy of MU–LP. As a remedy to recover the
DoF loss, we could envision a dynamic switching between
NOMA and SDMA, reminiscent of the dynamic switching
between SU–MIMO and MU–MIMO in 4G [20]. One would
dynamically choose the best option between NOMA and
SDMA as a function of the channel states. A particular
instance of this approach is taken in [21] where a dynamic
switching between SC–SIC and Zero-Forcing Beamforming
(ZFBF) was investigated.
The second strategy, which we denote as ’SC–SIC per
group’, consists in grouping K users into G groups. Users
within each group are served using SC–SIC and users across
groups are served using SDMA so as to mitigate the inter-
group interference. Examples of such a strategy can be found
in [1], [22]–[26]. This strategy can therefore be seen as a
combination of SDMA and NOMA where the multi-antenna
system is effectively decomposed into G hopefully non-
interfering single-antenna NOMA channels. For this ’SC–
SIC per group’ approach to perform at its best, users within
each group need to have their channels aligned and users
across groups need to be orthogonal.
Similarly to SDMA, multi-antenna NOMA designs also
rely on accurate CSIT. In the practical scenario of imperfect
CSIT, NOMA design relies on the same above two strate-
gies but optimizes the precoder so as to cope with CSIT
imperfection and resulting extra multi-user interference. As
an example, the MISO BC channel is again degraded in [18]
and precoder optimization with imperfect CSIT is studied.
The benefit of multi-antenna NOMA, similarly to the
single-antenna NOMA, is the potential to cope with an
overloaded regime where multiple users experience different
channel strengths/path losses and/or are closely aligned with
each other.
The limitations of multi-antenna NOMA are fourfold.
First, the use of SC–SIC in NOMA is fundamentally
motivated by a degraded BC in which users can be ordered
based on their channel strengths. This is the key property of
the SISO BC that enables SC–SIC to achieve its capacity
region. Unfortunately, motivated by the promising gains of
SC–SIC in a SISO BC, the multi-antenna NOMA literature
strives to apply SC–SIC to a non-degraded MISO BC. This
forces to degrade a non-degraded BC and therefore leads
to an inefficient use of the spatial dimensions in general
settings, leading to a DoF loss.
Second, NOMA is not suited for general user deployments
since degrading a MISO BC is efficient when users are
sufficiently aligned with each other and exhibit a disparity
of channel strengths, not in general settings.
Third, multi-antenna NOMA comes with an increase in
complexity at both the transmitter and the receivers. Indeed,
a multi-layer SIC is needed at the receivers, similarly to
the single-antenna NOMA. However, in addition, since there
exists no natural order for the users channels in multi-
antenna NOMA (because we deal with vectors rather than
scalars), the precoders, the groups and the decoding or-
ders have to be jointly optimized by the scheduler at the
transmitter. Taking as an example the application of NOMA
based on ’SC–SIC’ to a three-user MISO BC, we need to
optimize three precoders, one for each user, along with the
six possible decoding orders. Increasing the number of users
leads to an exponential increase in the number of possible
decoding orders. ’SC–SIC per group’ divides users into
multiple groups but that approach leads to a joint design of
user ordering and user grouping. To decrease the complexity
in user ordering and user grouping, multi-antenna NOMA
(’SC–SIC’ and ’SC–SIC per group’) forces users belonging
to the same group to share the same precoder (beamforming
vector) [1]. Unfortunately, such a restriction can only further
hurt the overall performance since it shrinks the overall
optimization space.
Fourth, multi-antenna NOMA is subject to the same
drawback as SDMA in the presence of imperfect CSIT,
namely its design is not motivated by any fundamental limits
of a MISO BC with imperfect CSIT.
The key is to recognize that the limitations and drawbacks
of SDMA and NOMA originate from the fact that those
two multiple accesses fundamentally rely on two extreme
interference management strategies, namely fully treat inter-
ference as noise and fully decode interference. Indeed, while
NOMA relies on some users to fully decode and cancel
interference created by other users, SDMA relies on fully
treating any residual multi-user interference as noise. In the
presence of imperfect CSIT, CSIT inaccuracy results in an
additional multi-user interference that is treated as noise by
both NOMA (SC–SIC per group) and SDMA.
B. RSMA: Bridging the Extremes
In contrast, with RSMA, we take a different route and
depart from the SDMA and NOMA literature and those two
extremes of fully decode interference and treat interference
as noise. We introduce a more general and powerful multiple
access framework based on linearly precoded Rate-Splitting
(RS) at the transmitter and SIC at the receivers. This enables
to decode part of the interference and treat the remaining part
of the interference as noise [13]. This capability of RSMA to
partially decode interference and partially treat interference
as noise enables to softly bridge the two extreme strategies
of fully treating interference as noise and fully decoding
interference. This contrasts sharply with SDMA and NOMA
that exclusively rely on the two extremes or a combination
thereof.
In order to partially decode interference and partially treat
interference as noise, RS splits messages into common6 and
private messages and relies on a superimposed transmission
of common messages decoded by multiple users, and private
messages decoded by their corresponding users (and treated
as noise by co-scheduled users). Users rely on SIC to first
decode the common messages before accessing the private
messages. By adjusting the message split and the power
allocation to the common and private messages, RS has
the ability to softly bridge the two extreme of fully treat
interference as noise and fully decode interference.
The idea of RS dates back to Carleial’s work and the
Han and Kobayashi (HK) scheme for the two-user single-
6’Common’ is sometimes referred to as ’public’.

antenna Interference Channel (IC) [27]. However, the use of
RS as the building block of RSMA is motivated by recent
works that have shown the benefit of RS in multi-antenna BC
and the recent progress on characterizing the fundamental
limits of a multi-antenna BC (and IC) with imperfect CSIT.
Hence, importantly, in contrast with the conventional RS
(HK scheme) used for the two-user SISO IC, we here use RS
in a different setup, namely 1) in a BC and 2) with multiple
antennas. The use and benefits of RS in a multi-antenna BC
only appeared in the last few years7.
The capacity region of the K-user MISO BC with imper-
fect CSIT remains an open problem. As an alternative, recent
progress has been made to characterize the DoF region of
the underloaded and overloaded MISO BC with imperfect
CSIT. In [28], a novel information theoretic upperbound on
the sum DoF of the K-user underloaded MISO BC with
imperfect CSIT was derived. Interestingly, this sum-DoF
coincides with the sum-DoF achieved by a linearly precoded
RS strategy at the transmitter with SIC at the receivers [29],
[30]. RS (with SIC) is therefore optimum to achieve the sum
DoF of the K-user underloaded MISO BC with imperfect
CSIT, in contrast with MU–LP that is clearly suboptimum
(and so is SC–SIC since it achieves a sum DoF of unity8)
[30]. It turns out that RS with a flexible power allocation is
not only optimum for the sum DoF but for the entire DoF
region of an underloaded MISO BC with imperfect CSIT
[31]. The DoF benefit of RS in imperfect CSIT settings were
also shown in more complicated underloaded networks with
multiple transmitters in [32] and multi-antenna receivers
[33]. Considering user fairness, the optimum symmetric
DoF (or max-min DoF), i.e. the DoF that can be achieved
by all users simultaneously, of the underloaded MISO BC
with imperfect CSIT with MU–LP and RS was studied in
[34]. RS symmetric DoF was shown to outperform that
of MU–LP. Finally, moving to the overloaded MISO BC
with heterogeneous CSIT qualities, a multi-layer power
partitioning strategy that superimposes degraded symbols on
top of linearly precoded rate-splitted symbols was shown in
[35] to achieve the optimal DoF region.
The benefits of RS have also appeared in multi-antenna
settings with perfect CSIT. In an overloaded multigroup mul-
ticast setting with perfect CSIT, considering again fairness,
the symmetric DoF achieved by RS, MU–LP and degraded
NOMA transmissions (where receivers decode messages and
cancel interference in a successive manner as in ’SC–SIC’)
was studied in [19]. It was shown that RS here again
outperforms both MU–LP and SC–SIC.
The DoF metric is insightful to identify the multiplexing
gains of the MISO BC at high SNR but fails to capture the
diversity of channel strengths among users. This limitation
is countered by the Generalized DoF (GDoF) framework,
which inherits the tractability of the DoF framework while
capturing the diversity in channel strengths [36]. In [37],
[38], the GDoF of an underloaded MISO BC with imperfect
7This also contrasts with NOMA, for which the usefulness of SC–SICin a BC is known for several decades [7], [8].
8Note that in the specific case where we have finite precision CSIT, thesum DoF collapses to 1 [28] and RS, SC–SIC, TDMA all achieve the sameoptimal DoF.
CSIT is studied and here again RS is used as part of the
achievability scheme.
The DoF (GDoF) superiority of RS over MU–LP and SC–
SIC in all those multi-antenna settings (with perfect and
imperfect CSIT) comes from the ability of RS to better
handle the multi-user interference by evolving in a regime in
between the extremes of fully treating it as noise and fully
decoding it.
Importantly, the rate enhancements of RS over MU–LP, as
predicted by the DoF analysis, are reflected in the finite SNR
regime as shown in a number of recent works. In [39], finite
SNR rate analysis of RS in MISO BC in the presence of
quantized feedback was analyzed and it was shown that RS
benefits from a CSI feedback overhead reduction compared
to MU–LP. Using optimization methods, the precoder design
of RS at finite SNR was investigated in [30] for the sum-rate
and rate region maximization with imperfect CSIT, in [34]
for max-min fair transmission with imperfect CSIT, and in
[19] for multigroup multicast with perfect CSIT. Moreover,
the benefit of RS over MU–LP in the finite SNR regime
was shown in Massive MIMO [40], millimetre-wave systems
[41] and multi-antenna deployments subject to hardware
impairments [42]. Finally, the performance benefits of the
power-partitioning strategy relying on RS in the overloaded
MISO BC with heterogeneous CSIT was confirmed using
simulations at finite SNR in the presence of a diversity of
channel strengths [35]. In particular, in contrast to the RS
used in [13], [19], [30], [31], [34], [35], [39], [41], [42]
that relies on a single common message, [40] (as well as
[32]) showed the benefits in the finite SNR regime of a
multi-layer (hierarchical) RS relying on multiple common
messages decoded by various groups of users.
In this paper, in view of the limitations of SDMA and
NOMA and the above literature on RS in multi-antenna BC,
we design a novel multiple access, called Rate-Splitting Mul-
tiple Access (RSMA) for downlink communication system9.
RSMA is a much more attractive solution (performance
and complexity-wise) that retains the benefits of SDMA
and NOMA but tackle all the aforementioned limitations of
SDMA and NOMA. Considering a MISO BC, we make the
following contributions.
First, we show that RSMA is a more general
class/framework of multi-user transmission that encompasses
SDMA and NOMA as special cases. RSMA is shown
to reduce to SDMA if channels are of similar strengths
and sufficiently orthogonal with each other and to NOMA
if channels exhibit sufficiently diverse strengths and are
sufficiently aligned with each other. This is the first paper to
explicitly recognize that SDMA and NOMA are both subsets
of a more general transmission framework based on RS10.
Second, we provide a general framework of multi-layer
RS design that encompasses existing RS schemes as special
9It is worth noting that Rate-Splitting Multiple Access (RSMA) alsoexists in the uplink for the SISO Multiple Access Channel [43]. Thoughthey share the same name and the splitting of the messages, they havedifferent motivations and structures.
10As already explained in [13], RS can also be seen as a form ofnon-orthogonal multi-user transmission. Indeed, in its simplest form, thecommon message in RS can be seen as a non-orthogonal layer added ontothe private layers.
cases. In particular, the single-layer RS of [19], [30], [31],
[34], [35], [39], [41], [42] and the multi-layer (hierarchical
and topological) RS of [32], [40] are special instances of the
generalized RS strategy developed here. Moreover the use of
RS was primarily motivated by multi-antenna deployments
subject to multi-user interference due to imperfect CSIT
in those works. The benefit of RS in the presence of
perfect CSIT and/or a diversity of channel strengths in a
multi-antenna setup, as considered in this paper, is less
investigated. RS was shown in [19] to boost the performance
of overloaded multigroup multicast. However, no attempt has
been made so far to identify the benefit of RS in multi-
antenna BC with perfect CSIT and/or a diversity of channel
strengths.
Third, we show that the rate performance (rate region,
weighted sum-rate with and without QoS constraints) of
RSMA is always equal to or larger than that of SDMA and
NOMA. Considering a MISO BC with perfect CSIT and no
QoS constraints, RSMA performance comes closer to the
optimal DPC region than SDMA and NOMA. In scenarios
with QoS constraints or imperfect CSIT, RSMA always
outperforms SDMA and NOMA. Since it is motivated by
fundamental DoF analysis, RSMA is also optimal from a
DoF perspective in both perfect and imperfect CSIT and
therefore optimally exploit the spatial dimensions and the
availability of CSIT, in contrast with SDMA and NOMA
that are suboptimal.
Fourth, we show that RSMA is much more robust than
SDMA and NOMA to user deployments, CSIT inaccuracy
and network load. It can operate in a wide range of practical
deployments involving scenarios where the user channels are
neither orthogonal nor aligned, and exhibit similar strengths
or a diversity of strengths; where the CSI is perfectly or
imperfectly known to the transmitter; where the network
load can vary between the underloaded and the overloaded
regimes. In particular, in the overloaded regime, the RSMA
framework is shown to be particularly suited to cope with
a variety of device capabilities, e.g. high-end devices along
with cheap Internet-of-Things (IoT)/Machine-Type Commu-
nications (MTC) devices. Indeed, the RS framework can be
used to pack the IoT/MTC traffic in the common message,
while still delivering high quality service to high-end de-
vices.
Fifth, we show that the performance gain can come with
a lower computational complexity than NOMA for both the
transmit scheduler and the receivers. In contrast to NOMA
that requires complicated user grouping and ordering and
potential dynamic switching (between SDMA, ’SC–SIC’ and
’SC–SIC per group’) at the transmit scheduler and multiple
layers of SIC at the receivers, a simple one-layer RS that
does not require any user ordering, grouping or dynamic
switching at the transmit scheduler and a single layer of
SIC at the receivers still significantly outperforms NOMA.
In contrast to SDMA, RSMA is less sensitive to user pairing
and therefore does not require complex user scheduling and
pairing11. However, RSMA comes with a slightly higher
encoding complexity than SDMA and NOMA due to the
11This benefit of RS was briefly pointed out in [40].
encoding of the common streams on top of the private
streams.
Sixth, though SC–SIC is optimal to achieve the capacity
region of SISO BC, we show that a single-layer RS is a
low-complexity alternative that only requires a single layer
of SIC at each receiver and achieves close to SC–SIC (with
multi-layer SIC) performance in a SISO BC deployment.
As a takeaway message, we note that the ability of a
wireless network architecture to partially decode interference
and partially treat interference as noise can lead to enhanced
throughput and QoS, increased robustness and lower com-
plexity compared to alternatives that are forced to operate in
the extreme regimes of fully treating interference as noise
and fully decoding interference.
It is also worth making the analogy with other types of
channels where the ability to bridge the extremes of treating
interference as noise and fully decoding interference has
appeared. Considering a two-user SISO IC, interference is
fully decoded in the strong interference regime and is treated
as noise in the weak interference regime. Between those
two extremes, interference is neither strong enough to be
fully decoded nor weak enough to be treated as noise. The
best known strategy for the two-user SISO IC is obtained
using RS (so-called HK scheme). RS in this context is
well known to be superior to strategies relying on fully
treating interference as noise, fully decoding interference
or orthogonalization (TDMA, FDMA) [27], [36]. Limiting
ourselves to those extremes strategies is suboptimal [27],
[36].
The rest of the paper is organized as follows. The system
model is described in Section II. The existing multiple
accesses are specified in Section III. In Section IV, the
proposed RSMA and its low-complexity structures are de-
scribed and compared with existing multiple accesses. The
corresponding Weighted Sum Rate (WSR) problems are
formulated and the WMMSE approach to solve the problem
is discussed. Numerical results are illustrated in Section V,
followed by conclusions and future works in Section VI.
Notations: The boldface uppercase and lowercase letters
are used to represent matrices and vectors. The superscripts
(·)T and (·)H respectively denote transpose and conjugate-
transpose operators. tr(·) and diag(·) are the trace and
diagonal entries respectively. |·| is the absolute value and
‖·‖ is the Euclidean norm. E{·} refers to the statistical
expectation. C denotes the complex space. I and 0 stand for
an identity matrix and an all-zero vector, respectively, with
appropriate dimensions. CN (δ, σ2) represents a complex
Gaussian distribution with mean δ and variance σ2. |A| is
the cardinality of the set A.
II. SYSTEM MODEL
Consider a system where a Base Station (BS) equipped
with Nt antennas serves K single-antenna users. The users
are indexed by the set K = {1, . . . ,K}. Let x ∈ CNt×1
denote the signal vector transmitted in a given channel use.
It is subject to the power constraint E{‖x‖2} ≤ Pt. The
signal received at user-k is
yk = hHk x+ nk, ∀k ∈ K (1)

where hk ∈ CNt×1 is the channel between the BS and
user-k. nk ∼ CN (0, σ2n,k) is the Additive White Gaussian
Noise (AWGN) at the receiver. Without loss of generality,
we assume the noise variances are equal to one for all users.
The transmit SNR is equal to the total power consumption
Pt. We assume CSI of users is perfectly known at the BS
in the following model. The imperfect CSIT scenario will
be discussed in the proposed algorithm and the numerical
results. Channel State Information at the Receivers (CSIR)
is assumed to be perfect.
In this work, we are interested in beamforming designs
for signal x at the BS. Specifically, the objective of beam-
forming designs is to maximize the WSR of users subject
to a power constraint of the BS and QoS constraints of
each user. We firstly state and compare two baseline multi-
antenna multiple accesses, namely SDMA and NOMA. Then
RSMA is explained. The WSR problem of each strategy
will be formulated and the algorithm adopted to solve
the corresponding problem will be stated in the following
sections.
III. SDMA AND NOMA
In this section, we describe two baseline multiple accesses.
The messages W1, . . . ,WK intended for users 1 to Krespectively are encoded into K independent data streams
s = [s1, . . . , sK ]T independently. Symbols are mapped to
the transmit antennas through a precoding matrix denoted
by P = [p1, . . . ,pK ], where pk ∈ CNt×1 is the precoder
for user-k. The superposed signal is x = Ps =∑
k∈K pksk.Assuming that E{ssH} = I, the transmit power is con-
strained by tr(PPH) ≤ Pt.
A. SDMA
SDMA based on MU–LP is a well-established multiple
access. Each user only decodes its desired message by
treating interference as noise. The Signal-to-Interference-
plus-Noise Ratio (SINR) at user-k is given by
γk =|hH
k pk|2∑j 6=k,j∈K |h
Hk pj |2 + 1
. (2)
For a given weight vector u = [u1, . . . , uK ], the WSR
achieved by MU–LP is
RMU−LP(u) = maxP
∑
k∈K
ukRk
s.t. tr(PPH) ≤ Pt
Rk ≥ Rthk , ∀k ∈ K
(3)
where Rk = log2(1+γk) is the achievable rate of user-k. uk
is a nonnegative constant which allows resource allocation
to prioritize different users. Rthk accounts for any potential
individual rate constraint for user k. It ensures the QoS
of each user. The Weighted MMSE (WMMSE) algorithm
proposed in [44] is adopted to solve problem (3). The
main idea of the WMMSE algorithm is to reformulate the
WSR problem into its equivalent WMMSE problem and
solve it using the Alternating Optimization (AO) approach.
The rate region of the MU–LP strategy is approximated
by RMU−LP(u) for different rate weight vectors u. The
resulting rate region RMU−LP is the convex hull enclosing
the resulting points. In general, solution to problem (3)
would provide the optimal MU–LP beamforming strategy for
any channel deployment (in between aligned and orthogonal
channels and with similar or diverse channel strengths).
B. NOMA
NOMA relies on superposition coding at the transmitter
and successive interference cancellation at the receiver. As
discussed in the introduction, the two main strategies in
multi-antenna NOMA are the ’SC–SIC’ and ’SC–SIC per
group’. SC–SIC can be treated as a special case of SC–SIC
per group where there is only one group of users.
1) SC–SIC: In SC–SIC, the precoders and decoding or-
ders have to be optimized jointly. The decoding order is
vital to the rate obtained at each user. To maximize the
WSR, all possible decoding orders of users are required
to be considered. Denote π as one of the decoding orders,
the message of user-π(k) is decoded before the message of
user-π(j), ∀k ≤ j. The messages of user-π(k), ∀k ≤ i are
decoded at user-π(i) using SIC. The SINR experienced at
user-π(i) to decode the message of user-π(k), k ≤ i is given
by
γπ(i)→π(k) =|hH
π(i)pπ(k)|2
∑j>k,j∈K |h
Hπ(i)pπ(j)|2 + 1
. (4)
For a given weight vector u = [u1, . . . , uK ] and a fixed
decoding order π, the WSR achieved by SC–SIC is
RSC−SIC(u, π) = maxP
∑
k∈K
uπ(k)Rπ(k)
s.t. tr(PPH) ≤ Pt
Rk ≥ Rthk , ∀k ∈ K
(5)
where Rπ(k) = mini≥k,i∈K{log2(1 + γπ(i)→π(k))}. In [15],
the problem (5) with equal weights is solved by the ap-
proximation technique minorization-maximization algorithm
(MMA). To keep a single and unified approach to solve the
WSR problem of different beamforming strategies, we still
use the WMMSE algorithm to solve it. By approximating
the rate region with a set of rate weights, the rate region
RSC−SIC(π) with a certain decoding order π is attained.
To achieve the rate region of SC–SIC, all decoding orders
should be considered. The largest achievable rate region of
SC–SIC is defined as the convex hull of the union over all
decoding orders as RSC−SIC = conv(∪πRSC−SIC(π)).2) SC–SIC per group: Assuming the K users are divided
into G groups, denoted as G = {1, . . . , G}. In each group,
there is a subset of users Kg, g ∈ G. The user groups satisfy
the following conditions: Kg ∩ Kg′ = ∅, if g 6= g′, and∑g∈G |Gg| = K . Denote πg as one of the decoding orders
of the users in Kg , the message of user-πg(k) is decoded
before the message of user-πg(j), ∀k ≤ j. The messages
of user-πg(k), ∀k ≤ i are decoded at user-πg(i) using SIC.
The SINR experienced at user-πg(i) to decode the message
of user-πg(k), k ≤ i is given by
γπg(i)→πg(k) =|hH
πg(i)pπg(k)|
2
∑j>k,j∈Kg
|hHπg(i)
pπg(j)|2 + Iπg(i) + 1
,
(6)

where Iπg(i) =∑
g′∈G,g′ 6=g
∑j∈Kg′
|hHπg(i)
pj |2 is the inter-
group interference suffered at user-πg(i). For a given weight
vector u = [u1, . . . , uK ], a fixed grouping method G and a
fixed decoding order π = {π1, . . . , πG}, the WSR achieved
by SC–SIC per group is
RgroupSC−SIC(u,G, π) = max
P
∑
g∈G
∑
k∈Kg
uπg(k)Rπg(k)
s.t. tr(PPH) ≤ Pt
Rk ≥ Rthk , ∀k ∈ K
(7)
where Rπg(k) = mini≥k,i∈Kg{log2(1+γπg(i)→πg(k))}. Sim-
ilarly to the SC–SIC strategy, the problem can be solved by
using the WMMSE algorithm. To maximize the WSR, all
possible grouping methods and decoding orders should be
considered.
Remark 1: As described in the introduction, it is common
in the multi-antenna NOMA literature (’SC–SIC’ and ’SC–
SIC per group’) to force users belonging to the same group
to share the same precoder, so as to decrease the complexity
in user ordering and user grouping. Note that, in the system
model described for both SC–SIC and SC–SIC per group, we
consider the most general framework where each message
is precoded by its own precoder. Hence, we here do not
constrain symbols to be superimposed on the same precoder
as this would further reduce the performance of NOMA
strategies and therefore leading to even lower performance.
Hence the performance obtained with NOMA in this work
can be seen as the best possible performance achieved by
NOMA.
IV. RATE-SPLITTING MULTIPLE ACCESS
In this section, we firstly introduce the idea of RS by
introducing a two-user example (K = 2) and a three-user
example (K = 3). Then we propose the generalized frame-
work of RS and specify two low-complexity RS strategies.
We further compare RSMA with SDMA and NOMA from
the fundamental structure and complexity aspects. Finally,
we discuss the general optimization framework to solve the
WSR problem.
A. Two-user example
We first consider a two-user example. There are two
messages W1 and W2 intended for user-1 and user-2,
respectively. The message of each user is split into two
parts, {W 121 ,W 1
1 } for user-1 and {W 122 ,W 2
2 } for user-2. The
messages W 121 ,W 12
2 are encoded together into a common
stream s12 using a codebook shared by both users. Hence,
s12 is a common stream required to be decoded by both
users. The messages W 11 and W 2
2 are encoded into the
private stream s1 for user-1 and s2 for user-2, respectively.
The overall data streams to be transmitted based on RS is
s = [s12, s1, s2]T . The data streams are linearly precoded
via precoder P = [p12,p1,p2] , where p12 ∈ CNt×1 is the
precoder for the common stream s12. The resulting transmit
signal is x = Ps = p12s12 + p1s1 + p2s2. We assume that
tr(ssH) = I and the total transmit power is constrained by
tr(PPH) ≤ Pt.
Fig. 1: Two-user transmission model using RS.
At user sides, both user-1 and user-2 firstly decode the
data stream s12 by treating the interference from s1 and s2as noise. Therefore, each user decodes part of the message
of the other interfering user encoded in s12. The interference
is partially decoded at each user. The SINR of the common
stream at user-k is
γ12k =
∣∣hHk p12
∣∣2∣∣hH
k p1
∣∣2 +∣∣hH
k p2
∣∣2 + 1. (8)
Once s12 is successfully decoded, its contribution to the
original received signal yk is subtracted. After that, user-kdecodes its private stream sk by treating the private stream
of user-j (j 6= k) as noise. The two-user transmission model
using RS is shown in Fig. 1. The SINR of decoding the
private stream sk at user-k is
γk =
∣∣hHk pk
∣∣2∣∣hH
k pj
∣∣2 + 1. (9)
The corresponding achievable rates of user-k for the
streams s12 and sk are R12k = log2
(1 + γ12
k
)and Rk =
log2 (1 + γk). To ensure that s12 is successfully decoded
by both users, the achievable common rate shall not exceed
R12 = min{R12
1 , R122
}. All boundary points for the two-
user RS rate region can be obtained by assuming that R12 is
shared between users such that C12k is the kth user’s portion
of the common rate with C121 + C12
2 = R12. Following the
two-user RS structure described above, the total achievable
rate of user-k is Rk,tot = C12k + Rk. For a given pair of
weights u = [u1, u2], the WSR achieved by the two-user
RS approach is
RRS2(u) = max
P,cu1R1,tot + u2R2,tot (10a)
s.t. C121 + C12
2 ≤ R12 (10b)
tr(PPH) ≤ Pt (10c)
Rk,tot ≥ Rthk , k ∈ {1, 2} (10d)
c ≥ 0 (10e)
where c = [C121 , C12
2 ] is the common rate vector required to
be optimized in order to maximize the WSR. For a fixed pair
of weights, problem (10) can be solved using the WMMSE
approach in [30], except we have perfect CSIT here. By
calculating RRS2(u) for a set of different rate weights u,
we obtain the rate region.
In contrast to MU–LP and SC–SIC, the RS scheme de-
scribed above offers a more flexible formulation. In particu-
lar, instead of hard switching between MU–LP and SC–SIC,
it allows both to operate simultaneously if necessary, and
hence smoothly bridges the two. In the extreme of treating

multi-user interference as noise, RS boils down to MU–LP12
by simply allocating no power to the common stream s12. In
the other extreme of fully decoding interference, RS boils
down to SC–SIC by forcing one user, say user-1, to fully
decode the message of the other user, say user-2. This is
achieved by allocating no power to s2, encoding W1 into s1and encoding W2 into s12, such that x = p12s12 + p1s1.
User-1 and user-2 decode s12 by treating s1 as noise and
user-1 decodes s1 after canceling s12. A physical-layer
multicasting strategy is obtained by encoding both W1 and
W2 into s12 and allocating no power to s1 and s2.
Remark 2: It should be noted that while the RS transmit
signal model resembles a broadcasting system with unicast
(private) streams and a multicast stream, the role of the
common message is fundamentally different. The common
message in a unicast-multicast system carries public infor-
mation intended as a whole to all users in the system,
while the common message s12 in RS encapsulates parts
of private messages, and is not entirely required by all
users, although decoded by the two users for interference
mitigation purposes [13].
Remark 3: A general framework is adopted where po-
tentially each user can split its message into common and
private parts. Note however that depending on the objective
function, it is sometimes not needed for all users to split their
messages. For instance for sum-rate maximization subject
to no individual rate constraint, it is sufficient to have only
one user to split its message [30]. However, when it comes
to satisfying some fairness (WSR, QoS constraint, max-min
fairness), splitting the message of multiple users appears
necessary [19], [30], [34].
B. Three-user example
We further consider a three-user example. Different from
the two-user case, the message of user-1 is split into
{W 1231 , W 12
1 , W 131 , W 1
1 }. Similarly, the message of user-
2 and user-3 are split into {W 1232 ,W 12
2 ,W 232 ,W 2
2 } and
{W 1233 ,W 13
3 ,W 233 ,W 3
3 }, respectively. The superscript rep-
resents a specific group of users whose messages with the
same superscript are going to be encoded together. For
example, W 1231 ,W 123
2 ,W 1233 are encoded into the common
stream s123 intended for all the three users. W 121 and W 13
1
are correspondingly encoded with the split messages of user-
2 W 122 and user-3 W 13
3 into data streams s12 and s13. s12is the partial common stream intended for user-1 and user-
2. Hence, user-1 and user-2 will decode s12 while user-3
will decode its intended streams by treating s12 as noise.
Similarly, we obtain s23 partially encoded for user-2 and
user-3. W 11 ,W
22 ,W
33 are respectively encoded into private
streams s1, s2 and s3.
The vector of data streams to be transmitted is s =[s123, s12, s13, s23, s1, s2, s3]
T . After linear precoding using
precoder P = [p123,p12,p13,p23,p1,p2,p3], the signals
are superposed and broadcast. The decoding procedure when
K = 3 is more complex comparing with that in the two-
user example. The main difference lies in decoding partial
common streams for two-users. Define the streams to be
12Note that OMA (single-user beamforming) is a subset of MU–LP andis obtained by allocating power exclusively to s1 or s2.
decoded by l users as l-order streams. The 2-order streams
to be decoded at user-1 are s12, s13. The 2-order streams to
be decoded at user-2 and user-3 are s12, s23 and s13, s23,
respectively. As the 1-order and 2-order streams to be
decoded at different users are not the same, we take user-1 as
an example. The decoding procedure is the same for other
users. User-1 decodes four streams s123, s12, s13, s1 based
on SIC while treating other streams as noise. The decoding
procedure starts from the 3-order stream (common stream)
and progresses downwards to the 1-order stream (private
stream). Specifically, user-1 first decodes s123 and subtracts
its contribution from the received signal. The SINR of the
stream s123 at user-1 is
γ1231 =
∣
∣hH1 p123
∣
∣
2
∑
i∈{12,13,23} |hH1 pi|
2+
∑3k=1 |h
H1 pk|
2+ 1
. (11)
After that, user-1 decodes two streams s12, s13 and treats
interference of s23 as noise. Both decoding orders of de-
coding s12 followed by s13 and s13 followed by s12 should
be considered in order to maximize the WSR. Denote πl as
one of the decoding order to decode l-order streams. There
is only one 1-order stream and one 3-order stream to be
decoded at each user. Therefore, only one decoding order
exists for both π1 and π3. In contrast, each user is required
to decode two 2-order streams. Denote sπ2,k(i) as the ithdata stream to be decoded at user-k based on the decoding
order π2. One instance of π2 is 12→ 13→ 23, where s12 is
decoded before s13 and s13 is decoded before s23 at all users.
Since only data streams s12 and s13 are decoded at user-1,
the decoding order at user-1 based on π2 is π2,1 = 12→ 13.
Hence, sπ2,1(1) = s12 and sπ2,1(2) = s13. The data stream
sπ2,1(1) is decoded before sπ2,1(2). The SINRs of decoding
streams sπ2,1(1) and sπ2,1(2) at user-1 are
γπ2,1(1)1 =
∣
∣hH1 pπ2,1(1)
∣
∣
2
∣
∣hH1 pπ2,1(2)
∣
∣
2+ |hH
1 p23|2+
∑3k=1 |h
H1 pk|
2+ 1
.
(12)
γπ2,1(2)
1 =
∣
∣hH1 pπ2,1(2)
∣
∣
2
|hH1 p23|
2+
∑3k=1 |h
H1 pk|
2+ 1
. (13)
User-1 finally decodes s1 by treating other data streams
as noise. The three-user RS transmission model with the
decoding order π2 = 12 → 13 → 23 is shown in Fig. 2.
The SINR of decoding s1 at user-1 is
γ1 =
∣
∣hH1 p1
∣
∣
2
|hH1 p23|
2+
∑3k=2 |h
H1 pk|
2+ 1
. (14)
The corresponding rate of each data stream is calculated in
the same way as in the two-user example. To ensure that s123is successfully decoded by all users, the achievable common
rate shall not exceed R123 = min{R123
1 , R1232 , R123
3
}. To
ensure that s12 is successfully decoded by user-1 and user-
2, the achievable common rate shall not exceed R12 =min
{R12
1 , R122
}. Similarly, we have R13 = min
{R13
1 , R133
}
and R23 = min{R23
2 , R233
}. All boundary points for the
three-user RS rate region can be obtained by assuming that
R123, R12, R13 and R23 are shared by the corresponding
group of users. Denote the portion of the common rate
allocated to user-k for the message s123 as C123k , we have

Fig. 2: Three-user transmission model using RS.
C1231 +C123
2 +C1233 = R123. Similarly, we have C12
1 +C122 =
R12, C131 + C13
3 = R13, C232 + C23
3 = R23. Following the
three-user RS structure described above, the total achievable
rate of each user is R1,tot = C1231 + C12
1 + C131 + R1 ,
R2,tot = C1232 +C12
2 +C232 +R2 and R3,tot = C123
3 +C133 +
C233 + R3. For a given weight vector u = [u1, u2, u3] and
a fixed decoding order π = [π1, π2, π3], the WSR achieved
by the three-user RS approach is
RRS3(u, π) = max
P,c
3∑
k=1
ukRk,tot (15a)
s.t. C1231 + C123
2 + C1233 ≤ R123 (15b)
C121 + C12
2 ≤ R12 (15c)
C131 + C13
3 ≤ R13 (15d)
C232 + C23
3 ≤ R23 (15e)
tr(PPH) ≤ Pt (15f)
Rk,tot ≥ Rthk , k ∈ {1, 2, 3} (15g)
c ≥ 0 (15h)
where c = [C1231 , C123
2 , C1233 , C12
1 , C122 , C13
1 , C133 , C23
2 , C233 ]
is the common rate vector required to be optimized in order
to maximize the WSR. By calculating RRS3(u, π) for a
set of different rate weights u, we obtain the rate region
RRS3(π) of a certain decoding order π. The rate region of
the three-user RS is achieved as the convex hull of the union
over all decoding orders as RRS = conv (⋃
π RRS(π)) .Similar to the two-user case, SC–SIC and MU–LP are
again easily identified as special sub-strategies of RS by
switching off some of the streams. Problem (15) is non-
convex and non-trivial. We propose a WMMSE algorithm
to solve it as discussed in Section IV-G.
C. Generalized rate-splitting
We further propose a generalized RS framework for Kusers. The users are indexed by the set K = {1, . . . ,K}.
For any subset A of the users, A ⊆ K, the BS transmits
a data stream sA to be decoded by the users in the subset
A while treated as noise by other users. sA loads messages
of all the users in the subset A. The message intended for
user-k (k ∈ K) is split as {WA′
k |A′ ⊆ K, k ∈ A′}. The
messages {WAk′ |k′ ∈ A} of users with the same superscript
A are encoded together into the stream sA.
The stream order defined in Section IV-B is applied
to the generalized RS. The stream order of data stream
sA is |A|. For a given l ∈ K, there are(Kl
)distinct l-
order streams. For example, we have only one K-order
stream (traditional common stream) while we have K 1-
order streams (private steams). Define sl ∈ C(Kl )×1 as the
l-order data stream vector formed by all l-order streams in
{sA′ |A′ ⊆ K, |A′| = l}. Note that when l = K , there is
a single K-order stream. sK reduces to sK. For example,
when K = 3, the 3-order stream vector is s3 = s123. The
1-order and the 2-order stream vectors are s1 = [s1, s2, s3]T
and s2 = [s12, s13, s23]T , respectively. The data streams
are linearly precoded via the precoding matrix Pl formed
by {pA′ |A′ ⊆ K, |A′| = l}. The precoded streams are
superposed and the resulting transmit signal is
x =
K∑
l=1
Plsl =
K∑
l=1
∑
A′⊆K,|A′|=l
pA′sA′ . (16)
At user sides, each user is required to decode the intended
streams based on SIC. The decoding procedure starts from
the K-order stream and then goes down to the 1-order
stream. A given user is involved in multiple l-order streams
with an exception of the K-order and 1-order streams.
Denote πl as one of the decoding orders to decode the
l-order data streams sl for all users. The l-order stream
vector to be decoded at user-k based on a certain decod-
ing order πl is sπl,k= [sπl,k(1), · · · , sπl,k(|Sl,k|)]
H , where
Sl,k = {sA′ |A′ ⊆ K, |A′| = l, k ∈ A′} is the set of l-order streams to be decoded at user-k. We assume sπl,k(i)
is decoded before sπl,k(j) if i < j. The SINR of user-k to
decode the l-order stream sπl,k(i) with a certain decoding
order πl is
γπl,k(i)
k =|hH
k pπl,k(i)|2
Iπl,k(i) + 1, (17)
where
Iπl,k(i) =∑
j>i
|hHk pπl,k(j)|
2 +l−1∑
l′=1
|Sl′,k|∑
j=1
|hHk pπl′,k(j)
|2
+∑
A′⊆K,k/∈A′
|hHk pA′ |2
is the interference at user-k to decode sπl,k(i).∑j>i |h
Hk pπl,k(j)|
2 is the interference from the
remaining non-decoded l-order streams in sπl,k.
∑l−1l′=1
∑|Sl′,k|
j=1 |hHk pπl′,k(j)
|2 is the interference from
lower order streams sπl′,k, ∀l′ < l to be decoded at
user-k.∑
A′⊆K,k/∈A′ |hHk pA′ |2 is the interference from the
streams that are not intended for user-k. The corresponding
achievable rate of user-k for the data stream sπl,k(i) is
Rπl,k(i)k = log2(1 + γ
πl,k(i)k ). To ensure that the streams
shared by more than two users are successfully decoded by
all users, the achievable rate of each user in the subset A(A ∈ K, 2 ≤ |A| ≤ K) to decode the |A|-order stream sAshall not exceed
RA = mink′
{RA
k′ | k′ ∈ A}. (18)
For a given l ∈ K, the l-order streams to be decoded at
different users are different. sA is decoded at user-k (k ∈ A)based on the decoding order π|A|,k. RA becomes the rate of
receiving stream sA at all users in the user group A with
a certain decoding order π|A|. All boundary points for the
K-user RS rate region can be obtained by assuming that
RA is shared by all users in the user group A. Denote the
portion of the common rate allocated to user-k (k ∈ A) as
CAk , we have
∑k′∈A CA
k′ = RA. Following the RS structure
described above, the total achievable rate of user-k is
Rk,tot =∑
A′⊆K,k∈A′
CA′
k +Rk, (19)
where Rk is the rate of the 1-order stream sk. It is intended
for user-k only. No common rate sharing is required for Rk.
For a given weight vector u = [u1, · · · , uK ] and a certain
decoding order π = {π1, . . . , πK}, the WSR achieved by
RS isRRS(u, π) = max
P,c
∑
k∈K
ukRk,tot
s.t.∑
k′∈A
CAk′ ≤ RA, ∀A ⊆ K
tr(PPH) ≤ Pt
Rk,tot ≥ Rthk , k ∈ K
c ≥ 0
(20)
P = [P1, . . . ,PK ] is the precoding matrix of all order
streams. c is the common rate vector formed by {CAk |A ⊆
K, k ∈ A}. For a fixed weight vector, problem (20) can
be solved using the WMMSE approach discussed in Section
IV-G by establishing Rate-WMMSE relationships for all data
Fig. 3: 1-layer RS model of K users. The common stream
sK is shared by all the users.
streams. By calculating RRS(u, π) for a set of different rate
weights u, we obtain the rate region RRS(π) of a certain
decoding order π. To achieve the rate region, all decoding
orders should be considered. The capacity region of RS is
defined as the convex hull of the union over all decoding
orders as
RRS = conv
(⋃
π
RRS(π)
). (21)
D. Structured and low-complexity rate-splitting
The generalized RS described in Section IV-C is able
to provide more room for rate and QoS enhancements at
the expense of more layers of SIC at receivers. Hence,
though the generalized RS framework is very general and
can be used to identify the best possible performance, its
implementation can be complex due to the large number
of SIC layers and common messages involved. To overcome
the problem, we introduce two low-complexity RS strategies
for K users, 1-layer RS and 2-layer Hierarchical RS (HRS).
Those two RS strategies require the implementation of one
and two layers of SIC at each receiver, respectively.
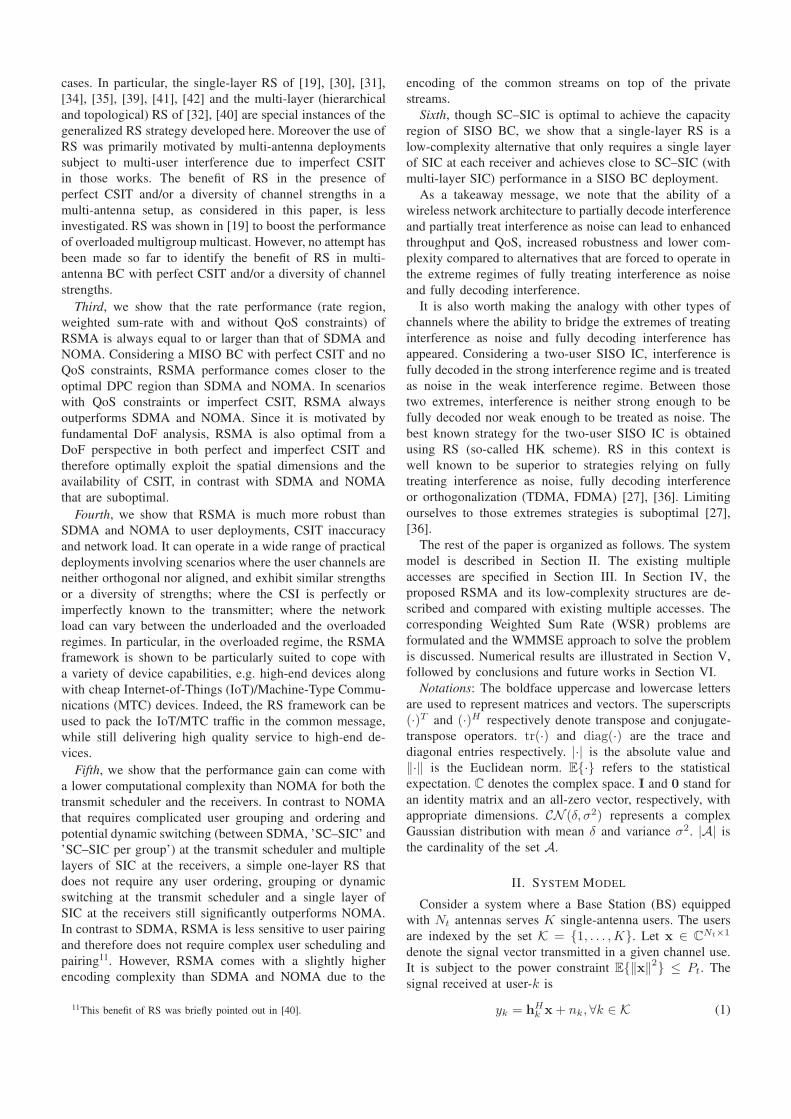
1) 1-layer RS: Instead of transmitting all order streams,
1-layer RS transmits the K-order common stream and 1-
order private streams. Only one SIC is required at each
receiver. The message of each user is split into two parts
{WKk ,W k
k }, ∀k ∈ K. The messages WK1 , . . . ,WK
K are
jointly encoded into the K-order stream sK intended to
be decoded by all users. W kk is encoded into sk to be
decoded by user-k only. The overall data streams to be
transmitted based on 1-layer RS is s = [sK, s1, . . . , sK ]T .
The data streams are linearly precoded via precoder P =[pK,p1, . . . ,pK ]. The resulting transmit signal is x =Ps = pKsK +
∑k∈K pksk. Fig. 3 shows a 1-layer RS
model. Readers are referred to Fig. 1 in [13] for a detailed
illustration of the 1-layer RS architecture.
At user sides, all users firstly decode the data stream sKby treating the interference from s1, . . . , sK as noise. The

SINR of the K-order stream at user-k is
γKk =
∣∣hHk pK
∣∣2∑
j∈K
∣∣hHk pj
∣∣2 + 1. (22)
Once sK is successfully decoded, its contribution to the
original received signal yk is subtracted. After that, user-kdecodes its private stream sk by treating the 1-order private
streams of other users as noise. The SINR of decoding the
private stream sk at user-k is
γk =
∣∣hHk pk
∣∣2∑
j∈K,j 6=k
∣∣hHk pj
∣∣2 + 1. (23)
The corresponding achievable rates of user-k for the
streams sK and sk are RKk = log2
(1 + γK
k
)and Rk =
log2 (1 + γk). To ensure that sK is successfully decoded
by all users, the achievable common rate shall not exceed
RK = min{RK
1 , . . . , RKK
}. RK is shared among users
such that CKk is the kth user’s portion of the common
rate with∑
k∈K CKk = RK. Following the two-user RS
structure described above, the total achievable rate of user-
k is Rk,tot = CKk + Rk. For a given weight vector
u = [u1, . . . , uK ], the WSR achieved by the K-user 1-layer
RS approach is
R1−layerRS(u) = maxP,c
∑
k∈K
ukRk,tot (24a)
s.t.∑
k∈K
CKk ≤ RK (24b)
tr(PPH) ≤ Pt (24c)
Rk,tot ≥ Rthk , k ∈ K (24d)
c ≥ 0 (24e)
where c = [CK1 , . . . , CK
K ]. For a given weight vector,
problem (24) can be solved using the WMMSE approach
in [30].
In contrast to NOMA, this 1-layer RS does not require
any user ordering or grouping at the transmitter side since
all users decode the common message (using single layer
of SIC) before accessing their respective private messages.
We also note that the 1-layer RS is a sub-scheme of the
generalized RS and is a super-scheme of MU–LP (since by
not allocating any power to the common message, the 1-layer
RS boils down to MU–LP). However, for K > 2, SC–SIC
and SC–SIC per group are not sub-schemes of 1-layer RS
(even though they were sub-schemes of the generalized RS).
This explains why, in [13], the authors already contrasted 1-
layer RS and NOMA and expressed that the two strategies
cannot be treated as extensions or subsets of each other.
This 1-layer RS appeared in many scenarios subject to
imperfect CSIT in [19], [30], [31], [34], [35], [39], [41],
[42].
2) 2-layer HRS: The K users are divided into Ggroups G = {1, . . . , G} with Kg, g ∈ G users in each
group. The user groups satisfy the same conditions as
in Section III-B2. Besides the K-order stream and 1-
order streams, 2-layer HRS also allows the transmis-
sion of a |Kg|-order stream intended for users in Kg.
Fig. 4: 2-layer HRS example, K = 4, G = 2, K1 = {1, 2},K2 = {3, 4}.
The overall data streams to be transmitted based on 2-
layer RS is s = [sK, sK1 , . . . , sKG, s1, . . . , sK ]T . The
data streams are linearly precoded via precoder P =[pK,pK1 , . . . ,pKG
,p1, . . . ,pK ]. The resulting transmit sig-
nal is x = Ps = pKsK +∑
g∈G pKgsKg
+∑
k∈K pksk.Fig. 4 shows an example of 2-layer HRS. The users are
divided into two groups, K1 = {1, 2}, K2 = {3, 4}. s1234is a 4-order stream intended for all the users while s12 and
s34 are 2-order streams for users in each group only.
Each user is required to decode three streams sK, sKgand
sk. We assume k ∈ Kg . The data stream sK is decoded first
by treating the interference from all other streams as noise.
The SINR of the K-order stream at user-k is
γKk =
∣∣hHk pK
∣∣2∑
g∈G
∣∣hHk pKg
∣∣2 +∑
j∈K
∣∣hHk pj
∣∣2 + 1. (25)
Once sK is successfully decoded, its contribution to the
original received signal yk is subtracted. After that, user-
k decodes its group common stream sKgby treating other
group common streams and 1-order private streams as noise.
The SINR of decoding the |Kg|-order stream sKgat user-k
is
γKg
k =
∣∣hHk pKg
∣∣2∑
g′∈G,g′ 6=g
∣∣∣hHk pKg′
∣∣∣2
+∑
j∈K
∣∣hHk pj
∣∣2 + 1.
(26)
After removing its contribution to the received signal, user-
k decodes its private stream sk. The SINR of decoding the
private stream sk at user-k is
γk =
∣∣hHk pk
∣∣2∑
g′∈G,g′ 6=g
∣∣∣hHk pKg′
∣∣∣2
+∑
j∈K,j 6=k
∣∣hHk pj
∣∣2 + 1
.
(27)
The corresponding achievable rates of user-k for the
streams sK, sKgand sk are RK
k = log2(1 + γK
k
), R
Kg
k =
log2
(1 + γ
Kg
k
)and Rk = log2 (1 + γk). The achievable
common rate of sK and sKgshall not exceed RK =
min{RK
1 , . . . , RKK
}and RKg
= mink
{R
Kg
k | k ∈ Kg
},

TABLE I: Comparison of different strategies
Multiple
AccessNOMA SDMA RSMA
Strategy SC–SIC SC–SIC per group MU–LP All forms of RS
Design
PrincipleFully decode interference
Fully decode interference ineach group and treatinterference between groupsas noise
Fully treat interference asnoise
Partially decode interferenceand partially treat interferenceas noise
Decoderarchitecture
SIC at receivers SIC at receivers Treat interference as noise SIC at receivers
User
DeploymentScenario
Users experience alignedchannel directions and a largedisparity in channel strengths.
Users in each groupexperience aligned channeldirections and a largedisparity in channel strengths.Users in different groupsexperience orthogonalchannels.
Users channels are(semi-)orthogonal with similarchannel strengths.
Any angle between channelsand any disparity in channelstrengths
Network
load
More suited to overloadednetwork
More suited to overloadednetwork
More suited to underloadednetwork
Suited to any network load
respectively. RK is shared among users such that CKk is the
kth user’s portion of the common rate with∑
k∈K CKk =
RK. RKgis shared among users in the group Kg such
that CKg
k is the kth user’s portion of the common rate
with∑
k∈KgC
Kg
k = RKg. Following the two-user RS
structure described above, the total achievable rate of user-kis Rk,tot = CK
k + CKg
k + Rk, where k ∈ Kg . For a given
weight vector u = [u1, . . . , uK ], the WSR achieved by the
K-user 2-layer HRS approach is
R2−layerHRS(u) = maxP,c
∑
k∈K
ukRk,tot (28a)
s.t.∑
k∈K
CKk ≤ RK (28b)
∑
k∈Kg
CKg
k ≤ RKg, ∀g ∈ G (28c)
tr(PPH) ≤ Pt (28d)
Rk,tot ≥ Rthk , k ∈ K (28e)
c ≥ 0 (28f)
where c is the common rate vector formed by {CKk , C
Kg
k′ |k ∈K, k′ ∈ Kg, g ∈ G}. For a given weight vector, problem (28)
can be solved by simply modifying the WMMSE approach
discussed in Section IV-G.
Comparing with SC–SIC per group where |Kg|−1 layers
of SIC are required at user sides, 2-layer HRS only requires
2 layers of SIC at each user. Moreover, the user ordering
issue in SC–SIC per group does not exist in 2-layer HRS.
The streams of a higher stream order will always be decoded
before the streams of a lower stream order. 1-layer RS is the
simplest architecture since only 1 SIC is needed at each user
and it is a sub-scheme of the 2-layer HRS. We also note that
we can obtain a 1-layer RS per group from the 2-layer HRS
by not allocating any power to sK. Note that SC–SIC and
SC–SIC per group are not necessarily sub-schemes of the
2-layer HRS. The 2-layer HRS strategy was first introduced
in [40] in the Massive MIMO context.
E. Encompassing existing NOMA and SDMA
A comparison of NOMA, SDMA and RSMA is shown
in Table I. Comparing with NOMA and SDMA, the most
important characteristic of RSMA is that it partially decodes
interference and partially treats interference as noise through
the split into common and privates messages. This capability
enables RSMA to maintain a good performance for all user
deployment scenarios and all network loads, as it will appear
clearer in the numerical results of Section V.
Let us further discuss how the proposed framework of
generalized RS in Section IV-C contrasts and encompasses
NOMA, SDMA and RS strategies. We first compare the four-
user MIMO–NOMA scheme illustrated in Fig. 5 of [1] with
the four-user 2-layer HRS strategy illustrated in Fig. 4. In
Fig. 5 of [1], user-1 and user-2 are superposed in the same
beam. User-3 and user-4 share another beam. The users are
decoded based on SC–SIC within each beam. As for the
four-user 2-layer HRS strategy in Fig. 4, the encoded streams
are precoded and transmitted jointly to users. If we set the
common message s12 to be encoded by the message of user-
2 only and decoded by both user-1 and user-2, the common
message s34 to be encoded by the message of user-4 and
decoded by user-3 and user-4, we also set the precoders
p12 and p1 to be equal, the precoders p34 and p3 to be
equal and the precoders of other streams to be 0, then the
proposed RS scheme reduces to the scheme illustrated in Fig.
5 of [1]. Similarly, the K-user RS model can be reduced to
the K-user MIMO–NOMA scheme. Therefore, the MIMO–
NOMA scheme proposed in [1] is a particular case of our
RS framework.
In view of the above discussions, it should now be
clear that SDMA and the multi-antenna NOMA strategies
discussed in the introduction (relying on SC–SIC and SC–
SIC per group) are all special instances of the generalized
RS framework.
In the proposed generalized K-user RS model, if we set
Pl = 0, ∀l ∈ {2, · · · ,K}, only 1-order streams (private
streams) are transmitted. Each user only decodes its intended
private stream by treating others as noise. Problem (20) is
then reduced to the SDMA problem (3). If the message
of each user is encoded into one stream of distinct stream
order, problem (20) is equivalent to the SC–SIC problem
(5). By keeping 1-order and K-order streams, we have the 1-
layer RS strategy whose performance benefit in the presence
of imperfect CSIT was highlighted in various scenarios in
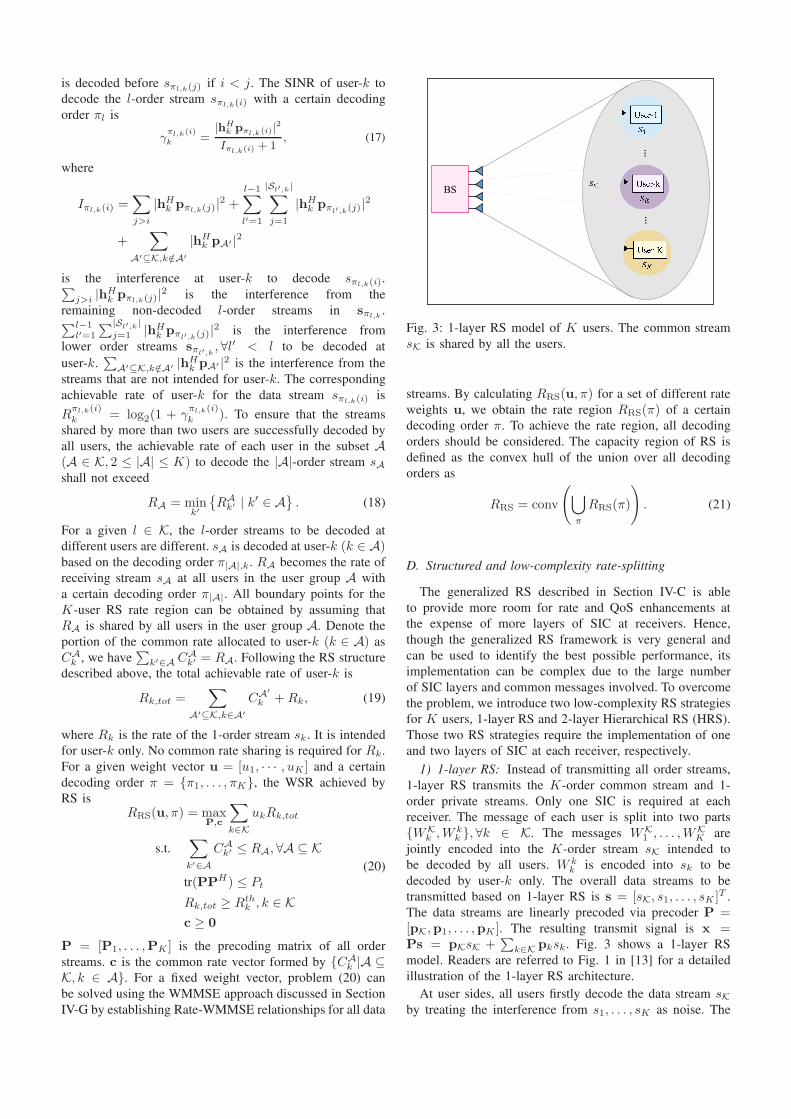
TABLE II: Qualitative comparison of the complexity of different strategies
Multiple
AccessNOMA SDMA RSMA
Strategy SC–SIC SC–SIC per group MU–LP RS 1-layer RS
Encoder
complexityencode K streams encode K streams encode K streams
encode K privatestreams plus additionalcommon streams
encode K + 1 streams
Scheduler
complexity
Very complex as itrequires to findaligned users anddecide upon suitableuser ordering.
Very complex as itrequires to divide usersinto orthogonal groups,with aligned users ineach group and decideupon suitable userordering in each group.
Complex as MU–LPrequires to pair togethersemi-orthogonal userswith similar channelgains.
Complex as it requiresto decide upon suitabledecoding order of thestreams with the samestream order
Simpler user schedulingas RS copes with anyuser deploymentscenario, does not relyon user grouping anduser ordering.
Receiver
complexity
Requires multiplelayers of SIC. Subjectto error propagation.
Requires multiple layersof SIC in each groupand a single layer ofSIC if groups are madeof 2 users. Subject toerror propagation.
Does not require anySIC.
Requires multiplelayers of SIC. Subjectto error propagation.
Requires a single layerof SIC for all users.Less subject to errorpropagation.
[19], [30], [31], [34], [35], [39], [41], [42]. There is only
one common data stream to be transmitted and decoded by
all users before each user decodes its private stream. By
keeping 1-order, K-order and l-order streams, where l is
selected from {2, · · · ,K − 1}, the problem becomes the 2-
layer HRS originally proposed in [40] with two-layers of
common messages to be transmitted. Another example of
such a multi-layer RS has also appeared in the topological
RS for MISO networks of [32]. Therefore, the formulated K-
user RS problem is a more general problem. It encompasses
SDMA, NOMA and existing RS methods as special cases.
Though the current work focuses on MISO BC, the RS
framework can be extended to multi-antenna users and the
general MIMO BC [33] as well as to a general network
scenario with multiple transmitters [32]. Nevertheless the
optimization of the precoders in those scenarios remain
interesting topics for future research. Applications of this
RS framework to relay networks is also worth exploring.
Preliminary ideas have appeared in [45], though joint en-
coding of the splitted common messages are not taken into
account.
F. Complexity of RSMA
We further discuss the complexity of RSMA by comparing
it with NOMA and SDMA. A qualitative comparison of
NOMA, SDMA and RSMA is shown in Table II. In Table
II, RS refers to the generalized RS of Section IV-C.
As mentioned in the introduction, the complexity of
NOMA in the multi-antenna setup is increasing significantly
at both the transmitter and the receivers. The optimal decod-
ing order of NOMA is no longer fixed based on the channel
gain as in the SISO BC. To maximize the WSR, the decoding
order should be optimized together with precoders at the
transmitter. Moreover, SC–SIC is suitable for aligned users
with large channel gain difference. A proper user scheduling
algorithm increases the scheduler complexity. At user sides,
K − 1 layers of SIC are required at each user for a K-user
SC–SIC system. Increasing the number of users leads to a
dramatic increase of the scheduler and receiver complexity,
and is subject to more error propagation in the SICs.
SC–SIC per group reduces the complexity at user sides.
Only⌈KG
⌉layers of SIC are required at each user if we
uniformly group the K users into G groups. However, the
complexity at the transmitter increases with the number
of user groups. A joint design of user ordering and user
grouping for all groups is necessary in order to maximize
the WSR. For example, for a 4-user system, if we divide the
users into 2 groups with 2 users in each group, we should
consider 3 different user grouping methods and 4 different
decoding orders for each grouping method.
The complexity of MU–LP is much reduced as it does
not require any SIC at user sides. However, as MU–LP is
more suitable for users with (semi-)orthogonal channels and
similar channel strengths, the transmitter requires accurate
CSIT and user scheduling should be carefully designed for
interference coordination. The scheduler complexity at the
transmitter is still high.
Comparing with NOMA and SDMA, RSMA is able to
balance the performance and complexity better. All forms of
RS are suitable for users with any channel gain difference
and any channel angle in between, though a multi-layer RS
would have more flexibility. Considering the generalized RS,
the decoding order of multiple streams with the same stream
order should be optimized together with the precoders when
there are multiple streams of the same stream order intended
for each user (e.g. each user decodes two 2-order streams
in the three-user example of Section IV-B.). But its special
case, 1-layer RS, simplifies both the scheduler and receiver
design and it is still able to achieve a good performance in
all user deployment scenarios. 1-layer RS requires only 1
SIC at each user. It does not rely on user grouping and user
ordering for user scheduling. Therefore, the complexity of
the scheduler is much simplified.
The cost of RSMA comes with a slightly higher encoding
complexity since private and common streams need to be
encoded. For the 1-layer RS in a K-user MISO BC, K + 1streams need to be encoded in contrast to K streams for
NOMA and SDMA.
G. Optimization of RS
The WMMSE approach proposed in [44] is extended to
solve the problem. The WMMSE algorithm to solve the sum
rate maximization problem with 1-layer RS (discussed in
Section IV-D1) is proposed in [30]. We further extend it
to solve the generalized RS problem (20). To simplify the
explanation, we focus on the 3-user problem (15). It can be
easily extended to solve the K-user generalized RS problem.
As the 1-order and 2-order streams to be decoded at
different users are not the same, we take user-1 as an
example. The procedure of the WMMSE algorithm is the
same for other users. The signal received at user-1 is y1 =hH1 Ps+n1. It decodes four streams s123, sπ2,1(1), sπ2,1(2), s1
sequentially using SICs. The 3-order stream s123 is decoded
first. It is estimated as s123 = g1231 y1, where g1231 is the
equalizer. After successfully decoding and removing s123from y1, the estimate of the 2-order stream sπ2,1(1) is
sπ2,1(1) = gπ2,1(1)1 (y1−hH
1 p123s123). Similarly, we calculate
the estimates of sπ2,1(2) and s1 as sπ2,1(2) = gπ2,1(2)1 (y1 −
hH1 p123s123 − hH
1 pπ2,1(1)sπ2,1(1)) and s1 = g11(y1 −hH1 p123s123 − hH
1 pπ2,1(1)sπ2,1(1) − hH1 pπ2,1(2)sπ2,1(2)), re-
spectively. gπ2,1(1)1 , g
π2,1(2)1 , g11 are the corresponding equal-
izers at user-1. The Mean Square Error (MSE) of each stream
is defined as εk , E{|sk − sk|2}. They are calculated as
ε1231 = |g1231 |2T 123
1 − 2ℜ{g1231 hH1 p123}+ 1,
επ2,1(1)1 = |g
π2,1(1)1 |2T
π2,1(1)1 − 2ℜ{g
π2,1(1)1 hH
1 pπ2,1(1)}+ 1,
επ2,1(2)1 = |g
π2,1(2)1 |2T
π2,1(2)1 − 2ℜ{g
π2,1(2)1 hH
1 pπ2,1(2)}+ 1,
ε11 = |g11 |2T 1
1 − 2ℜ{g11hH1 p1}+ 1
(29)
where T 1231 , |hH
1 p123|2 + |hH1 p12|2 + |hH
1 p13|2 +|hH
1 p23|2+ |hH1 p1|2+ |hH
1 p2|2+ |hH1 p3|2+1 is the receive
power at user-1. Tπ2,1(1)1 , T 123
1 − |hH1 p123|2, T
π2,1(2)1 ,
Tπ2,1(1)1 −|hH
1 pπ2,1(1)|2, T 1
1 , Tπ2,1(2)1 −|hH
1 pπ2,1(2)|2. The
optimum MMSE equalizers are
(g1231 )MMSE = (p123)Hh1(T
1231 )−1,
(gπ2,1(1)1 )MMSE = (pπ2,1(1))
Hh1(Tπ2,1(1)1 )−1,
(gπ2,1(2)1 )MMSE = (pπ2,1(2))
Hh1(Tπ2,1(2)1 )−1,
(g11)MMSE = (p1)
Hh1(T11 )
−1.
(30)
They are calculated by solving ∂ε1231
∂g1231
= 0, ∂επ2,1(1)
1
∂gπ2,1(1)
1
= 0,
∂επ2,1(2)
1
∂gπ2,1(2)
1
= 0,∂ε11∂g1
1= 0. Substituting (30) into (29), the MMSEs
become
(ε1231 )MMSE , ming1231
ε1231 = (T 1231 )−1I1231 ,
(επ2,1(1)1 )MMSE , min
gπ2,1(1)
1
επ2,1(1)1 = (T
π2,1(1)1 )−1I
π2,1(1)1 ,
(επ2,1(2)1 )MMSE , min
gπ2,1(2)
1
επ2,1(2)1 = (T
π2,1(2)1 )−1I
π2,1(2)1 ,
(ε11)MMSE , min
g11
ε11 = (T 11 )
−1I11 ,
(31)
where I1231 = Tπ2,1(1)1 , I
π2,1(1)1 = T
π2,1(2)1 , I
π2,1(2)1 =
T 11 , I11 = T 1
1 − |hH1 p1|2. Based on (31), the SINRs
of decoding the intended streams at user-1 can be ex-
pressed as γ1231 = 1/(ε1231 )MMSE − 1, γ
π2,1(1)1 =
1/(επ2,1(1)1 )MMSE − 1, γ
π2,1(2)1 = 1/(ε
π2,1(2)1 )MMSE − 1,
γ11 = 1/(ε11)
MMSE − 1. The corresponding rates are
rewritten as R1231 = − log2((ε
1231 )MMSE), R
π2,1(1)1 =
− log2((επ2,1(1)1 )MMSE), R
π2,1(2)1 = − log2((ε
π2,1(2)1 )MMSE),
R11 = − log2((ε
11)
MMSE). The augmented WMSEs are
ξ1231 = u1231 ε1231 − log2(u
1231 ),
ξπ2,1(1)1 = u
π2,1(1)1 ε
π2,1(1)1 − log2(u
π2,1(1)1 ),
ξπ2,1(2)1 = u
π2,1(2)1 ε
π2,1(2)1 − log2(u
π2,1(2)1 ),
ξ11 = u11ε
11 − log2(u
11),
(32)
where u1231 , u
π2,1(1)1 , u
π2,1(2)1 , u1
1 are weights
associated with each stream at user-1. By solving∂ξ1231
∂g1231
= 0,∂ξ
π2,1(1)
1
∂gπ2,1(1)
1
= 0,∂ξ
π2,1(2)
1
∂gπ2,1(2)
1
= 0,∂ξ11∂g1
1= 0, we derive
the optimum equalizers as (g1231 )∗ = (g1231 )MMSE,
(gπ2,1(1)1 )∗ = (g
π2,1(1)1 )MMSE, (g
π2,1(2)1 )∗ = (g
π2,1(2)1 )MMSE,
(g11)∗ = (g11)
MMSE. Substituting the optimum equalizers into
(32), we obtain
ξ1231
((g1231 )MMSE
)= u123
1 (ε1231 )MMSE − log2(u1231 ),
ξπ2,1(1)1
((g
π2,1(1)1 )MMSE
)= u
π2,1(1)1 (ε
π2,1(1)1 )MMSE − log2(u
π2,1(1)1 ),
ξπ2,1(2)1
((g
π2,1(2)1 )MMSE
)= u
π2,1(2)1 (ε
π2,1(2)1 )MMSE − log2(u
π2,1(2)1 ),
ξ11((g11)
MMSE)= u1
1(ε11)
MMSE − log2(u11).
(33)
By further solving∂ξ1231 ((g123
1 )MMSE)∂u123
1= 0,
∂ξπ2,1(1)
1
(
(gπ2,1(1)
1 )MMSE)
∂uπ2,1(1)
1
= 0,
∂ξπ2,1(2)
1
(
(gπ2,1(2)
1 )MMSE)
∂uπ2,1(2)
1
= 0,∂ξ11((g1
1)MMSE)
∂u11
= 0, we obtain the opti-
mum MMSE weights as
(u1231 )∗ = (u123
1 )MMSE , ((ε1231 )MMSE)−1,
(uπ2,1(1)1 )∗ = (u
π2,1(1)1 )MMSE , ((ε
π2,1(1)1 )MMSE)−1,
(uπ2,1(2)1 )∗ = (u
π2,1(2)1 )MMSE , ((ε
π2,1(2)1 )MMSE)−1,
(u11)
∗ = (u11)
MMSE , ((ε11)MMSE)−1.
(34)
Substituting (34) into (33), we establish the Rate-WMMSE
relationship as
(ξ1231 )MMSE , minu1231 ,g123
1
ξ1231 = 1−R1231 ,
(ξπ2,1(1)1 )MMSE , min
uπ2,1(1)
1 ,gπ2,1(1)
1
ξπ2,1(1)1 = 1−R
π2,1(1)1 ,
(ξπ2,1(2)1 )MMSE , min
uπ2,1(2)
1 ,gπ2,1(2)
1
ξπ2,1(2)1 = 1−R
π2,1(2)1 ,
(ξ11)MMSE , min
u11,g
11
ξ11 = 1−R11.
(35)
Similarly, we can establish the Rate-WMMSE relationships
for user-2 and user-3. Motivated by the Rate-WMMSE re-
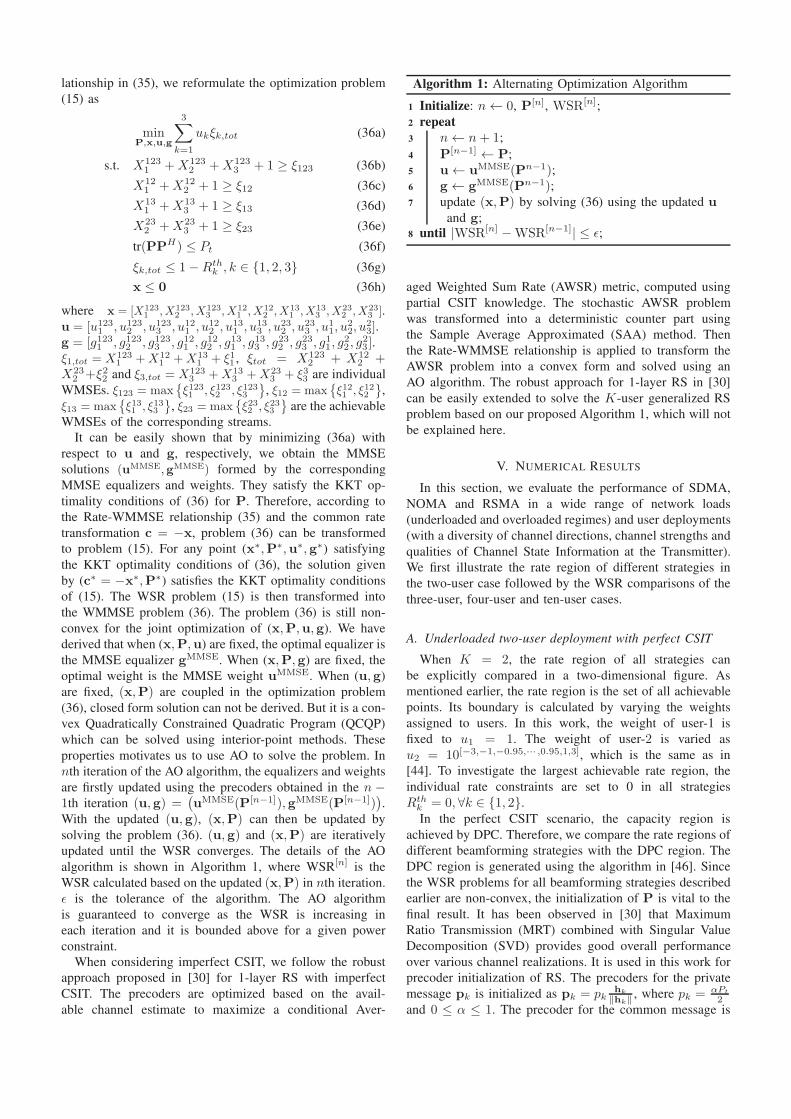
lationship in (35), we reformulate the optimization problem
(15) as
minP,x,u,g
3∑
k=1
ukξk,tot (36a)
s.t. X1231 +X123
2 +X1233 + 1 ≥ ξ123 (36b)
X121 +X12
2 + 1 ≥ ξ12 (36c)
X131 +X13
3 + 1 ≥ ξ13 (36d)
X232 +X23
3 + 1 ≥ ξ23 (36e)
tr(PPH) ≤ Pt (36f)
ξk,tot ≤ 1−Rthk , k ∈ {1, 2, 3} (36g)
x ≤ 0 (36h)
where x = [X1231 , X123
2 , X1233 , X12
1 , X122 , X13
1 , X133 , X23
2 , X233 ].
u = [u1231 , u123
2 , u1233 , u12
1 , u122 , u13
1 , u133 , u23
2 , u233 , u1
1, u22, u
23].
g = [g1231 , g1232 , g1233 , g121 , g122 , g131 , g133 , g232 , g233 , g11, g22 , g
23 ].
ξ1,tot = X1231 +X12
1 +X131 + ξ11 , ξtot = X123
2 + X122 +
X232 +ξ22 and ξ3,tot = X123
3 +X133 +X23
3 + ξ33 are individual
WMSEs. ξ123 = max{ξ1231 , ξ1232 , ξ1233
}, ξ12 = max
{ξ121 , ξ122
},
ξ13 = max{ξ131 , ξ133
}, ξ23 = max
{ξ232 , ξ233
}are the achievable
WMSEs of the corresponding streams.
It can be easily shown that by minimizing (36a) with
respect to u and g, respectively, we obtain the MMSE
solutions (uMMSE,gMMSE) formed by the corresponding
MMSE equalizers and weights. They satisfy the KKT op-
timality conditions of (36) for P. Therefore, according to
the Rate-WMMSE relationship (35) and the common rate
transformation c = −x, problem (36) can be transformed
to problem (15). For any point (x∗,P∗,u∗,g∗) satisfying
the KKT optimality conditions of (36), the solution given
by (c∗ = −x∗,P∗) satisfies the KKT optimality conditions
of (15). The WSR problem (15) is then transformed into
the WMMSE problem (36). The problem (36) is still non-
convex for the joint optimization of (x,P,u,g). We have
derived that when (x,P,u) are fixed, the optimal equalizer is
the MMSE equalizer gMMSE. When (x,P,g) are fixed, the
optimal weight is the MMSE weight uMMSE. When (u,g)
are fixed, (x,P) are coupled in the optimization problem
(36), closed form solution can not be derived. But it is a con-
vex Quadratically Constrained Quadratic Program (QCQP)
which can be solved using interior-point methods. These
properties motivates us to use AO to solve the problem. In
nth iteration of the AO algorithm, the equalizers and weights
are firstly updated using the precoders obtained in the n −1th iteration (u,g) =
(uMMSE(P[n−1]),gMMSE(P[n−1])
).
With the updated (u,g), (x,P) can then be updated by
solving the problem (36). (u,g) and (x,P) are iteratively
updated until the WSR converges. The details of the AO
algorithm is shown in Algorithm 1, where WSR[n] is the
WSR calculated based on the updated (x,P) in nth iteration.
ǫ is the tolerance of the algorithm. The AO algorithm
is guaranteed to converge as the WSR is increasing in
each iteration and it is bounded above for a given power
constraint.
When considering imperfect CSIT, we follow the robust
approach proposed in [30] for 1-layer RS with imperfect
CSIT. The precoders are optimized based on the avail-
able channel estimate to maximize a conditional Aver-
Algorithm 1: Alternating Optimization Algorithm
1 Initialize: n← 0, P[n], WSR[n];
2 repeat
3 n← n+ 1;
4 P[n−1] ← P;
5 u← uMMSE(Pn−1);6 g← gMMSE(Pn−1);7 update (x,P) by solving (36) using the updated u
and g;
8 until |WSR[n] −WSR[n−1]| ≤ ǫ;
aged Weighted Sum Rate (AWSR) metric, computed using
partial CSIT knowledge. The stochastic AWSR problem
was transformed into a deterministic counter part using
the Sample Average Approximated (SAA) method. Then
the Rate-WMMSE relationship is applied to transform the
AWSR problem into a convex form and solved using an
AO algorithm. The robust approach for 1-layer RS in [30]
can be easily extended to solve the K-user generalized RS
problem based on our proposed Algorithm 1, which will not
be explained here.
V. NUMERICAL RESULTS
In this section, we evaluate the performance of SDMA,
NOMA and RSMA in a wide range of network loads
(underloaded and overloaded regimes) and user deployments
(with a diversity of channel directions, channel strengths and
qualities of Channel State Information at the Transmitter).
We first illustrate the rate region of different strategies in
the two-user case followed by the WSR comparisons of the
three-user, four-user and ten-user cases.
A. Underloaded two-user deployment with perfect CSIT
When K = 2, the rate region of all strategies can
be explicitly compared in a two-dimensional figure. As
mentioned earlier, the rate region is the set of all achievable
points. Its boundary is calculated by varying the weights
assigned to users. In this work, the weight of user-1 is
fixed to u1 = 1. The weight of user-2 is varied as
u2 = 10[−3,−1,−0.95,··· ,0.95,1,3], which is the same as in
[44]. To investigate the largest achievable rate region, the
individual rate constraints are set to 0 in all strategies
Rthk = 0, ∀k ∈ {1, 2}.In the perfect CSIT scenario, the capacity region is
achieved by DPC. Therefore, we compare the rate regions of
different beamforming strategies with the DPC region. The
DPC region is generated using the algorithm in [46]. Since
the WSR problems for all beamforming strategies described
earlier are non-convex, the initialization of P is vital to the
final result. It has been observed in [30] that Maximum
Ratio Transmission (MRT) combined with Singular Value
Decomposition (SVD) provides good overall performance
over various channel realizations. It is used in this work for
precoder initialization of RS. The precoders for the private
message pk is initialized as pk = pkhk
‖hk‖, where pk = αPt
2and 0 ≤ α ≤ 1. The precoder for the common message is

0 2 4 6
R1,tot
(bit/s/Hz)
0
1
2
3
4
5
6R
2,to
t (bi
t/s/H
z)(a) SNR=10 dB
DPCRSSC-SICMU-LP
0 2 4 6 8 10
R1,tot
(bit/s/Hz)
0
2
4
6
8
10
R2,
tot (
bit/s
/Hz)
(b) SNR=20 dB
Fig. 5: Achievable rate region comparison of different
strategies in underloaded two-user deployment with perfect
CSIT, averaged over 100 random channel realizations, σ21 =
1, σ22 = 1, Nt = 4.
0 1 2 3 4 5
R1,tot
(bit/s/Hz)
0
0.5
1
1.5
R2,
tot (
bit/s
/Hz)
(a) SNR=10 dB
DPCRSSC-SICMU-LP
0 2 4 6 8
R1,tot
(bit/s/Hz)
0
1
2
3
4
R2,
tot (
bit/s
/Hz)
(b) SNR=20 dB
Fig. 6: Achievable rate region comparison of different
strategies in underloaded two-user deployment with perfect
CSIT, averaged over 100 random channel realizations, σ21 =
1, σ22 = 0.09, Nt = 2.
initialized as p12 = p12u12, where p12 = (1 − α)Pt and
u12 is the largest left singular vector of the channel matrix
H = [h1,h2]. It is calculated as u12 = U(:, 1). U is derived
based on the SVD of H, i.e., H = USVH . To ensure a fair
comparison, the precoders of MU–LP are initialized based
on MRT. For SC–SIC, the precoder of the user decoded first
is initialized based on SVD and that of the user decoded last
is initialized based on MRT.
1) Random channel realizations: We firstly consider the
scenarios when the channel of each user hk has independent
and identically distributed (i.i.d.) complex Gaussian entries
with a certain variance, i.e., CN (0, σ2k). The BS is equipped
with two or four antennas (Nt = 2, 4) and serves two
single-antenna users. Fig. 5 shows the average rate regions
of different strategies over 100 random channel realizations
when σ21 = 1, σ2
2 = 1, Nt = 4. SNRs are 10 dB and 20
dB, respectively. When the number of transmit antenna is
larger than the number of users, MU–LP achieves a good
performance. The generated precoders of the users tend to
be more orthogonal as the number of transmit antennas
increases. In contrast, the average rate region achieved by
SC–SIC is small. When σ21 = 1, σ2
2 = 1, there is no disparity
of average channel strengths. SC–SIC is not able to achieve a
good performance in such scenario. As the SC–SIC strategy
is motivated by leveraging the channel strength difference
among users, it achieves a good performance when the
channels are degraded. Specifically, when the channels of
users are close to alignment, SC–SIC works better than
MU–LP if the users have asymmetric channel strengths.
0 2 4 6 8 10
R1,tot
(bit/s/Hz)
0
2
4
6
8
10
R2,
tot (
bit/s
/Hz)
(a) θ=π/9
0 2 4 6 8 10
R1,tot
(bit/s/Hz)
0
2
4
6
8
10
R2,
tot (
bit/s
/Hz)
(b) θ=2π/9
0 2 4 6 8 10
R1,tot
(bit/s/Hz)
0
2
4
6
8
10
R2,
tot (
bit/s
/Hz)
(c) θ=π/3
DPCRSSC-SICMU-LP
0 2 4 6 8 10
R1,tot
(bit/s/Hz)
0
2
4
6
8
10
R2,
tot (
bit/s
/Hz)
(d) θ=4π/9
Fig. 7: Achievable rate region comparison of different strate-
gies in underloaded two-user deployment with perfect CSIT,
γ = 1, Nt = 4, SNR=20 dB.
However, for the general non-degraded MISO-BC, SC–SIC
often yields a performance loss [21]. The simulation results
when σ21 = 1, σ2
2 = 0.09, Nt = 2 is illustrated in Fig. 6. The
average channel gain difference between the users increases
to 5 dB and the number of the transmit antenna reduces
to two. In such scenario, the rate region gap between RS
and MU–LP increases while the rate region gap between
RS and SC–SIC decreases. It shows that SC–SIC is more
suited to the scenarios where the users experience a large
disparity in channel strengths. In both Fig. 5 and Fig. 6,
the rate region gaps among different strategies increase with
SNR. RS achieves a larger rate region than SC–SIC and
MU–LP and it is closer to the capacity region achieved by
DPC.
2) Specific channel realizations: In order to have a better
insight into the benefits of RS over MU–LP and SC–SIC, we
investigate the influence of user angle and channel strength
on the performance. When Nt = 4, the channels of users
are realized as
h1 = [1, 1, 1, 1]H ,
h2 = γ ×[1, ejθ, ej2θ, ej3θ
]H.
(37)
In above channel realizations, γ and θ are control variables. γcontrols the channel strength of user-2. If γ = 1, the channel
strength of user-1 is equal to that of user-2. If γ = 0.3, user-2suffers from an additional 5 dB path loss compared to user-
1. θ controls the angle between the channels of user-1 and
user-2. It varies from 0 to π2 . If θ = 0, the channel of user-1
is aligned with that of user-2. If θ = π2 , the channels of user-
1 and user-2 are orthogonal to each other. In the following
results, γ = 1, 0.3, which corresponds to 0 dB, 5 dB channel
strength difference, respectively. For each γ, θ adopts value
from θ =[π9 ,
2π9 , π
3 ,4π9
]. Intuitively, when θ is less than π
9 ,
the channels of users are sufficiently aligned and SC–SIC
performs well. When θ is larger than 4π9 , the channels of

0 2 4 6 8
R1,tot
(bit/s/Hz)
0
2
4
6
8
R2,
tot (
bit/s
/Hz)
(a) θ=π/9
0 2 4 6 8
R1,tot
(bit/s/Hz)
0
2
4
6
8
R2,
tot (
bit/s
/Hz)
(b) θ=2π/9
0 2 4 6 8
R1,tot
(bit/s/Hz)
0
2
4
6
8
R2,
tot (
bit/s
/Hz)
(c) θ=π/3
DPCRSSC-SICMU-LP
0 2 4 6 8
R1,tot
(bit/s/Hz)
0
2
4
6
8R
2,to
t (bi
t/s/H
z)(d) θ=4π/9
Fig. 8: Achievable rate region comparison of different strate-
gies in underloaded two-user deployment with perfect CSIT,
γ = 1, Nt = 2, SNR=20 dB.
users are sufficiently orthogonal to each other and MU–LP
is more suitable. Therefore, we consider angles within the
range of[π9 ,
4π9
]. SNR is fixed to 20 dB. When Nt = 2, the
channels of user-1 and user-2 are realized as h1 = [1, 1]H
and h2 = γ×[1, ejθ
]H, respectively. The same values of γ
and θ are adopted in Nt = 2 as used in Nt = 4.13
Fig. 7 shows the results when γ = 1, Nt = 4. In all
subfigures, the rate region achieved by RS is equal to or
larger than that of SC–SIC and MU–LP. When γ = 1 and
θ = π9 , the channels of user-1 and user-2 almost coincide. RS
exhibits a clear rate region improvement over SC–SIC and
MU–LP. SC–SIC cannot achieve a good performance due
to the equal channel gain while the performance of MU–
LP is poor when the user channels are closely aligned to
each other. As θ increases, the gap between the rate regions
of RS and MU–LP reduces as the performance of MU–LP
is better when the channels of users are more orthogonal
to each other while the gap between the rate regions of
MU–LP and SC–SIC increases. The rate regions of RS and
MU–LP tend to the capacity region achieved by DPC as θincreases. As shown in Fig. 7(d), when the channels of users
are sufficiently orthogonal to each other, the rate regions
of DPC, RS and MU–LP are almost identical. In such an
orthogonal scenario, RS reduces to MU–LP.
Fig. 8 shows the results when γ = 1, Nt = 2. In all sub-
figures, RS outperforms MU–LP and SC–SIC. Comparing
with the results of Nt = 4, the rate region gap between RS
and MU–LP is enlarged when Nt = 2. When the number
of transmit antenna decreases, it becomes more difficult for
MU–LP to design orthogonal precoders for users. MU–LP
is more suited to underloaded scenarios (Nt > K). In both
Fig. 7 and Fig. 8, the rate region of SC–SIC is the worst due
13Note that for a given θ, the users’ Direction of Arrival (DoA) are thesame for Nt = 2 and Nt = 4 scenarios while the channel angle is moreorthogonal when Nt = 4 comparing with that when Nt = 2.
0 2 4 6 8 10
R1,tot
(bit/s/Hz)
0
1
2
3
4
5
6
R2,
tot (
bit/s
/Hz)
(a) θ=π/9
0 2 4 6 8 10
R1,tot
(bit/s/Hz)
0
1
2
3
4
5
6
R2,
tot (
bit/s
/Hz)
(b) θ=2π/9
0 2 4 6 8 10
R1,tot
(bit/s/Hz)
0
1
2
3
4
5
6
R2,
tot (
bit/s
/Hz)
(c) θ=π/3
DPCRSSC-SICMU-LP
0 2 4 6 8 10
R1,tot
(bit/s/Hz)
0
1
2
3
4
5
6
R2,
tot (
bit/s
/Hz)
(d) θ=4π/9
Fig. 9: Achievable rate region comparison of different strate-
gies in perfect CSIT, γ = 0.3, Nt = 4, SNR=20 dB.
0 2 4 6 8
R1,tot
(bit/s/Hz)
0
1
2
3
4
5
R2,
tot (
bit/s
/Hz)
(a) θ=π/9
0 2 4 6 8
R1,tot
(bit/s/Hz)
0
1
2
3
4
5
R2,
tot (
bit/s
/Hz)
(b) θ=2π/9
0 2 4 6 8
R1,tot
(bit/s/Hz)
0
1
2
3
4
5
R2,
tot (
bit/s
/Hz)
(c) θ=π/3
DPCRSSC-SICMU-LP
0 2 4 6 8
R1,tot
(bit/s/Hz)
0
1
2
3
4
5
R2,
tot (
bit/s
/Hz)
(d) θ=4π/9
Fig. 10: Achievable rate region comparison of different
strategies in perfect CSIT, γ = 0.3, Nt = 2, SNR=20 dB.
to the equal channel gain. In contrast, RS performs well for
any angle between user channels.
Fig. 9 shows the rate region comparison of DPC, RS, SC–
SIC and MU–LP transmission schemes with 5 dB channel
strength difference between the two users, i.e., γ = 0.3 and
Nt = 4. RS and SC–SIC are much closer to the DPC region
in the setting of Fig. 9 compared to Fig. 7 because of the
5 dB channel strength difference. Fig. 9(b) and 9(c) are
interesting as SC–SIC and MU–LP outperform each other
at one part of the rate region. There is a crosspoint between
the two schemes in each figure mentioned. The rate region
of RS is equal to or larger than the convex hull of the rate
regions of SC–SIC and MU–LP.
Fig. 10 shows the rate region comparison when γ =

0.3, Nt = 2. Comparing Fig. 10 with Fig. 9, SC–SIC
achieves a relatively better performance when the number
of transmit antenna reduces. The WSRs of RS and SC–
SIC are overlapped and they almost achieve the capacity
region when θ = π9 . However, as θ increases, the rate region
gap between RS and SC–SIC increases despite the 5 dB
channel gain difference. Both SC–SIC and RS rely on one
SIC when there are two users in the system. Though the
receiver complexity of SC–SIC and RS are the same, RS
achieves explicit performance gain over SC–SIC in most
investigated scenarios. Comparing with MU–LP and SC–
SIC, RS is suited to any channel angles and channel gain
difference.
More results of underloaded two-user deployments with
perfect CSIT are given in Appendix A. We further illustrate
the rate regions of different strategies when SNR is 10 dB.
Comparing the corresponding figures of 10 dB and 20 dB,
we conclude that as SNR increases, the gaps among the rate
regions of different schemes increase, with RS exhibiting
further performance benefits. In all investigated scenarios,
RS always outperforms MU–LP and SC–SIC.
B. Underloaded two-user deployment with imperfect CSIT
Next we investigate the rate region of different transmis-
sion schemes in the presence of imperfect CSIT. We assume
the users are able to estimate the channel perfectly while
the instantaneous channel estimated at the BS is imperfect.
We assume the estimated channel of user-1 and user-2
are h1 = [1, 1, 1, 1]H
and h2 = γ ×[1, ejθ, ej2θ, ej3θ
]Hwhen Nt = 4. For the given channel estimate at the BS,
the channel realization is hk = hk + hk, ∀k ∈ {1, 2},where hk is the estimation error of user-k. hk has i.i.d.
complex Gaussian entries drawn from CN (0, σ2e,k). The
error covariance of user-1 and user-2 are σ2e,1 = P−0.6
t and
σ2e,2 = γP−0.6
t , respectively. The precoders are initialized
and designed using the estimated channels h1, h2 and the
same methods as stated in perfect CSIT scenarios. 1000
different channel error samples are generated for each user.
Each point in the rate region is the average rate14 over the
generated 1000 channels. SNR is fixed to 20 dB.
Fig. 11 and Fig. 12 show the results when γ = 1 and γ =0.3, respectively. Similarly to the results in perfect CSIT, the
gaps between the rate regions of RS and MU–LP reduce as
θ increases in both figures. When θ = 4π9 , the channels of
the two users are sufficiently orthogonal. The rate regions
of RS and MU–LP are almost identical. SC–SIC achieves a
good performance when the channels of users are sufficiently
aligned with enough channel gain difference, as shown in
Fig. 12(a).
Comparing Fig. 11 and Fig. 7, the rate region gap between
RS and MU–LP increases in imperfect CSIT due to the
residual interference introduced. The interference-nulling in
MU–LP is distorted and yields residual interference at the re-
ceiver, which jeopardizes the achievable rate. In contrast, the
rate region gap between RS and SC–SIC slightly reduces in
imperfect CSIT, as observed by comparing Fig. 12 with Fig.
14The readers are referred to [30] for a rigorous discussion about thenotion of average rate.
0 5 10
R1,tot
(bit/s/Hz)
0
2
4
6
8
10
R2,
tot (
bit/s
/Hz)
(a) θ=π/9
0 5 10
R1,tot
(bit/s/Hz)
0
2
4
6
8
10
R2,
tot (
bit/s
/Hz)
(b) θ=2π/9
0 5 10
R1,tot
(bit/s/Hz)
0
2
4
6
8
10
R2,
tot (
bit/s
/Hz)
(c) θ=π/3
RSSC--SICMU--LP
0 5 10
R1,tot
(bit/s/Hz)
0
2
4
6
8
10
R2,
tot (
bit/s
/Hz)
(d) θ=4π/9
Fig. 11: Average rate region comparison of different strate-
gies in imperfect CSIT, γ = 1, Nt = 4, SNR=20 dB.
0 5 10
R1,tot
(bit/s/Hz)
0
2
4
6
R2,
tot (
bit/s
/Hz)
(a) θ=π/9
0 5 10
R1,tot
(bit/s/Hz)
0
2
4
6
R2,
tot (
bit/s
/Hz)
(b) θ=2π/9
0 5 10
R1,tot
(bit/s/Hz)
0
2
4
6
R2,
tot (
bit/s
/Hz)
(c) θ=π/3
RSSC--SICMU--LP
0 5 10
R1,tot
(bit/s/Hz)
0
2
4
6R
2,to
t (bi
t/s/H
z)(d) θ=4π/9
Fig. 12: Average rate region comparison of different strate-
gies in imperfect CSIT, γ = 0.3, Nt = 4, SNR=20 dB.
9. SC–SIC is less sensitive to CSIT inaccuracy comparing
with MU–LP. However, the rate region gap between RS and
SC–SIC is still obvious. In comparison, RS is more flexible
and robust to multi-user interference originating from the
imperfect CSIT, as evidenced by the recent literature on
RS with imperfect CSIT [29]–[35], [39]–[42]. With RS, the
amount of interference decoded by both users (through the
presence of common stream) is adjusted dynamically to the
channel conditions (channel directions and strengths) and
CSIT inaccuracy.
More results of underloaded two-user deployments with
imperfect CSIT are given in Appendix B. The rate regions of
different strategies for varied SNR, Nt and γ are illustrated.
We further show that the performance of RS is stable in a
wide range of parameters, namely number of transmit an-

tennas, user deployments and CSIT inaccuracy. RS achieves
equal or better performance than MU–LP and SC–SIC in all
simulated channels.
C. Underloaded three-user deployment with perfect CSIT
When K = 3, the rate region of each strategy is a
three-dimensional surface. The gaps among rate regions of
different strategies are difficult to display. As each point of
the rate region is derived by solving the WSR problem with
a fixed weight vector u, the WSRs instead of the rate regions
of different transmission strategies are compared in the three-
user case.
Two RS schemes are investigated in three-user deploy-
ments. RS refers to the generalized RS strategy of Sec-
tion IV-B and 1-layer RS refers to the low-complexity RS
strategy of Section IV-D1. We compare the WSR of RS,
1-layer RS, DPC, SC–SIC and MU–LP. The beamforming
initialization of different strategies is extended based on
the methods adopted in the two-user case. There are three
streams of distinct stream orders in RS (1/2/3-order streams).
The precoders of the streams are initialized differently. The
transmit power Pt is divided into three parts α1Pt, α2Pt,
α3Pt for streams of three distinct stream orders, where
α1, α2, α3 ∈ [0, 1] and α1 + α2 + α3 = 1. The precoder
pk, ∀k ∈ {1, 2, 3} of the 1-order stream (private stream)
sk is initialized as pk = pkhk
‖hk‖, where pk = α1Pt
3 is the
allocated power. The precoders p12,p13,p23 of the 2-order
streams are respectively initialized as p12 = p12u12,p13 =p13u13,p23 = p23u23, where p12 = p13 = p23 = α2Pt
3 and
u12 is the largest left singular vector of the channel matrix
H12 = [h1,h2]. Similarly, u13 and u23 are the largest left
singular vectors of the channel matrices H13 = [h1,h3]and H23 = [h2,h3], respectively. The precoder p123 of
the 3-order stream (conventional common stream) s123 is
initialized as p123 = p123u123, where p123 = α3Pt and
u123 is the largest left singular vector of the channel matrix
H123 = [h1,h2,h3]. The beamforming initialization of
1-layer RS is similar as RS except we have p123 and
pk, ∀k ∈ {1, 2, 3} only. By setting α2 = 0, the initialization
of RS is applied to 1-layer RS. To ensure a fair comparison,
the precoders of MU–LP are initialized based on MRT. For
SC–SIC, the precoder of the user decoded first pπ(1) is
initialized as pπ(1) = pπ(1)uπ(1), where pπ(1) = α3Pt and
uπ(1) is the largest left singular vector of the channel matrix
H123 = [h1,h2,h3]. The precoder of the user decoded
secondly pπ(2) is initialized as pπ(2) = pπ(2)uπ(2), where
pπ(2) = α2Pt and uπ(2) is the largest left singular vector
of the channel matrix Hπ(23) = [hπ(2),hπ(3)]. The user
decoded last is initialized based on MRT.
We firstly consider an underloaded scenario. The BS is
equipped with four transmit antennas (Nt = 4) and serves
three single-antenna users in all simulations. The individual
rate constraint is set to 0, Rthk = 0, ∀k ∈ {1, 2, 3}. The
channel of users are realized as
h1 = [1, 1, 1, 1]H ,
h2 = γ1 ×[1, ejθ1 , ej2θ1 , ej3θ1
]H,
h3 = γ2 ×[1, ejθ2 , ej2θ2 , ej3θ2
]H.
(38)
0 10 20 30
SNR (dB)
0
2
4
6
8
Wei
ghte
d S
um R
ate
(bit/
s/H
z)
(a) θ1=π/9, θ
2=2π/9
0 10 20 30
SNR (dB)
0
2
4
6
8
Wei
ghte
d S
um R
ate
(bit/
s/H
z)
(b) θ1=2π/9, θ
2=4π/9
0 10 20 30
SNR (dB)
0
2
4
6
8
10
Wei
ghte
d S
um R
ate
(bit/
s/H
z)
(c) θ1=π/3, θ
2=2π/3
DPCRSSC-SICMU-LP1-layer RS
0 10 20 30
SNR (dB)
0
2
4
6
8
10
Wei
ghte
d S
um R
ate
(bit/
s/H
z)
(d) θ1=4π/9, θ
2=8π/9
Fig. 13: Weighted sum rate versus SNR comparison of
different strategies for underloaded three-user deployment
with perfect CSIT, γ1 = 1, γ2 = 0.3, u1 = 0.2, u2 =0.3, u3 = 0.5, Nt = 4, Rth
k = 0, k ∈ {1, 2, 3}.
0 10 20 30
SNR (dB)
0
2
4
6
8
Wei
ghte
d S
um R
ate
(bit/
s/H
z)
(a) θ1=π/9, θ
2=2π/9
0 10 20 30
SNR (dB)
0
2
4
6
8
10
Wei
ghte
d S
um R
ate
(bit/
s/H
z)
(b) θ1=2π/9, θ
2=4π/9
0 10 20 30
SNR (dB)
0
2
4
6
8
10
Wei
ghte
d S
um R
ate
(bit/
s/H
z)
(c) θ1=π/3, θ
2=2π/3
DPCRSSC-SICMU-LP1-layer RS
0 10 20 30
SNR (dB)
0
2
4
6
8
10
Wei
ghte
d S
um R
ate
(bit/
s/H
z)
(d) θ1=4π/9, θ
2=8π/9
Fig. 14: Weighted sum rate versus SNR comparison of
different strategies for underloaded three-user deployment
with perfect CSIT, γ1 = 1, γ2 = 0.3, u1 = 0.4, u2 =0.3, u3 = 0.3, Nt = 4, Rth
k = 0, k ∈ {1, 2, 3}.
γ1, γ2 and θ1, θ2 are control variables as discussed in the
two-user case. For a given set of γ1, γ2, θ1 adopts value from
θ1 =[π9 ,
2π9 , π
3 ,4π9
]and θ2 = 2θ1. When θ1 = π
9 , θ2 = 2π9 ,
the channels of user-1 and user-2, user-2 and user-3 are
sufficiently aligned. When θ1 = 4π9 , θ2 = 8π
9 , the channels
of user-1 and user-2, user-2 and user-3 are sufficiently
orthogonal. We consider SNRs within the range 0 dB to
30 dB. We assume the sum of the weights allocated to users
is equal to one, i.e., u1 + u2 + u3 = 1.

Fig. 13 and Fig. 14 show the results when the weight
vectors are u = [0.2, 0.3, 0.5] and u = [0.4, 0.3, 0.3],respectively. In both figures, γ1 = 1, γ2 = 0.3. There is a 5
dB channel gain difference between user-1 and user-3 as well
as between user-2 and user-3. In all scenarios and SNRs, RS
always outperforms MU–LP and SC–SIC. Comparing with
Fig. 14, the WSR improvement of RS is more explicit in
Fig. 13. It implies that RS provides better enhancement of
system throughput and user fairness. The performance of
SC–SIC is the worst in most subfigures. This is due to the
underloaded user deployments where Nt > K . One of the
three users are required to decode all the messages and all
the spatial multiplexing gains are sacrificed. Therefore, the
sum DoF of SC–SIC is reduced to 1, resulting in the deteri-
orated performance of SC–SIC in underloaded scenarios. In
comparison, the performance of MU–LP is better than SC–
SIC except in Fig. 14(a). MU–LP is more likely to serve the
users with higher weights and channel gains by turning off
the users with poor weights and channel gains when there is
no individual rate constraints. It cannot deal efficiently with
user fairness when a higher weight is allocated to the user
with weaker channel strength. In contrast, SC–SIC works
better when user fairness is considered. The WSR achieved
by low-complexity 1-layer RS is equal to or larger than that
of MU–LP and SC–SIC in most subfigures. Comparing with
SC–SIC and MU–LP, 1-layer RS is more robust to different
user deployments and only a single SIC is required at each
user. Moreover, the WSR of 1-layer RS is approaching that
of RS in all user deployments. Considering the trade-off
between performance and complexity, 1-layer RS is a good
alternative to RS.
In all three-user deployments of SC–SIC, the decoding
order is required to be optimized together with the precoder.
To investigate the influence of different decoding orders,
we compare the WSRs of SC–SIC using different decoding
orders when u1 = 0.2, u2 = 0.3, u3 = 0.5. There are in total
6 different decoding orders:
SC-SIC order 1: s1 → s2 → s3
SC-SIC order 2: s2 → s1 → s3
SC-SIC order 3: s1 → s3 → s2
SC-SIC order 4: s3 → s1 → s2
SC-SIC order 5: s2 → s3 → s1
SC-SIC order 6: s3 → s2 → s1
In Fig. 15, the WSR of 6 different decoding orders are
illustrated in the circumstance where there is a 5 dB channel
gain difference between user-1/2 and user-3. When γ1 =1, γ2 = 0.3, it is typical to decode the message of user-3
first as the channel gain of user-3 is the worst. However, we
notice that the optimal decoding order in Fig. 15 is order 3,
user-1 is decoded first. This is due to the smallest weight
allocated to user-1, u1 = 0.2. It implies that the weights
assigned to users will affect the optimal decoding order. The
scheduler complexity of SC–SIC becomes extremely high in
order to find the optimal decoding order. In contrast, 1-layer
RS has a much lower scheduling complexity and does not
rely on any user ordering at the transmitter. Moreover, it
only requires a single SIC at each receiver.
0 10 20 30
SNR (dB)
0
1
2
3
4
5
6
Wei
ghte
d S
um R
ate
(bit/
s/H
z)
(a) θ1=π/9, θ
2=2π/9
0 10 20 30
SNR (dB)
0
1
2
3
4
5
6
Wei
ghte
d S
um R
ate
(bit/
s/H
z)
(b) θ1=2π/9, θ
2=4π/9
0 10 20 30
SNR (dB)
0
1
2
3
4
5
6
Wei
ghte
d S
um R
ate
(bit/
s/H
z)
(c) θ1=π/3, θ
2=2π/3
SC-SIC order 1SC-SIC order 2SC-SIC order 3SC-SIC order 4SC-SIC order 5SC-SIC order 6
0 10 20 30
SNR (dB)
0
1
2
3
4
5
Wei
ghte
d S
um R
ate
(bit/
s/H
z)
(d) θ1=4π/9, θ
2=8π/9
Fig. 15: Weighted sum rate versus SNR comparison of
different decoding order of SC–SIC for underloaded three-
user deployment with perfect CSIT, γ1 = 1, γ2 = 0.3, u1 =0.2, u2 = 0.3, u3 = 0.5, Nt = 4, Rth
k = 0, k ∈ {1, 2, 3}.
More results of underloaded three-user deployments with
perfect CSIT and imperfect CSIT are given in Appendix
C and Appendix E, respectively. The WSRs of different
strategies for varied SNR, Nt, γ1, γ2 and u are illustrated.
In all figures, RS outperforms SC–SIC and MU–LP. Though
the scheduler and receiver complexity of 1-layer RS is low,
it achieves equal or better performance than SC–SIC and
MU–LP in most figures of perfect CSIT and all figures of
imperfect CSIT. All forms of RS are robust to a wide range
of CSIT inaccuracy, channel gain difference and channel
angles among users.
D. Overloaded three-user deployment with perfect CSIT
1) Two transmit antenna deployment: We first consider
an overloaded scenario where the BS is equipped with
two antennas (Nt = 2), and serves three single-antenna
users. The channel realizations and beamforming initializa-
tion follows the methods used in the underloaded three-user
deployment. The channel of users are realized as h1 =
[1, 1]H
, h2 = γ1 ×[1, ejθ1
]Hand h3 = γ2 ×
[1, ejθ2
]H.
In overloaded scenarios, to guarantee some QoS, we add
individual rate constraints to users as the system has other-
wise a tendency to turn off some users. In all simulations
of two transmit antenna deployment, we assume the rate
threshold of each user is equal Rth1 = Rth
2 = Rth3 . Since
the BS is able to serve users with higher QoS require-
ments as SNR increases, the rate threshold is assumed
to increase with SNR. The rate threshold increases as
rth = [0.02, 0.08, 0.19, 0.3, 0.4, 0.4, 0.4] bit/s/Hz for SNR =[0, 5, 10, 15, 20, 25, 30] dBs.
We compare the performance of RS, 1-layer RS, SC–SIC,
MU–LP and SC–SIC per group in the overloaded three-
user deployment. In SC–SIC per group, we consider a fixed

0 10 20 30
SNR (dB)
0
1
2
3
4
5
6W
eigh
ted
Sum
Rat
e (b
it/s/
Hz)
(a) θ1=π/9, θ
2=2π/9
0 10 20 30
SNR (dB)
0
1
2
3
4
5
6
Wei
ghte
d S
um R
ate
(bit/
s/H
z)
(b) θ1=2π/9, θ
2=4π/9
0 10 20 30
SNR (dB)
0
1
2
3
4
5
6
7
Wei
ghte
d S
um R
ate
(bit/
s/H
z)
(c) θ1=π/3, θ
2=2π/3
RSSC-SICMU-LP1-layer RSSC-SIC per group
0 10 20 30
SNR (dB)
0
1
2
3
4
5
6
7
Wei
ghte
d S
um R
ate
(bit/
s/H
z)(d) θ
1=4π/9, θ
2=8π/9
Fig. 16: Weighted sum rate versus SNR comparison of differ-
ent strategies for overloaded three-user deployment with per-
fect CSIT, γ1 = 1, γ2 = 0.3, u1 = 0.4, u2 = 0.3, u3 = 0.3,
Nt = 2, rth = [0.02, 0.08, 0.19, 0.3, 0.4, 0.4, 0.4] bit/s/Hz.
grouping method. We assume user-1 is in group 1 while
user-2 and user-3 are in group 2. The decoding order will
be optimized together with the precoder. The beamforming
initialization of SC–SIC per group is different from SC–SIC.
In group 1, the precoder of user-1 is initialized based on
MRT. In group 2, the precoder of the user decoded first pπ(1)
is initialized as pπ(1) = pπ(1)uπ(1) and uπ(1) is the largest
left singular vector of the channel matrix H23 = [h2,h3].The precoder of the user decoded secondly is initialized
based on MRT.
RS exhibits a clear WSR gain over SC–SIC, SC–SIC per
group and MU–LP in Fig. 16, where γ1 = 1, γ2 = 0.3and u = [0.4, 0.3, 0.3]. The WSR of MU–LP deterio-
rates in such overloaded scenario. When the individual rate
constraints are not zero and Nt < K , MU–LP cannot
coordinate the multi-user interference coming from all the
users served simultaneously. When the angles of channels
are large enough (subfigure (c) and subfigure (d) of Fig.
16), the WSR of SC–SIC per group is better than SC–SIC.
This is due to its ability to combine treating interference
as noise (to tackle inter-group interference) with decoding
interference (to tackle intra-group interference). However,
as the angles of channels decreases, the performance of
SC–SIC becomes better while that of SC–SIC per group
is worse. Whether SC–SIC outperforms SC–SIC per group
depends on SNR and user deployments. To ensure the WSR
of the NOMA system is maximized, a joint optimization
of NOMA strategies based on switching between SC–SIC
and SC–SIC per group on top of deciding the user grouping
and user ordering is required. Such switching method has
high scheduler and receiver complexity while its achieved
performance is still lower than the simple 1-layer RS in most
user deployments.
0 5 10 15 20 25 30
SNR (dB)
0
1
2
3
4
5
6
Wei
ghte
d S
um R
ate
(bit/
s/H
z)
σ12=1, σ
22=0.3, σ
32=0.1
SC-SIC, u1=0.2, u
2=0.3, u
3=0.5
1-layer RS, u1=0.2, u
2=0.3, u
3=0.5
SC-SIC, u1=0.4, u
2=0.3, u
3=0.3
1-layer RS, u1=0.4, u
2=0.3, u
3=0.3
SC-SIC, u1=0.6, u
2=0.3, u
3=0.1
1-layer RS, u1=0.6, u
2=0.3, u
3=0.1
Fig. 17: Weighted sum rate versus SNR comparison of
different strategies for overloaded three-user deployment
with perfect CSIT, σ21 = 1, σ2
2 = 0.3, σ23 = 0.1, Nt = 1,
rth = [0, 0, 0.01, 0.03, 0.1, 0.2, 0.3] bit/s/Hz.
2) Single transmit antenna deployment: In a SISO BC,
there is no need to split the messages into common and
private parts since the capacity region is achieved by SC–
SIC. Nevertheless, in view of the benefit of 1-layer RS in
the MISO BC, we may wonder whether RS can be of any
help in a SISO BC, especially when it comes to reducing the
complexity of the receivers and the number of SIC needed.
We therefore compare the performance of 1-layer RS with
SC–SIC in a 3-user SISO BC. We note that SC–SIC requires
2 layers of SIC while 1-layer RS requires a single SIC for
all users. The channel of each user hk has an i.i.d. complex
Gaussian entry with a certain variance, i.e., CN (0, σ2k). Fig.
17 shows the average WSRs of different strategies over 10
random channel realizations when σ21 = 1, σ2
2 = 0.3, σ23 =
0.1. 1-layer RS is able to achieve very close performance
to SC–SIC. Comparing with SC–SIC, the complexity of 1-
layer RS is much reduced. There is no ordering issue at
the BS and only one SIC is required at each user. Jointly
considering the performance and complexity of the system,
1-layer RS is an attractive alternative to SC–SIC.
More results of overloaded three-user deployments with
perfect CSIT and imperfect CSIT are given in Appendix
D and Appendix F, respectively. The WSRs of different
strategies for varied SNR, Nt, γ1, γ2 and u are illustrated.
We further show that RS exhibits a clear WSR gain over
SC–SIC, SC–SIC per group and MU–LP in all simulated
channels and weights. 1-layer RS outperforms SC–SIC, SC–
SIC per group and MU–LP in most simulated scenarios. It
is more robust and achieves a nearly equivalent WSR to that
of RS in all user deployments. We also show that 1-layer
RS achieves near optimal performance in various channel
conditions of SISO BC.
E. Overloaded four-user deployment with perfect CSIT
We further investigate the four-user system model shown
in Fig. 4, where user-1 and user-2 are in group 1 while
user-3 and user-4 are in group 2. We compare the 2-layer

HRS, 1-layer RS per group, 1-layer RS, SC–SIC per group
and MU–LP. In 2-layer HRS, the intra-group interference
is mitigated using the intra-group common streams s12, s34and the inter-group interference is mitigated using the inter-
group common stream s1234. 1-layer RS and 1-layer RS per
group are two special strategies of 2-layer HRS. All users
in 1-layer RS are treated as single group. Only the 4-order
common stream s1234 and 1-order private streams are active.
No power is allocated to s12 and s34. In contrast, 1-layer RS
per group only allocate power to the intra-group common
stream s12, s34 and 1-order private streams. No power is
allocated to the inter-group common stream s1234. Users
within each group are served using RS and users across
groups are served using SDMA so as to mitigate the inter-
group interference.
We consider an overloaded scenario. The BS is equipped
with two antennas and serves four single-antenna users. The
channel of users are realized as
h1 = [1, 1]H,
h2 = γ1 ×[1, ejθ1
]H,
h3 = γ2 ×[1, ejθ2
]H,
h4 = γ3 ×[1, ejθ3
]H.
(39)
γ1, γ2, γ3 and θ1, θ2, θ3 are control variables. θ1 is the
channel angle between user-1 and user-2. It is denoted as
intra-group angle of group 1. θ2 is the channel angle between
user-1 and user-2. θ2 − θ1 is the channel angle between
user-2 and user-3, denoted as inter-group angle. θ3 is the
channel angle between user-1 and user-3. θ3 − θ2 is the
channel angle between user-3 and user-4. It is the intra-
group angle of group 2. In the following, we assume the
intra-group angle of group 1 is the same as that of group 2.
We have θ3 = θ1 + θ2. In each figure, the intra-group angle
is varied as θ1 =[0, π
18 ,π9 ,
π6
]. The individual rate constraint
is set to rth = [0.03, 0.1, 0.2, 0.3, 0.4, 0.4, 0.4] bit/s/Hz for
SNR = [0, 5, 10, 15, 20, 25, 30] dBs. The weights of users
are assumed to be equal, i.e., u1 = u2 = u3 = u4 = 0.25.
We also assume the channel gain difference within each
group is equal. The channel gain of user-3 is equal to that
of user-1 (γ2 = 1) and the channel gain of user-4 is equal
to that of user-2 (γ3 = γ1).
Fig. 18 and Fig. 19 show the results when γ1 = 0.3.
The inter-group angles are π9 and π
3 , respectively. The WSR
achieved by 2-layer HRS is equal to 1-layer RS in both
figures, which means that 2-layer HRS reduces to 1-layer
RS in these user deployments. 2-layer HRS and 1-layer RS
outperform all other schemes. The inter-group and intra-
group interference can be jointly mitigated by one layer
common message. As the inter-group angle increases, the
WSR gaps between 2-layer HRS and 1-layer RS per group
reduces. The inter-group interference can be coordinated by
SDMA when the inter-group angle is sufficiently large. 1-
layer RS per group has the same WSR as SC–SIC per group
in both figures. It reduces to SC–SIC per group because
SC–SIC is more suitable when the intra-group angle is
sufficiently small and the channel gain difference between
users within each group is sufficiently large.
0 10 20 30
SNR (dB)
0
0.5
1
1.5
2
2.5
3
3.5
Wei
ghte
d S
um R
ate
(bit/
s/H
z)
(a) θ1=0
0 10 20 30
SNR (dB)
0
1
2
3
4
Wei
ghte
d S
um R
ate
(bit/
s/H
z)
(b) θ1=π/18
0 10 20 30
SNR (dB)
0
1
2
3
4
Wei
ghte
d S
um R
ate
(bit/
s/H
z)
(c) θ1=π/9
2-layer HRSSC-SIC per groupMU-LP1-layer RS per group1-layer RS
0 10 20 30
SNR (dB)
0
1
2
3
4
Wei
ghte
d S
um R
ate
(bit/
s/H
z)
(d) θ1=π/6
Fig. 18: Weighted sum rate versus SNR comparison of
different strategies for overloaded four-user deployment
with perfect CSIT, γ1 = 0.3, θ2 = θ1 + π9 , rth =
[0.03, 0.1, 0.2, 0.3, 0.4, 0.4, 0.4] bit/s/Hz.
0 5 10 15 20 25 30
SNR (dB)
0
1
2
3
4
5
Wei
ghte
d S
um R
ate
(bit/
s/H
z)
(a) θ1=0
0 5 10 15 20 25 30
SNR (dB)
0
1
2
3
4
5
Wei
ghte
d S
um R
ate
(bit/
s/H
z)
(b) θ1=π/9
0 5 10 15 20 25 30
SNR (dB)
0
1
2
3
4
5
Wei
ghte
d S
um R
ate
(bit/
s/H
z)
(c) θ1=2π/9
2-layer HRSSC-SIC per groupMU-LP1-layer RS per group1-layer RS
0 5 10 15 20 25 30
SNR (dB)
0
1
2
3
4
5
Wei
ghte
d S
um R
ate
(bit/
s/H
z)
(d) θ1=π/3
Fig. 19: Weighted sum rate versus SNR comparison of
different strategies for overloaded four-user deployment
with perfect CSIT, γ1 = 0.3, θ2 = θ1 + π3 , rth =
[0.03, 0.1, 0.2, 0.3, 0.4, 0.4, 0.4] bit/s/Hz.
More results of overloaded four-user deployments with
perfect CSIT are given in Appendix G. The WSRs of
different strategies when there is no channel gain difference
(γ1 = 1) are illustrated. We further show that 2-layer HRS,
1-layer RS and 1-layer RS per group achieve equal or better
performance than SC–SIC per group and MU–LP in all
simulated channel conditions.
F. Overloaded ten-user deployment with perfect CSIT
We further consider an extremely overloaded scenario
subject to QoS constraints. The BS is equipped with two

0 5 10 15 20 25 30
SNR (dB)
0
5
10
15
20
Wei
ghte
d S
um R
ate
(bit/
s/H
z)
1-layer RSSC-SICMU-LPmulticast
Fig. 20: Weighted sum rate versus SNR comparison of
different strategies for overloaded ten-user deployment with
perfect CSIT, σ21 = σ2
2 = . . . = σ210 = 1, Nt = 2, SNR=30
dB, rth = [0.01, 0.03, 0.05, 0.1, 0.1, 0.1, 0.1] bit/s/Hz.
antennas (Nt = 2) and serves 10 users. The channel of each
user hk has i.i.d. complex Gaussian entries with a certain
variance, i.e., CN (0, σ2k). The rate of each user is averaged
over the 10 randomly generated channels. We compare 1-
layer RS, MU–LP, multicast and SC–SIC with a certain
decoding order. There are 10! different decoding orders of
SC–SIC in the ten-user case. The optimal decoding order
of SC–SIC is intractable. In the following simulations, only
the decoding order based on the ascending channel gain is
considered for WSR calculation in SC–SIC. It is the optimal
decoding order in SISO BC. Multicast can be regarded as a
special scheme of 1-layer RS with only the 10-order stream
to be transmitted to all users. The weight of each user is
assumed to be equal to 1.
Fig. 20 shows the WSRs of different strategies
when σ21 = σ2
2 = . . . = σ210 = 1, rth =
[0.01, 0.03, 0.05, 0.1, 0.1, 0.1, 0.1] bit/s/Hz. The WSR
achieved by the multicast scheme is the worst. In such
an overloaded user deployment, the spectral efficiency of
multicast is low as it is difficult for a single beamformer to
satisfy all users. Under the rate constraint rth, the WSR of
SC–SIC is better than that of MU–LP while the slopes of the
WSRs are the same for large SNRs. It implies that SC–SIC
and MU–LP achieve the same DoF of 1. In contrast, 1-layer
RS shows an obvious WSR improvement over all other
strategies and exhibits a DoF of 2. This highlights the RS
exploits the maximum DoF of the considered deployments
(that is limited by 2 given the 2 transmit antennas). To
further investigate the reason behind the results, we focus
on one random channel realization. The WSRs achieved by
all strategies when SNR=30 dB are compared as shown in
Fig. 21. The optimized common rate vector of one-layer
RS is c = [0, 0.1, 0.1, 0.1, 0, 0.1, 0.1, 0.1, 0.1, 0.1] bit/s/Hz.
No common rate is allocated to user-1 and user-5. But in
Fig. 21, we can observe that the rate allocated to user-1 and
1 2 3 4 5 6 7 8 9 10
users
10-2
10-1
100
101
102
Indi
vidu
al R
ate
(bit/
s/H
z) 1-layer RSSC-SICMU-LPmulticast
Fig. 21: Individual rate comparison of different strategies
for overloaded ten-user deployment with perfect CSIT for 1
randomly generated channel estimate, SNR=30 dB, Nt = 2,
rth = [0.01, 0.03, 0.05, 0.1, 0.1, 0.1, 0.1] bit/s/Hz.
user-5 are the highest. It implies that RS uses the common
message to pack messages from eight users and uses two
transmit antennas to deliver private messages to user-1 and
user-5. RS achieves a sum DoF of 2 in the overloaded
regime. In contrast, MU–LP and SC–SIC allocate most of
power to single user. The rate achieved by user-5 when
using MU–LP and the rate achieved by user-10 when using
SC–SIC is much higher than other users in Fig. 21. The
DoFs achieved by MU–LP and SC–SIC are limited to 1 in
such circumstance.
Note that results here show the usefulness of the RS
framework for massive IoT or MTC services. Those devices
are typically cheap. In the example above, user-1 and user-
5 could be high-end devices, for which RS would be
implemented. Those devices would therefore perform SIC.
All other devices could be IoT or MTC devices, who would
not need to implement RS, nor SIC, but simply decode the
common message. Hence the RS framework can be used to
pack the IoT/MTC traffic in the common message.
More results of overloaded ten-user deployments with
perfect CSIT are given in Appendix H. We further illustrate
WSRs of different strategies when the rate threshold rthand channel gain difference are changed. We show that the
when the rate threshold of each user is 0, MU–LP is able to
achieve a DoF of 2. However, as the rate threshold increases,
MU–LP cannot coordinate the inter-user interference and
its achieved DoF drops to 1. In the extremely overloaded
scenario, the WSR gap between RS and SC–SIC is still large.
SC–SIC makes an inefficient use of the transmit antennas
and achieves a DoF of 1.
VI. CONCLUSIONS AND FUTURE WORKS
To conclude, we propose a new multiple access called
Rate-Splitting Multiple Access (RSMA). We compare the
proposed RSMA with SDMA and NOMA by solving the
problem of maximizing WSR in MISO-BC systems with
QoS constraints. Both perfect and imperfect CSIT are inves-
tigated. WMMSE and its modified algorithms are adopted
to solve the respective optimization problems. We show
that SDMA and NOMA are subject to many limitations,
including high system complexity and a lack of robustness
to user deployments, network load and CSIT inaccuracy.
We propose a general multiple access framework based on

rate-splitting (RS), where the common symbols decoded by
different groups of users are transmitted on top of private
symbols decoded by the corresponding users only. Thanks
to its ability of partially decoding interference and partially
treating interference as noise, RSMA softly bridges and
outperforms SDMA and NOMA in any user deployments,
CSIT inaccuracy and network load. The simplified RS forms,
such as 1-layer RS and 2-layer HRS, show great potential to
reduce the scheduler and receiver complexity but maintain
good and robust performance in any user deployments, CSIT
inaccuracy and network load. Particularly, we show that 1-
layer RS is an attractive alternative to SC–SIC in a SISO
BC deployment due to its near optimal performance and
very low complexity. Therefore, RSMA is a more general
and powerful multiple access for downlink multi-antenna
systems that encompasses SDMA and NOMA as special
cases.
RSMA has the potential to change the design of the
physical layer and MAC layer of next generation com-
munication systems by unifying existing approaches and
relying on a superposed transmission of common and
private messages. Many interesting problems are left for
future research, including among others the role played
by RSMA to achieve the fundamental limits of broad-
cast, interference and relay channels in the presence of
imperfect CSIT and disparity of channel strengths, opti-
mization (robust design, sum-rate maximization, max-min
fairness, QoS constraints) of RSMA, performance analysis
of RSMA, RSMA design for multi-user/Massive/Millimeter-
wave/multi-cell/network MIMO, modulation and coding for
RSMA, RSMA with multi-carrier transmissions, RSMA
with/vs. non-linear precoding, resource allocation and cross-
layer design of RSMA, security provisioning in RSMA,
RSMA design for cellular and satellite communication net-
works, prototyping and experimentation of RSMA, stan-
dardization issues (link/system-level evaluations, receiver
implementation, transmission schemes/modes, CSI feedback
mechanisms, downlink and uplink signaling) of RSMA.
APPENDIX
A. Underloaded two-user deployment with perfect CSIT
To further investigate the influence of SNR, we illustrate
the rate region of different strategies when SNR is 10 dB
in Fig. 22–25 and compare with the results when SNR is
20 dB in Fig. 7–10. Comparing the corresponding figures
of 10 dB and 20 dB, we observe that the rate region gaps
among different schemes grow with SNR. As SNR increases,
the performance improvement of RS becomes more obvious.
Specifically, SC–SIC and MU–LP outperform each other at
one part of the rate region in Fig. 9(b) and Fig. 10(d) and the
rate region of RS encompasses the convex hull of the rate
regions of SC–SIC and MU–LP. However, as SNR decreases
to 10 dB, the crosspoints disappear in Fig. 24(b) and Fig.
25(d). The rate regions of SC–SIC overlap with that of RS.
RS reduces to SC–SIC and they outperform MU–LP in the
whole rate region.
0 2 4 6
R1,tot
(bit/s/Hz)
0
1
2
3
4
5
6
R2,
tot (
bit/s
/Hz)
(a) θ=π/9
0 2 4 6
R1,tot
(bit/s/Hz)
0
1
2
3
4
5
6
R2,
tot (
bit/s
/Hz)
(b) θ=2π/9
0 2 4 6
R1,tot
(bit/s/Hz)
0
1
2
3
4
5
6
R2,
tot (
bit/s
/Hz)
(c) θ=π/3
DPCRSSC-SICMU-LP
0 2 4 6
R1,tot
(bit/s/Hz)
0
1
2
3
4
5
6
R2,
tot (
bit/s
/Hz)
(d) θ=4π/9
Fig. 22: Achievable rate region comparison of different
strategies in underloaded two-user deployment with perfect
CSIT, γ = 1, Nt = 4, SNR=10 dB.
0 1 2 3 4 5
R1,tot
(bit/s/Hz)
0
1
2
3
4
5
R2,
tot (
bit/s
/Hz)
(a) θ=π/9
0 1 2 3 4 5
R1,tot
(bit/s/Hz)
0
1
2
3
4
5
R2,
tot (
bit/s
/Hz)
(b) θ=2π/9
0 1 2 3 4 5
R1,tot
(bit/s/Hz)
0
1
2
3
4
5
R2,
tot (
bit/s
/Hz)
(c) θ=π/3
DPCRSSC-SICMU-LP
0 1 2 3 4 5
R1,tot
(bit/s/Hz)
0
1
2
3
4
5
R2,
tot (
bit/s
/Hz)
(d) θ=4π/9
Fig. 23: Achievable rate region comparison of different
strategies in underloaded two-user deployment with perfect
CSIT, γ = 1, Nt = 2, SNR=10 dB.
B. Underloaded two-user deployment with imperfect CSIT
To further study the influence of CSIT inaccuracy, SNR,
number of transmit antennas and user deployments, we
illustrate the rate region of different strategies when SNR,
Nt and γ are varied in Fig. 26–31.
Fig. 26 and Fig. 27 show the corresponding results of
Fig. 11 and Fig. 12 when SNR decreases to 10 dB. The rate
region gaps among users decreases when SNR decreases.
Fig. 28 and Fig. 29 show the results when γ = 1, Nt = 2.
When SNR is 10 dB, the rate regions of the three schemes
are very close to each other. When SNR is 20 dB, the

0 2 4 6
R1,tot
(bit/s/Hz)
0
0.5
1
1.5
2
2.5
R2,
tot (
bit/s
/Hz)
(a) θ=π/9
0 2 4 6
R1,tot
(bit/s/Hz)
0
0.5
1
1.5
2
2.5
R2,
tot (
bit/s
/Hz)
(b) θ=2π/9
0 2 4 6
R1,tot
(bit/s/Hz)
0
0.5
1
1.5
2
2.5
R2,
tot (
bit/s
/Hz)
(c) θ=π/3
DPCRSSC-SICMU-LP
0 2 4 6
R1,tot
(bit/s/Hz)
0
0.5
1
1.5
2
2.5
R2,
tot (
bit/s
/Hz)
(d) θ=4π/9
Fig. 24: Achievable rate region comparison of different
strategies in perfect CSIT, γ = 0.3, Nt = 4, SNR=10 dB.
0 1 2 3 4 5
R1,tot
(bit/s/Hz)
0
0.5
1
1.5
R2,
tot (
bit/s
/Hz)
(a) θ=π/9
0 1 2 3 4 5
R1,tot
(bit/s/Hz)
0
0.5
1
1.5
R2,
tot (
bit/s
/Hz)
(b) θ=2π/9
0 1 2 3 4 5
R1,tot
(bit/s/Hz)
0
0.5
1
1.5
R2,
tot (
bit/s
/Hz)
(c) θ=π/3
DPCRSSC-SICMU-LP
0 1 2 3 4 5
R1,tot
(bit/s/Hz)
0
0.5
1
1.5
R2,
tot (
bit/s
/Hz)
(d) θ=4π/9
Fig. 25: Achievable rate region comparison of different
strategies in perfect CSIT, γ = 0.3, Nt = 2, SNR=10 dB.
rate region of RS shows explicit improvement over the rate
regions of MU–LP and SC–SIC. Comparing Fig. 29 with
Fig. 8, the performance of MU–LP is worse when CSIT
is imperfect. It shows that MU–LP requires accurate CSIT
to design precoders. There is no crosspoint between SC–
SIC and MU–LP in Fig. 27(c) and Fig. 12(b) compared
respectively with Fig. 24(c) and Fig. 9(b).
Fig. 30 and Fig. 31 show the results when γ = 0.3. SNR is
10 dB and 20 dB, respectively. The rate region gap between
RS and SC–SIC reduces in imperfect CSIT, as observed by
comparing Fig. 31 with Fig. 10. Comparing with MU–LP,
SC–SIC is less sensitive to CSIT inaccuracy.
0 2 4 6
R1,tot
(bit/s/Hz)
0
1
2
3
4
5
6
R2,
tot (
bit/s
/Hz)
(a) θ=π/9
0 2 4 6
R1,tot
(bit/s/Hz)
0
1
2
3
4
5
6
R2,
tot (
bit/s
/Hz)
(b) θ=2π/9
0 2 4 6
R1,tot
(bit/s/Hz)
0
1
2
3
4
5
6
R2,
tot (
bit/s
/Hz)
(c) θ=π/3
RSSC--SICMU--LP
0 2 4 6
R1,tot
(bit/s/Hz)
0
1
2
3
4
5
6
R2,
tot (
bit/s
/Hz)
(d) θ=4π/9
Fig. 26: Average rate region comparison of different strate-
gies in imperfect CSIT, γ = 1, Nt = 4, SNR=10 dB.
0 2 4 6
R1,tot
(bit/s/Hz)
0
0.5
1
1.5
2
2.5
R2,
tot (
bit/s
/Hz)
(a) θ=π/9
0 2 4 6
R1,tot
(bit/s/Hz)
0
0.5
1
1.5
2
2.5
R2,
tot (
bit/s
/Hz)
(b) θ=2π/9
0 2 4 6
R1,tot
(bit/s/Hz)
0
0.5
1
1.5
2
2.5
R2,
tot (
bit/s
/Hz)
(c) θ=π/3
RSSC--SICMU--LP
0 2 4 6
R1,tot
(bit/s/Hz)
0
0.5
1
1.5
2
2.5
R2,
tot (
bit/s
/Hz)
(d) θ=4π/9
Fig. 27: Average rate region comparison of different strate-
gies in imperfect CSIT, γ = 0.3, Nt = 4, SNR=10 dB.
C. Underloaded three-user deployment with perfect CSIT
We consider three different sets of γ1, γ2. When γ1 =γ2 = 1, the three users have no channel strength difference.
When γ1 = 1, γ2 = 0.3, there is a 5 dB channel strength
difference between user-1 and user-3 as well as between
user-2 and user-3. When γ1 = 0.3, γ2 = 0.1, there is
a 5 dB channel strength difference between user-1 and
user-2 as well as user-2 and user-3. The channel strength
difference between user-1 and user-3 is 10 dB. We consider
three different weight vectors for each set of γ1, γ2, i.e.,
u = [0.2, 0.3, 0.5], u = [0.4, 0.3, 0.3] and u = [0.6, 0.3, 0.1].
In all figures (Fig. 32–38), the WSR of RS is equal to
or better than that of MU–LP and SC–SIC. Considering
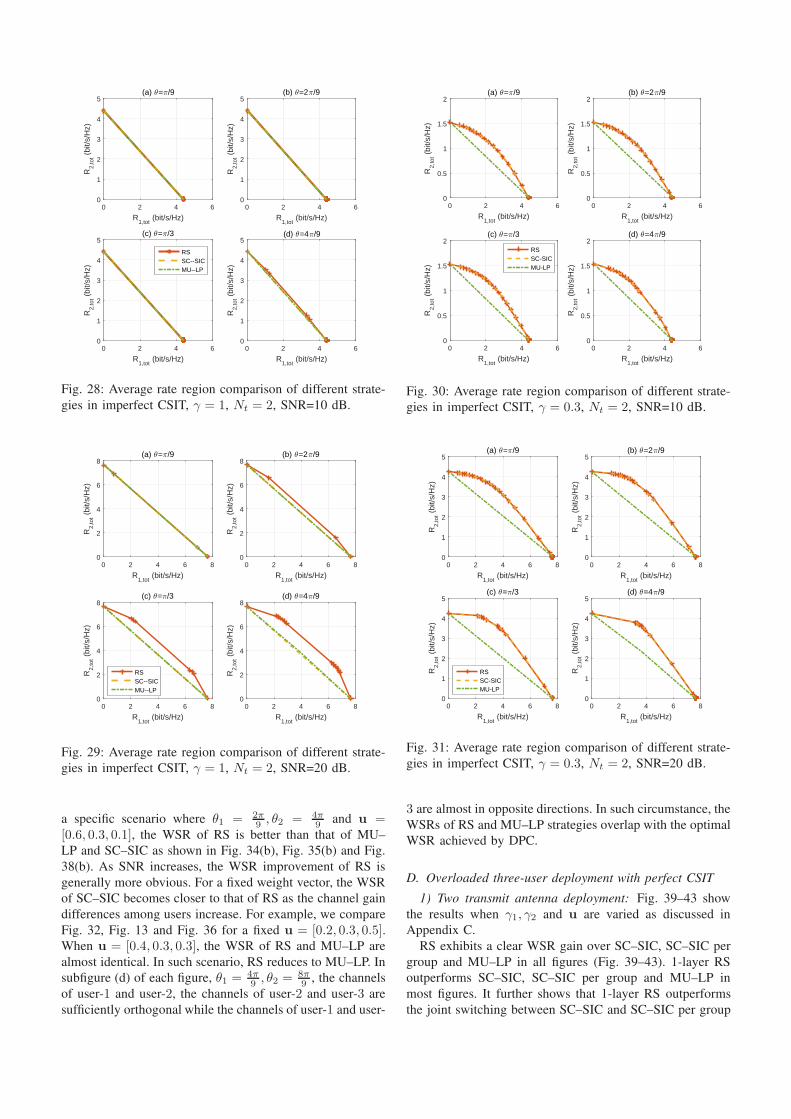
0 2 4 6
R1,tot
(bit/s/Hz)
0
1
2
3
4
5
R2,
tot (
bit/s
/Hz)
(a) θ=π/9
0 2 4 6
R1,tot
(bit/s/Hz)
0
1
2
3
4
5
R2,
tot (
bit/s
/Hz)
(b) θ=2π/9
0 2 4 6
R1,tot
(bit/s/Hz)
0
1
2
3
4
5
R2,
tot (
bit/s
/Hz)
(c) θ=π/3
RSSC--SICMU--LP
0 2 4 6
R1,tot
(bit/s/Hz)
0
1
2
3
4
5
R2,
tot (
bit/s
/Hz)
(d) θ=4π/9
Fig. 28: Average rate region comparison of different strate-
gies in imperfect CSIT, γ = 1, Nt = 2, SNR=10 dB.
0 2 4 6 8
R1,tot
(bit/s/Hz)
0
2
4
6
8
R2,
tot (
bit/s
/Hz)
(a) θ=π/9
0 2 4 6 8
R1,tot
(bit/s/Hz)
0
2
4
6
8
R2,
tot (
bit/s
/Hz)
(b) θ=2π/9
0 2 4 6 8
R1,tot
(bit/s/Hz)
0
2
4
6
8
R2,
tot (
bit/s
/Hz)
(c) θ=π/3
RSSC--SICMU--LP
0 2 4 6 8
R1,tot
(bit/s/Hz)
0
2
4
6
8
R2,
tot (
bit/s
/Hz)
(d) θ=4π/9
Fig. 29: Average rate region comparison of different strate-
gies in imperfect CSIT, γ = 1, Nt = 2, SNR=20 dB.
a specific scenario where θ1 = 2π9 , θ2 = 4π
9 and u =[0.6, 0.3, 0.1], the WSR of RS is better than that of MU–
LP and SC–SIC as shown in Fig. 34(b), Fig. 35(b) and Fig.
38(b). As SNR increases, the WSR improvement of RS is
generally more obvious. For a fixed weight vector, the WSR
of SC–SIC becomes closer to that of RS as the channel gain
differences among users increase. For example, we compare
Fig. 32, Fig. 13 and Fig. 36 for a fixed u = [0.2, 0.3, 0.5].When u = [0.4, 0.3, 0.3], the WSR of RS and MU–LP are
almost identical. In such scenario, RS reduces to MU–LP. In
subfigure (d) of each figure, θ1 = 4π9 , θ2 = 8π
9 , the channels
of user-1 and user-2, the channels of user-2 and user-3 are
sufficiently orthogonal while the channels of user-1 and user-
0 2 4 6
R1,tot
(bit/s/Hz)
0
0.5
1
1.5
2
R2,
tot (
bit/s
/Hz)
(a) θ=π/9
0 2 4 6
R1,tot
(bit/s/Hz)
0
0.5
1
1.5
2
R2,
tot (
bit/s
/Hz)
(b) θ=2π/9
0 2 4 6
R1,tot
(bit/s/Hz)
0
0.5
1
1.5
2
R2,
tot (
bit/s
/Hz)
(c) θ=π/3
RSSC-SICMU-LP
0 2 4 6
R1,tot
(bit/s/Hz)
0
0.5
1
1.5
2
R2,
tot (
bit/s
/Hz)
(d) θ=4π/9
Fig. 30: Average rate region comparison of different strate-
gies in imperfect CSIT, γ = 0.3, Nt = 2, SNR=10 dB.
0 2 4 6 8
R1,tot
(bit/s/Hz)
0
1
2
3
4
5
R2,
tot (
bit/s
/Hz)
(a) θ=π/9
0 2 4 6 8
R1,tot
(bit/s/Hz)
0
1
2
3
4
5
R2,
tot (
bit/s
/Hz)
(b) θ=2π/9
0 2 4 6 8
R1,tot
(bit/s/Hz)
0
1
2
3
4
5
R2,
tot (
bit/s
/Hz)
(c) θ=π/3
RSSC-SICMU-LP
0 2 4 6 8
R1,tot
(bit/s/Hz)
0
1
2
3
4
5
R2,
tot (
bit/s
/Hz)
(d) θ=4π/9
Fig. 31: Average rate region comparison of different strate-
gies in imperfect CSIT, γ = 0.3, Nt = 2, SNR=20 dB.
3 are almost in opposite directions. In such circumstance, the
WSRs of RS and MU–LP strategies overlap with the optimal
WSR achieved by DPC.
D. Overloaded three-user deployment with perfect CSIT
1) Two transmit antenna deployment: Fig. 39–43 show
the results when γ1, γ2 and u are varied as discussed in
Appendix C.
RS exhibits a clear WSR gain over SC–SIC, SC–SIC per
group and MU–LP in all figures (Fig. 39–43). 1-layer RS
outperforms SC–SIC, SC–SIC per group and MU–LP in
most figures. It further shows that 1-layer RS outperforms
the joint switching between SC–SIC and SC–SIC per group

0 10 20 30
SNR (dB)
0
2
4
6
8
10
Wei
ghte
d S
um R
ate
(bit/
s/H
z)(a) θ
1=π/9, θ
2=2π/9
0 10 20 30
SNR (dB)
0
2
4
6
8
10
Wei
ghte
d S
um R
ate
(bit/
s/H
z)
(b) θ1=2π/9, θ
2=4π/9
0 10 20 30
SNR (dB)
0
2
4
6
8
10
12
Wei
ghte
d S
um R
ate
(bit/
s/H
z)
(c) θ1=π/3, θ
2=2π/3
DPCRSSC-SICMU-LP1-layer RS
0 10 20 30
SNR (dB)
0
2
4
6
8
10
12
Wei
ghte
d S
um R
ate
(bit/
s/H
z)(d) θ
1=4π/9, θ
2=8π/9
Fig. 32: Weighted sum rate versus SNR comparison of dif-
ferent strategies for underloaded three-user deployment with
perfect CSIT, γ1 = γ2 = 1, u1 = 0.2, u2 = 0.3, u3 = 0.5,
Nt = 4, Rthk = 0, k ∈ {1, 2, 3}.
0 10 20 30
SNR (dB)
0
2
4
6
8
Wei
ghte
d S
um R
ate
(bit/
s/H
z)
(a) θ1=π/9, θ
2=2π/9
0 10 20 30
SNR (dB)
0
2
4
6
8
10
Wei
ghte
d S
um R
ate
(bit/
s/H
z)
(b) θ1=2π/9, θ
2=4π/9
0 10 20 30
SNR (dB)
0
2
4
6
8
10
12
Wei
ghte
d S
um R
ate
(bit/
s/H
z)
(c) θ1=π/3, θ
2=2π/3
DPCRSSC-SICMU-LP1-layer RS
0 10 20 30
SNR (dB)
0
2
4
6
8
10
12
Wei
ghte
d S
um R
ate
(bit/
s/H
z)
(d) θ1=4π/9, θ
2=8π/9
Fig. 33: Weighted sum rate versus SNR comparison of dif-
ferent strategies for underloaded three-user deployment with
perfect CSIT, γ1 = γ2 = 1, u1 = 0.4, u2 = 0.3, u3 = 0.3,
Nt = 4, Rthk = 0, k ∈ {1, 2, 3}.
in most user deployments while the complexity of 1-layer
RS is much reduced. In Fig. 39(a)–(c) and Fig. 40(a)–(c),
1-layer RS achieves the same WSR as RS. It implies that
RS reduces to 1-layer RS in these user deployments. Both
of RS and 1-layer RS achieve higher WSRs than all other
strategies.
2) Single transmit antenna deployment: Fig. 44 and Fig.
45 show the average rate regions of different strategies over
10 random channel realizations when σ21 = σ2
2 = σ23 = 1
and σ21 = σ2
2 = 1, σ23 = 0.3, respectively. We further show
0 10 20 30
SNR (dB)
0
2
4
6
8
10
Wei
ghte
d S
um R
ate
(bit/
s/H
z)
(a) θ1=π/9, θ
2=2π/9
0 10 20 30
SNR (dB)
0
2
4
6
8
10
12
Wei
ghte
d S
um R
ate
(bit/
s/H
z)
(b) θ1=2π/9, θ
2=4π/9
0 10 20 30
SNR (dB)
0
2
4
6
8
10
12
Wei
ghte
d S
um R
ate
(bit/
s/H
z)
(c) θ1=π/3, θ
2=2π/3
DPCRSSC-SICMU-LP1-layer RS
0 10 20 30
SNR (dB)
0
2
4
6
8
10
12
Wei
ghte
d S
um R
ate
(bit/
s/H
z)
(d) θ1=4π/9, θ
2=8π/9
Fig. 34: Weighted sum rate versus SNR comparison of dif-
ferent strategies for underloaded three-user deployment with
perfect CSIT, γ1 = γ2 = 1, u1 = 0.6, u2 = 0.3, u3 = 0.1,
Nt = 4, Rthk = 0, k ∈ {1, 2, 3}.
0 10 20 30
SNR (dB)
0
2
4
6
8
10
Wei
ghte
d S
um R
ate
(bit/
s/H
z)
(a) θ1=π/9, θ
2=2π/9
0 10 20 30
SNR (dB)
0
2
4
6
8
10
Wei
ghte
d S
um R
ate
(bit/
s/H
z)
(b) θ1=2π/9, θ
2=4π/9
0 10 20 30
SNR (dB)
0
2
4
6
8
10
12
Wei
ghte
d S
um R
ate
(bit/
s/H
z)
(c) θ1=π/3, θ
2=2π/3
DPCRSSC-SICMU-LP1-layer RS
0 10 20 30
SNR (dB)
0
2
4
6
8
10
12
Wei
ghte
d S
um R
ate
(bit/
s/H
z)
(d) θ1=4π/9, θ
2=8π/9
Fig. 35: Weighted sum rate versus SNR comparison of
different strategies for underloaded three-user deployment
with perfect CSIT, γ1 = 1, γ2 = 0.3, u1 = 0.6, u2 =0.3, u3 = 0.1, Nt = 4, Rth
k = 0, k ∈ {1, 2, 3}.
that 1-layer RS is an attractive alternative to SC–SIC.
E. Underloaded three-user deployment with imperfect CSIT
We consider the imperfect CSIT scenarios. The channel
model in the two-user deployment with imperfect CSIT
is extended here. The estimated channel of user-1, user-
2 and user-3 are initialized using equation (38). For the
given channel estimate at the BS, the channel realization
is hk = hk + hk, ∀k ∈ {1, 2, 3}, where hk is the estimated
error of user-k. hk has i.i.d. complex Gaussian entries drawn

0 10 20 30
SNR (dB)
0
1
2
3
4
5
Wei
ghte
d S
um R
ate
(bit/
s/H
z)(a) θ
1=π/9, θ
2=2π/9
0 10 20 30
SNR (dB)
0
1
2
3
4
5
6
Wei
ghte
d S
um R
ate
(bit/
s/H
z)
(b) θ1=2π/9, θ
2=4π/9
0 10 20 30
SNR (dB)
0
1
2
3
4
5
6
Wei
ghte
d S
um R
ate
(bit/
s/H
z)
(c) θ1=π/3, θ
2=2π/3
DPCRSSC-SICMU-LP1-layer RS
0 10 20 30
SNR (dB)
0
2
4
6
8W
eigh
ted
Sum
Rat
e (b
it/s/
Hz)
(d) θ1=4π/9, θ
2=8π/9
Fig. 36: Weighted sum rate versus SNR comparison of
different strategies for underloaded three-user deployment
with perfect CSIT, γ1 = 0.3, γ2 = 0.1, u1 = 0.2, u2 =0.3, u3 = 0.5, Nt = 4, Rth
k = 0, k ∈ {1, 2, 3}.
0 10 20 30
SNR (dB)
0
1
2
3
4
5
6
Wei
ghte
d S
um R
ate
(bit/
s/H
z)
(a) θ1=π/9, θ
2=2π/9
0 10 20 30
SNR (dB)
0
2
4
6
8
Wei
ghte
d S
um R
ate
(bit/
s/H
z)
(b) θ1=2π/9, θ
2=4π/9
0 10 20 30
SNR (dB)
0
2
4
6
8
Wei
ghte
d S
um R
ate
(bit/
s/H
z)
(c) θ1=π/3, θ
2=2π/3
DPCRSSC-SICMU-LP1-layer RS
0 10 20 30
SNR (dB)
0
2
4
6
8
Wei
ghte
d S
um R
ate
(bit/
s/H
z)
(d) θ1=4π/9, θ
2=8π/9
Fig. 37: Weighted sum rate versus SNR comparison of
different strategies for underloaded three-user deployment
with perfect CSIT, γ1 = 0.3, γ2 = 0.1, u1 = 0.4, u2 =0.3, u3 = 0.3, Nt = 4, Rth
k = 0, k ∈ {1, 2, 3}.
from CN (0, σ2e,k). The error covariance of user-1, user-
2 and user-3 are σ2e,1 = P−0.6
t , σ2e,2 = γ1P
−0.6t and
σ2e,3 = γ2P
−0.6t , respectively. The precoders are initialized
and designed using the estimated channels h1, h2, h3 and
the same methods as stated in perfect CSIT scenarios. 1000
different channel error samples are generated for each user.
Each point in the rate region is the average rate over the
generated 1000 channels.
Comparing with the simulation results in perfect CSIT, the
WSR gap between RS and MU–LP increases in imperfect
0 10 20 30
SNR (dB)
0
2
4
6
8
10
Wei
ghte
d S
um R
ate
(bit/
s/H
z)
(a) θ1=π/9, θ
2=2π/9
0 10 20 30
SNR (dB)
0
2
4
6
8
10
Wei
ghte
d S
um R
ate
(bit/
s/H
z)
(b) θ1=2π/9, θ
2=4π/9
0 10 20 30
SNR (dB)
0
2
4
6
8
10
Wei
ghte
d S
um R
ate
(bit/
s/H
z)
(c) θ1=π/3, θ
2=2π/3
DPCRSSC-SICMU-LP1-layer RS
0 10 20 30
SNR (dB)
0
2
4
6
8
10
Wei
ghte
d S
um R
ate
(bit/
s/H
z)
(d) θ1=4π/9, θ
2=8π/9
Fig. 38: Weighted sum rate versus SNR comparison of
different strategies for underloaded three-user deployment
with perfect CSIT, γ1 = 0.3, γ2 = 0.1, u1 = 0.6, u2 =0.3, u3 = 0.1, Nt = 4, Rth
k = 0, k ∈ {1, 2, 3}.
0 10 20 30
SNR (dB)
0
1
2
3
4
5
6
7
Wei
ghte
d S
um R
ate
(bit/
s/H
z)
(a) θ1=π/9, θ
2=2π/9
0 10 20 30
SNR (dB)
0
1
2
3
4
5
6
7
Wei
ghte
d S
um R
ate
(bit/
s/H
z)
(b) θ1=2π/9, θ
2=4π/9
0 10 20 30
SNR (dB)
0
1
2
3
4
5
6
7
Wei
ghte
d S
um R
ate
(bit/
s/H
z)
(c) θ1=π/3, θ
2=2π/3
RSSC-SICMU-LP1-layer RSSC-SIC per group
0 10 20 30
SNR (dB)
0
1
2
3
4
5
6
7
Wei
ghte
d S
um R
ate
(bit/
s/H
z)
(d) θ1=4π/9, θ
2=8π/9
Fig. 39: Weighted sum rate versus SNR comparison of dif-
ferent strategies for overloaded three-user deployment with
perfect CSIT, γ1 = γ2 = 1, u1 = 0.2, u2 = 0.3, u3 = 0.5,
Nt = 2, rth = [0.02, 0.08, 0.19, 0.3, 0.4, 0.4, 0.4] bit/s/Hz.
CSIT. In contrast, the WSR gap between RS and 1-layer RS
decreases in imperfect CSIT. 1-layer RS achieves equal or
better WSRs than SC–SIC, SC–SIC per group and MU–LP
in all figures (Fig. 46–51). As mentioned earlier, all forms of
RS are suited to any network load and channel circumstances
of users. Moreover, all forms of RS are robust to imperfect
CSIT.
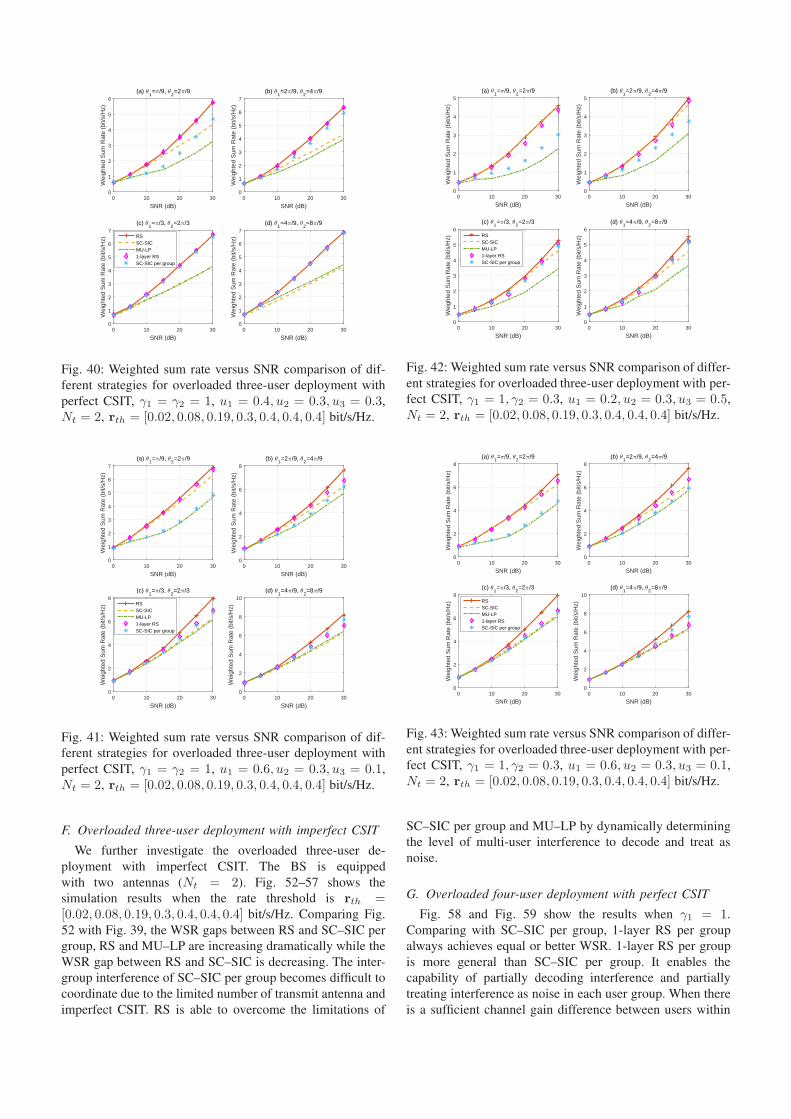
0 10 20 30
SNR (dB)
0
1
2
3
4
5
6W
eigh
ted
Sum
Rat
e (b
it/s/
Hz)
(a) θ1=π/9, θ
2=2π/9
0 10 20 30
SNR (dB)
0
1
2
3
4
5
6
7
Wei
ghte
d S
um R
ate
(bit/
s/H
z)
(b) θ1=2π/9, θ
2=4π/9
0 10 20 30
SNR (dB)
0
1
2
3
4
5
6
7
Wei
ghte
d S
um R
ate
(bit/
s/H
z)
(c) θ1=π/3, θ
2=2π/3
RSSC-SICMU-LP1-layer RSSC-SIC per group
0 10 20 30
SNR (dB)
0
1
2
3
4
5
6
7W
eigh
ted
Sum
Rat
e (b
it/s/
Hz)
(d) θ1=4π/9, θ
2=8π/9
Fig. 40: Weighted sum rate versus SNR comparison of dif-
ferent strategies for overloaded three-user deployment with
perfect CSIT, γ1 = γ2 = 1, u1 = 0.4, u2 = 0.3, u3 = 0.3,
Nt = 2, rth = [0.02, 0.08, 0.19, 0.3, 0.4, 0.4, 0.4] bit/s/Hz.
0 10 20 30
SNR (dB)
0
1
2
3
4
5
6
7
Wei
ghte
d S
um R
ate
(bit/
s/H
z)
(a) θ1=π/9, θ
2=2π/9
0 10 20 30
SNR (dB)
0
2
4
6
8
Wei
ghte
d S
um R
ate
(bit/
s/H
z)
(b) θ1=2π/9, θ
2=4π/9
0 10 20 30
SNR (dB)
0
2
4
6
8
Wei
ghte
d S
um R
ate
(bit/
s/H
z)
(c) θ1=π/3, θ
2=2π/3
RSSC-SICMU-LP1-layer RSSC-SIC per group
0 10 20 30
SNR (dB)
0
2
4
6
8
10
Wei
ghte
d S
um R
ate
(bit/
s/H
z)
(d) θ1=4π/9, θ
2=8π/9
Fig. 41: Weighted sum rate versus SNR comparison of dif-
ferent strategies for overloaded three-user deployment with
perfect CSIT, γ1 = γ2 = 1, u1 = 0.6, u2 = 0.3, u3 = 0.1,
Nt = 2, rth = [0.02, 0.08, 0.19, 0.3, 0.4, 0.4, 0.4] bit/s/Hz.
F. Overloaded three-user deployment with imperfect CSIT
We further investigate the overloaded three-user de-
ployment with imperfect CSIT. The BS is equipped
with two antennas (Nt = 2). Fig. 52–57 shows the
simulation results when the rate threshold is rth =[0.02, 0.08, 0.19, 0.3, 0.4, 0.4, 0.4] bit/s/Hz. Comparing Fig.
52 with Fig. 39, the WSR gaps between RS and SC–SIC per
group, RS and MU–LP are increasing dramatically while the
WSR gap between RS and SC–SIC is decreasing. The inter-
group interference of SC–SIC per group becomes difficult to
coordinate due to the limited number of transmit antenna and
imperfect CSIT. RS is able to overcome the limitations of
0 10 20 30
SNR (dB)
0
1
2
3
4
5
Wei
ghte
d S
um R
ate
(bit/
s/H
z)
(a) θ1=π/9, θ
2=2π/9
0 10 20 30
SNR (dB)
0
1
2
3
4
5
Wei
ghte
d S
um R
ate
(bit/
s/H
z)
(b) θ1=2π/9, θ
2=4π/9
0 10 20 30
SNR (dB)
0
1
2
3
4
5
6
Wei
ghte
d S
um R
ate
(bit/
s/H
z)
(c) θ1=π/3, θ
2=2π/3
RSSC-SICMU-LP1-layer RSSC-SIC per group
0 10 20 30
SNR (dB)
0
1
2
3
4
5
6
Wei
ghte
d S
um R
ate
(bit/
s/H
z)
(d) θ1=4π/9, θ
2=8π/9
Fig. 42: Weighted sum rate versus SNR comparison of differ-
ent strategies for overloaded three-user deployment with per-
fect CSIT, γ1 = 1, γ2 = 0.3, u1 = 0.2, u2 = 0.3, u3 = 0.5,
Nt = 2, rth = [0.02, 0.08, 0.19, 0.3, 0.4, 0.4, 0.4] bit/s/Hz.
0 10 20 30
SNR (dB)
0
2
4
6
8
Wei
ghte
d S
um R
ate
(bit/
s/H
z)
(a) θ1=π/9, θ
2=2π/9
0 10 20 30
SNR (dB)
0
2
4
6
8
Wei
ghte
d S
um R
ate
(bit/
s/H
z)
(b) θ1=2π/9, θ
2=4π/9
0 10 20 30
SNR (dB)
0
2
4
6
8
Wei
ghte
d S
um R
ate
(bit/
s/H
z)
(c) θ1=π/3, θ
2=2π/3
RSSC-SICMU-LP1-layer RSSC-SIC per group
0 10 20 30
SNR (dB)
0
2
4
6
8
10
Wei
ghte
d S
um R
ate
(bit/
s/H
z)
(d) θ1=4π/9, θ
2=8π/9
Fig. 43: Weighted sum rate versus SNR comparison of differ-
ent strategies for overloaded three-user deployment with per-
fect CSIT, γ1 = 1, γ2 = 0.3, u1 = 0.6, u2 = 0.3, u3 = 0.1,
Nt = 2, rth = [0.02, 0.08, 0.19, 0.3, 0.4, 0.4, 0.4] bit/s/Hz.
SC–SIC per group and MU–LP by dynamically determining
the level of multi-user interference to decode and treat as
noise.
G. Overloaded four-user deployment with perfect CSIT
Fig. 58 and Fig. 59 show the results when γ1 = 1.
Comparing with SC–SIC per group, 1-layer RS per group
always achieves equal or better WSR. 1-layer RS per group
is more general than SC–SIC per group. It enables the
capability of partially decoding interference and partially
treating interference as noise in each user group. When there
is a sufficient channel gain difference between users within
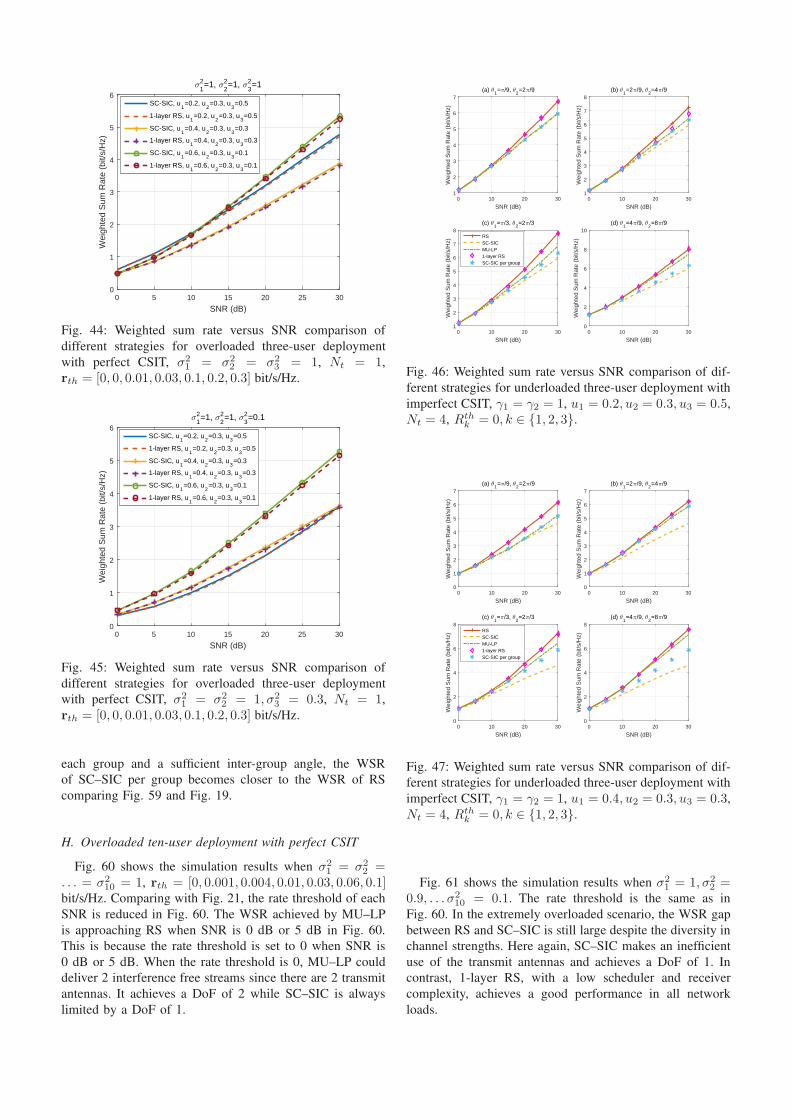
0 5 10 15 20 25 30
SNR (dB)
0
1
2
3
4
5
6W
eigh
ted
Sum
Rat
e (b
it/s/
Hz)
σ12=1, σ
22=1, σ
32=1
SC-SIC, u1=0.2, u
2=0.3, u
3=0.5
1-layer RS, u1=0.2, u
2=0.3, u
3=0.5
SC-SIC, u1=0.4, u
2=0.3, u
3=0.3
1-layer RS, u1=0.4, u
2=0.3, u
3=0.3
SC-SIC, u1=0.6, u
2=0.3, u
3=0.1
1-layer RS, u1=0.6, u
2=0.3, u
3=0.1
Fig. 44: Weighted sum rate versus SNR comparison of
different strategies for overloaded three-user deployment
with perfect CSIT, σ21 = σ2
2 = σ23 = 1, Nt = 1,
rth = [0, 0, 0.01, 0.03, 0.1, 0.2, 0.3] bit/s/Hz.
0 5 10 15 20 25 30
SNR (dB)
0
1
2
3
4
5
6
Wei
ghte
d S
um R
ate
(bit/
s/H
z)
σ12=1, σ
22=1, σ
32=0.1
SC-SIC, u1=0.2, u
2=0.3, u
3=0.5
1-layer RS, u1=0.2, u
2=0.3, u
3=0.5
SC-SIC, u1=0.4, u
2=0.3, u
3=0.3
1-layer RS, u1=0.4, u
2=0.3, u
3=0.3
SC-SIC, u1=0.6, u
2=0.3, u
3=0.1
1-layer RS, u1=0.6, u
2=0.3, u
3=0.1
Fig. 45: Weighted sum rate versus SNR comparison of
different strategies for overloaded three-user deployment
with perfect CSIT, σ21 = σ2
2 = 1, σ23 = 0.3, Nt = 1,
rth = [0, 0, 0.01, 0.03, 0.1, 0.2, 0.3] bit/s/Hz.
each group and a sufficient inter-group angle, the WSR
of SC–SIC per group becomes closer to the WSR of RS
comparing Fig. 59 and Fig. 19.
H. Overloaded ten-user deployment with perfect CSIT
Fig. 60 shows the simulation results when σ21 = σ2
2 =. . . = σ2
10 = 1, rth = [0, 0.001, 0.004, 0.01, 0.03, 0.06, 0.1]bit/s/Hz. Comparing with Fig. 21, the rate threshold of each
SNR is reduced in Fig. 60. The WSR achieved by MU–LP
is approaching RS when SNR is 0 dB or 5 dB in Fig. 60.
This is because the rate threshold is set to 0 when SNR is
0 dB or 5 dB. When the rate threshold is 0, MU–LP could
deliver 2 interference free streams since there are 2 transmit
antennas. It achieves a DoF of 2 while SC–SIC is always
limited by a DoF of 1.
0 10 20 30
SNR (dB)
1
2
3
4
5
6
7
Wei
ghte
d S
um R
ate
(bit/
s/H
z)
(a) θ1=π/9, θ
2=2π/9
0 10 20 30
SNR (dB)
1
2
3
4
5
6
7
8
Wei
ghte
d S
um R
ate
(bit/
s/H
z)
(b) θ1=2π/9, θ
2=4π/9
0 10 20 30
SNR (dB)
1
2
3
4
5
6
7
8
Wei
ghte
d S
um R
ate
(bit/
s/H
z)
(c) θ1=π/3, θ
2=2π/3
RSSC-SICMU-LP1-layer RSSC-SIC per group
0 10 20 30
SNR (dB)
0
2
4
6
8
10
Wei
ghte
d S
um R
ate
(bit/
s/H
z)
(d) θ1=4π/9, θ
2=8π/9
Fig. 46: Weighted sum rate versus SNR comparison of dif-
ferent strategies for underloaded three-user deployment with
imperfect CSIT, γ1 = γ2 = 1, u1 = 0.2, u2 = 0.3, u3 = 0.5,
Nt = 4, Rthk = 0, k ∈ {1, 2, 3}.
0 10 20 30
SNR (dB)
0
1
2
3
4
5
6
7
Wei
ghte
d S
um R
ate
(bit/
s/H
z)
(a) θ1=π/9, θ
2=2π/9
0 10 20 30
SNR (dB)
0
1
2
3
4
5
6
7
Wei
ghte
d S
um R
ate
(bit/
s/H
z)
(b) θ1=2π/9, θ
2=4π/9
0 10 20 30
SNR (dB)
0
2
4
6
8
Wei
ghte
d S
um R
ate
(bit/
s/H
z)
(c) θ1=π/3, θ
2=2π/3
RSSC-SICMU-LP1-layer RSSC-SIC per group
0 10 20 30
SNR (dB)
0
2
4
6
8
Wei
ghte
d S
um R
ate
(bit/
s/H
z)
(d) θ1=4π/9, θ
2=8π/9
Fig. 47: Weighted sum rate versus SNR comparison of dif-
ferent strategies for underloaded three-user deployment with
imperfect CSIT, γ1 = γ2 = 1, u1 = 0.4, u2 = 0.3, u3 = 0.3,
Nt = 4, Rthk = 0, k ∈ {1, 2, 3}.
Fig. 61 shows the simulation results when σ21 = 1, σ2
2 =0.9, . . . σ2
10 = 0.1. The rate threshold is the same as in
Fig. 60. In the extremely overloaded scenario, the WSR gap
between RS and SC–SIC is still large despite the diversity in
channel strengths. Here again, SC–SIC makes an inefficient
use of the transmit antennas and achieves a DoF of 1. In
contrast, 1-layer RS, with a low scheduler and receiver
complexity, achieves a good performance in all network
loads.

0 10 20 30
SNR (dB)
1
2
3
4
5
6
7
8W
eigh
ted
Sum
Rat
e (b
it/s/
Hz)
(a) θ1=π/9, θ
2=2π/9
0 10 20 30
SNR (dB)
0
2
4
6
8
10
Wei
ghte
d S
um R
ate
(bit/
s/H
z)
(b) θ1=2π/9, θ
2=4π/9
0 10 20 30
SNR (dB)
0
2
4
6
8
10
Wei
ghte
d S
um R
ate
(bit/
s/H
z)
(c) θ1=π/3, θ
2=2π/3
RSSC-SICMU-LP1-layer RSSC-SIC per group
0 10 20 30
SNR (dB)
0
2
4
6
8
10W
eigh
ted
Sum
Rat
e (b
it/s/
Hz)
(d) θ1=4π/9, θ
2=8π/9
Fig. 48: Weighted sum rate versus SNR comparison of dif-
ferent strategies for underloaded three-user deployment with
imperfect CSIT, γ1 = γ2 = 1, u1 = 0.6, u2 = 0.3, u3 = 0.1,
Nt = 4, Rthk = 0, k ∈ {1, 2, 3}.
0 10 20 30
SNR (dB)
0
1
2
3
4
5
6
Wei
ghte
d S
um R
ate
(bit/
s/H
z)
(a) θ1=π/9, θ
2=2π/9
0 10 20 30
SNR (dB)
0
1
2
3
4
5
6
Wei
ghte
d S
um R
ate
(bit/
s/H
z)
(b) θ1=2π/9, θ
2=4π/9
0 10 20 30
SNR (dB)
0
1
2
3
4
5
6
7
Wei
ghte
d S
um R
ate
(bit/
s/H
z)
(c) θ1=π/3, θ
2=2π/3
RSSC-SICMU-LP1-layer RSSC-SIC per group
0 10 20 30
SNR (dB)
0
1
2
3
4
5
6
7
Wei
ghte
d S
um R
ate
(bit/
s/H
z)
(d) θ1=4π/9, θ
2=8π/9
Fig. 49: Weighted sum rate versus SNR comparison of
different strategies for underloaded three-user deployment
with imperfect CSIT, γ1 = 1, γ2 = 0.3, u1 = 0.2, u2 =0.3, u3 = 0.5, Nt = 4, Rth
k = 0, k ∈ {1, 2, 3}.
REFERENCES
[1] Y. Saito, Y. Kishiyama, A. Benjebbour, T. Nakamura, A. Li, andK. Higuchi, “Non-orthogonal multiple access (NOMA) for cellularfuture radio access,” in 2013 IEEE 77th Vehicular Technology Con-
ference (VTC Spring), June 2013, pp. 1–5.
[2] “Study on downlink multiuser superposition transmission (MUST) forLTE (Release 13),” 3GPP TR 36.859, Tech. Rep., Dec 2015.
[3] H. Nikopour and H. Baligh, “Sparse code multiple access,” in 2013
IEEE 24th Annual International Symposium on Personal, Indoor, andMobile Radio Communications (PIMRC), Sept 2013, pp. 332–336.
[4] L. Dai, B. Wang, Y. Yuan, S. Han, C. l. I, and Z. Wang, “Non-orthogonal multiple access for 5G: Solutions, challenges, opportuni-ties, and future research trends,” IEEE Communications Magazine,vol. 53, no. 9, pp. 74–81, September 2015.
0 10 20 30
SNR (dB)
0
1
2
3
4
5
6
Wei
ghte
d S
um R
ate
(bit/
s/H
z)
(a) θ1=π/9, θ
2=2π/9
0 10 20 30
SNR (dB)
0
1
2
3
4
5
6
7
Wei
ghte
d S
um R
ate
(bit/
s/H
z)
(b) θ1=2π/9, θ
2=4π/9
0 10 20 30
SNR (dB)
0
1
2
3
4
5
6
7
Wei
ghte
d S
um R
ate
(bit/
s/H
z)
(c) θ1=π/3, θ
2=2π/3
RSSC-SICMU-LP1-layer RSSC-SIC per group
0 10 20 30
SNR (dB)
0
1
2
3
4
5
6
7
Wei
ghte
d S
um R
ate
(bit/
s/H
z)
(d) θ1=4π/9, θ
2=8π/9
Fig. 50: Weighted sum rate versus SNR comparison of
different strategies for underloaded three-user deployment
with imperfect CSIT, γ1 = 1, γ2 = 0.3, u1 = 0.4, u2 =0.3, u3 = 0.3, Nt = 4, Rth
k = 0, k ∈ {1, 2, 3}.
0 10 20 30
SNR (dB)
1
2
3
4
5
6
7
8
Wei
ghte
d S
um R
ate
(bit/
s/H
z)
(a) θ1=π/9, θ
2=2π/9
0 10 20 30
SNR (dB)
0
2
4
6
8
10
Wei
ghte
d S
um R
ate
(bit/
s/H
z)
(b) θ1=2π/9, θ
2=4π/9
0 10 20 30
SNR (dB)
0
2
4
6
8
10
Wei
ghte
d S
um R
ate
(bit/
s/H
z)
(c) θ1=π/3, θ
2=2π/3
RSSC-SICMU-LP1-layer RSSC-SIC per group
0 10 20 30
SNR (dB)
0
2
4
6
8
10
Wei
ghte
d S
um R
ate
(bit/
s/H
z)
(c) θ1=4π/9, θ
2=8π/9
Fig. 51: Weighted sum rate versus SNR comparison of
different strategies for underloaded three-user deployment
with imperfect CSIT, γ1 = 1, γ2 = 0.3, u1 = 0.6, u2 =0.3, u3 = 0.1, Nt = 4, Rth
k = 0, k ∈ {1, 2, 3}.
[5] Z. Ding, Y. Liu, J. Choi, Q. Sun, M. Elkashlan, C. L. I, and H. V.Poor, “Application of non-orthogonal multiple access in LTE and 5Gnetworks,” IEEE Communications Magazine, vol. 55, no. 2, pp. 185–191, February 2017.
[6] W. Shin, M. Vaezi, B. Lee, D. J. Love, J. Lee, and H. V. Poor, “Non-orthogonal multiple access in multi-cell networks: Theory, perfor-mance, and practical challenges,” IEEE Communications Magazine,vol. 55, no. 10, pp. 176–183, Oct 2017.
[7] T. Cover, “Broadcast channels,” IEEE Transactions on Information
Theory, vol. 18, no. 1, pp. 2–14, Jan 1972.
[8] D. Tse and P. Viswanath, Fundamentals of Wireless Communication.Cambridge University Press, 2005.
[9] Q. Li, G. Li, W. Lee, M. i. Lee, D. Mazzarese, B. Clerckx, and Z. Li,“MIMO techniques in WiMAX and LTE: A feature overview,” IEEE
Communications Magazine, vol. 48, no. 5, pp. 86–92, May 2010.

0 10 20 30
SNR (dB)
0
1
2
3
4
5
6W
eigh
ted
Sum
Rat
e (b
it/s/
Hz)
(a) θ1=π/9, θ
2=2π/9
0 10 20 30
SNR (dB)
0
1
2
3
4
5
6
Wei
ghte
d S
um R
ate
(bit/
s/H
z)
(b) θ1=2π/9, θ
2=4π/9
0 10 20 30
SNR (dB)
0
1
2
3
4
5
6
7
Wei
ghte
d S
um R
ate
(bit/
s/H
z)
(c) θ1=π/3, θ
2=2π/3
RSSC-SICMU-LP1-layer RSSC-SIC per group
0 10 20 30
SNR (dB)
0
1
2
3
4
5
6
Wei
ghte
d S
um R
ate
(bit/
s/H
z)
(d) θ1=4π/9, θ
2=8π/9
Fig. 52: Weighted sum rate versus SNR comparison of dif-
ferent strategies for overloaded three-user deployment with
imperfect CSIT, γ1 = γ2 = 1, u1 = 0.2, u2 = 0.3, u3 = 0.5,
Nt = 2, rth = [0.02, 0.08, 0.19, 0.3, 0.4, 0.4, 0.4] bit/s/Hz.
0 10 20 30
SNR (dB)
0
1
2
3
4
5
Wei
ghte
d S
um R
ate
(bit/
s/H
z)
(a) θ1=π/9, θ
2=2π/9
0 10 20 30
SNR (dB)
0
1
2
3
4
5
6
Wei
ghte
d S
um R
ate
(bit/
s/H
z)
(b) θ1=2π/9, θ
2=4π/9
0 10 20 30
SNR (dB)
0
1
2
3
4
5
6
Wei
ghte
d S
um R
ate
(bit/
s/H
z)
(c) θ1=π/3, θ
2=2π/3
RSSC-SICMU-LP1-layer RSSC-SIC per group
0 10 20 30
SNR (dB)
0
1
2
3
4
5
6
Wei
ghte
d S
um R
ate
(bit/
s/H
z)
(d) θ1=4π/9, θ
2=8π/9
Fig. 53: Weighted sum rate versus SNR comparison of dif-
ferent strategies for overloaded three-user deployment with
imperfect CSIT, γ1 = γ2 = 1, u1 = 0.4, u2 = 0.3, u3 = 0.3,
Nt = 2, rth = [0.02, 0.08, 0.19, 0.3, 0.4, 0.4, 0.4] bit/s/Hz.
[10] H. Weingarten, Y. Steinberg, and S. S. Shamai, “The capacity region ofthe Gaussian multiple-input multiple-output broadcast channel,” IEEE
Transactions on Information Theory, vol. 52, no. 9, pp. 3936–3964,Sept 2006.
[11] B. Clerckx and C. Oestges, MIMO wireless networks: Channels,
techniques and standards for multi-antenna, multi-user and multi-cell
systems. Academic Press, 2013.
[12] T. Yoo and A. Goldsmith, “On the optimality of multiantenna broad-cast scheduling using zero-forcing beamforming,” IEEE Journal on
Selected Areas in Communications, vol. 24, no. 3, pp. 528–541, March2006.
[13] B. Clerckx, H. Joudeh, C. Hao, M. Dai, and B. Rassouli, “Rate split-ting for MIMO wireless networks: A promising PHY-layer strategyfor LTE evolution,” IEEE Communications Magazine, vol. 54, no. 5,pp. 98–105, May 2016.
[14] N. Jindal, “MIMO broadcast channels with finite-rate feedback,” IEEE
Transactions on Information Theory, vol. 52, no. 11, pp. 5045–5060,
0 10 20 30
SNR (dB)
1
2
3
4
5
6
7
Wei
ghte
d S
um R
ate
(bit/
s/H
z)
(a) θ1=π/9, θ
2=2π/9
0 10 20 30
SNR (dB)
1
2
3
4
5
6
7
Wei
ghte
d S
um R
ate
(bit/
s/H
z)
(b) θ1=2π/9, θ
2=4π/9
0 10 20 30
SNR (dB)
1
2
3
4
5
6
7
Wei
ghte
d S
um R
ate
(bit/
s/H
z)
(c) θ1=π/3, θ
2=2π/3
RSSC-SICMU-LP1-layer RSSC-SIC per group
0 10 20 30
SNR (dB)
1
2
3
4
5
6
7
Wei
ghte
d S
um R
ate
(bit/
s/H
z)
(d) θ1=4π/9, θ
2=8π/9
Fig. 54: Weighted sum rate versus SNR comparison of dif-
ferent strategies for overloaded three-user deployment with
imperfect CSIT, γ1 = γ2 = 1, u1 = 0.6, u2 = 0.3, u3 = 0.1,
Nt = 2, rth = [0.02, 0.08, 0.19, 0.3, 0.4, 0.4, 0.4] bit/s/Hz.
0 10 20 30
SNR (dB)
0.5
1
1.5
2
2.5
3
3.5
4
Wei
ghte
d S
um R
ate
(bit/
s/H
z)(a) θ
1=π/9, θ
2=2π/9
0 10 20 30
SNR (dB)
0
1
2
3
4
5
Wei
ghte
d S
um R
ate
(bit/
s/H
z)
(b) θ1=2π/9, θ
2=4π/9
0 10 20 30
SNR (dB)
0
1
2
3
4
5
Wei
ghte
d S
um R
ate
(bit/
s/H
z)
(c) θ1=π/3, θ
2=2π/3
RSSC-SICMU-LP1-layer RSSC-SIC per group
0 10 20 30
SNR (dB)
0
1
2
3
4
5W
eigh
ted
Sum
Rat
e (b
it/s/
Hz)
(d) θ1=4π/9, θ
2=8π/9
Fig. 55: Weighted sum rate versus SNR comparison of dif-
ferent strategies for overloaded three-user deployment with
imperfect CSIT, γ1 = 1, γ2 = 0.3, u1 = 0.2, u2 = 0.3, u3 =0.5, Nt = 2, rth = [0.02, 0.08, 0.19, 0.3, 0.4, 0.4, 0.4]bit/s/Hz.
Nov 2006.
[15] M. F. Hanif, Z. Ding, T. Ratnarajah, and G. K. Karagiannidis, “Aminorization-maximization method for optimizing sum rate in thedownlink of non-orthogonal multiple access systems,” IEEE Trans-actions on Signal Processing, vol. 64, no. 1, pp. 76–88, Jan 2016.
[16] J. Choi, “Minimum power multicast beamforming with superpositioncoding for multiresolution broadcast and application to NOMA sys-tems,” IEEE Transactions on Communications, vol. 63, no. 3, pp.791–800, March 2015.
[17] Q. Sun, S. Han, C. L. I, and Z. Pan, “On the ergodic capacity ofMIMO NOMA systems,” IEEE Wireless Communications Letters,vol. 4, no. 4, pp. 405–408, Aug 2015.
[18] Q. Zhang, Q. Li, and J. Qin, “Robust beamforming for nonorthogonalmultiple-access systems in MISO channels,” IEEE Transactions on
Vehicular Technology, vol. 65, no. 12, pp. 10 231–10 236, Dec 2016.
[19] H. Joudeh and B. Clerckx, “Rate-splitting for max-min fair multigroup

0 10 20 30
SNR (dB)
0
1
2
3
4
5W
eigh
ted
Sum
Rat
e (b
it/s/
Hz)
(a) θ1=π/9, θ
2=2π/9
0 10 20 30
SNR (dB)
0
1
2
3
4
5
Wei
ghte
d S
um R
ate
(bit/
s/H
z)
(b) θ1=2π/9, θ
2=4π/9
0 10 20 30
SNR (dB)
0
1
2
3
4
5
6
Wei
ghte
d S
um R
ate
(bit/
s/H
z)
(c) θ1=π/3, θ
2=2π/3
RSSC-SICMU-LP1-layer RSSC-SIC per group
0 10 20 30
SNR (dB)
0
1
2
3
4
5
6
Wei
ghte
d S
um R
ate
(bit/
s/H
z)
(d) θ1=4π/9, θ
2=8π/9
Fig. 56: Weighted sum rate versus SNR comparison of dif-
ferent strategies for overloaded three-user deployment with
imperfect CSIT, γ1 = 1, γ2 = 0.3, u1 = 0.4, u2 = 0.3, u3 =0.3, Nt = 2, rth = [0.02, 0.08, 0.19, 0.3, 0.4, 0.4, 0.4]bit/s/Hz.
0 10 20 30
SNR (dB)
0
1
2
3
4
5
6
7
Wei
ghte
d S
um R
ate
(bit/
s/H
z)
(a) θ1=π/9, θ
2=2π/9
0 10 20 30
SNR (dB)
0
1
2
3
4
5
6
7
Wei
ghte
d S
um R
ate
(bit/
s/H
z)
(b) θ1=2π/9, θ
2=4π/9
0 10 20 30
SNR (dB)
0
2
4
6
8
Wei
ghte
d S
um R
ate
(bit/
s/H
z)
(c) θ1=π/3, θ
2=2π/3
RSSC-SICMU-LP1-layer RSSC-SIC per group
0 10 20 30
SNR (dB)
1
2
3
4
5
6
7
8
Wei
ghte
d S
um R
ate
(bit/
s/H
z)
(d) θ1=4π/9, θ
2=8π/9
Fig. 57: Weighted sum rate versus SNR comparison of dif-
ferent strategies for overloaded three-user deployment with
imperfect CSIT, γ1 = 1, γ2 = 0.3, u1 = 0.6, u2 = 0.3, u3 =0.1, Nt = 2, rth = [0.02, 0.08, 0.19, 0.3, 0.4, 0.4, 0.4]bit/s/Hz.
multicast beamforming in overloaded systems,” IEEE Transactions onWireless Communications, vol. 16, no. 11, pp. 7276–7289, Nov 2017.
[20] C. Lim, T. Yoo, B. Clerckx, B. Lee, and B. Shim, “Recent trend ofmultiuser MIMO in LTE-advanced,” IEEE Communications Maga-zine, vol. 51, no. 3, pp. 127–135, March 2013.
[21] Z. Chen, Z. Ding, X. Dai, and G. K. Karagiannidis, “On theapplication of quasi-degradation to MISO–NOMA downlink,” IEEE
Transactions on Signal Processing, vol. 64, no. 23, pp. 6174–6189,Dec 2016.
[22] Z. Ding, F. Adachi, and H. V. Poor, “The application of MIMOto non-orthogonal multiple access,” IEEE Transactions on Wireless
Communications, vol. 15, no. 1, pp. 537–552, Jan 2016.[23] J. Choi, “On generalized downlink beamforming with NOMA,” Jour-
nal of Communications and Networks, vol. 19, no. 4, pp. 319–328,August 2017.
0 10 20 30
SNR (dB)
0
1
2
3
4
Wei
ghte
d S
um R
ate
(bit/
s/H
z)
(a) θ1=0
0 5 10 15 20 25 30
SNR (dB)
0
1
2
3
4
Wei
ghte
d S
um R
ate
(bit/
s/H
z)
(b) θ1=π/18
0 5 10 15 20 25 30
SNR (dB)
0
1
2
3
4
5
Wei
ghte
d S
um R
ate
(bit/
s/H
z)
(c) θ1=π/9
2-layer HRSSC-SIC per groupMU-LP1-layer RS per group1-layer RS
0 5 10 15 20 25 30
SNR (dB)
0
1
2
3
4
5
Wei
ghte
d S
um R
ate
(bit/
s/H
z)
(d) θ1=π/6
Fig. 58: Weighted sum rate versus SNR comparison of
different strategies for overloaded four-user deployment
with perfect CSIT, γ1 = 1, θ2 = θ1 + π9 , rth =
[0.03, 0.1, 0.2, 0.3, 0.4, 0.4, 0.4] bit/s/Hz.
0 5 10 15 20 25 30
SNR (dB)
0
1
2
3
4
5
Wei
ghte
d S
um R
ate
(bit/
s/H
z)(a) θ
1=0
0 5 10 15 20 25 30
SNR (dB)
0
1
2
3
4
5
Wei
ghte
d S
um R
ate
(bit/
s/H
z)
(b) θ1=π/18
0 5 10 15 20 25 30
SNR (dB)
0
1
2
3
4
5
Wei
ghte
d S
um R
ate
(bit/
s/H
z)
(c) θ1=π/9
2-layer HRSSC-SIC per groupMU-LP1-layer RS per group1-layer RS
0 5 10 15 20 25 30
SNR (dB)
0
1
2
3
4
5W
eigh
ted
Sum
Rat
e (b
it/s/
Hz)
(d) θ1=π/6
Fig. 59: Weighted sum rate versus SNR comparison of
different strategies for overloaded four-user deployment
with perfect CSIT, γ1 = 1, θ2 = θ1 + π3 , rth =
[0.03, 0.1, 0.2, 0.3, 0.4, 0.4, 0.4] bit/s/Hz.
[24] W. Shin, M. Vaezi, B. Lee, D. J. Love, J. Lee, and H. V. Poor,“Coordinated beamforming for multi-cell MIMO–NOMA,” IEEECommunications Letters, vol. 21, no. 1, pp. 84–87, Jan 2017.
[25] V. D. Nguyen, H. D. Tuan, T. Q. Duong, H. V. Poor, and O. S. Shin,“Precoder design for signal superposition in MIMO–NOMA multicellnetworks,” IEEE Journal on Selected Areas in Communications,vol. 35, no. 12, pp. 2681–2695, Dec 2017.
[26] M. Zeng, A. Yadav, O. A. Dobre, G. I. Tsiropoulos, and H. V. Poor,“Capacity comparison between MIMO–NOMA and MIMO–OMAwith multiple users in a cluster,” IEEE Journal on Selected Areas
in Communications, vol. 35, no. 10, pp. 2413–2424, Oct 2017.
[27] T. Han and K. Kobayashi, “A new achievable rate region for theinterference channel,” IEEE Transactions on Information Theory,vol. 27, no. 1, pp. 49–60, Jan 1981.
[28] A. G. Davoodi and S. A. Jafar, “Aligned image sets under channeluncertainty: Settling conjectures on the collapse of degrees of freedomunder finite precision CSIT,” IEEE Transactions on Information

0 5 10 15 20 25 30
SNR (dB)
0
5
10
15
20W
eigh
ted
Sum
Rat
e (b
it/s/
Hz)
1-layer RSSC-SICMU-LPmulticast
Fig. 60: Weighted sum rate versus SNR comparison of
different strategies for overloaded ten-user deployment with
perfect CSIT, σ21 = σ2
2 = . . . = σ210 = 1, Nt = 2, SNR=30
dB, rth = [0, 0.001, 0.004, 0.01, 0.03, 0.06, 0.1] bit/s/Hz.
0 5 10 15 20 25 30
SNR (dB)
0
2
4
6
8
10
12
14
16
18
Wei
ghte
d S
um R
ate
(bit/
s/H
z)
1-layer RSSC-SICMU-LPmulticast
Fig. 61: Weighted sum rate versus SNR comparison of
different strategies for overloaded ten-user deployment with
perfect CSIT, σ21 = 1, σ2
2 = 0.9, . . . σ210 = 0.1, Nt = 2,
SNR=30 dB, rth = [0, 0.001, 0.004, 0.01, 0.03, 0.06, 0.1]bit/s/Hz.
Theory, vol. 62, no. 10, pp. 5603–5618, Oct 2016.
[29] S. Yang, M. Kobayashi, D. Gesbert, and X. Yi, “Degrees of freedomof time correlated MISO broadcast channel with delayed CSIT,” IEEETransactions on Information Theory, vol. 59, no. 1, pp. 315–328, Jan2013.
[30] H. Joudeh and B. Clerckx, “Sum-rate maximization for linearlyprecoded downlink multiuser MISO systems with partial CSIT: A rate-splitting approach,” IEEE Transactions on Communications, vol. 64,no. 11, pp. 4847–4861, Nov 2016.
[31] E. Piovano and B. Clerckx, “Optimal DoF region of the K-user MISOBC with partial CSIT,” IEEE Communications Letters, vol. 21, no. 11,pp. 2368–2371, Nov 2017.
[32] C. Hao and B. Clerckx, “MISO networks with imperfect CSIT: Atopological rate-splitting approach,” IEEE Transactions on Communi-
cations, vol. 65, no. 5, pp. 2164–2179, May 2017.
[33] C. Hao, B. Rassouli, and B. Clerckx, “Achievable DoF regionsof MIMO networks with imperfect CSIT,” IEEE Transactions on
Information Theory, vol. 63, no. 10, pp. 6587–6606, Oct 2017.
[34] H. Joudeh and B. Clerckx, “Robust transmission in downlink multiuserMISO systems: A rate-splitting approach,” IEEE Transactions on
Signal Processing, vol. 64, no. 23, pp. 6227–6242, Dec 2016.[35] E. Piovano, H. Joudeh, and B. Clerckx, “Overloaded multiuser MISO
transmission with imperfect CSIT,” in 2016 50th Asilomar Conference
on Signals, Systems and Computers, Nov 2016, pp. 34–38.[36] R. H. Etkin, D. N. C. Tse, and H. Wang, “Gaussian interference
channel capacity to within one bit,” IEEE Transactions on Information
Theory, vol. 54, no. 12, pp. 5534–5562, Dec 2008.[37] A. G. Davoodi and S. A. Jafar, “GDoF of the MISO BC: Bridging the
gap between finite precision CSIT and perfect CSIT,” in 2016 IEEE
International Symposium on Information Theory (ISIT), July 2016,pp. 1297–1301.
[38] ——, “Transmitter cooperation under finite precision CSIT: A GDoFperspective,” IEEE Transactions on Information Theory, vol. 63, no. 9,pp. 6020–6030, Sept 2017.
[39] C. Hao, Y. Wu, and B. Clerckx, “Rate analysis of two-receiver MISObroadcast channel with finite rate feedback: A rate-splitting approach,”IEEE Transactions on Communications, vol. 63, no. 9, pp. 3232–3246,Sept 2015.
[40] M. Dai, B. Clerckx, D. Gesbert, and G. Caire, “A rate splitting strategyfor massive MIMO with imperfect CSIT,” IEEE Transactions on
Wireless Communications, vol. 15, no. 7, pp. 4611–4624, July 2016.[41] M. Dai and B. Clerckx, “Multiuser millimeter wave beamforming
strategies with quantized and statistical CSIT,” IEEE Transactions on
Wireless Communications, vol. 16, no. 11, pp. 7025–7038, Nov 2017.[42] A. Papazafeiropoulos, B. Clerckx, and T. Ratnarajah, “Rate-splitting to
mitigate residual transceiver hardware impairments in massive MIMOsystems,” IEEE Transactions on Vehicular Technology, vol. 66, no. 9,pp. 8196–8211, Sept 2017.
[43] B. Rimoldi and R. Urbanke, “A rate-splitting approach to the Gaussianmultiple-access channel,” IEEE Transactions on Information Theory,vol. 42, no. 2, pp. 364–375, Mar 1996.
[44] S. S. Christensen, R. Agarwal, E. D. Carvalho, and J. M. Cioffi,“Weighted sum-rate maximization using weighted MMSE for MIMO-BC beamforming design,” IEEE Transactions on Wireless Communi-
cations, vol. 7, no. 12, pp. 4792–4799, Dec 2008.[45] B. Zheng, X. Wang, M. Wen, and F. Chen, “NOMA-based multi-pair
two-way relay networks with rate splitting and group decoding,” IEEEJournal on Selected Areas in Communications, vol. 35, no. 10, pp.2328–2341, Oct 2017.
[46] H. Viswanathan, S. Venkatesan, and H. Huang, “Downlink capacityevaluation of cellular networks with known-interference cancellation,”IEEE Journal on Selected Areas in Communications, vol. 21, no. 5,pp. 802–811, June 2003.