rate of adsorption of methanol at a polycrystalline pt ...measured based on hydrogen blocking. for...
TRANSCRIPT
Rate of Adsorption of Methanol at a Polycrystalline Pt
Electrode
by Sol Gilman
ARL-TR-6570 August 2013
Approved for public release; distribution unlimited.

NOTICES
Disclaimers
The findings in this report are not to be construed as an official Department of the Army position
unless so designated by other authorized documents.
Citation of manufacturer’s or trade names does not constitute an official endorsement or
approval of the use thereof.
Destroy this report when it is no longer needed. Do not return it to the originator.

Army Research Laboratory Adelphi, MD 20783-1197
ARL-TR-6570 August 2013
Rate of Adsorption of Methanol at a Polycrystalline Pt
Electrode
Sol Gilman
Sensors and Electron Devices Directorate, ARL
Approved for public release; distribution unlimited.

ii
REPORT DOCUMENTATION PAGE Form Approved OMB No. 0704-0188
Public reporting burden for this collection of information is estimated to average 1 hour per response, including the time for reviewing instructions, searching existing data sources, gathering and maintaining the
data needed, and completing and reviewing the collection information. Send comments regarding this burden estimate or any other aspect of this collection of information, including suggestions for reducing the
burden, to Department of Defense, Washington Headquarters Services, Directorate for Information Operations and Reports (0704-0188), 1215 Jefferson Davis Highway, Suite 1204, Arlington, VA 22202-4302.
Respondents should be aware that notwithstanding any other provision of law, no person shall be subject to any penalty for failing to comply with a collection of information if it does not display a currently valid
OMB control number.
PLEASE DO NOT RETURN YOUR FORM TO THE ABOVE ADDRESS.
1. REPORT DATE (DD-MM-YYYY)
August 2013
2. REPORT TYPE
Final
3. DATES COVERED (From - To)
4. TITLE AND SUBTITLE
Rate of Adsorption of Methanol at a Polycrystalline Pt Electrode
5a. CONTRACT NUMBER
5b. GRANT NUMBER
5c. PROGRAM ELEMENT NUMBER
6. AUTHOR(S)
Sol Gilman
5d. PROJECT NUMBER
5e. TASK NUMBER
5f. WORK UNIT NUMBER
7. PERFORMING ORGANIZATION NAME(S) AND ADDRESS(ES)
U.S. Army Research Laboratory
ATTN: RDRL-SED-C
2800 Powder Mill Road
Adelphi, MDS 20783-1197
8. PERFORMING ORGANIZATION REPORT NUMBER
ARL-TR-6570
9. SPONSORING/MONITORING AGENCY NAME(S) AND ADDRESS(ES)
10. SPONSOR/MONITOR’S ACRONYM(S)
11. SPONSOR/MONITOR'S REPORT NUMBER(S)
12. DISTRIBUTION/AVAILABILITY STATEMENT
Approved for public release; distribution unlimited.
13. SUPPLEMENTARY NOTES
14. ABSTRACT
Methanol continues to be the most likely practical fuel for fuel cells operating at low internal temperatures. Enhanced
knowledge of the electrochemistry of the anodic oxidation of methanol at platinum electrodes could assist in the attempts to
improve the platinum-based electrocatalysts that are commonly employed in that technology. Numerous studies of the overall
kinetics of the methanol anode have included identifying dissolved products and adsorbed species but little has been reported
on the quantitative rate of the adsorption process. In the lower range of potentials, where no oxidative products are released to
the electrolyte, the adsorption is initiated by an electrochemical dehydrogenation and follows Elovich kinetics. Specifically,
adsorbed anions affect both the rate of methanol adsorption and its oxidation to desorbed products.
15. SUBJECT TERMS
methanol anode, methanol fuel cell, adsorption of methanol, anion adsorption
16. SECURITY CLASSIFICATION OF: 17. LIMITATION OF ABSTRACT
UU
18. NUMBER OF PAGES
32
19a. NAME OF RESPONSIBLE PERSON
Sol Gilman a. REPORT
Unclassified
b. ABSTRACT
Unclassified
c. THIS PAGE
Unclassified
19b. TELEPHONE NUMBER (Include area code)
(301) 394-0339
Standard Form 298 (Rev. 8/98)
Prescribed by ANSI Std. Z39.18

iii
Contents
List of Figures iv
Summary 1
1. Introduction 3
2. Experimental 4
2.1 Supplies and Equipment ..................................................................................................4
2.2 Electrodes ........................................................................................................................4
2.3 Electrode Pre-Treatment..................................................................................................5
3. Results and Discussion 5
3.1 Polarization Curve for Methanol Oxidation ....................................................................5
3.2 Anodic Charge by Chronocoulometry ............................................................................6
3.3 Anodic Charge by Linear Anodic Scan ...........................................................................8
3.4 Measurement of Fractional Surface Coverage by Hydrogen
Underpotential Deposition ..............................................................................................8
3.5 Comparison of Qa with Qa’ .............................................................................................9
3.6 Comparison of Qa’ with QH ........................................................................................10
3.7 Kinetics of Methanol Adsorption Measured by Hydrogen Blocking ............................12
3.8 Dependence of Adsorption Rate on Methanol Concentration.......................................14
3.9 Dependence of Adsorption Rate on Electrode Potential ...............................................15
3.10 “Poisoning Effect” of Adsorbed Methanol ...................................................................17
3.11 Effect of Adsorbed Anions on the Adsorption and Oxidation of Methanol .................19
4. Conclusion 21
5. References 23
Distrbution List 25

iv
List of Figures
Figure 1. CV scan for methanol oxidation at a Pt electrode in 1 M HClO4 containing 0.005 M methanol. The electrode was pre-treated and then reduced at 0.06 V before scanning at 5 mV/sec. ...............................................................................................................................6
Figure 2. Values of charge corresponding to methanol adsorption: (a) at 0.4 V from a 0.001 M solution and (b) at 0.3 V from a 0.005 M solution of methanol. Qa = charge measured during adsorption. Q a’ = charge measured during linear anodic scan of adlayer. fractional surface coverage based on the hydrogen underpotential deposition (UPD). ....7
Figure 3. Representative anodic CV scans at 200 V/s for tracking (by oxidation) the adsorption of methanol at 0.4 V from a 0.001 M solution of methanol in a 1 M HClO4 supporting electrolyte.................................................................................................................8
Figure 4. Representative cathodic CV scans at 200 V/s for tracking (by hydrogen UPD) the adsorption of methanol from a 0.001 M solution of methanol in a 1 M HClO4 supporting electrolyte. ..................................................................................................................................9
Figure 5. Values of charge corresponding to oxidation of the methanolic adlayer and blocking of hydrogen adsorption sites at (a) 0.4 V, 0.001 M methanol and (b) 0.3 V, 0.005 M methanol. ...................................................................................................................11
Figure 6. Fractional surface coverage of electrode with methanol as determined by hydrogen blocking. Methanol adsorbed from (a) a 0.001 M solution of methanol and (b) a 0.005 M solution of methanol. ...............................................................................................................13
Figure 7. Dependence of adsorption rate on methanol concentration. Adsorption rates were measured at 0.4 V and a fractional surface coverage of 0.5. ...................................................15
Figure 8. Potential dependence of the methanol adsorption rate. .................................................16
Figure 9. Fractional surface coverage of methanol-free electrode with hydrogen. ......................17
Figure 10. Partial currents at 0.6 V. ..............................................................................................18
Figure 11. Dependence of oxidation/desorption current on methanolic surface coverage. ..........19
Figure 12. Effect of specifically adsorbed anions on anodic oxidation of methanol. ...................20
Figure 13. Effect of specifically adsorbed anions on the methanol adsorption rate. .....................21

1
Summary
Prior research on methanol adsorption/oxidation at the platinum/acid interface has concluded that
the adsorption process is oxidative, resulting in a number of surface species with various
stoichiometries and attachments to the surface. The methanolic surface species do not further
oxidize and desorb at potentials lower than ~0.5 V. One or more of those species can act as
intermediates or poisons in the further oxidation to desorbed products, depending on the
potential. The relative amounts of the various surface species has not yet been determined by
spectroscopy and attempts to do so using coulometry are hampered by the multiple possibilities
for surface bonding. However, some characterization is possible with respect to ratio of electrons
for adsorption for further oxidation and the ratio of electrons for either of the latter processes to
hydrogen adsorption sites. The values found in this study, >1, agree generally with those
reported by other investigators.
In spite of the complexity of the adlayer, it was possible to monitor the rate of the
oxidation/adsorption process and produce results with good regularity when the adsorption was
measured based on hydrogen blocking. For the range of potentials from 0.2 to 0.5 V versus the
reversible hydrogen electrode (RHE), where oxidation of methanol leads only to adsorption, the
Elovich equation applies very well for surface coverages >~0.1 and just before reaching plateau
levels. As expected, rates of adsorption vary linearly with the concentration of the methanol
solution when compared to a constant surface concentration. Rates of adsorption reported by
other investigators in a sulfuric acid supporting electrolyte are ~2 orders of magnitude slower
than those reported here, likely due to the effect of specific adsorption of bisulfate ions. Not
previously reported is the observation that the rate of adsorption below 0.5 V follows a Tafel
relationship down to a potential of ~0.2 V at a fixed coverage of the surface with the methanolic
adsorbate, suggesting that the oxidation/adsorption process is electrochemical rather than
chemical in nature and not a function of surface coverage with hydrogen atoms. Steric effects of
adsorbed hydrogen may be responsible for lower rates of adsorption at potentials of 0.1 V and
below. A Tafel plot provides an apparent value of n = 0.8. This could be tentatively interpreted
as corresponding to a 2-electron oxidation of methanol to a CHOH surface species with
transference number of 0.4.
A potential of 0.6 V was chosen to examine the effect of methanol on the current, (Iox), which
results in oxidation of methanol to the final desorbed products (reportedly, carbon dioxide,
formic acid, and formaldehyde). After correcting for the current corresponding to adsorption
only, the “turnover current,” Iox, was found to decline linearly with an increase of This
seems surprising at first considering that the rate of adsorption decreases exponentially with the
increase of reflecting surface inhomogeneity and the occupancy with adsorbed intermediates

2
at the sites with the highest heats of adsorption. This may imply that once adsorbed, the active
intermediate has relatively high mobility and good distribution on available surface sites.
Adsorbed chloride ions drastically reduce the rate of adsorption of methanol and the anodic
current corresponding to oxidation of methanol to final products, suggesting that both processes
involve the same dehydrogenation step. Adsorbed bisulfate ions have a moderate effect on the
initial rate of methanol adsorption, paralleling the observation that the anodic current is only
moderately affected.

3
1. Introduction
After many decades of research and development, ambient temperature methanol fuel cells are
emerging as a practical technology. However, fundamental improvements in the basic
components still limit wide-spread application of this power source. The present anodic
electrocatalyst is platinum (Pt)-based in an acid environment and the search for improvement in
the performance, reliability and cost of that component has been the chief motivation for
research in the area of adsorption/reaction mechanisms that has continued from the early 1960s
to the present day. Past results are summarized in several reviews (1–3) and many journal
articles, of which only a sampling are referenced in this report.
The study of methanol adsorption on Pt electrodes has involved using a variety of approaches
including various voltammetric techniques (1–14), radioisotope-tagged methanol and anions
(15–17), in-situ infrared spectroscopy and electron microscopy (18–24), online and in-situ mass
spectrometry (13, 26–28), and oriented single crystals (23, 25, 29). All of the results to date point
to a very complicated series of reactions that lead to the release of a number of final products of
reaction. The present qualitative understanding of the situation in acid electrolytes at near
ambient temperatures can be summarized as follows:
1. Starting with a bare surface and proceeding up the voltage scale from 0 V and below
~0.5 V versus the RHE, the currents that flow result in the accumulation of surface species
with no release of oxidation products (i.e., no “turnover” current) to the external electrolyte
as suggested by voltammetry and confirmed by in-situ mass spectrometry.
2. As suggested by the voltammetric results and confirmed by the more recent in-situ
analytical investigations (18, 19, 24, 25), the adlayer is comprised of a number of species
resulting from the partial dehydrogenation of methanol including CH2OH, CHOH, and
CHO that are bonded to one, two, and three Pt surface sites, respectively; and CO in the
one-site (linear or atop), two-site (bridged); and three-site configuration. The predominance
of any of these adsorbed species depends on the specific experimental conditions (e.g.,
potential, surface preparation, crystal orientation, and temperature).
3. The final products of methanol oxidation include formaldehyde, formic acid, methyl
formate, and carbon dioxide (CO2) (26, 27) resulting from the oxidative combination of
one or more of the adsorbed species with water or hydroxyl ions. The entire oxidative
process may involve desorption and readsorption/further oxidation of dissolved products
other than CO2. Adsorbed CO is the most refractory of the surface species and is often
considered to act as a “poison” to the production of the final products. However, at
sufficiently high potentials, the oxidation of adsorbed CO must also contribute to the total
anodic current and may indeed be the chief intermediate in any extent of CO2 production.

4
By the same token, any of the other more refractory adsorbed species may act as a “poison”
at lower potentials.
Measurements of methanol adsorption rates have been reported previously (4, 5, 14, 16, 27).
These have been largely fragmentary in any one particular study (e.g., single potential, different
acids, and different concentrations and surface preparation) and have been largely performed in a
sulfuric acid supporting electrolyte with results reflecting some competition with the bisulfate
anion, as shown in some of the referenced radioisotopic studies. The purpose of this study is to
reinvestigate the rate of initial formation of the methanolic adlayer in a perchloric acid (HClO4)
electrolyte that is generally viewed as presenting very low anion adsorption. Some exploration of
the effect of sulfate and chloride additions to the electrolyte was also conducted in this study.
2. Experimental
2.1 Supplies and Equipment
All measurements were made at room temperature (21 °C) in a 1 M solution of HClO4 with
various additions of Sigma-Aldrich spectrophotometric-grade methanol and reagent-grade
hydrochloric or sulfuric acids. The test vessel was fabricated of Pyrex glass containing two
platinized Pt counter electrodes isolated from the main compartment by glass frits. The acid
solution was prepared using “Millipore” water with a resistivity of 18.2 M-cm and redistilled
HClO4 (Sigma–Aldrich). Solutions were de-aerated with reagent grade argon for several hours.
Electrochemical measurements were made using a Gamry Reference 3000 potentiostat.
2.2 Electrodes
The working electrode was a commercially pure (CP) grade Pt wire of 0.08 cm diameter. The
wire was etched lightly in aqua regia, flame annealed, encased in shrinkable
polytetrafluoroethylene (PTFE) tubing to expose a 1 cm length with a geometric area of 0.26 cm2
and then lightly etched again. The working electrode was periodically immersed in hot chromic
acid cleaning solution to remove particularly refractory surface contamination. Based on
cathodic hydrogen deposition as previously described (31) and the assumption of
210 microcoulombs/cm2 for a smooth Pt
surface, this electrode had a hydrogen capacity,
SQH, of
107 microcoulombs, a roughness factor of 2.0 and a “hydrogen area,” AH, of 0.52 cm2. All
quantities expressed on a per cm2
basis below use the latter value of AH. The value of SQH
remained constant during several months of experimentation with the electrode.
The two counter electrodes were platinized Pt foils of 1 cm2 geometric area each. The use of a
Pd/H electrode as reference allowed very close placement parallel to the working electrode. It
was prepared as described previously (31). The Pd/H electrode was re-hydrogenated after several
days of use and its potential was monitored against a saturated calomel electrode (SCE) in a

5
separate vessel every few hours. Between re-hydrogenations, the electrode was found to maintain
a potential of ~0.02 V within a few millivolts versus the RHE. All potentials applied and
reported here were adjusted to that of a RHE.
2.3 Electrode Pre-Treatment
The general approach of using a staircase of pulses was used to condition the electrode and
prepare the surrounding electrolyte for controlled mass transport was described previously (31).
The following pretreatment was found to result in an extremely reproducible electrode reference
state as judged by the response to cathodic and anodic scans performed in the supporting
electrolyte. By that measure, a clean surface could be maintained for upwards of 1000 s when
methanol was not present:
1. 0 V for 1 s to desorb anions (with argon flow)
2. 1.8 V for 2 s to remove oxidizable organics (with argon flow)
3. 1.2 V for 30 s (with argon flow) to retain the oxidized surface that prevents adsorption of
organic impurities while sweeping oxygen away.
4. 1.2 V for 60 s (no argon) to continue to retain the oxidized surface while allowing the
electrolyte to become quiescent.
5. Potential step in the range 0.06 to 0.6 V for duration, t seconds to reduce the electrode
surface and to permit adsorption of methanol before applying a measurement scan or pulse.
3. Results and Discussion
3.1 Polarization Curve for Methanol Oxidation
A cyclic voltammetry (CV) scan for methanol appears in figure 1. At this slow sweep speed, the
anodic currents reflect “turnover” (rather than adsorptive) processes that release products of
oxidation to the electrolyte. Two aspects of the figure are particularly relevant to the present
study of adsorption:
1. Moving in the anodic direction, there is no significant current corresponding to product
release to the electrolyte below 0.4 V, as could be expected from the reported results of
online mass spectrometry (12). Therefore, oxidative currents measured at the lower
potentials correspond to adsorption.
2. Moving in the cathodic direction from high anodic potentials, no significant current is
observed above ~0.9 V. The electrode’s passivity under those circumstances was used in
designing the pre-treatment sequence described in section 2.3.

6
Figure 1. CV scan for methanol oxidation at a Pt electrode in 1 M HClO4 containing 0.005 M methanol.
The electrode was pre-treated and then reduced at 0.06 V before scanning at 5 mV/sec.
3.2 Anodic Charge by Chronocoulometry
After pre-treatment, the potential was pulsed to 0.4 V and the resulting anodic charge, Qa, was
recorded starting at 0.1 s. Plots of Qa versus time for 0.001 and 0.005 M methanol appear in
figure 2a and b, respectively. As there is no desorption of material (see section 3.1), Qa
corresponds to the accumulation on the surface of partially oxidized methanol.

7
Figure 2. Values of charge corresponding to methanol adsorption: (a) at 0.4 V from a 0.001 M
solution and (b) at 0.3 V from a 0.005 M solution of methanol. Qa = charge measured
during adsorption. Q a’ = charge measured during linear anodic scan of adlayer.
fractional surface coverage based on the hydrogen underpotential deposition (UPD).
a
b
8
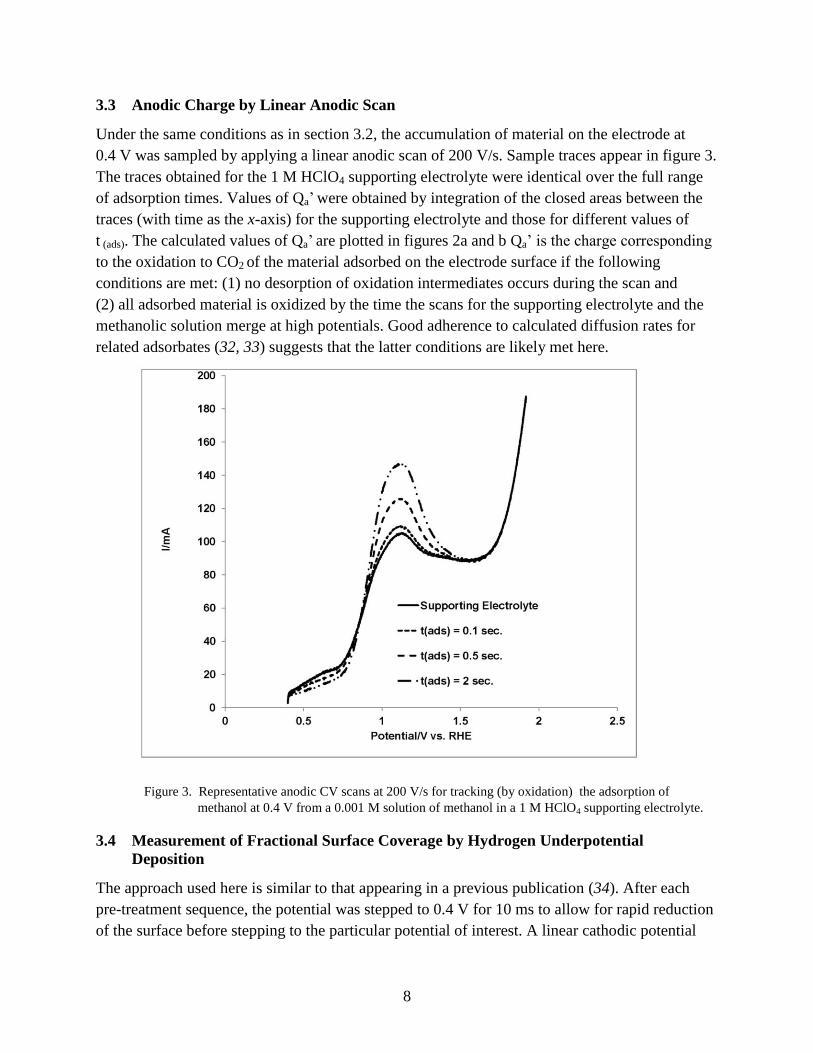
3.3 Anodic Charge by Linear Anodic Scan
Under the same conditions as in section 3.2, the accumulation of material on the electrode at
0.4 V was sampled by applying a linear anodic scan of 200 V/s. Sample traces appear in figure 3.
The traces obtained for the 1 M HClO4 supporting electrolyte were identical over the full range
of adsorption times. Values of Qa’ were obtained by integration of the closed areas between the
traces (with time as the x-axis) for the supporting electrolyte and those for different values of
t (ads). The calculated values of Qa’ are plotted in figures 2a and b Qa’ is the charge corresponding
to the oxidation to CO2 of the material adsorbed on the electrode surface if the following
conditions are met: (1) no desorption of oxidation intermediates occurs during the scan and
(2) all adsorbed material is oxidized by the time the scans for the supporting electrolyte and the
methanolic solution merge at high potentials. Good adherence to calculated diffusion rates for
related adsorbates (32, 33) suggests that the latter conditions are likely met here.
Figure 3. Representative anodic CV scans at 200 V/s for tracking (by oxidation) the adsorption of
methanol at 0.4 V from a 0.001 M solution of methanol in a 1 M HClO4 supporting electrolyte.
3.4 Measurement of Fractional Surface Coverage by Hydrogen Underpotential
Deposition
The approach used here is similar to that appearing in a previous publication (34). After each
pre-treatment sequence, the potential was stepped to 0.4 V for 10 ms to allow for rapid reduction
of the surface before stepping to the particular potential of interest. A linear cathodic potential

9
scan at 200 V/s was then applied to obtain the charge corresponding to hydrogen UPD, QH,
which could be accommodated on the surface partially covered by the methanolic adsorbate.
Representative traces for such scans appear in figure 4. Values of, QH were determined by
integration of the area (with adsorption time as the x axis) under the trace from 0.4 V to the
inflection point (corresponding to molecular hydrogen evolution) appearing at the most negative
t potentials. As only differences in QH are employed in the analyses below, changes in the
double-layer capacity are assumed to have only a small effect. Based on the blockage of
hydrogen adsorption sites, the fractional coverage of the surface, , with methanol is
= (SQH
-QH)/
SQH), (1)
where SQH is the “saturation coverage” with hydrogen of the bare surface. Values of are
plotted on figures 2a and b and used in figure 5 and in all subsequent figures.
Figure 4. Representative cathodic CV scans at 200 V/s for tracking (by hydrogen UPD) the adsorption of
methanol from a 0.001 M solution of methanol in a 1 M HClO4 supporting electrolyte.
3.5 Comparison of Qa with Qa’
As discussed above, Qa is the charge passed when methanol is adsorbed and Qa’ is the charge
corresponding to further oxidation/desorption of the resulting adlayer. At 0.4 V, no desorption of
adsorption/oxidation products to the electrolyte is expected (see section 3.1). From figures 2a
and b, the ratio Qa/Qa’ = ~1.4 for most of the range of surface coverages encountered and for the

10
two concentrations explored at 0.4 V. Most of the spectroscopic evidence (18, 19, 21, 24, 27)
suggests that the methanolic adlayer consists of variously bonded species with the stoichiometry
CHO and CO. For CO only, (4e oxidation to CO and 2e oxidation to CO2), the expected ratio
Qa/Qa’ would be 2.0. For CHO (only 3e oxidation to CHO and 3e oxidation to CO2), the
expected ratio Qa/Qa’ would be 1.0. For a mixture of the two stoichiometries, the ratio Qa/Qa’
would be given by equation 2:
Qa/Qa’ = (4 P +3)/(3-P), (2)
where P = percentage of the adlayer having the CO stoichiometry. For Qa/Qa’ = 1.4, the CHO
and CO stoichiometries would be present in equal amounts. Similar results were obtained by
Wilhelm et al (26). However, there is also evidence for a CH2O stoichiometry (24), which would
have a downward effect on Qa/Qa’.
3.6 Comparison of Qa’ with QH
As discussed in section 3.5, Qa’ is the charge corresponding to oxidation of the adlayer to CO2.
QH = SQH – QH corresponds to the hydrogen adsorption sites blocked by the methanolic
adlayer. The ratio, Qa’/QH = R represents the average number of electrons per hydrogen site for
the oxidation of the methanolic adlayer. Plots of Qa’, QH, and R for 0.4 V, 0.001 M methanol
and 0.3 V, 0.005 M methanol, appear in figures 5a and b, respectively. For both potentials and
concentrations, R drops from an initial value of ~2 to a final value of ~1.2. This is similar to
results reported by Leiva et al. (10) for a sulfuric-acid-supporting electrolyte and was ascribed to
the presence of mainly bridged CO (linear or “atop” CO would result in R=2). However,
considering all of the possible hydrogen-containing fragments and bondings, the R values can
probably only be used to further indicate the complexity of the adlayer and provide motivation
for investigating hydrogen blocking as the method for following the kinetics of the adsorption
process. Values of R between 1.1 and 1.2 have also been reported by a number of investigators
(1) for a wide range of methanol concentrations, electrode activations, and supporting
electrolytes.

11
Figure 5. Values of charge corresponding to oxidation of the methanolic adlayer and blocking of hydrogen
adsorption sites at (a) 0.4 V, 0.001 M methanol and (b) 0.3 V, 0.005 M methanol.
a
b

12
3.7 Kinetics of Methanol Adsorption Measured by Hydrogen Blocking
The results appearing in figures 6a and b were obtained using the procedure discussed in section
3.4. For both concentrations of methanol, the time dependence of fractional surface overage for
adsorption potentials from 0.1 to 0.5 V follow the parallel dashed lines in the figures and
suggests adherence to the Elovich (or Roginsky-Zeldovich) equation (35) for adsorption on a
heterogeneous surface:
ddtads = kCe-m
where C is the concentration of adsorbate and k and m are constants.
In integrated form,
lnCln tads/m, (4)
where A is a lumped constant.
The semi-logarithmic relationships of figures 6a and b hold for fractional coverages below 0.1 to
0.5 or higher. Where the linear relationship holds,
ddtads = S/ tads., (5)
where S is the slope of the parallel lines of figures 6a and b and has the value 0.09tads monolayer.

13
Figure 6. Fractional surface coverage of electrode with methanol as determined by hydrogen blocking.
Methanol adsorbed from (a) a 0.001 M solution of methanol and (b) a 0.005 M solution of
methanol.
a
b

14
Given the irreversible nature of the adsorption, the plateau values of do not have
thermodynamic significance, but represent steric limitation; higher values can be anticipated for
extended periods of time. As is shown below, the spacing between the parallel dashed lines
suggest the existence of a Tafel relationship when a comparison is made between the rates of
adsorption at different potentials for fixed values of It can be seen that rates diminish for
potentials above 0.5 V in figure 6a. This coincides with the observation of production and
desorption of soluble oxidation products as mentioned in section 3.1.
Bagotzky and Vassiliev (2) were first to recognize that that the Elovich equation can be applied
to the adsorption of methanol and other small organic molecules. Their study was performed
using sulfuric acid as the supporting electrolyte. Their reported rates were significantly lower
than those reported here. Specifically, in figure 6 of that paper, at 0.4 V and at a concentration of
0.005 M methanol, half the plateau value is reached in approximately 20 s, versus 2 s in this
study. The difference is likely due to the effect of specifically adsorbed sulfate ion as is
discussed in a section below.
3.8 Dependence of Adsorption Rate on Methanol Concentration
versus log time data similar to that of figures 6a and b was obtained at 0.4 V and a range of
methanol concentrations. Rates of adsorption at = 0.5 were taken from the plots and the
results were plotted against the methanol concentration in figure 7 to test the concentration
dependence predicted by equation 3. The trendline in figure 7 shows that the anticipated linear
relationship between adsorption rate and concentration is good.

15
Figure 7. Dependence of adsorption rate on methanol concentration. Adsorption rates were measured at
0.4 V and a fractional surface coverage of 0.5.
3.9 Dependence of Adsorption Rate on Electrode Potential
For an irreversible anodic reaction, the Tafel Equation can be written as (36)
U-Uo = a – b log i (6)
b is the Tafel slope = 2.303 RT/nF,
where = symmetry (transfer) coefficient
n = number of electrons in the rate-determining step
U = electrode potential vs. the reference electrode
F, R & T have their usual meanings.
Figure 8 applies equation 7 to the experimental – tads data obtained through hydrogen-
blocking experiments. For this purpose, the values of appearing in figures 6a and b were
converted to QH by multiplying by SQH and re-plotting. Rates of adsorption as virtual current,
Iads, were obtained from the slopes of the linear sections of the plots, at points corresponding to
= 0.2. The resulting values of Iads versus U are plotted in figure 8. As the linear sections of
the and corresponding QH vs. log tads plots are parallel, points corresponding to any other

16
value of in the linear regions of those plots would yield the same slopes for the of Iads versus
U plots. The dashed line in figure 8 is the computer-generated trendline for the 0.005 M
methanol points. The points for the 0.001 M methanol are (with the exception of the 0.5-V
result) parallel to those for the higher concentration in accordance with the concentration
dependence discussed in section 3.8. The trendline has a Tafel slope of 80 mV, which
corresponds to n = 0.8. This could be interpreted as corresponding to a 2-electron
dehydrogenation process (to an HCOH stoichiometry) if = 0.4. The particularly high value of
Iads at 0.5 V for the lower methanol concentration may be due to incipient “turnover” current.
Figure 9 presents values of hydrogen surface coverage, for the methanol-free surface
obtained by integrating the charge measured during a slow anodic scan. A comparison of figures
8 and 9 leads to the conclusion that the Tafel relationship holds from (at 0.1 V) to 0
(above 0.4 V). Hence, the suggestion (1, 2) that methanol coverage declines at low potentials due
to blockage by adsorbed hydrogen may be true only for , the effect being steric in nature.
Potentials lower than 0.1 V were not explored here because the molecular hydrogen generated
interferes with the accurate measurement of QH and the higher adsorption times tend to fall
outside of the retention of surface purity as measured in the supporting electrolyte. A Tafel slope
of 120 mV was reported by Herrero et al. (8) through analysis of the early transient current
obtained on stepping from a low (methanol-free) potential for 110- and 100-oriented single
crystals of Pt. That result probably applied to
Figure 8. Potential dependence of the methanol adsorption rate.

17
Figure 9. Fractional surface coverage of methanol-free electrode with hydrogen.
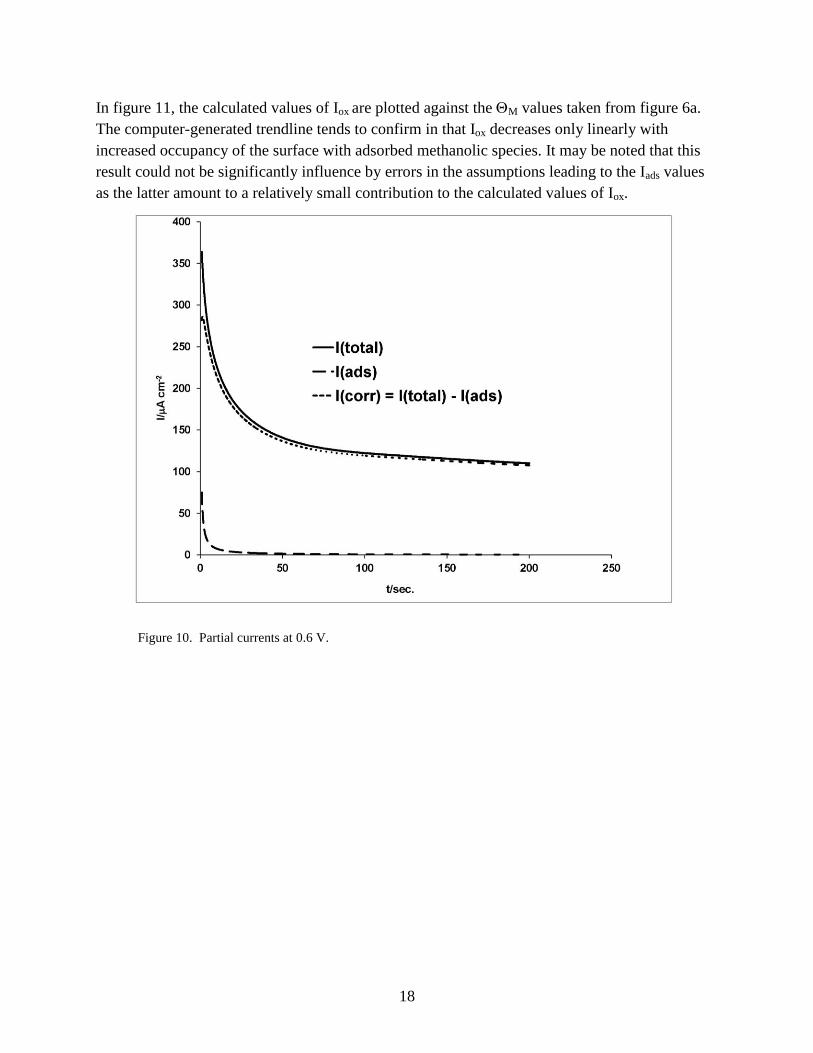
3.10 “Poisoning Effect” of Adsorbed Methanol
As mentioned in section 1, the methanolic adlayer has been shown to contain species with a
number of stoichiometries and modes of attachment to the surface. The purpose of this section of
the present study was to examine how affects the current that flows at the low end of anodic
overvoltage that is most relevant to the fuel cell application. The electrode potential, 0.6 V was
chosen for examination because it is possible to make a good differentiation at that potential
between the fractions of the total current Itotal that lead to surface accumulation only (Iads) and to
oxidation to products that are desorbed and released to the solution (Iox). Figure 10 shows the
partial currents obtained as follows:
1. After the usual activation steps, the electrode was reduced at 0.4 V for 0.1 s and stepped to
0.6 V, and Itotal was recorded.
2. The M versus log tads plot of figure 6a was converted to the corresponding current using
equation 5. That current, which corresponds to hydrogen site occupancy, was converted to
the virtual oxidation/adsorption current, Iads, by multiplying by the product of plateau
ratio’s of figures 2a and 5a (1.4 and 1.22, respectively).
3. Iox, was obtained by subtracting Iads from Itotal.
18
In figure 11, the calculated values of Iox are plotted against the M values taken from figure 6a.
The computer-generated trendline tends to confirm in that Iox decreases only linearly with
increased occupancy of the surface with adsorbed methanolic species. It may be noted that this
result could not be significantly influence by errors in the assumptions leading to the Iads values
as the latter amount to a relatively small contribution to the calculated values of Iox.
Figure 10. Partial currents at 0.6 V.

19
Figure 11. Dependence of oxidation/desorption current on methanolic surface coverage.
3.11 Effect of Adsorbed Anions on the Adsorption and Oxidation of Methanol
The negative effect of adsorbable anions, including bisulfate and chloride ions on the anodic
oxidation of methanol on Pt electrodes is well known (2, 4, 9, 15, 37). For platinized Pt
electrodes, Horanyi and Vertes (15) using a 36
Cl- radiotracer showed that the methanol displaced
specifically adsorbed chloride ions in a perchloric acid electrolyte. In a 0.5 M sulfuric acid
electrolyte at 0.5 V, Sobkowsky and Wiekowski (16) showed that added chloride ions decreased
the rate of adsorption of methanol on a platinized Pt electrode. The purpose of this part of the
present investigation was to obtain preliminary information on the effect on adsorption of the
more strongly adsorbed chloride ion and the relatively weakly adsorbed sulfate ion on methanol
adsorption/oxidation under the same conditions as in the other sections of this report. The
polarization curves of figure 12 were obtained by applying an anodic scan of 5 mV/s to the
electrode after activation and reduction at 0.4 V. The supporting electrolyte was 1 M HClO4 for
all three traces. At this slow sweep speed, the currents correspond mainly to methanol
“turnover,” the currents due to adsorption/surface accumulation of methanol being negligible.
From the figure it can be seen that the addition of sulfuric acid mainly reduces the peak oxidation
current, whereas the addition of hydrochloric acid virtually eliminates the oxidation of methanol
at low potentials.

20
Figure 12. Effect of specifically adsorbed anions on anodic oxidation of methanol.
The adsorption of methanol in the presence of chloride and sulfate ions was followed using the
same procedure as in section 3.4: after activation, the potential was stepped to 0.4 V to allow for
adsorption of both methanol and the anions. Under those conditions, the starting fractional
surface coverage (based on hydrogen adsorption sites) of chloride ions would be at the
equilibrium values of 0.3 (38). The starting coverage with sulfate ions would be approximately
0.05 based on the results reported by Dalbeck and Vielstich (39). Application of a linear cathodic
scan at 200 V/s, allows one to determine M as in section 3.4 without interference by the
adsorbed anions, as the latter are completely desorbed during the scan and do not affect the
measured values of QH (4, 40). Figure 13 compares the time dependence of M under the
described conditions. It can be seen that adsorbed chloride ions cause a decrease in the rate of
methanol adsorption of approximately three orders of magnitude, paralleling the extreme
decrease in anodic oxidation current apparent in figure 12. As the coverage with Cl- is far from
complete, this implies more than a simple steric effect on the initial dissociation/adsorption of
methanol. This also exceeds the one order of magnitude decrease in adsorption rate that would be
expected if the effect of the adsorbed Cl- were simply to occupy the sites with the highest heats
of adsorption, similar to adsorbed methanol itself. The concurrent extreme effect of Cl-
adsorption on the polarization curve (i.e., on Iox) suggests that both processes are dependent on
the same initial dehydrogenation step. This contrasts sharply with the competitive adsorption of
CO and Cl- (40), which involves no dissociation in the adsorption of the organic molecule. The

21
adsorption of CO is diffusion-controlled both in the absence and presence of Cl-, readily
displacing the anion from the surface. On the other hand, the adsorption of ethane, which does
involve initial dehydrogenation, is noticeably affected by Cl- (41) but to a lesser extent than is
methanol adsorption. The effect of sulfate ions on M is much less pronounced and the effect is
largely gone at tads > 100 s. This parallels the slight effect that sulfate ions have on the anodic
oxidation of methanol as seen in figure 12 (below the peak current).
Figure 13. Effect of specifically adsorbed anions on the methanol adsorption rate.
4. Conclusion
The use of a “staircase” of potentials provides a highly reproducible surface state on a Pt
electrode, allowing detailed analysis of the kinetics of adsorption of organic substances. For
methanol, adsorption is best monitored by the blocking effect on hydrogen UPD. Below ~0.5 V
versus a reference RHE, adsorption of methanol occurs with only the accumulation of partially
oxidized methanolic species. Above that potential, more complete oxidation of methanol leads to
desorbed final products of oxidation. Therefore, the adsorption processes can be studied in detail
in the lower potential range. In that range of potentials, the rate of methanol adsorption was
found to follow classical laws for an electrochemical oxidation process (i.e., Tafel relationship),
which is also dependent on the extent of occupancy of heterogeneous surface sites (i.e., Elovich

22
equation). Adsorbed methanol has a linear “poisoning effect” on the anodic current that produces
final products at potentials higher than ~0.5 V. Adsorbed chloride ions drastically reduce both
the adsorption of methanol and the anodic current. The effect of bisulfate ions is only moderate
by comparison.

23
5. References
1. Parsons, R.; Vandernoot, T. J. Electroanal. Chem. 1998, 257, 9–45.
2. Handbook of Fuel Cells, vol. 2, chapter 41 by T. Iwasita, pub. By John Wiley & Sons, Ltd,
edited by W. Vielstich, A. Lamm and H Gasteiger, 2003.
3. Wasmus, S.; Kuver, A. J. Electroanal. Chem 1999, 461, 14–31.
4. Bagotzky, V. S; Vassillyev, Yu. B.; Weber, J.; Pirtskhalava J. N. J Electroanal. Chem.
1970, 27, 31–46.
5. Bagotzky, V. S.; Vassiliev, Yu. B. Electrochim. Acta 1966, 11, 1439–1461.
6. Bagotzky, V. S.; Vassiliev, Yu. B.; Khazova O. A. J. Electroanal. Chem. 1977, 81, 229–
238.
7. Gasteiger, H. A.; Markovic, N.; Ross, Jr., P. N.; Cairns, E. J. J. Electrochem. Soc. 1994,
141, 1795–1803.
8. Herrero, E.; Franaszczuk, K.; Wieckowski', A. J. Phys Chem. 1994, 98, 5074–5083.
9. Kamath, V. N.; Lal, H. J. Electroanal. Chem. 1970, 24, 125–135.
10. Leiva, E.P.M.; Giordano, M. C. J. Electroanal. Chem. 1083, 158, 115–130.
11. Wilhelm, S.; Iwasita, T.; Vielstich, W. Electroanal. Chem. 1987, 238, 383–391.
12. Xu, W.; Lu, T.; Liu, C.; Xing, W. J. Phys Chem. B 2006, 110, 4802–4807.
13. Hao, E.; Scott, Yu, K.; Reeve, R. W. J. of Electroanal. Chem. 2003, 547, 17–24.
14. Leiva, E.P.M.; Giodano, M. C. J. Electroanal. Chem. 1983, 158, 115–130.
15. Horanyi, G.; Vertes, G. Electroanal. Chem. and Interfacial Electrochem. 1974, 51, 417–
423.
16. Sobkowski, J.; Wieckowski, A. J. Electroanal. Chem. and Interfacial Electrochem. 1973,
41, 373–379.
17. Podlovchenko, I.; Kazarinov, V. E.; Stenin, V. F. Soviet Electrochem. 1970, 6, 241–252.
18. Beden, B.; Lamy, C.; Bewick, A.; Kunimatsu, K. J. Electroanal. Chem. 1981, 121 343–347.
19. Beden, B.; Juanto, S.; Leger, J. M.; Lamy, C. J. Electroanal. Chem. 1987, 238, 323–331.
20. Gasteiger, H. A.; Ross Jr., P. N.; Cairns, E. J. Surf. Sc. 1993, 293, 87–80.

24
21. Kunimatsu, K. J. of Electron Spectroscopy and Related Phenomena 1983, 30, 215–220.
22. Legar, J. M. J. Appl. Electrochem. 2001, 31, 767‒771.
23. Xia, X. H.; Iwasita, T.; Ge, F.; Vielstich, W. Electrochim. Acta 1996, 41, 71 l‒718.
24. Iwasita, T.; Nart, F. C. J. Electroanal. Chem. 1991, 317, 291–298.
25. Juanto, S.; Beden, B.; Hahn, F.; Legar, J. M.; Lamy, C. J. Electroanalyt. Chem. 1987, 237,
119–129.
26. Wang, H.; Loffler, T.; Baltruschat, H. J. Appl Electrochem. 2001, 31, 759–765.
27. Wilhelm, S.; Iwasita, T.; Vielstich, W. J. Electroanal. Chem. 1987, 238, 383–391.
28. Iwasita, T.; Vielstich, W. J. Electroanal. Chem 1986, 201 403–408.
29. Herrero, E.; Franaszczuk, K.; Wieckowski, A. J. Phys. Chem. 1994, 98, 5074–5083.
30. Tripkovic, A. V.; Popvic, K. D.; Momcilovic, J. D.; Drazic, D. M. Electrochimica Acta
1998, 44 1135–1145.
31. Gilman, S. Electrochimica Acta 2012, 65, 141–148.
32. Gilman, S. J. Electroanal Chem 2013, 692, 53–59.
33. Gilman, S. J. Phys. Chem. 1963, 67, 78–84.
34. Gilman, S. J. Power Sources 2012, 197 65–71.
35. Physical Chemistry of Surfaces, 3rd edition, John Wiley and Sons Inc., New York, 1976, p.
650.
36. Analytical Electrochemistry, third edition by Joseph Wang, John Wiley and Sons, 2006 p.
15.
37. Electrochemical Processes in Fuel Cells by M. W. Breiter, Springer-Verlag, 1965.
38. Gilman, S. J. Phys. Chem. 1964, 68, 2099–2111.
39. Dalbeck, R.; Vielstich, W. Electrochim. Acta 1995, 40, 2687–2688.
40. Gilman, S. J. Phys. Chem. 1964, 68, 2112–2119.
41. Gilman, S. J. Phys . Chem. 1967, 71, 2424–2433.

25
1 DEFENSE TECHNICAL
(PDF) INFORMATION CTR
DTIC OCA
2 DIRECTOR
(PDFS) US ARMY RESEARCH LAB
IMAL HRA MAIL & RECORDS MGMT
RDRL CIO LL TECH LIBRARY
6 US ARMY RSRCH LAB
(PDFS) RDRL SED E J SHAFFER
RDRL SED C
C LUNDGREN
D CHU
R JIANG
W BEHL
J READ
1 CERDEC HDQ
(PDF) ATTN EDWARD PLICHTA

26
INTENTIONALLY LEFT BLANK.