raster-based floristic quality index: proof of concept
TRANSCRIPT

ERDC/EL TN-20-1 September 2020
Raster-Based Floristic Quality Index:
Proof of Concept by Glenn M. Suir, Melissa V. Carle, J. Mason Harris,
Charles E. Sasser, and Christina L. Saltus
PURPOSE: The purpose of this study was to develop and demonstrate a raster-based floristic quality index (FQIraster) as a proof of concept. This raster-based approach leverages many of the advantages of high spatial, spectral, and temporal resolution space-borne imagery as well as established remote sensing techniques (vegetation indices and feature classification) to provide rapid measures of vegetation productivity and biodiversity. The developed method should provide researchers and managers a new tool for quantifying and tracking the condition, response, and recovery of expansive wetland landscapes.
INTRODUCTION: Structural components of coastal wetlands typically used to assess vegetative characteristics and serve as indicators of wetland condition include plant density, cover, biomass, and species composition (Chamberlain and Ingram 2012, 416; Cretini et al. 2012, 2390). To aid the assessment of these critical wetland and forested habitats, the floristic quality index (FQI) metric identifies and monitors landscapes, evaluates direct and indirect episodic impacts, measures ecosystem condition, and evaluates restoration measures (Bourdaghs, Johnston, and Regal 2006, 719; Fennessy et al. 2002; Gianopulos 2014, 6). The FQI provides an estimate of habitat quality based on a measure of nativeness, called the coefficient of conservatism (CC), and the quantity of a plant community—typically as a measure of vegetation cover (Gianopoulos 2014, 6). In recent years, researchers have increasingly used the FQI to evaluate the integrity of plant communities and assess restoration projects throughout the United States (Cretini et al. 2018). The Louisiana Coast-Wide Reference Monitoring System (CRMS) program, responsible for monitoring and quantifying ecological conditions of the state’s coastal wetlands, uses an FQI as one of its primary vegetation indices (Cretini et al. 2018, 8).
Traditionally, researchers have collected and determined vegetation-based metrics through labor-intensive, ground-based surveys (Tucker, Townsend, and Goff 1995, 369). But time, access, and resource restrictions often hinder surveys across large wetland landscapes, even if these in situ data prove useful. Previous studies have shown that remote sensing data and applications can significantly supplement traditional field-based collections (Suir 2018, xi). They provide critical knowledge to more efficiently inventory and monitor wetland resources, forecast resource conditions and stability, and formulate adaptive management strategies (Suir 2018, xii). Generating floristic quality information for large expanses of wetland ecosystems requires remote sensing methodologies. The primary purpose of this technical note is to describe the development of a working FQIraster system.
Approved for public release; distribution is unlimited.

2
ERDC/EL TN-20-1 September 2020
METHODS: This technical note provides general descriptions of the data and methods used in traditional field-based FQI assessments as well as the data acquisition, pre- and postprocessing, and methodology used in the development of the FQIraster proof of concept. The method development described in this report used existing classified wetland vegetation data and normalized difference vegetation index (NDVI) data, both derived from high-resolution satellite imagery (Carle 2013). This model uses that vegetation data, which consists of dominant herbaceous marsh species, in conjunction with established CC values to measure vegetation quality. The NDVI data, which estimate aboveground biomass, primary productivity, and wetland species distributions, also provide a measure of vegetation quantity (An, Price, and Blair 2013, 3719; Steyer, Couvillion, and Barras 2013, 118).
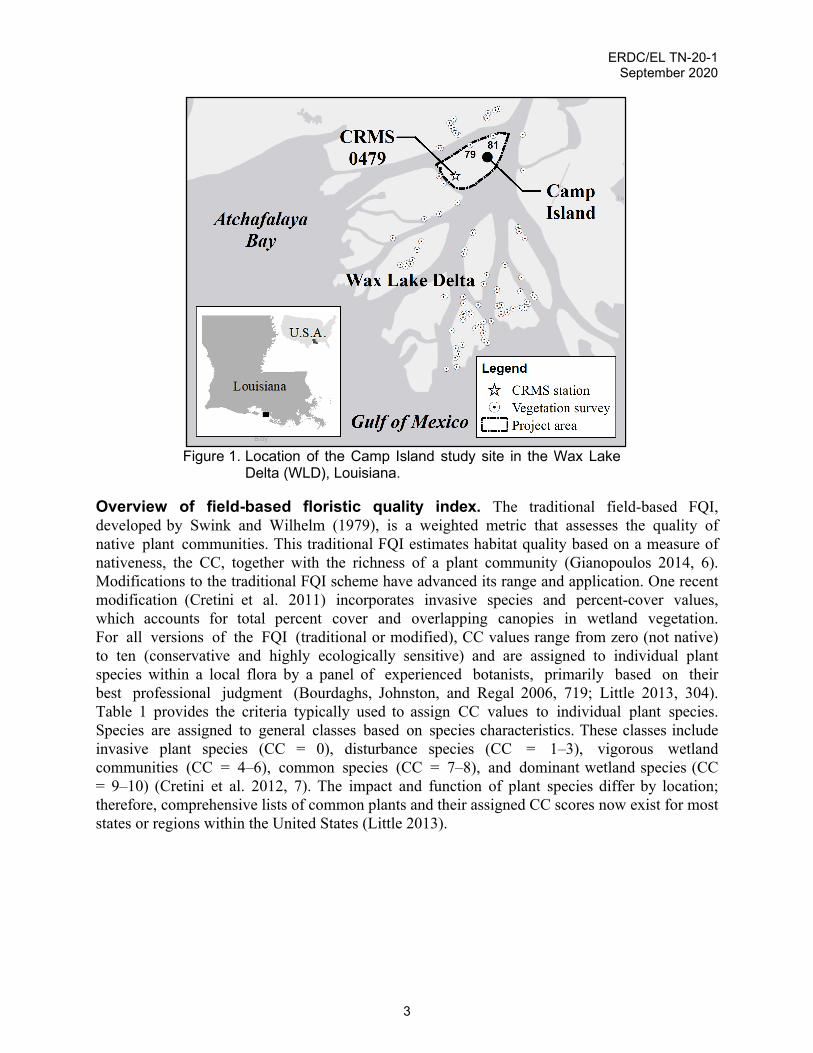
Study area. Carle (2013) describes the study area, located within the Wax Lake Delta (WLD):
a small, actively prograding young bayhead delta that is part of the greater Mississippi River deltaic system in coastal Louisiana [figure 1]. . . . The [WLD] is located at the mouth of the Wax Lake Outlet, an artificial diversion of the Atchafalaya River built in 1941 to protect Morgan City, Louisiana from flooding. . . . The [WLD] first emerged from Atchafalaya Bay following record flooding on the lower Mississippi River in 1973 and 1975. (12)
The delta has since continued to accrete both vertically and horizontally, and by 1997, the river had built 51.1 km2 of new land (Roberts et al. 1997, 477).1 Freshwater wetland plants rapidly colonized these new, shallow islands in the delta, trapping additional sediments with their roots and further increasing elevation (Llewellyn and Shaffer 1993, 177; Shaffer et al. 1992, 678). This increased elevation leads to the invasion of additional species, which often displace the initial colonizing species or limit them to lower elevations (Johnson, Sasser, and Gosselink 1985, 984; Shaffer et al. 1992, 678). The WLD thus provides a good example of primary succession, creating an excellent opportunity to study plant community development in a newly created sedimentary environment (Carle 2013, 12). The area of interest for this study is Camp Island, a young island at the northern-most reach of the prograding bayhead delta (figure 1).
1. For a full list of the spelled-out forms of the units of measure used in this document, please refer toUS Government Publishing Office Style Manual, 31st ed. (Washington, DC: US Government Publishing Office, 2016), 248–52, https://www.govinfo.gov/content/pkg/GPO-STYLEMANUAL-2016/pdf/GPO-STYLEMANUAL-2016.pdf.
ERDC/EL TN-20-1 September 2020
3
Figure 1. Location of the Camp Island study site in the Wax Lake Delta (WLD), Louisiana.
Overview of field-based floristic quality index. The traditional field-based FQI, developed by Swink and Wilhelm (1979), is a weighted metric that assesses the quality of native plant communities. This traditional FQI estimates habitat quality based on a measure of nativeness, the CC, together with the richness of a plant community (Gianopoulos 2014, 6). Modifications to the traditional FQI scheme have advanced its range and application. One recent modification (Cretini et al. 2011) incorporates invasive species and percent-cover values, which accounts for total percent cover and overlapping canopies in wetland vegetation. For all versions of the FQI (traditional or modified), CC values range from zero (not native) to ten (conservative and highly ecologically sensitive) and are assigned to individual plant species within a local flora by a panel of experienced botanists, primarily based on their best professional judgment (Bourdaghs, Johnston, and Regal 2006, 719; Little 2013, 304). Table 1 provides the criteria typically used to assign CC values to individual plant species. Species are assigned to general classes based on species characteristics. These classes include invasive plant species (CC = 0), disturbance species (CC = 1–3), vigorous wetland communities (CC = 4–6), common species (CC = 7–8), and dominant wetland species (CC = 9–10) (Cretini et al. 2012, 7). The impact and function of plant species differ by location; therefore, comprehensive lists of common plants and their assigned CC scores now exist for most states or regions within the United States (Little 2013).

ERDC/EL TN-20-1 September 2020
4
Table 1. General description and criteria for assignment of coefficient of conservatism (CC) scores (based on Andreas, Mack, and McCormac 2004; Cohen, Carstenn, and Lane 2004; Cretini et al. 2012).
General characteristics of species Criteria CC
Invasive plant species Obligate to ruderal areas 0
Plants that are opportunistic users of disturbed sites
Occurs more frequently in ruderal areas than natural areas 1
Facultative to ruderal and natural areas 2
Occurs less frequently in ruderal areas than natural areas 3
Plants that occur primarily in less vigorous coastal wetland communities
Occurs much more frequently in natural areas than ruderal areas 4
Obligate to natural areas (quality of area is low) 5
Weak affinity to high-quality natural areas 6
Plants that are common in vigorous coastal wetland communities
Moderate affinity to high-quality natural areas 7
High affinity to high-quality natural areas 8
Plants that are dominants in vigorous coastal wetland communities
Very high affinity to high-quality natural areas 9
Obligate to high-quality natural areas 10
Some states, like Louisiana, have established monitoring programs with standardized methods for monitoring variables that are useful in determining the performance of natural and restored wetlands. One such program, the CRMS, collects, processes, and analyzes physical, chemical, biological, and geospatial data. These data allow researchers and natural resource managers to characterize and compare wetland hydrology, ecology, soil, and geomorphology conditions across project and nonproject areas throughout coastal Louisiana (Steyer et al. 2003; Wang et al. 2017; Cretini et al. 2011). The CRMS is part of the large-scale Coastal Wetlands Planning, Protection, and Restoration Act (CWPPRA) program. Each CRMS site (approximately 390 sites in coastal Louisiana) contains multiple stations (that is, vegetation, hydrology, and soils sampling stations) whose data researchers use to create measures of wetland condition (that is, FQI). In 2011 the CRMS Vegetation Analytical Team developed a modified floristic quality index (FQImod) scheme and established a detailed list of associated CC values for common plants in coastal Louisiana wetlands (Cretini et al. 2018). The FQImod uses a two-pronged approach to account for sample units with vegetation cover that is less than or equal to 100% or is greater than 100% (that is,

ERDC/EL TN-20-1 September 2020
5
overlapping canopies). If the sum of species covers within a sample unit at time t is less than or equal to 100, the applicable formula is as follows:
( )mod
COVER CCFQI 10
100it i
t
∑ = ×
× (1)
where FQImod t is the modified floristic quality index (unitless), COVERit is the percent cover (%) for species i at a sample unit, within a sample site, at time t, and CCi is the coefficient of conservatism for species i (table 1).
By using 100 in the denominator (instead of the actual sum of species covers), researchers can differentiate between wetlands of similar composition (for example, vigorous wetlands) by using normalized biomass (estimated through cover) (Cretini et al. 2012). For consistency with other CRMS and CWPPRA metrics and indices, the FQImod values are multiplied by 10 to scale the scores from 0 to 100 (Cretini et al. 2018, 461).
If the sum of species covers within a sample unit at time t is greater than 100, the following formula applies:
( )( )mod
COVER CC FQI 10
TOTAL COVERit i
tt
∑= ×
× ∑ (2)
where TOTAL COVERt refers to the percent cumulative species cover (expressed as a percentage) within a sample unit (Cretini et al. 2012, 2393). FQI scores provide measurements of vegetation condition and maturity. Low FQI values (<50) can indicate early successional vegetation communities, highly disturbed or early postdisturbance evolution, or other presses or pulses that negatively affect wetland function. Conversely, high FQI values (>50) typically indicate mature, stable, and undisturbed wetlands (Suir and Sasser 2017, 29).
Vegetation survey data and FQImod scores, which are collected and calculated annually for each CRMS marsh site (Cretini and Steyer 2011), were downloaded from the CRMS website (https://lacoast.gov/crms2/Home.aspx). CRMS station 0479, located in the Camp Island study site (figure 1), provided useful data for assessing the accuracy of vegetation classification and evaluating the FQIraster proof of concept. See Cretini and Steyer (2011) for more detailed information on the CRMS-based FQImod data and tools.
Method development. FQIraster. The purpose of developing an FQIraster system is to advance the traditional FQI process beyond one reliant on discrete and labor-intensive field data collections into one applicable over larger expanses of wetlands by using remotely sensed data (that is, continuous data). The FQIraster
ERDC/EL TN-20-1 September 2020
6
scheme emulates the FQImod (Cretini et al. 2011) by incorporating a two-pronged approach to account for vegetation quantity and quality. The FQIraster formula is as follows:
( )raster dFQI NDVI CC 10= × × (3)
where NDVI is a measure of vegetation biomass per sample unit (pixel), CCd is the CC of the dominant species per sample unit, and the 10 multiplier scales and standardizes the scores from 0 to 100. FQIraster are unitless values where low scores represent landscapes with low quantity and/or quality of wetland plants and higher values represent landscapes with high quantity and/or quality. The development and demonstration of this method utilized WorldView-2 satellite-derived NDVI (modified values range from 0 to 1) and dominant plant classification data.
Satellite imagery acquisition and processing. The FQIraster system developed and documented in this technical note used WorldView-2 satellite imagery collected on 15 October 2010. WorldView-2 is a commercial satellite that provides high spatial (1.84 m imagery), temporal (1–2 day sensor return), and spectral (8 spectral bands: coastal blue [400–450 nm], blue [450–510 nm], green [510–580 nm], yellow [585–625 nm], red [630–690 nm], red-edge [705–745 nm], and two bands in the near-infrared [NIR] portion of the light spectrum [770–895 nm and 860–1040 nm]) resolution imagery. These image attributes are useful for estimating short-term landscape variation linked to disturbance events or prevailing environmental conditions or both (Suir, Saltus, and Reif 2018). We acquired the WorldView-2 imagery using the DigitalGlobe Enhanced Viewer Web Hosting Service and preprocessed the images using ENVI 5.3, converting the original images’ digital number (DN) values to top-of-atmosphere spectral radiance (Carle 2013, 20). Finally, we converted radiance values to at-satellite reflectance (Updike and Comp 2010; Carle 2013, 20).
Normalized difference vegetation index. Since vegetation cover values represent quantity/biomass in the FQImod system, and since NDVI is a conventional raster-based measure of biomass, we chose NDVI data as the quantity component for the FQIraster. The NDVI has well-established correlations to photosynthetic activity and leaf area index (Carle 2013, 41); provides accurate estimates of plant biomass (An, Price, and Blair 2013, 3719; Klemas 2013, 1019; Steyer, Couvillion, and Barras 2013, 118; Suir and Sasser 2019a, 106); and performs better with landscape-scale measures than those measures using discrete, field-based collections (Bianchette et al. 2009; Suir and Sasser 2019b). Using the preprocessed WorldView-2 imagery, we performed NDVI assessments with NDVI data created using a variant of the standard equation (Rouse et al. 1974):
2NDVI2
NIR RedNIR Red
−=
+(4)
which uses a ratio between an NIR and red band to measure an ecosystem’s ability to capture solar energy and convert it to organic carbon or biomass (An, Price, and Blair 2013, 3717; Suir and Sasser 2019b). NDVI values range from -1.0 to 1.0, where values between -1.0 and 0.0 are typical of nonvegetation features (for example, water, cloud, and impervious surfaces) and where

ERDC/EL TN-20-1 September 2020
7
therefore excluded from the final NDVI data, while those between 0.0 and 1.0 are typical of vegetation (Al-Doski, Mansor, and Shafri, 2013, 4; Steyer, Couvillion, and Barras, 2013, 120). A higher NDVI value generally correlates to higher biomass, productivity, and vigor of the vegetation.
Classification methods. The traditional field-based FQI uses discrete vegetation surveys to identify and assign CC values based on the quality or biological integrity of the wetland plants. The classification and mapping of vegetation cover from remotely sensed data provides a viable alternative to these traditional field surveys. For this proof of concept, we used the WorldView-2 imagery collected on 15 October 2010 to classify dominant plant species, to which we applied the Louisiana-based CC values. For the multispectral imagery, we used the maximum likelihood classifier (MLC), a commonly used classifier due to its ease of implementation and wide availability in popular software packages. The MLC is a parametric classifier that relies on the statistical distributions of the reflectance values of the target classes as defined by the training (on-the-ground) data provided for each class (Carle 2013, 17). As Carle (2013) explains, “the maximum likelihood approach assumes that the reflectance values for each class in each band follows a Gaussian distribution, and so this approach calculates the probability that each pixel in the image belongs to each of the target classes” (17).
Each pixel is then assigned to the class with the highest probability, and unless a probability threshold is used to generate an “unclassified” class, all pixels in the image are classified as one of the target classes (Carle 2013, 17). For the FQIraster, the target classes consisted of the dominant vegetation in the study area, which we defined as any species accounting for more than 50% of the vegetation present within each sample unit (pixel). The RECLASS tool in ArcGIS 10.6.1 assigned CC values (range from 1 to 10; Cretini et al. 2011) to each pixel based on the dominant plant species. Since only the dominant vegetation is represented in the classified vegetation data, and since CC values of 0 would return FQIraster scores of 0 (per pixel), all invasive species were assigned CC values of 1. Finally, following Carle (2013, 84), we used dominant classes from 85 reference plots (stratified random sample) within the WLD in conjunction with a confusion matrix to evaluate the accuracy of the vegetation classification (figure 1).
FQIraster computation. For the actual FQIraster equation (3) computation, we used the RASTER CALCULATOR (ESRI ArcGIS Spatial Analyst) to multiply the NDVI raster by the CC raster then multiply that product by 10 to standardize the result (scaled from 0 to 100) according to previous FQI and other wetland assessment metrics (Cretini et al. 2018, 461).
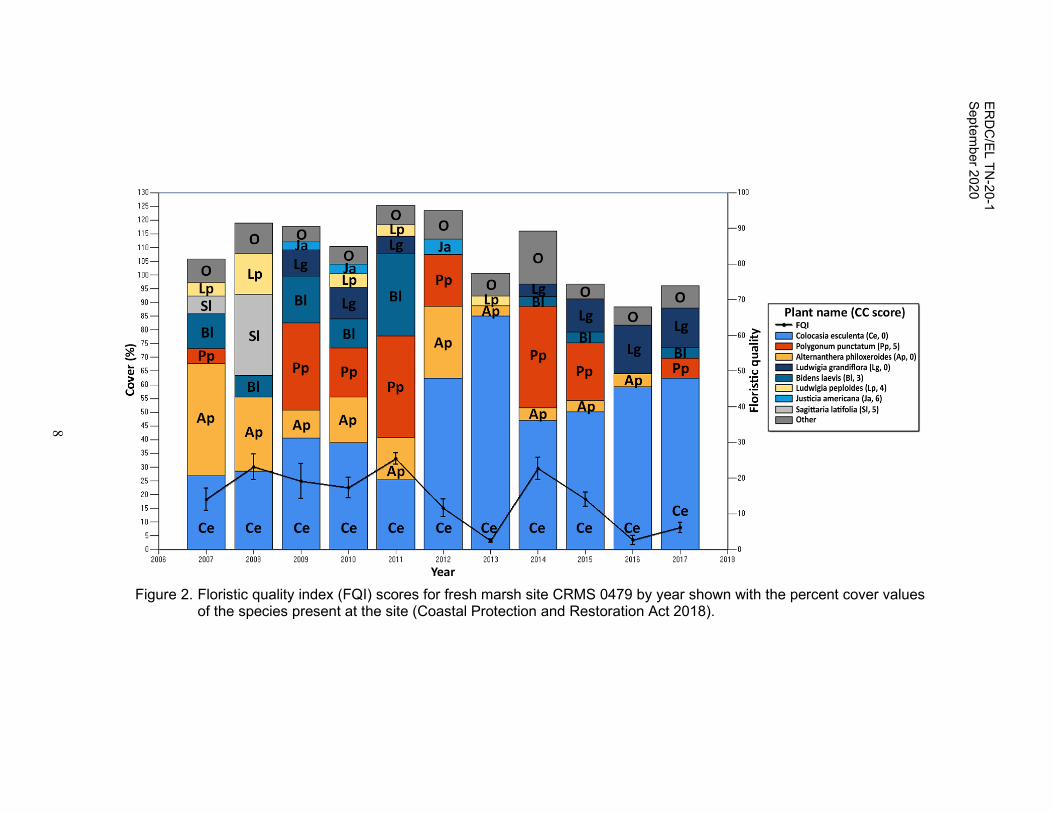
RESULTS AND DISCUSSION: Field-based floristic quality index. The overall FQImod scores at the CRMS 0479 site ranged from 25.4 in 2011 to 2.5 in 2013, with a general trend of degradation with time (figure 2). These values are low (compared to established and stable mainland wetlands) but are within the anticipated range for disturbed and/or early successional vegetation communities (Suir and Sasser 2017, 13).
ERD
C/EL TN
-20-1 Septem
ber 2020
8
Figure 2. Floristic quality index (FQI) scores for fresh marsh site CRMS 0479 by year shown with the percent cover values of the species present at the site (Coastal Protection and Restoration Act 2018).

ERDC/EL TN-20-1 September 2020
9
The CRMS August 2010 vegetation survey (table 2) identified fourteen plant species, which corresponds closely to the October 2010 WorldView-2 imagery and classification reference sites. The species percent cover ranged from 0.2% for Vigna luteola to 39.0% for Colocasia esculenta (table 2). The CC values for this survey ranged from 0 to 7, with three invasive species (CC = 0; C. esculenta, Alternanthera philoxerides, Ludwigia grandiflora), four disturbance species (CC = 1–3; Bidens laevis, Sesbania, Vigna luteola), six vigorous wetland species (CC = 4–6; Polygonum punctatum, Ludwigia peploides, Justicia americana, Sagittaria latifolia, Nelumbo lutea), and one common wetland species (CC = 7–8; Leersia lexandra) (table 2). The CRMS 0479 site returned an FQImod score of 17.3 in 2010 (minimum FQImod =14.5 and maximum FQImod = 20.1). Additionally, the FQImod scores for the two vegetation reference sites located on Camp Island were 29.0 and 2.3 for plots 79 (C. esculenta, 35%; Polygonum spp, 35%; B. laevis, 15%; and L. virginica, 10%) and 81 (C. esculenta, 75%; Salix nigra, 10%; and B. laevis, 1%), respectively.
Table 2. Vegetation cover (percentage) and CC values from CRMS August 2010 survey. Species Percent Cover CC Colocasia esculenta (L.) Schott 39.0 0 Polygonum punctatum Elliott 18.0 5 Alternanthera philoxeroides (Mart.) Griseb. 16.5 0 Ludwigia grandiflora (Michx.) Greuter & Burdet 11.5 0 Bidens laevis (L.) Britton, Sterns & Poggenb. 10.5 3 Ludwigia peploides (Kunth) P.H. Raven 5.0 4 Justicia americana (L.) Vahl 3.5 6 Sagittaria latifolia Willd. 1.7 5 Leersia lexandra Sw. 1.6 7 Sesbania Scop. 1.5 1 Sagittaria platyphylla (Engelm.) J.G. Sm. 0.5 5 Nelumbo lutea Willd. 0.5 6 Amarathus australis (A. Gray) Sauer 0.3 2 Vigna luteola (Jacq.) Benth. 0.2 3
Raster-based Classifications and Indices: Classification of plant species. We determined that thirteen freshwater marsh species from within the 85 reference plots were dominant plants/trees and therefore included in the classification. These include N. lutea (CC = 5), Zizaniopsis miliacea (5), C. esculenta (1), other submerged aquatic vegetation (SAV, 3), P. punctatum (5), Typha spp. (2), S. nigra (2), Phragmites australis (6), Potamogeton nodosus (2), Paspalum dissectum (5), Eichhornia crassipes (1), Bidens laevis (3), and Sagittaria spp. (5) (figure 3). However, some species (that is, B. laevis and Sagittaria spp.) were not present (or detected) within the Camp Island study area. Overall accuracy for the MLC vegetation classification was 71.7%, with a kappa value of 0.71. User’s and producer’s accuracies were high (≥ 70%) for S. nigra, C. esculenta, Typha spp., P. australis, P. punctatum, N. lutea, and other SAVs.
Comparing the MLC classification to the CRMS vegetation survey data shows some inconsistencies in observed plant species near the CRMS 0479 site. The CRMS data indicate C. esculenta largely dominated the 0479 site, though L. grandiflora, B. laevis, and A. philoxeroides dominated other CRMS sample stations. The MLC data show N. lutea dominated large expanses of wetlands around

10
ERDC/EL TN-20-1 September 2020
the 0479 site. CRMS field notes also specify that N. lutea occurred outside of multiple 0479 station sampling plot (2x2 m) boundaries.
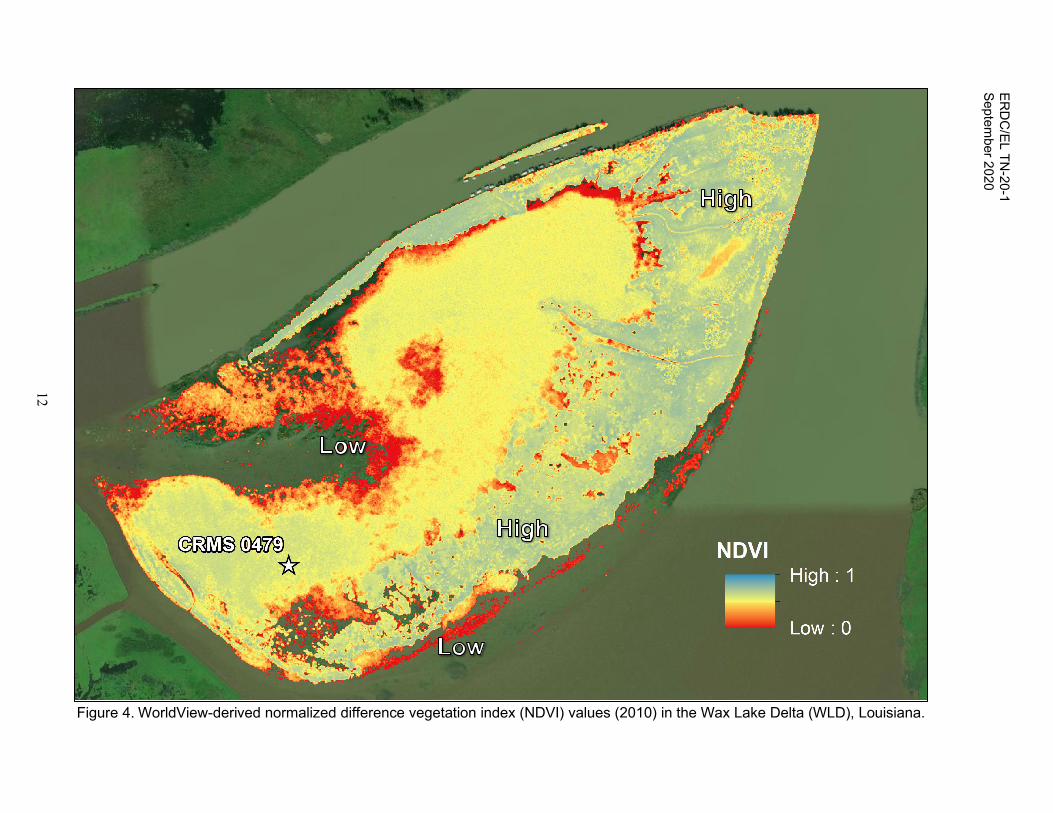
Normalized difference vegetation index. Figure 4 illustrates the spatial variability and patterns of WorldView-derived NDVI within the WLD Camp Island study area. On 15 October 2010, Camp Island had minimum, maximum, and mean NDVI of 0.00, 0.79, and 0.42±0.14, respectively (figure 4). Plant distribution and biomass (NDVI) on the island changed predictably with elevation, where higher biomass plants occurred at higher elevations (along the eastern and southern portions of the island), and lower biomass plants occurred at lower elevations (central and western portions of the island).

11
ERD
C/EL TN
-20-1 Septem
ber 2020 Figure 3. Maximum likelihood classification map.
12
ERD
C/EL TN
-20-1 Septem
ber 2020
Figure 4. WorldView-derived normalized difference vegetation index (NDVI) values (2010) in the Wax Lake Delta (WLD), Louisiana.

ERDC/EL TN-20-1 September 2020
13
Floristic quality index raster. Although structural components are useful for quantifying and comparing wetland characteristics, they lack quality measures necessary for more comprehensive assessments of wetland function and condition. Wetland plant quality is an essential metric, because it provides critical information related to habitats, effectiveness of restoration measures, resilience to disturbance events, and adaptive management needs and priorities (US Environmental Protection Agency 2002, 2). By combining the WorldView-derived vegetation quality (MLC and CC) and quantity (biomass estimates from NDVI) components, this method provides a raster-based, multimetric system for calculating FQI. Figure 5 illustrates the color-ramped FQIraster values from 2010 computed for Camp Island, where the regions with the highest FQIraster score (greens and blues, interior regions) are those with the highest biological integrity of wetland plant communities, and regions with the lowest FQIraster scores (orange and red, coastal regions) are those with the lowest biological integrity. Camp Island had minimum, maximum, and mean FQIraster values of 0.0, 36.8, and 19.1±9.4, respectively (figure 5). The mean FQIraster score of 19.1 was 1.8 higher than the CRMS-based traditional FQImod score of 17.3. This difference is potentially due to the FQImod score’s reliance on data from CRMS 0479 stations (which are located in a region of Camp Island that has low to moderate CC and cover values) and therefore underrepresents the quality and quantity of vegetation that exists across the island. The FQIraster scores at the vegetation reference plots were 26.8 and 5.4, underestimating the FQI score for plot 79 (-2.2) and overestimating the FQI score for plot 81 (+3.1). These differences are potentially due to the FQIraster method’s exclusive use of the dominant plant within each assessment unit (pixel), which therefore disregards understory plants or those with low abundance. However, the mean FQIraster score of 19.1 is similar to FQImod scores observed in another nearby early successional wetland landscape (Atchafalaya River Delta) (Suir and Sasser 2017). This FQIraster system thus provides a multimetric approach that advances previous FQI systems by using remotely sensed data to rapidly assess wetland health, resilience, and recovery at the landscape scale.

14
ERD
C/EL TN
-20-1 Septem
ber 2020
Figure 5. WorldView-derived FQIraster values (2010) for Camp Island, Louisiana.

ERDC/EL TN-20-1 September 2020
15
CONCLUSIONS: In situ data collections are typically labor intensive and provide detailed measurements over small areas. In contrast, the most commonly used remote sensing data acquisition methods provide synchronous measurement of broad areas, but they reduce potential for local detail (Kerr and Ostrovsky 2003, 299). However, recent advancements in sensors and techniques (that is, multimetric assessments) allow for improved estimates of ecological function and condition (Schaefer and Lamb 2016; Broussard, Suir, and Visser 2018; Suir 2018) based on remote sensing data. The method developed and documented in this proof of concept capitalized on the spatial and spectral attributes of high-resolution imagery to characterize and quantify the quality and quantity of vegetation within a wetland landscape. This method provides an initiatory system upon which future advancements in remote sensing for ecological function and condition assessments should be built. For instance, with increasing spatial, spectral, and temporal resolution data (that is, unmanned aircraft systems), the ability to better classify plant species and mixing, and incorporate additional metrics (for example, elevation), will further advance its utility. Ultimately, these raster-based FQI methods and data provide useful tools and information that will increase resource managers’ ability to monitor and quantify wetland resources, predict ecosystem conditions and response, and plan and execute management strategies.
ACKNOWLEDGEMENTS: This research was conducted under the US Army Corps of Engineers Ecosystem Management and Restoration Research Program, US Army Engineer Research and Development Center under the program leadership of Dr. Al Cofrancesco. Permission to publish this information was granted by the Chief of Engineers. The authors would like to thank Mr. Scott Bourne and Mr. Sam Jackson for review of the paper.
Portions of the introduction, overview, and method of this report have been modified and reprinted with permission from Glenn M. Suir and Charles E. Sasser. 2019. “Redistribution and Impacts of Nearshore Berm Sediments on the Chandeleur Barrier Islands, Louisiana.” Ocean and Coastal Management 168, (February): 103–116. https://doi.org/10.1016/j.ocecoaman.2018.10.029. Copyright 2018 Elsevier.
POINTS OF CONTACT: This technical note was written by Glenn M. Suir and Christina L. Saltus, Environmental Laboratory, US Army Engineer Research and Development Center. For additional information, contact Dr. Glenn M. Suir (225) 578-7417, [email protected], or the Program Manager of the Ecosystem Management and Restoration Research Program, Dr. Trudy Estes (601) 634-2125, [email protected].
This technical note should be cited as follows:
Suir, Glenn M., Melissa M. Carle, J. Mason Harris, Charles E. Sasser, and Christina L. Saltus. 2019. Raster-Based Floristic Quality Index: Proof of Concept. ERDC/EL TN-20-1. Vicksburg, MS: US Army Engineer Research and Development Center.

ERDC/EL TN-20-1 September 2020
16
REFERENCES: Al-Doski, Jwan, Shattri B. Mansor, and Helmi Zulhaidi Mohd Shafri. 2013. "NDVI Differencing and Post-Dlassification
to Detect Vegetation Changes in Halabja City, Iraq." IOSR Journal of Applied Geology and Geophysics 1, no. 2: 1–10.
An, Nan, Kevin P. Price, and John M. Blair. 2013. “Estimating Above-Ground Net Primary Productivity of the Tallgrass Prairie Ecosystem of the Central Great Plains Using AVHRR NDVI.” International Journal of Remote Sensing 34, no. 11 (February): 3717–3735.
Andreas, Barbara K., John J. Mack, and James S. McCormac. 2004. Floristic Quality Assessment Index (FQAI) for Vascular Plants and Mosses for the State of Ohio. Columbus, Ohio: Ohio Environmental Protection Agency.
Bianchette, Thomas, Kam-biu. Liu, Nina S.N. Lam, and Lawrence M. Kiage. 2009. “Ecological Impacts of Hurricane Ivan on the Gulf Coast of Alabama: A Remote Sensing Study.” Journal of Coastal Research, Special Issue No. 56. Proceedings of the 10th International Coastal Symposium ICS 2009, 2: 1622–1626.
Bourdaghs, Michael, Carol A. Johnston, and Ronald R. Regal. 2006. “Properties and Performance of the Floristic Quality Index in Great Lakes Coastal Wetlands.” Wetlands 26, no. 3: 718–735.
Broussard III, Whitney, Glenn M. Suir, and Jenneke M. Visser. 2018. Unmanned Aircraft Systems (UAS) and Satellite Imagery Collections in a Coastal Intermediate Marsh to Determine the Land-Water Interface, Vegetation Types, and Normalized Difference Vegetation Index (NDVI) Values. ERDC/TN WRAP-18-1. Vicksburg, MS: US Army Engineer Research and Development Center.
Carle, Melissa V. 2013. Spatial Structure and Dynamics of the Plant Communities in a Pro-Grading River Delta: Wax Lake Delta, Atchafalaya Bay, Louisiana. PhD Dissertation, Louisiana State University, Baton Rouge, Louisiana.
Carle, Melissa V., Charles E. Sasser, and Harry H. Roberts. 2015. “Accretion and Vegetation Community Change in the Wax Lake Delta Following the Historic 2011 Mississippi River flood.” Journal of Coasal. Research 31, no. 3: 569–587.
Chamberlain, Sarah J. and Hannah M. Ingram. 2012. “Developing Coefficients of Conservatism to Advance Floristic Quality Assessment in the Mid-Atlantic Region.” Journal of the Torrey Botanical Society 139, no. 4: 416–427.
Coastal Protection and Restoration Authority (CPRA) of Louisiana. 2018. Coastwide Reference Monitoring System–Wetlands Monitoring Data. Retrieved from Coastal Information Management System (CIMS) database. http://cims.coastal.louisiana.gov.
Cohen, Matthew J., Susan Carstenn, and Charles R. Lane. 2004. “Floristic Quality Indices for Biotic Assessment of Depressional Marsh Condition in Florida.” Ecological Applications 14, no. 3: 784–794.
Cretini, Kari F. and Gregory D. Steyer. 2011. Floristic Quality Index: An Assessment Tool for Restoration Projects and Monitoring Sites in Coastal Louisiana. Fact Sheet 2011-3044. Lafayette, LA: US Geological Survey. https://pubs.usgs.gov/fs/2011/3044/pdf/FS11-3044.pdf.
Cretini, Kari F., Jenneke M. Visser, Ken W. Krauss, and Gregory D. Steyer. 2011. CRMS Vegetation Analytical Team Framework—Methods for Collection, Development, and Use of Vegetation Response Variables. Open-File Report 2011-1097. Lafayette, LA: US Geological Survey https://doi.org/10.3133/ofr20111097.
Cretini, Kari F., Jenneke M. Visser, Ken W. Krauss, and Gregory D. Steyer. 2012. “Development and Use of a Floristic Quality Index for Coastal Louisiana Marshes.” Environmental Monitoring and Assessment 184, no. 4: 2389–2403.
Cretini, Kari F., William B. Wood, Jenneke M. Visser, Ken W. Krauss, Leigh A. Sharp, Gregory D. Steyer, Gary P. Shaffer, and Sarai C. Piazza. 2018. “Floristic Quality Index and Forested Floristic Quality Index: Assessment Tools for Restoration Projects and Monitoring Sites in Coastal Louisiana.” In Wetland and Stream Rapid Assessments, 459–473. Cambridge, MA: Academic Press. https://doi.org/10.1016/B978-0-12-805091-0.00049-9.
Fennessy, Siobhan, Mark Gernes, John Mack, and Denice H. Wardrop. 2002. Methods for Evaluating Wetland Condition: Using Vegetation to Assess Environmental Conditions in Wetlands. EPA 822-R-01-007j. Washington, DC: Environmental Protection Agency.
Gianopulos, Kristie. 2014. Coefficient of Conservatism Database Development for Wetland Plants Occurring in the Southeast United States. North Carolina Dept. of Environment & Natural Resources, Division of Water Resources: Wetlands Branch. Report to the EPA, Region 4.

ERDC/EL TN-20-1 September 2020
17
Johnson, W.B., Charles E. Sasser, and James G. Gosselink. 1985. “Succession of Vegetation in an Evolving River Delta, Atchafalaya Bay, Louisiana.” The Journal of Ecology 73: 973–986.
Kerr, Jeremy T. and Marsha Ostrovsky. 2003. “From Space to Species: Ecological Applications for Remote Sensing.” Trends in Ecology & Evolution 18, no. 6: 299–305.
Klemas, Victor. 2013. “Remote Sensing of Coastal Wetland Biomass: An Overview.” Journal of Coastal Research 29, no. 5: 1016–1028.
Little, Amanda. 2013. “Sampling and Analyzing Wetland Vegetation.” In Wetland Techniques, 273-324. Springer Netherlands.
Llewellyn, Daniel W. and Gary P. Shaffer. 1993. “Marsh Restoration in the Presence of Intense Herbivory: The Role of Justicia lanceolata (Chapm.) Small.” Wetlands 13, no. 3: 176–184.
Roberts, Harry H., Nan D. Walker, R. Cunningham, G. Paul Kemp, and Susan Majersky. 1997. “Evolution of Sedimentary Architecture and Surface Morphology: Atchafalaya and Wax Lake Deltas, Louisiana (1973–1994).” Gulf Coast Association of Geological Societies Transactions 47: 477–484.
Rouse, John W., R. H. Haas, John A. Schell, and Donald W. Deering. 1974. “Monitoring Vegetation Systems in the Great Plains with ERTS.” Paper presented at the proceedings, third earth resources technology Satellite-1 symposium. Washington, DC: Goddard Space Flight Center.
Schaefer, Michael T. and David W. Lamb. 2016. “A Combination of Plant NDVI and LiDAR Measurements Improve the Estimation of Pasture Biomass in Tall Fescue (Festuca arundinacea var. Fletcher).” Remote Sensing 8, no. 2: 109.
Shaffer, Gary P., Charles E. Sasser, James G. Gosselink, and Marcel Rejmanek. 1992. “Vegetation Dynamics in the Emerging Atchafalaya Delta, Louisiana, USA.” Journal of Ecology 80, no. 4: 677–687.
Steyer, G.D., C.E. Sasser, J.M. Visser, E.M. Swensen, J.A. Nyman, and R.C. Raynie. 2003. “A Proposed Coast-Wide Reference Monitoring System for Evaluating Wetland Restoration Trajectories in Louisiana.” Environmental Monitoring and Assessment 81: 107–117.
Steyer, G.D., B.R. Couvillion, and J.A. Barras. 2013. “Monitoring Vegetation Response to Episodic Disturbance Events by Using Multitemporal Vegetation Indices.” Journal of Coastal Research 63, sp1: 118–130.
Suir, Glenn M. Christina L. Saltus, and Molly Reif. 2018. Geospatial Assessments of Phragmites australis Die-Off in South Louisiana: Preliminary Findings. ERDC/EL TR-18-9. Vicksburg, MS: US Army Engineer Research and Development Center.
Suir, Glenn M. and Charles E. Sasser. 2017. Floristic Quality Index of Restored Wetlands in Coastal Louisiana. No. ERDC/EL TR-17-15. Vicksburg, MS: US Army Engineer Research and Development Center.
Suir, Glenn M. 2018. Sediment and Plant Dynamics in a Degrading Coastal Louisiana Landscape. LSU Doctoral Dissertations. 4504. https://digitalcommons.lsu.edu/gradschool_dissertations/4504.
Suir, Glenn M. and Charles E. Sasser. 2019a. “Redistribution and Impacts of Nearshore Berm Sediments on the Chandeleur Barrier Islands, Louisiana.” Journal of Ocean and Coastal Management 168: 103–116. https://dx.doi.org/10.1016/j.ocecoaman.2018.10.029.
Suir, Glenn M. and Charles E. Sasser. 2019b. “Use of NDVI and Landscape Metrics to Assess Effects of Riverine Inputs on Wetland Productivity and Stability.” Wetlands 39 (April): 815–830. https://doi.org/10.1007 /s13157-019-01132-3.
Swink, Floyd and Gerould S. Wilhelm. 1979. Plants of the Chicago Region. Lisle, IL: The Morton Arboretum.
Tucker, Compton J., J.R.G. Townshend, and Thomas E. Goff. 1985. “African Land-Cover Classification Using Satellite Data.” Science 227, no. 4685: 369–375.
Updike, Todd and Chris Comp. 2010. Radiometric Use of WorldView-2 Imagery. Technical Note, Longmont, Colorado, pp. 1-17.
US Environmental Protection Agency (USEPA). 2002. Methods for Evaluating Wetland Condition: Using Vegetation to Assess Environmental Conditions in Wetlands. EPA-822-R-02-020. Washington, DC: US Environmental Protection Agency, Office of Water.
ERDC/EL TN-20-1 September 2020
18
Wang, Hongqing, Sarai C. Piazza, Leigh A. Sharp, Camille L. Stagg, Brady R. Couvillion, Gregory D. Steyer, and Thomas E. McGinnis. 2017. “Determining the Spatial Variability of Wetland Soil Bulk Density, Organic Matter, and the Conversion Factor between Organic Matter and Organic Carbon Across Coastal Louisiana, U.S.A.” Journal of Coastal Research 33, no. 3: 507–517.
NOTE: The contents of this technical note are not to be used for advertising, publication, or promotional purposes. Citation of trade names does not constitute an official endorsement or approval of the use of such products.