raspberry pi driven flow-injection system for
TRANSCRIPT
Raspberry Pi Driven Flow-Injection System forElectrochemical Continuous Monitoring Platforms
Bruno Donato∗†‡, Francesca Stradolini∗†, Abuduwaili Tuoheti§, Federico Angiolini†,Danilo Demarchi§, Giovanni De Micheli† and Sandro Carrara†
†Laboratory of Integrated Systems, Swiss Federal Institute of Technology - Lausanne (EPFL), Switzerland‡ Department of Information Engineering, Electronics and Telecommunications, Sapienza University of Rome, Italy
§ Department of Electronics and Telecommunications, Politecnico di Torino, Italy∗ Corresponding author: [email protected], [email protected]
Abstract—The degree of interest in bio-sensing platformsbrings to the forefront a corresponding need for effective testingof their capabilities. This necessity is even more crucial whenexamining the properties of a sensor for continuous monitoringof a concentration trend in time, before in vivo implementations.Moreover, in the framework of personalised medical practices,it is imperative to introduce a robust way to represent andparametrise the highly variable responses of human metabolism.The aim of this paper is to propose a novel solution for the designof an automatic flow-injection environment that can assess theperformance of systems for continuous monitoring. The setupis also approved for successfully reproducing a paracetamolconcentration trend in buffer solution.
I. INTRODUCTION
Up to now, the concept of continuous monitoring has beenwidely exploited in different medical applications for keepingunder control endogenous [1], [2] and exogenous [3], [4]compound concentrations in patients’ fluids. The need for drugmonitoring services is widespread, especially in the context ofpersonalised medicine to ensure the efficacy and the safety of aparticular drug administration to a patient [5]. This holds par-ticularly true for difficult-to-handle drugs, such as anaesthetics.Indeed, anaesthesia induction and maintenance rely on a rightbalance of three main compounds (anaesthetic, analgesic andmuscle relaxant) to be injected in the patient’s veins [6]. Insimilar practices, to provide the patient with the optimum drugdosage, it is fundamental to know the dissolution behaviour ofthe drug itself after it is administered [7]. This is known asthe drug Pharmaco-Kinetic (PK) model, that reproduces theabsorption, distribution, metabolism and excretion of the drug[8]. Electrochemical sensors are considered as a suitable tech-nology to keep under control the drug concentration variationsin the patient’s fluid. They enable on-line drug monitoringsince they do not need any electrode surface renewal whilemeasuring and their selectivity can be assessed by adoptingsuitable sensing material so that they are adaptable for severaldifferent applications [9]. For applications such as anaesthesia,in which the system depends on estimations made on humanbody metabolic responses [10], it is very difficult to find anexperimental procedure to test sensor performance. To repro-duce the drug trend after administration, dissolution tests of thepharmaceutical dosages are required. These experiments areextremely laborious, if not automated since a large number ofsamples are needed. Therefore, automated dissolution systemsare desirable to save time, to improve analytical reproducibilityin sensor validation [7]. Various approaches have been pro-posed to assess automatic testing procedure [11], [12], [13].Nevertheless, these dissolution set-ups do not reproduce theentire PK profile of the drug over a prolonged period of time[7]. To this aim, in this paper we want to present the design, the
realisation and the validation of a flow-injection system able toreproduce in a given base-volume of analysed solution a drugconcentration time-trend. The dilution process to reproducePK trend of a drug is handled by a Raspberry Pi electronicboard that strikes an injection pump charged with the drug. Theconcentration level to reach is evaluated by a PK mathematicalmodel implemented in Matlab. The system has been validatedempirically by using a dye and experimentally by sensingpH variations and by reproducing a paracetamol trend. Wehave chosen paracetamol to demonstrate the possibility toadopt the system in testing anaesthesia monitoring systems.Indeed, paracetamol is an analgesic and can be considered asa benchmark anaesthesia compound.
II. MATERIALS AND METHODS
A. Chemicals and Instrumentation
Green food dye from Deco ReliefTMwas used to em-pirically evaluate the dissolution system performances. Forthe analytical validation, hydrochloric acid (HCl) 0.01 Mand Paracetamol (APAP) are provided by Sigma-AldrichTM.APAP stock solution 30 mM was prepared by dissolving 15mg of powder in 3 ml Phosphate Buffer Saline (PBS) (pH:7.4, 10 mM). To realise and test the system we adopted:(i)GilsonTMMinipuls 3 peristaltic pump, (ii) Braintree ScientificInc.TMNE-1000 Programmable Single Syringe Pump [14], (iii)VWR and Stuart CB161 stirrers, (iv) VWR pH 1000 LpHenomenalTMpH meter, (v) Raspberry Pi (RPi) 3 Model Brunning Raspbian Jessie 4.4, (vi) Metrohm AutolabTMPGSTAT101. Further we used: DuranTM1 mL volumetric flask class A,1 mL and 0.5 mL plastic syringes (⊘ 4.699 mm for colorantand pH), TygonTMLMT-55 peristaltic pump tubing (⊘ 0.38mm) for APAP and pH tests, PVC tubing (⊘ 1 mm) for dye,PTFE (AWG) inner ⊘ 0.41 mm tubing connected with thesyringe needle. DropsensTMDS 110 Screen-Printed Electrodes(SPEs) are adopted as electrochemical cell for APAP detection.They host on their surface a carbon Working (⊘ 4 mm), a silverReference and a carbon Counter Electrode.As softwares we used: (i) Qt Creator 3.2 with Qt 5.3 librariesfor the TCP/IP server and syringe pump serial communicationapplication on RPi, (ii) MatlabTMfor injection control anddose computation, (iii) MicrosoftTMExcel for data analysis, (iv)Metrohm AutolabTMNOVA 10.1 for electrochemical measure-ments. Cyclic Voltammetry (CV) measurements were run forAPAP sensing with a NOVA procedure applying voltages from-0.1 V to 1.1 V with 0.1 V/s scan-rate.
B. Calibration Procedure
Before starting any test session a procedure to calibratethe flow inside the specific peristaltic tubing adopted was run.
brought to you by COREView metadata, citation and similar papers at core.ac.uk
provided by Infoscience - École polytechnique fédérale de Lausanne

Fig. 1. Sketch of the flow-injection system: (from left to right) the RPiconnected to the syringe pump, a PC running Matlab, the beaker containingthe base-volume placed on the magnetic stirrer, and the peristaltic pump.
This allows us to establish the relation between pump rotorspeed (Revolutions Per Minute - RPM) and tubing flow rate(mL/min). The calibration consists in setting the pump speedat different values and measuring the time for filling up agiven volume (e.g. 1 mL). A dedicated Excel workbook wasrealised to insert timings and pump speeds so that the flow rate(mL/min) corresponding to each pair of values is automaticallycalculated. Further, calibration lines are evaluated by simplelinear regression of the flow rates. Indeed, the speed-flowrelation is linear [15].
III. SYSTEM CONFIGURATION
The configuration of the flow-injection system is shown inFig. 1. We can consider its structure as divided in two mainparts with respect to their functionality: the part including thesyringe that is dedicated to increasing the drug concentrationand the other part consisting of the peristaltic pump fordecreasing it. The syringe pump is programmed to push theplunger of the syringe filled with the administered drug bymeans of a moving plate. The peristaltic pump withdraws thesolution from the base-volume beaker and fills it with theneutral solution. The In/Out flows of the base-volume beakerare calibrated to maintain its volume constant. These twosystem sections are running in parallel in a synchronised wayto reproduce the drug concentration trend in the base-volume.In other words, while the peristaltic pump continuously dilutesthe base-volume with a neutral solution, the syringe pumpinjects the right amount of the drug to achieve the targetconcentration level. The peristaltic pump is calibrated andset at a fixed constant flow rate before starting each test.The RPi is the central unit of the system that connects thetwo parts making them interact. Indeed, the syringe pump isphysically connected to the RPi through a USB port. TheRPi communicates with Matlab, running on the PC, whichcalculates the subsequent injection doses relative to the previ-ous concentration and the drug trend to reproduce. Finally,the RPi sends the evaluated injection value to the syringepump. As soon as the syringe pump receives a command, anacknowledgement message is sent.
A. Raspberry Pi Integration
RPi is adopted as link between the Matlab script and the sy-ringe pump. Indeed, we wanted to exploit its main advantages
Fig. 2. Example of the injection dose calculation (injected amounts) appliedto a sample target concentration trend (target concentration). The dilutionprevision is determined considering a flow rate of 1 mL/min in a 1 mL base-volume. Differences among the plots exaggerated for readability.
of portability, low-cost, and variety of configurable interfaces,among which USB ports and a Wi-Fi module. A light consoleapplication to handle the TCP/IP and serial communications isdeveloped with the Qt Creator libraries. Thanks to this, data aresent to the RPi from Matlab, through WLAN, and transformedinto serial commands for the pump. Moreover, due to its smalldimensions we can use the RPi-based system also in restrictedspace by controlling it remotely. This is useful when toxicdrug, e.g. anaesthetics, are involved since tests are performedin restricted and controlled environment.Final aim of our project is to move the driving intelligence ofthe system into the RPi and remove the need for the PC toenhance and guarantee the system portability.
B. Communication Protocols
Two communication protocols are adopted: one to senddata from PC to the RPi, and the other to send commandsfrom the RPi to the syringe pump. The first relies on TCP/IPsince the RPi application uses the Wi-Fi module to create aWLAN that the PC can access as client. The second is RS-232between RPi USB port and the syringe pump RJ-11 socket.The physical connection is realised using a custom adaptor.
C. Syringe Pump Configuration
The NE-1000 syringe pump works both in a manual orprogrammed mode through serial communication. Main set-up parameters to be configured are: pumping rate, targetvolume, and syringe diameter. From these parameters, thepump automatically evaluates the injection time and regulatesthe plunger speed accordingly. The pump can be programmedto withdraw and inject liquids in different pumping phases.Each phase can be characterised by a different pumping rate ortarget volume. Through RPi we set the pump to perform directinjection every time it receives a new injection command.The injection is carried out by pushing uniformly the syringeplunger that injects constantly an amount of drug to reproducea linear increase of drug concentration trend.
D. Injection Dose Calculation
To calculate the right injection values for reproducing aconcentration time-trend we need to consider the continuousdilution of the base-volume, executed by peristaltic flow at aconstant and fixed speed. The relation between dilution andflow is expressed by (1) that determines how an initial con-centration [Ci] in a volume V decreases in time (tfi = tf−ti),while diluting with a flow rate Q [16].
[Cf ] =[Ci]
eQ·(tf−ti)
V
(1)
where [Cf ] is the final concentration.
We can simplify (1) by expressing[Cf ][Ci]
as a unique coefficient
δ(tfi). If we consider a continuous dilution tfi becomes anintermediate time tm between two consecutive measurements(tn+1 − tn). Therefore, the needed subsequent dose to repro-duce the target time-trend of the drug concentration ([Ct]) iscalculated from (2) before every injection.
[Cdose] =
{
[Ct]− ([Cn] · δ(tm)), [Ct] ≥ [Cn] · δ(tm)0, [Ct] < [Cn] · δ(tm)
(2)
where [Cn] is the concentration at t = tn, tm = tn+1 − tn,and [Cdose] is the required concentration to be injected.Fig. 2 shows the concept of injection evaluation implementedin Matlab. The blue dotted line (target concentration) refers tothe time-trend to reproduce, while the green line (obtained con-centration) keeps track of the actual concentration in the base-volume. Considering the difference ∆C between the dilutedprevision of current concentration and target concentration, thenew dose is evaluated and injected at the time tn. Indeed, thedose ([Cdose] in (2)) calculation relies on the dynamic dilutioncontinuously performed by the peristaltic pump. The algorithmpredicts the drug concentration at the time tn+1 if no furtherdrug is injected, red dashed line in Fig. 2 (dilution prevision).The black squares in the figure (injected amounts) show all theconcentration values to be administered. Before sending theseamounts to the syringe pump, a previous conversion in volumeunit is needed. This conversion depends on the concentrationof the drug stock solution. The converted values are sent tothe RPi that notifies the pump. The pump continuously infuseseach volume in a time tm to ensure a smooth time-trend.
IV. RESULTS AND DISCUSSION
We scheduled three different tests for system validation.Firstly, we empirically tested the dilution ability of the system.Secondly, we challenged the system with a fast rising concen-tration followed by a decreasing of the concentration until asteady-state phase. Finally, we used the system to reproduce anincreasing and decreasing trend for a real drug administration,the analgesic APAP.
A. Test Results
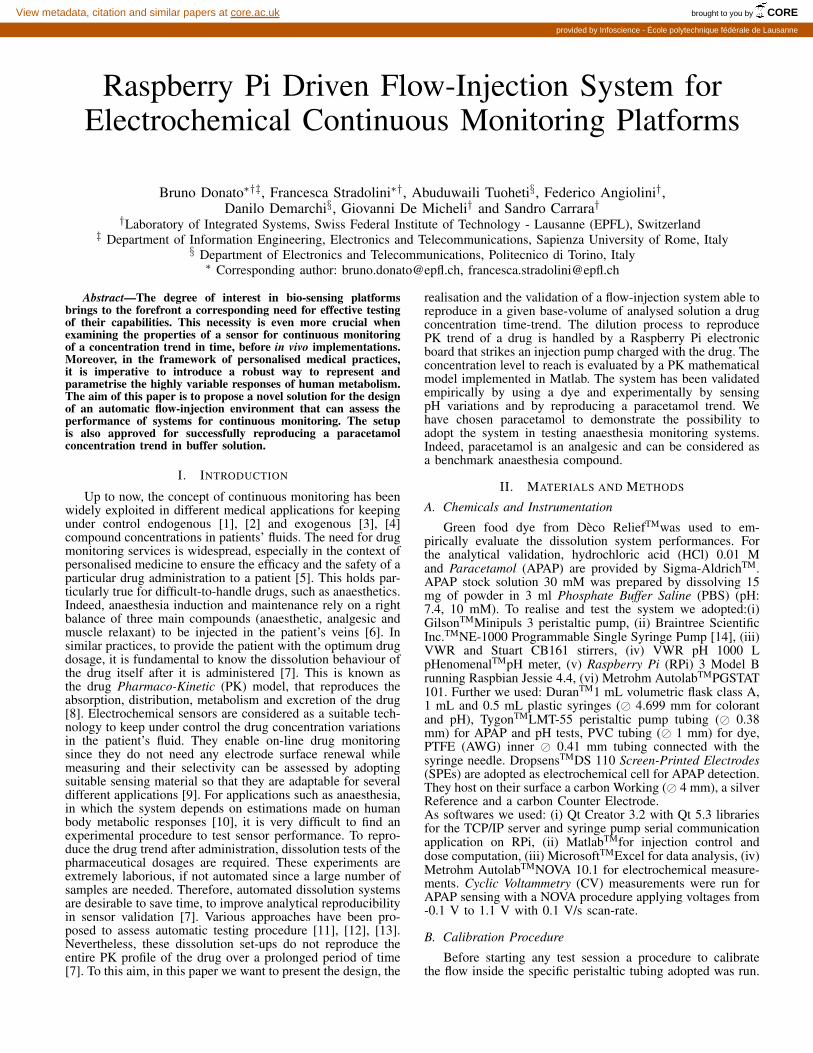
1) Dye Test: For the first test we injected green food dyein water as neutral solution. We programmed a set of dyeinjections in a 1 mL base-volume, with a peristaltic flow rateof 1 mL/min. The dosage was scheduled to linearly increase intime the concentration in the base-volume and then decreaseit exponentially while diluting. The test was performed understirring condition (level 9 of the CB161 stirrer). The visualresults of the test are shown in Fig. 3. With this test we wereable to see in the colour tone change how the system canreproduce a linear increase and an exponential decrease inconcentration.
t = 1 min t = 2 min t = 3 min t = 4 min
t = 5 min t = 6 min t = 7 min t = 8 min t = 9 min
t = 0 min
Vcol= 2uLVcol= 0L Vcol= 4uL Vcol= 8uL Vcol= 10uL
Vcol= ~2uL Vcol= ~0.5uL Vcol= ~0.1uL Vcol= ~0.01uL Vcol= ~0.004uL
Fig. 3. Dye test: Vcol is the dye volume in the base-volume beaker. In theupper part these values are the dye injections.
0
0,1
0,2
0,3
0,4
0,5
0,6
0,7
0,8
0,9
1
0 2 4 6 8 10 12 14
[H+](m
M)
Time(min)
10 µL, 4.5
24 µL, 4
95 µL, 3.5
640 µL, 3injected HCl
pH
[H+] = 10 - pH
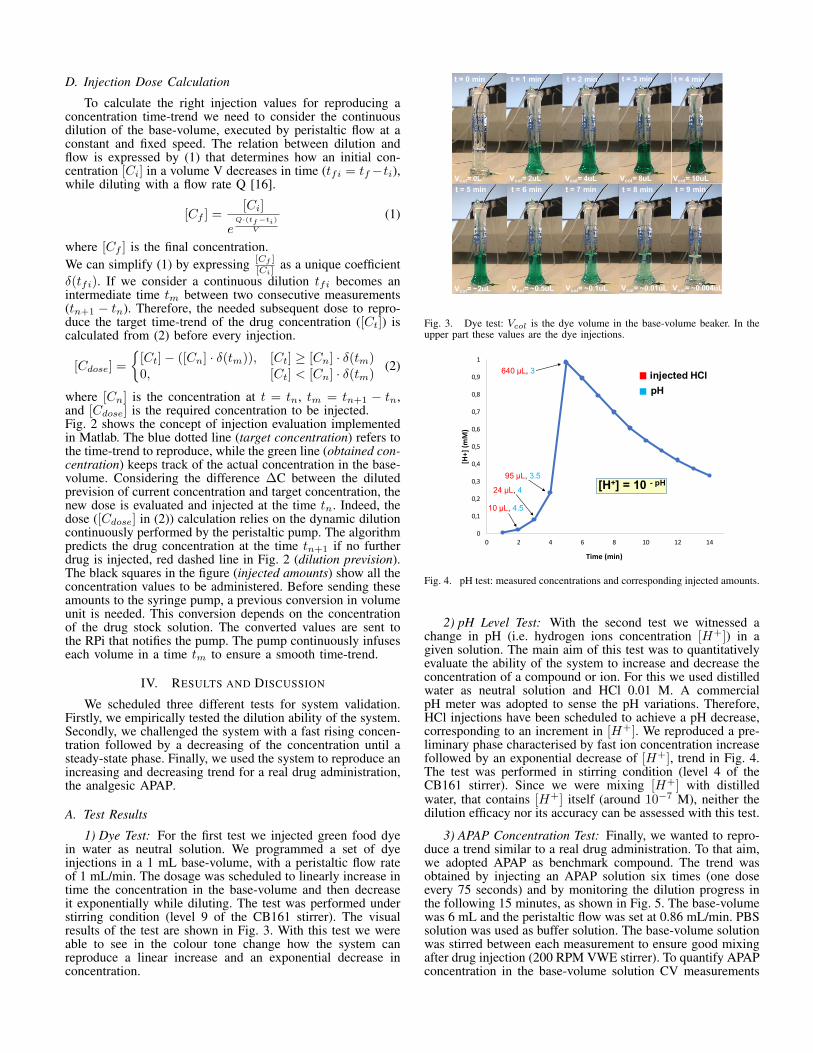
Fig. 4. pH test: measured concentrations and corresponding injected amounts.
2) pH Level Test: With the second test we witnessed achange in pH (i.e. hydrogen ions concentration [H+]) in agiven solution. The main aim of this test was to quantitativelyevaluate the ability of the system to increase and decrease theconcentration of a compound or ion. For this we used distilledwater as neutral solution and HCl 0.01 M. A commercialpH meter was adopted to sense the pH variations. Therefore,HCl injections have been scheduled to achieve a pH decrease,corresponding to an increment in [H+]. We reproduced a pre-liminary phase characterised by fast ion concentration increasefollowed by an exponential decrease of [H+], trend in Fig. 4.The test was performed in stirring condition (level 4 of theCB161 stirrer). Since we were mixing [H+] with distilledwater, that contains [H+] itself (around 10−7 M), neither thedilution efficacy nor its accuracy can be assessed with this test.
3) APAP Concentration Test: Finally, we wanted to repro-duce a trend similar to a real drug administration. To that aim,we adopted APAP as benchmark compound. The trend wasobtained by injecting an APAP solution six times (one doseevery 75 seconds) and by monitoring the dilution progress inthe following 15 minutes, as shown in Fig. 5. The base-volumewas 6 mL and the peristaltic flow was set at 0.86 mL/min. PBSsolution was used as buffer solution. The base-volume solutionwas stirred between each measurement to ensure good mixingafter drug injection (200 RPM VWE stirrer). To quantify APAPconcentration in the base-volume solution CV measurements

Fig. 5. APAP test: in the graph the sensed concentration for each measurementin time (green line), the evaluation in % of the variation between measuredand expected concentrations (blue line) and the injected doses (red crosses).In detail the CV oxidation peaks for the dilution.
were performed.Since APAP is directly measurable by CV technique, it waspossible to identify the main trade-offs of the realised system.These are: (i) the dimension of the base-volume with respectto the syringe injection speed (evaluated from syringe dimen-sions), (ii) the constant speed of the peristaltic flow, (iii) thestirring condition needed to obtain a well-mixed solution.
V. CONCLUSIONS
The implementation and validation of a flow-injectionsystem has been reported. The main aim of our system is tobe adopted to facilitate and automate in-vitro testing of con-tinuous monitoring systems for medical applications. Indeed,the administration of an effective drug dosage can be assessedonly by applying a continuous monitoring system able to keepunder control the concentration level of the drug in the patient.The characterisation of these monitoring devices is performedstarting from in vitro experiments that are extremely laboriousand time-consuming. In this context, our system wants to offera faster and more reproducible way to test sensing platforms,e.g. electrochemical sensors.The performance of the system has been verified by performingdifferent tests. In this way it was possible to identify as maintrade-offs of the system: (i) the dimension of the base-volumewith respect to the syringe injection speed (evaluated fromsyringe dimensions), (ii) the constant speed of the peristalticflow, and (iii) the importance of a stirring action in obtaininga well-mixed solution to sense. With the parameters we haveset, we succeeded in reproducing the increasing and decreasingtrend of a drug. The trend we obtained is similar to the humanmetabolic response when drugs are administered, e.g. duringanaesthesia induction. Overall, the system is potentially ableto reproduce any concentration trend within its intrinsic limits(e.g. tubing dimensions, base-volume, and injection syringevolume) depending on the chosen parameters. Further, thesystem can be applied not only to a base-volume containedin a beaker, but also to whatever fluidic unit containing thesensors platforms. Further improvement of the system may
be obtained connecting a programmable peristaltic pump tothe system. In this way, it could be possible to interrupt thedilution flow whenever static conditions are required for themeasurement.Future work will be the complete integration of this flowinjection system within a feedback-loop system for anaesthesiamonitoring [17].
ACKNOWLEDGMENTS
The authors thank A. Simalatsar and T. Kilic for helpingin conceiving the system configuration, and I. Tzouvadaki forher writing tips. This work was supported by the CoMofAproject (#325230 157139), with grant from the Swiss NationalScience Foundation.
REFERENCES
[1] S. Anastasova, B. Crewther, P. Bembnowicz, V. Curto, H. M. Ip,B. Rosa, and G.-Z. Yang, “A wearable multisensing patch for continuoussweat monitoring,” Biosensors and Bioelectronics, vol. 93, pp. 139–145,2017.
[2] D. C. Klonoff, “Continuous glucose monitoring,” Diabetes care, vol. 28,no. 5, pp. 1231–1239, 2005.
[3] S. Carrara, A. Cavallini, V. Erokhin, and G. De Micheli, “Multi-paneldrugs detection in human serum for personalized therapy,” Biosensorsand Bioelectronics, vol. 26, no. 9, pp. 3914–3919, 2011.
[4] J. Wang, “Amperometric biosensors for clinical and therapeutic drugmonitoring: a review,” Journal of pharmaceutical and biomedicalanalysis, vol. 19, no. 1, pp. 47–53, 1999.
[5] A. S. Gross, “Best practice in therapeutic drug monitoring,” Britishjournal of clinical pharmacology, vol. 46, no. 2, pp. 95–99, 1998.
[6] F. Stradolini, T. Elboshra, A. Biscontini, G. De Micheli, and S. Carrara,“Simultaneous monitoring of anesthetics and therapeutic compoundswith a portable multichannel potentiostat,” in Circuits and Systems(ISCAS), 2016 IEEE International Symposium on. IEEE, 2016, pp.834–837.
[7] B. Li, Z. Zhang, and W. Liu, “Flow-injection system for automated dis-solution testing of isoniazid tablets with chemiluminescence detection,”Talanta, vol. 54, no. 4, pp. 697–702, 2001.
[8] L. Z. Benet, D. Kroetz, L. Sheiner, J. Hardman, and L. Limbird,“Pharmacokinetics: the dynamics of drug absorption, distribution,metabolism, and elimination,” Goodman and Gilman’s the pharmaco-logical basis of therapeutics, pp. 3–27, 1996.
[9] U. Yogeswaran and S.-M. Chen, “A review on the electrochemicalsensors and biosensors composed of nanowires as sensing material,”Sensors, vol. 8, no. 1, pp. 290–313, 2008.
[10] A. Simalatsar, M. Guidi, and T. Buclin, “Cascaded pid controller foranaesthesia delivery,” in Engineering in Medicine and Biology Society(EMBC), 2016 IEEE 38th Annual International Conference of the.IEEE, 2016, pp. 533–536.
[11] F. Ortega, E. Dominguez, G. Jonsson-Pettersson, and L. Gorton, “Am-perometric biosensor for the determination of phenolic compoundsusing a tyrosinase graphite electrode in a flow injection system,” Journalof biotechnology, vol. 31, no. 3, pp. 289–300, 1993.
[12] X.-Z. Liu and Z.-L. Fang, “Sequential-injection system for drug-dissolution studies of ibuprofen tablets and sustained-release formu-lations,” Analytica chimica acta, vol. 358, no. 2, pp. 103–110, 1998.
[13] N. Wangfuengkanagul and O. Chailapakul, “Electrochemical analysis ofacetaminophen using a boron-doped diamond thin film electrode appliedto flow injection system,” Journal of pharmaceutical and biomedicalanalysis, vol. 28, no. 5, pp. 841–847, 2002.
[14] B. S. Inc.TM, BS-8000/9000 Multi-Phaser Programmable Syringe PumpManual.
[15] GilsonTM, Minipuls 3 Peristaltic Pump User’s Guide.
[16] E. W. Finucane, Definitions, Conversions, and Calculations for Occu-pational Safety and Health Professionals, Third Edition. CRC Press,2017.
[17] F. Stradolini, A. Tuoheti, P. Motto Ros, D. Demarchi, and S. Carrara,“Raspberry pi based system for portable and simultaneous monitoringof anesthetics and therapeutic compounds,” IEEE NGCAS, 2017.